 Wenkun Zhuo1†
 Zheng Lian
94% of researchers rate our articles as excellent or good
Learn more about the work of our research integrity team to safeguard the quality of each article we publish.
Find out more
ORIGINAL RESEARCH article
Front. Mol. Biosci., 29 March 2023
Sec. Molecular Diagnostics and Therapeutics
Volume 10 - 2023 | https://doi.org/10.3389/fmolb.2023.1164349
This article is part of the Research TopicArtificial Intelligence and Drug DiscoveryView all 13 articles
Background: The dipeptide-alkylated nitrogen-mustard compound is a new kind of nitrogen-mustard derivative with a strong anti-tumor activity, which can be used as a potential anti-osteosarcoma chemotherapy drug.
Objective: 2D- and 3D-QSAR (structure–activity relationship quantification) models were established to predict the anti-tumor activity of dipeptide-alkylated nitrogen-mustard compounds.
Method: In this study, a linear model was established using a heuristic method (HM) and a non-linear model was established using the gene expression programming (GEP) algorithm, but there were more limitations in the 2D model, so a 3D-QSAR model was introduced and established through the CoMSIA method. Finally, a series of new dipeptide-alkylated nitrogen-mustard compounds were redesigned using the 3D-QSAR model; docking experiments were carried out on several compounds with the highest activity against tumors.
Result: The 2D- and 3D-QSAR models obtained in this experiment were satisfactory. A linear model with six descriptors was obtained in this experiment using the HM through CODESSA software, where the descriptor “Min electroph react index for a C atom” has the greatest effect on the compound activity; a reliable non-linear model was obtained using the GEP algorithm model (the best model was generated in the 89th generation cycle, with a correlation coefficient of 0.95 and 0.87 for the training and test set, respectively, and a mean error of 0.02 and 0.06, respectively). Finally, 200 new compounds were designed by combining the contour plots of the CoMSIA model with each other, together with the descriptors in the 2D-QSAR, among which compound I1.10 had a high anti-tumor and docking ability.
Conclusion: Through the model established in this study, the factors influencing the anti-tumor activity of dipeptide-alkylated nitrogen-thaliana compounds were revealed, providing direction and guidance for the further design of efficient chemotherapy drugs against osteosarcoma.
Osteosarcoma originates from mesenchymal tissues and is characterized by osteoid matrixes produced by spindle tumor cells, which usually occurs in the epiphysis of the distal femur, proximal tibia, and proximal humerus, with pains, swelling, and local mass as the main symptoms. Pathological fractures are occasionally seen, meanwhile X-ray manifestations coexist with osteogenic and lytic lesions in the epiphysis of the affected diaphysis (Wittig et al., 2002). Before the 1970s, osteosarcoma was treated with amputation, but its 5-year survival rate was only 15%–20% (Marcove et al., 1970a; Marcove et al., 1970b). With the introduction of adjuvant chemotherapy in 1978, the disease-free survival rate of patients with primary osteosarcoma at the extremities has improved to 66%–75% (Bacci et al., 1998; Bacci et al., 2006). With further advances in chemotherapies, surgical techniques, and radiological staging, 90%–95% of patients with osteosarcoma can now receive limb salvage surgery and a functional reconstruction. The long-term survival rate and cure rate of local patients with tumors have reached 60%–80% (Wittig et al., 2002).
At present, first-line chemotherapy drugs against osteosarcoma mainly include methotrexate (MTX), Adriamycin (ADM), cisplatin (DDP), and ifosfamide (IFO) (Ferrari et al., 2014), which may play an important role in the treatment of osteosarcoma if combined in different ways. However, we should not ignore the side effects of these chemotherapy drugs, such as liver and kidney failure, severe gastrointestinal reactions, and bone marrow suppression (Becher et al., 1980; Allen, 1992; Tanihata et al., 2004). At the same time, the long-term use of a single chemotherapeutic agent may lead to drug resistance for tumor cells, which can ultimately be very harmful to patients with osteosarcoma (Lilienthal and Herold, 2020). Being disappointing in the past few decades, drug toxicity or drug resistance in chemotherapies for osteosarcoma recurrence and metastasis-related molecular mechanisms is not clear, e.g., the osteosarcoma chemotherapeutic progress has been stalled. Therefore, in order to further improve the cure rate of osteosarcoma, it is necessary to develop a less toxic and more effective chemotherapy drug against it.
The mechanism of nitrogen-mustard anti-tumor drugs is that they can form electron-deficient dimethylimine ions in the body and then covalently combine with electron-rich groups in biological macromolecules (such as DNA and RNA). Finally, nitrogen-mustard compounds destroy tumor-target DNA fragments, thus achieving the goal of eliminating tumor cells. (Liu et al., 2008). At the same time, nitrogen-mustard compounds have advantages, including simple synthesis and low cost, which have broad prospects in the clinical use of malignant tumor drugs
In recent years, a dipeptide-alkylated nitrogen-mustard compound has been found with a high anti-tumor activity, which brings new hope for the design of chemotherapy drugs against osteosarcoma (Chen et al., 2018; Singh et al., 2018).
In order to evaluate and design the activity of novel drugs more effectively and quickly, computer-aided experiment methods have been widely used. The structure–activity relationship quantification (QSAR) is an excellent experimental method for computer-aided drug design, through which the mathematical relationship between the chemical structure of a series of compounds and their pharmacological activity or other properties can be found in a quantitative way (Roy et al., 2015; Dearden, 2017).
In this study, we hope to establish a satisfactory prediction model of the anti-osteosarcoma activity of nitrogen-mustard compounds by using the QSAR method. This model can design chemotherapy drugs for osteosarcoma in the future.
In this experiment, all the 22 alkylated dipeptide nitrogen-mustard derivatives are from the study by Gullbo et al. (2003). The structure and bioactivity value of the 22 compounds are shown in Table 1.
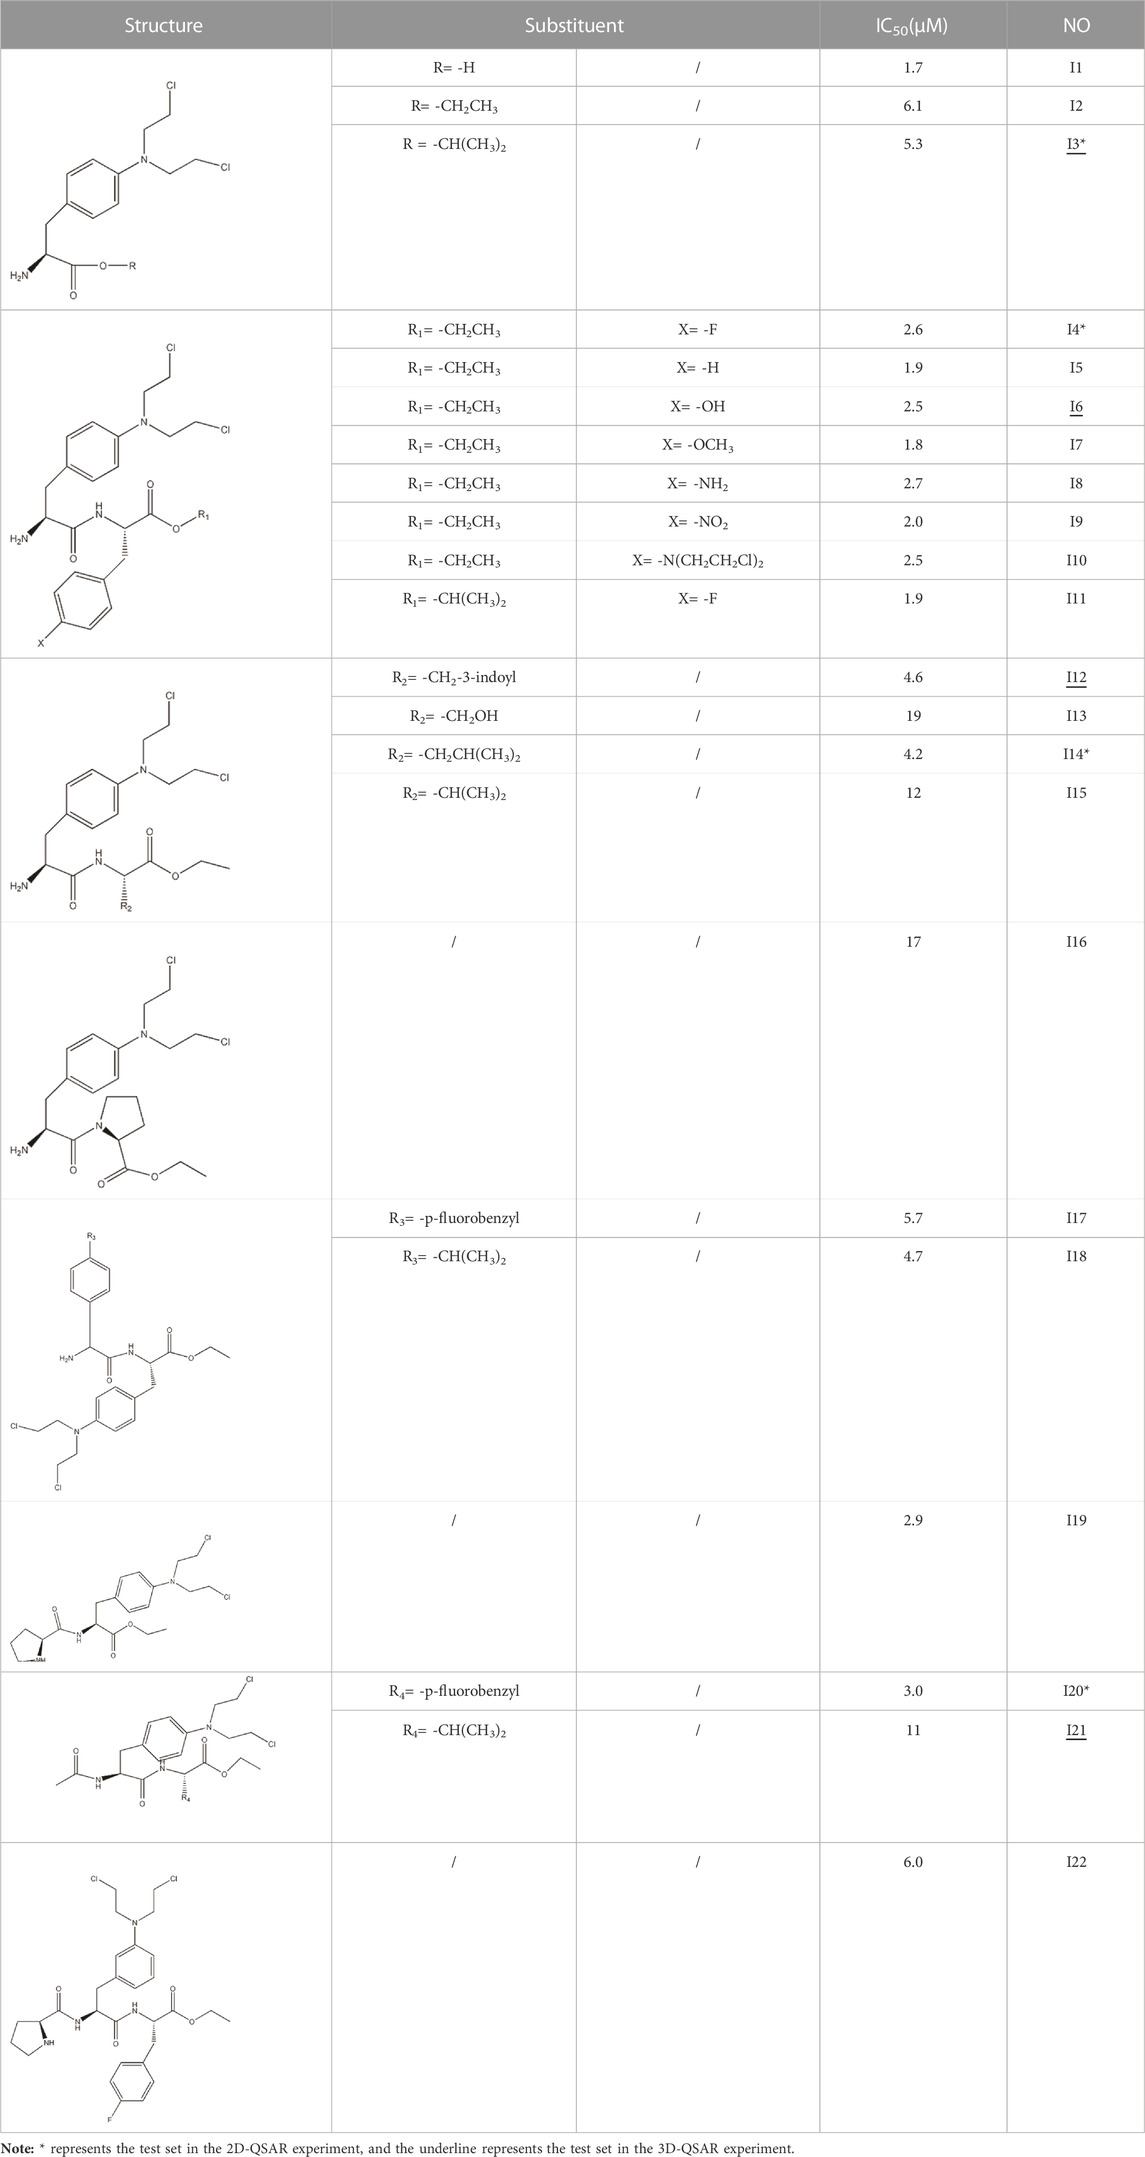
TABLE 1. Structure and activity values of 22 compounds.
In order to obtain reliable experimental results, 22 compounds were grouped under random conditions using system time, 18 of which were in the training set for model construction, training, and optimization. The test set contained four compounds, which would be used to assess the predictive power of the model.
The key to building a good predictive QSAR model is to use and define molecular descriptors properly. So, the optimization of compounds is extremely important.
In this experiment, all compounds were constructed using ChemDraw software, which were then imported into HyperChem software. First, an MM + molecular mechanic field was used for rough optimization. In the second step, a precise optimization was performed using semi-empirical AM1 or PM3 methods using HyperChem, and the molecular structure was optimized using the Polak–Ribiere algorithm, until the root mean square gradient was 0.01 (Stewart, 1989; HyperChem, 1994). Finally, the results were imported into CODESSA software (Katritzky et al., 2001) to calculate five classes of molecular descriptors: constitutional, geometrical, topological, electrostatic, and quantum chemical.
Feature selection is used to reduce the number of descriptors and delete those that have less impact on the result. The remaining descriptors should represent the molecular structure and various properties as much as possible. The HM implemented in CODESSA software is used to calculate molecular descriptors and build linear models, and there is no software limitation on the size or speed of the dataset.
The detailed steps to establish a linear model through HM are as follows: selecting a parameter descriptor according to R2, F-test, t-test, and R2cv. After obtaining the two-parameter correlation coefficient with the best statistical characteristics, we added descriptors that are not used in the previous selection process. We repeat this step until the established correlation equation contains the most parameters. As a result, a linear model with six descriptors was developed through HM.
The principles of gene expression programming (GEP) are as follows: GEP is developed from the genetic algorithm (GA) and genetic programming (GP) (Holland, 1992), in which some limitations of GA and GP are overcome (TeodorescuSherwood, 2008). Therefore, the efficiency of the GEP algorithm is much higher than that of the aforementioned two algorithms. GEP is considered to be an evolutionary algorithm based on Darwin’s theory of the survival of the fittest (Pham, 2012). Compared with genetic algorithms based on encoded numbers and GP based on an analytical tree, a candidate solution of GEP is linear chromosomes (Kaydani et al., 2014). A chromosome consists of more than one gene divided into two parts, a head and a tail. The header section can be selected from the end set and feature set, while the tail section can only be selected from the end set (TeodorescuSherwood, 2008). Finally, these genes are decoded into expression trees (ETs) (Gharagheizi et al., 2012) to obtain mathematical equations. The basic steps of the GEP algorithm are shown in Figure 1. First, a certain number of individual chromosomes are randomly generated to be expressed as the initial population. Next, the fitness of each individual is calculated based on a set of fitness samples. Then, if a solution of an ideal quality is found, or a certain number of iterations are run, the process can be terminated (TeodorescuSherwood, 2008). Otherwise, these individuals will be selected for genetic manipulation based on their fitness values. Finally, offspring with new characteristics is produced. We repeat the process until we obtain a good result.
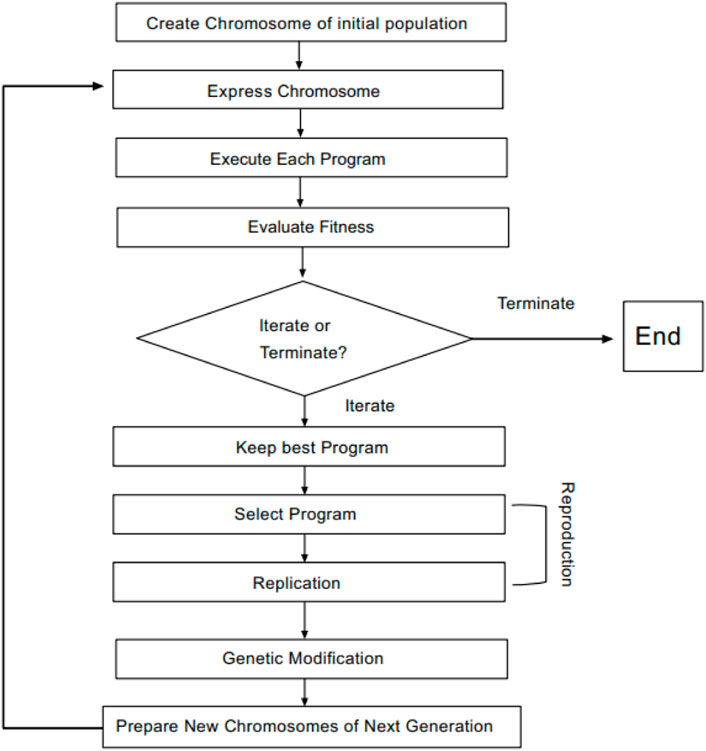
FIGURE 1. GEP flowchart.
In this study, we import the values of descriptors into automatic problem solver (APS) and integrate them with the GEP algorithm to obtain non-linear models. In order to obtain a good non-linear model, we select appropriate functions and evaluate their fitness through R2.
By comparing linear models with non-linear ones, it is found that non-linear models obtained through the GEP algorithm are more stable with better prediction ability. However, a 2D-QSAR model still cannot be used to accurately describe the relationship between molecular three-dimensional structures and their physiological activity, so it is necessary to continue 3D-QSAR experiments.
Like the previous 2D-QSAR experiments, in 3D-QSAR experiments, the dataset also needs to be divided into a training set and a test set. The training set containing 18 compounds will be used to build the models, and the test set containing four compounds will be used to verify them. At the same time, in order to reduce the deviation caused by the dataset to the experimental results, −log (IC50) + 6 is used to convert the IC50 value in the subsequent experiments.
In the previous experiments, ChemDraw software was used to construct all the 22 compounds, while in 3D-QSAR experiments, they are put into SYBYL software for optimization and modeling. When processing data using SYBYL software, the Tripos force field and Powell’s gradient algorithm are used to minimize CoMSIA structure energy. Finally, the minimal structure is used as the initial conformation (Yu et al., 2015).
In 3D-QSAR analyses, the structure comparison of compounds will directly affect the structure of subsequent tests; so, it is very important to select an appropriate comparison of compound structures (Yan et al., 2005; Patel et al., 2008; Yong et al., 2011). In this study, ligand alignment is used to superpose the structure of compounds, and the superposition patterns of all compounds can be seen in Figure 2. Because compound I1 has the highest IC50 value, all compounds are aligned with it in this method.
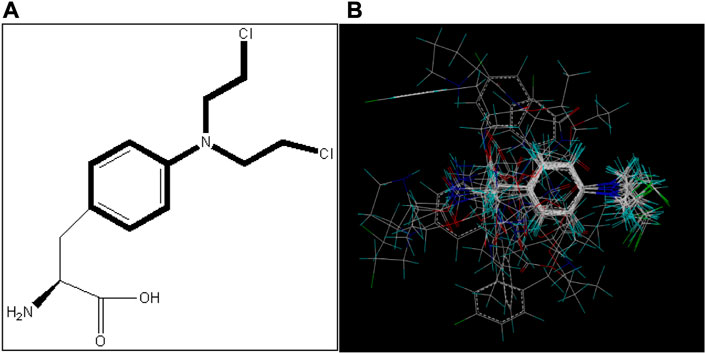
FIGURE 2. Alignment of all compounds in the dataset; compound I1 is used as a template. (A) Structure of compound I1 and the common substructure (shown in bold) for the alignment of all compounds. (B) Alignment of all the compounds.
CoMSIA is an excellent 3D-QSAR research tool (Yu et al., 2015). In the CoMSIA method, the Gaussian function related to distance is used to calculate various molecular fields, which can effectively avoid significant changes of potential energy and abnormal atomic positions at lattice points near the molecular surface. In addition, in CoMSIA, it is no longer necessary to define the cut-off value of energy. Compared with CoMFA, the correlation isosurface diagram of the contribution in different molecular fields of corresponding spaces of CoMSIA is significantly improved, which can be used to more intuitively explain the effect of different molecular fields on molecular activity (Li et al., 2012a). A CoMSIA study is carried out using the SYBYL software package, in which five molecular fields are used: spatial field (S), electrostatic field (E), hydrophobic field (H), hydrogen bond donor (D), and hydrogen bond acceptor (A). The CoMSIA method is calculated based on a 3D cubic lattice with a grid spacing of 2 Å and extending 4 Å units beyond the aligned molecules in all directions. A default value of 0.3 is used for the attenuation factor α (Yang et al., 2011a).
Partial least squares (PLS) analysis was used to correlate CoMSIA fields with −log (IC50) + 6 values to generate a statistically significant 3D-QSAR model, which was performed in two stages (Hadni and Elhallaoui, 2020). First, a leave-one-out cross-validation analysis was performed to determine the optimal group score (ONC) and cross-validation correlation coefficient (Q2). Then, the ONC was used in a non-cross-validation analysis to generate the final PLS regression model for CoMSIA. The non-cross validation results were evaluated based on several statistical parameters, including non-cross validation correlation coefficient (R2), estimated standard error (SEE), and F-value (Yan et al., 2020).
In order to prove the stability of the QSAR model, the 3D-QSAR model needs to be evaluated using internal or external validation methods (Yan et al., 2020). In this experiment, external validation was selected to verify the 3D-QSAR model. The verification formula is as follows:
In this formula, ntest refers to the number of compounds in the test set,
A total of 526 molecular descriptors of 22 compounds were calculated using CODESSA software. In order to find the best linear model, the HM was used to construct linear models with 1–7 descriptors, respectively. The R2, R2cv, and S2 of these models are shown in Figure 3. The results showed that with the increase of the number of descriptors, R2 and R2cv increased, while S2 decreased. After a comprehensive consideration, a model with six descriptors was selected as the best linear model to predict inhibitor activity (Table 2).
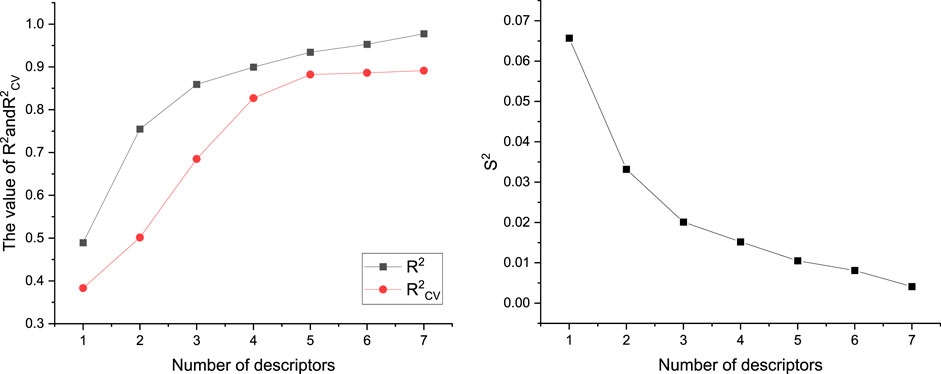
FIGURE 3. Effects of different number of descriptors on R2, R2cv, and S2.
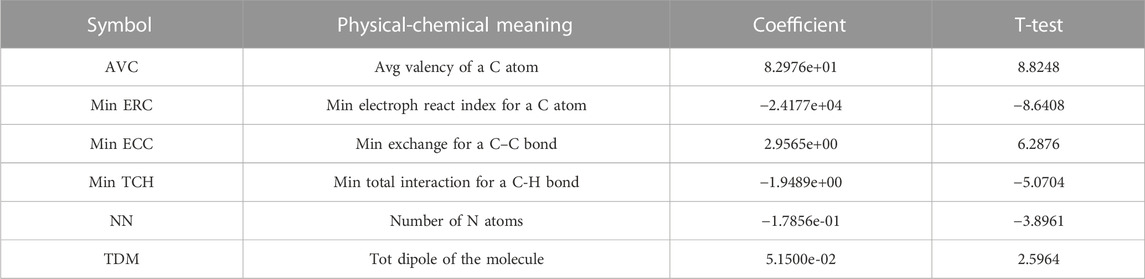
TABLE 2. Selected molecular descriptors and their physical-chemical meaning, coefficient, and t-test.
In addition, to avoid the multicollinearity of molecular descriptors, correlation coefficients of those descriptors were calculated, as shown in Table 3. The results showed that the correlation coefficients of any two descriptors were less than 0.8, which meant that all descriptors were independent. Therefore, the linear model constructed in the experiment has strong statistical reliability (Figure 4).
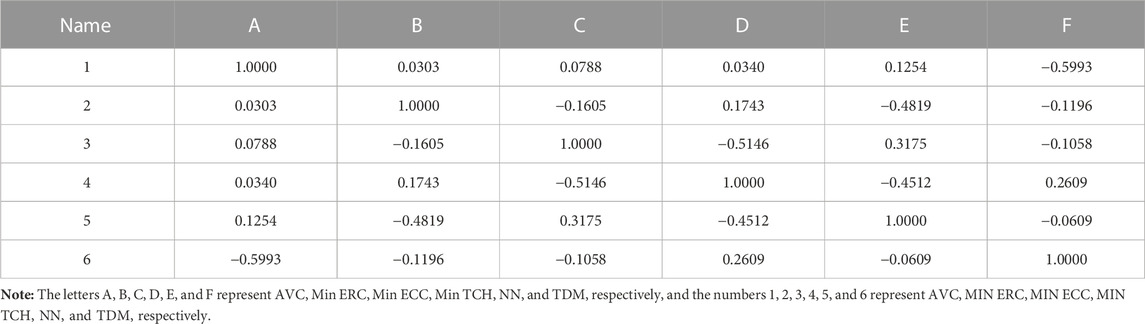
TABLE 3. Correlation matrix of the six descriptors.
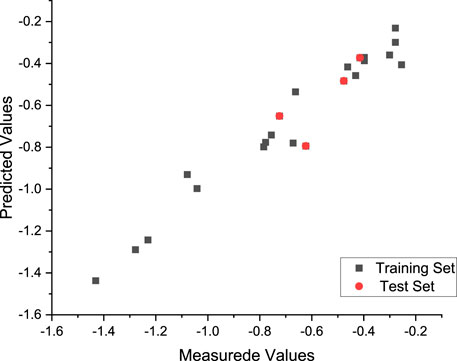
FIGURE 4. Plot of the measured and calculated −log (IC50) by HM.
The linear model equation is as follows:
According to the absolute value of the coefficients in the formula, it can be seen that the influence of descriptors on the anti-tumor activity of nitrogen-mustard compounds is as follows:
The dataset was randomly divided into a training set containing 18 compounds and a test set containing four compounds, and then, a non-linear model was built using software automatic problem solver (APS) to integrate the implementation of the GEP algorithm (Table 4).
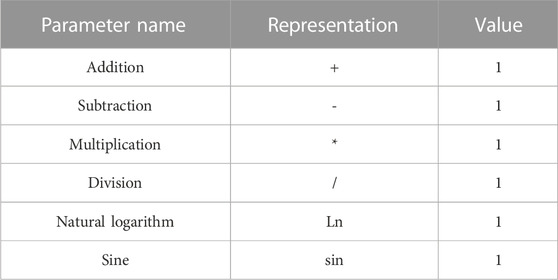
TABLE 4. Operator symbols and parameters of the regression equation.
Finally, the best model was generated in the 89th generation cycle. The correlation coefficient of the training set and test set was 0.95 and 0.87, respectively, and the average error was 0.02 and 0.06, respectively (Figure 5).
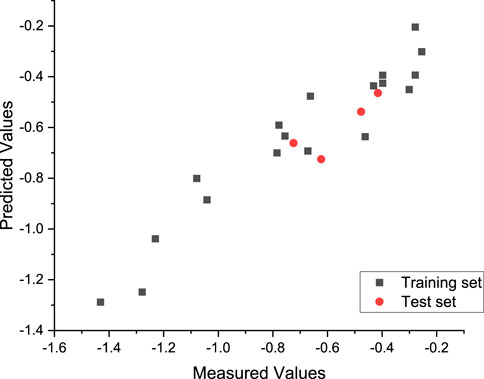
FIGURE 5. Plot of the measured and calculated −log (IC50) by GEP.
Moreover, the non-linear model equation decoded by ETs was as follows:
The statistical results of the best CoMSIA model are shown in Table 5. Through the CoMSIA model, we derived a q2 of 0.532 with an optimum number of components, which was five. A high r2 of 0.997 with a low SEE of 0.016 and an F-value of 1601.378 were obtained.
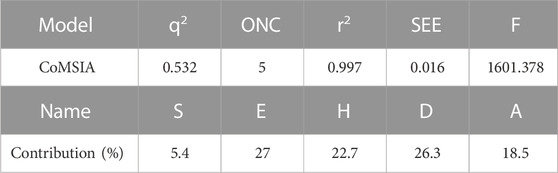
TABLE 5. Statistical results of the optimal CoMSIA model.
In this experiment, an external validation formula was used to verify the 3D-QSAR model constructed in the experiment. The value of R2ext was 0.987, which was greater than 0.5, indicating that the established model had strong stability and good statistical prediction ability. Figure 6 shows a good relationship between the predicted values and the experimental values.
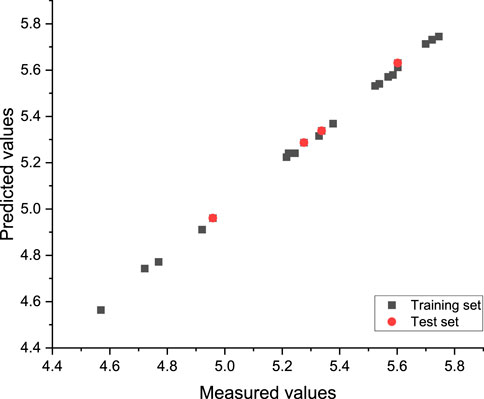
FIGURE 6. CoMSIA model-predicted activity values compared with the experimental values.
The contour map of a CoMSIA model can clearly show the influence of drug groups on drug activity in different molecular force fields. Therefore, in the design and development of new drugs, more effective and excellent drugs can be designed according to the contour map (Li et al., 2012b; Mao et al., 2012).
In this experiment, contour maps of the spatial potential field, electrostatic field, hydrophobic field, hydrogen bond donor field, and hydrogen bond acceptor field of the CoMSIA model were constructed, respectively, according to compound I1 with the highest IC50 value (Figure 7).
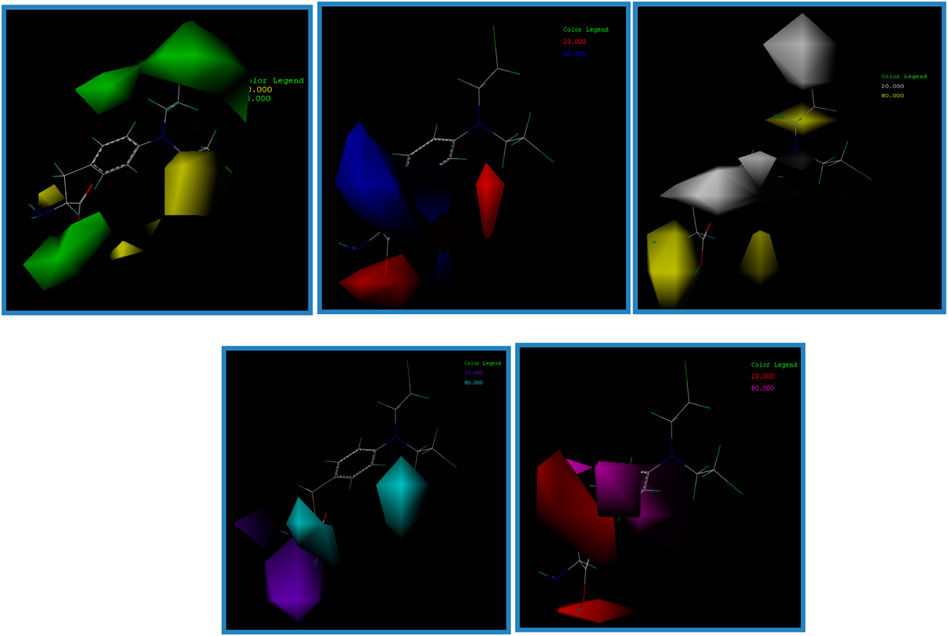
FIGURE 7. Contour map of the optimal compound I1. (A) In the steric field, green represents favorable and yellow represents unfavorable. (B) In the electrostatic field, blue represents a positive electric field and red represents a negative electric field. (C) In the hydrophobic field, yellow represents favorable and white represents unfavorable. (D) Favorable (cyan) and unfavorable (purple) hydrogen bond donor fields. (E) Favorable (magenta) and unfavorable (red) hydrogen bond acceptor fields.
The contribution value of the electrostatic field is the highest among these five contour plots, so it is necessary to focus on the construction of compounds in this field in subsequent drug design experiments.
In the 2D-QSAR experimental results of nitrogen-mustard compounds, “Min electroph react index for a C atom” was found to be the most important descriptor affecting the drug activity of compounds. Therefore, the descriptor “Min electroph react index for a C atom” should be added to the idea of a new drug design so as to improve the drug activity of newly designed compounds.
Finally, 200 new nitrogen-mustard compounds were designed according to the molecular descriptor “Min electroph react index for a C atom” and the CoMSIA model contour plot (especially the electrostatic field). The IC50 value of these 200 new compounds was predicted using the CoMSIA model. The 10 compounds with the highest IC50 predictive values are listed in Table 6, among which compound I1.10 has the highest drug activity value, which may be a potential anti-osteosarcoma drug, but small molecule docking assays are still needed.
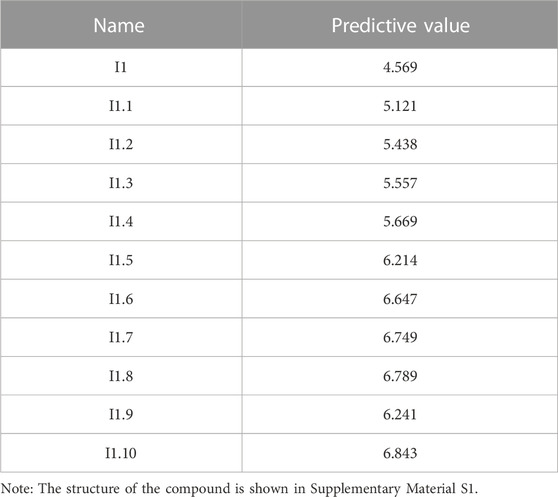
TABLE 6. Newly designed compounds and their predicted values.
In order to prove the effectiveness of the newly designed compounds on osteosarcoma-related protein targets, a molecular docking test on small-molecule compounds and proteins was carried out using SYBYL (SYBYL-2.1.1) software package. Compound I1 and I1.10 were docked as ligands in the docking experiment. Meanwhile, as ifosfamide is the most common chemotherapy drug for osteosarcoma, it was also added as a ligand in the docking experiment.
In this study, a total of four transcriptional osteosarcoma-related DNA sequences were screened out, which were mTOR, OGG1, EGFR, and PDGFR-β. Four pieces of DNA produced a total of 344 protein receptors, of which only 12 had docking activity with nitrogen-mustard compounds. In this experiment, 1H90 with the best docking ability was selected as the target. The docking experiments on these three compounds are shown in Figure 8. It can be seen from the figure that compound I1.10 can form five hydrogen bonds with the protein, while the remaining two small molecules can only form one and three hydrogen bonds, while the docking fractions of ifosfamide, I1, and I1.10 are 3.495, 6.124, and 9.105, respectively; so, compound I1.10 has the best docking ability.
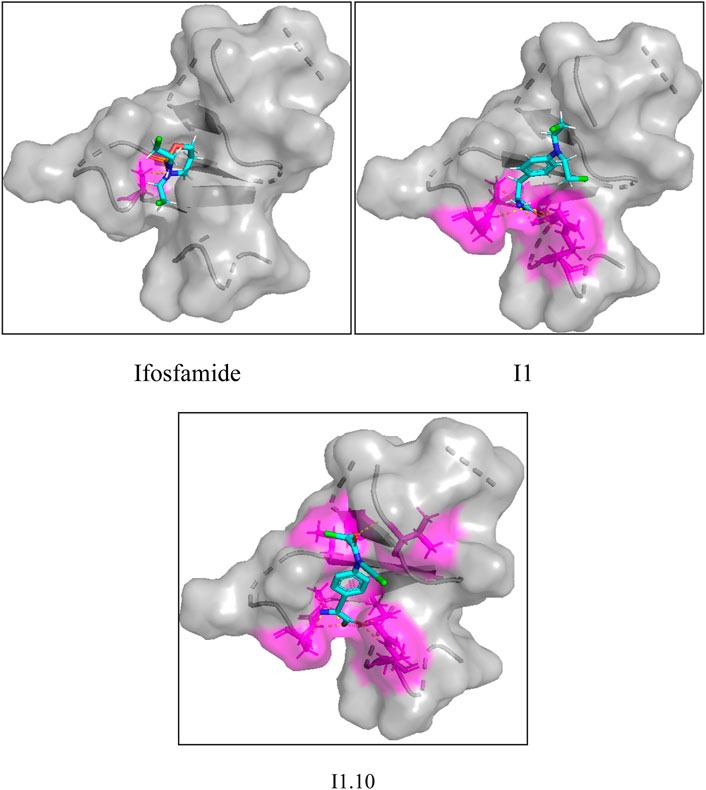
FIGURE 8. Docking experiments of ifosfamide, I1, and I1.10 with osteosarcoma targets.
First, the advantage of this experiment lies in the innovation of a QSAR research mode. In the previous QSAR experiments, QSAR models were established for tumor targets with known structures, where the compounds were designed. However, such experimental design ideas had limitations, e.g., some excellent drugs could not be extended to other tumor treatments. In order to change this limitation, in this study, the main regulatory DNA sequences of osteosarcoma were first screened and were then followed by the protein targets so as to achieve an effective inhibition of the compounds on osteosarcoma. This approach has two advantages. The first is that this approach can ensure effective docking of the compounds to target tumors, improving the ability to predict whether the compounds have an effect on the tumor. The second advantage is the improvement of the adaptability of cancer chemotherapy drugs and the increase of the diversity of cancer drugs by predicting whether there is an inhibitory effect between drugs and tumor targets.
Second, at the beginning of this experiment, we found few data on alkylated dipeptide nitrogen-mustard compounds. However, since such compounds indeed have a very large anti-tumor potential, we proved the model stability and prediction ability of the model in this experiment using the machine learning algorithm and internal validation (Kostakis and Kargas, 2021; Omoyiola, 2022). Simply put, the easiest way to conduct an internal validation of models through machine learning algorithms is to increase or decrease the data amount in training sets and test sets. Therefore, in the subsequent work, we conducted two 3D-QSAR experiments by increasing or decreasing the data amount in the training set and test set, finding that q2 in the two experiments was 0.552 and 0.521, respectively, which was basically similar to Q2 in this experiment (0.532). Therefore, the model in this experiment conformed to the basic principles of the machine learning algorithm, which also proved that it had good stability and prediction ability.
In 2D-QSAR experiments, the drug activity of compounds is mainly affected by changing the proportion of the molecular descriptors of those compounds. In a 3D-QSAR experiment on a compound, the main factor affecting its drug activity was the changes in its effective group in different force fields. In this experiment, we combined the most influential molecular descriptors in a 2D-QSAR experiment with the contour map of the 3D-QSAR model to serve as a guiding idea for designing new drugs. This drug design method has been very reliable in the research results of this experiment.
In this experiment, linear and non-linear 2D-QSAR models are established using the heuristic method and GEP algorithm. By comparing the two 2D-QSAR models, it was found that the non-linear model had better stability and prediction ability, but the 2D-QSAR model had a limitation, i.e., it could not be used to accurately describe the influence of the changes in the spatial structure of compounds on their anti-tumor activity. Therefore, we used the CoMSIA method to construct a 3D-QSAR model with a higher q2 (0.532) and r2 (0.997) value and a lower estimated standard error (0.016) value. By comparing the 2D-QSAR model with the 3D-QSAR model, it was found that the 3D-QSAR model could intuitively show the changes in the spatial structure and anti-tumor activity of those compounds. Finally, 200 new nitrogen compounds were constructed by combining the molecular descriptor “Min electroph react index for a C atom” of the 2D-QSAR model with the molecular force field of the 3D-QSAR model, in which compound I1.10 had the highest drug activity. However, in order to further demonstrate the effectiveness of these compounds on osteosarcoma-related receptor targets, we continued to perform small-molecule docking experiments, and the docking results of compound I1.10 were satisfactory.
The original contributions presented in the study are included in the article/Supplementary Material; further inquiries can be directed to the corresponding authors.
Conceptualization, ZL and WB; methodology, ZL; software, ZL; validation, WZ and HX; formal analysis, ZL; investigation, ZL; data curation, WB; writing—original draft preparation, ZL; writing—review and editing, WZ. All authors have read and agreed to the published version of the manuscript.
The authors thank Prof. Honglin Zhai for his help with the software.
The authors declare that the research was conducted in the absence of any commercial or financial relationships that could be construed as a potential conflict of interest.
All claims expressed in this article are solely those of the authors and do not necessarily represent those of their affiliated organizations, or those of the publisher, the editors, and the reviewers. Any product that may be evaluated in this article, or claim that may be made by its manufacturer, is not guaranteed or endorsed by the publisher.
The Supplementary Material for this article can be found online at: https://www.frontiersin.org/articles/10.3389/fmolb.2023.1164349/full#supplementary-material
Bacci, G., Ferrari, S., Donati, D., Longhi, A., Bertoni, F., Di Fiore, M., et al. (1998). Neoadjuvant chemotherapy for osteosarcoma of the extremity in patients in the fourth and fifth decade of life. Oncol. Rep. 5 (5), 1259–1263. doi:10.3892/or.5.5.1259
Bacci, G., Longhi, A., Versari, M., Mercuri, M., Briccoli, A., and Picci, P. (2006). Prognostic factors for osteosarcoma of the extremity treated with neoadjuvant chemotherapy: 15-year experience in 789 patients treated at a single institution. Cancer 106 (5), 1154–1161. doi:10.1002/cncr.21724
Becher, R., Schütt, P., Osieka, R., and Schmidt, C. G. (1980). Peripheral neuropathy and ophthalmologic toxicity after treatment withcis-dichlorodiaminoplatinum II. J. Cancer Res. Clin. Oncol. 96 (2), 219–222. doi:10.1007/BF00405506
Cao, C., and Lin, Y. (2003). Correlation between the glass transition temperatures and repeating unit structure for high molecular weight polymers. J. Chem. Inf. Comput. Sci. 43 (2), 643–650. doi:10.1021/ci0202990
Chen, Y., Jia, Y., Song, W., and Zhang, L. (2018). Therapeutic potential of nitrogen mustard based hybrid molecules[J]. Front. Pharmacol. 9, 1435. doi:10.3389/fphar.2018.01453
Dearden, J. C. (2017). The history and development of quantitative structure-activity relationships (QSARs): addendum[J]. Int. J. Quantitative Structure-Property Relat. (IJQSPR) 2 (2), 36–46. doi:10.4018/ijqspr.2017070104
Ferrari, S., Meazza, C., Palmerini, E., Tamburini, A., Fagioli, F., Cozza, R., et al. (2014). Nonmetastatic osteosarcoma of the extremity. Neoadjuvant chemotherapy with methotrexate, cisplatin, doxorubicin and ifosfamide. An Italian Sarcoma Group study (ISG/OS-Oss). Tumori 100 (6), 612–619. doi:10.1700/1778.19262
Gharagheizi, F., Ilani-Kashkouli, P., Farahani, N., and Mohammadi, A. H. (2012). Gene expression programming strategy for estimation of flash point temperature of non-electrolyte organic compounds. Fluid Phase Equilibria 329, 71–77. doi:10.1016/j.fluid.2012.05.015
Gullbo, J., Vabeno, J., Ehrsson, H., Lewensohn, R., Nygren, P., Larsson, R., et al. (2003). Structure-activity relationship for alkylating dipeptide nitrogen mustard derivatives. Oncol. Res. Featur. Preclin. Clin. Cancer Ther. 14 (3), 113–132. doi:10.3727/000000003771013071,
Hadni, H., and Elhallaoui, M. (2020). 2D and 3D-QSAR, molecular docking and ADMET properties in silico studies of azaaurones as antimalarial agents. New J. Chem. 44 (16), 6553–6565. doi:10.1039/c9nj05767f
Katritzky, A. R., Perumal, S., Petrukhin, R., and Kleinpeter, E. (2001). Codessa-based theoretical QSPR model for hydantoin HPLC-RT lipophilicities. J. Chem. Inf. Comput. 41 (3), 569–574. doi:10.1021/ci000099t
Kaydani, H., Mohebbi, A., and Eftekhari, M. (2014). Permeability estimation in heterogeneous oil reservoirs by multi-gene genetic programming algorithm. J. Petroleum Sci. Eng. 123, 201–206. doi:10.1016/j.petrol.2014.07.035
Kostakis, P., and Kargas, A. (2021). Big-data management: A driver for digital transformation? Information 12 (10), 411. doi:10.3390/info12100411
Li, X., Ye, L., Wang, X., Wang, X., Liu, H., Qian, X., et al. (2012). Molecular docking, molecular dynamics simulation, and structure-based 3D-QSAR studies on estrogenic activity of hydroxylated polychlorinated biphenyls. Sci. Total Environ. 15, 230–238. doi:10.1016/j.scitotenv.2012.08.072
Li, X., Ye, L., Wang, X., Wang, X., Liu, H., Zhu, Y., et al. (2012). Combined 3D-QSAR, molecular docking and molecular dynamics study on thyroid hormone activity of hydroxylated polybrominated diphenyl ethers to thyroid receptors β. Toxicol. Appl. Pharmacol. 15, 300–307. doi:10.1016/j.taap.2012.08.030
Lilienthal, I., and Herold, N. (2020). Targeting molecular mechanisms underlying treatment efficacy and resistance in osteosarcoma: A review of current and future strategies. Int. J. Mol. Sci. 21 (6885), 6885. doi:10.3390/ijms21186885
Liu, T-M., Zhu, S., Zhou, J-S., and Sun, Z. (2008). Lethal effect of benzene nitrogen mustard glucoside derivate on K562 cells. Chem. Res. Chin. Univ. 24 (6), 762–766. doi:10.1016/S1005-9040(09)60023-4
Mao, Y., Li, Y., Hao, M., Zhang, S., and Ai, C. (2012). Docking, molecular dynamics and quantitative structure-activity relationship studies for HEPTs and DABOs as HIV-1 reverse transcriptase inhibitors. J. Mol. Model 18, 2185–2198. doi:10.1007/s00894-011-1236-8
Marcove, R. C., Miké, V., Hajek, J. V., Levin, A. G., and Hutter., R. V. (1970). Osteogenic sarcoma under the age of twenty-one. A review of one hundred and forty-five operative cases. J. Bone and Jt. Surg. Am. 52 (3), 411–423.
Marcove, R., Mikè, V., Hajek, J., Levin, A. G., and Hutter, R. V. (1970). Osteogenic sarcoma under the age of twenty-one. A review of one hundred and forty-five operative cases. J. Bone Jt. Surg. A 52 (3), 411–423. doi:10.2106/00004623-197052030-00001
Mouchlis, V. D., Melagraki, G., Mavromoustakos, T., Kollias, G., and Afantitis, A. (2012). Molecular modeling on pyrimidine-urea inhibitors of TNF-α production: An integrated approach using a combination of molecular docking, classification techniques, and 3D-QSAR CoMSIA. J. Chem. Inf. Model 26, 711–723. doi:10.1021/ci200579f
Omoyiola, B. O. (2022). The social implications, risks, challenges and opportunities of big data. Emerald Open Res. 4 (23), 23. doi:10.35241/emeraldopenres.14646.1
Patel, P. D., Patel, M. R., Kaushik-Basu, N., and Talele, T. T. (2008). 3D QSAR and molecular docking studies of benzimidazole derivatives as hepatitis C virus NS5B polymerase inhibitors. J. Chem. Inf. Model 48, 42–55. doi:10.1021/ci700266z
Pham, T. (2012). Techniques: Genetic algorithms, tabu search, simulated annealing and neural networks. Berlin, Germany: Springer Science, Business Media.
Roy, K., Kar, S., and Das, R. N. (2015). Understanding the basics of QSAR for applications in pharmaceutical sciences and risk assessment. Amsterdam, Netherlands: Elsevier.
Singh, R. K., Kumar, S., Prasad, D. N., and Bhardwaj, T. R. (2018). Therapeutic journery of nitrogen mustard as alkylating anticancer agents: Historic to future perspectives. Eur. J. Med. Chem. 151, 401–433. doi:10.1016/j.ejmech.2018.04.001
Stewart, P. P. (1989). University of Indiana, bloomington. Bloomington: Indiana University Bloomington.
Tanihata, S., Oda, S., Nakai, S., and Uchiyama, T. (2004). Antiemetic effect of dexamethasone on cisplatin-induced early and delayed emesis in the pigeon. Eur. J. Pharmacol. 484 (2-3), 311–321. doi:10.1016/j.ejphar.2003.11.033
TeodorescuSherwood, L. D. (2008). High energy physics event selection with gene expression programming. Comput. Phys. Commun. 178 (6), 409–419. doi:10.1016/j.cpc.2007.10.003
Wittig, J. C., Bickels, J., Priebat, D., Jelinek, J., Kellar-Graney, K., Shmookler, B., et al. (2002). Osteosarcoma: A multidisciplinary approach to diagnosis and treatment. Am. Fam. Physician 65 (6), 1123–1132.
Yan, L., Wang, Y. H., Yang, L., Shu-Wei, Z., Chang-hou, L., and Sheng-Li, Y. (2005). Comparison of steroid substrates and inhibitors of P-glycoprotein by 3D-QSAR analysis. J. Mol. Struct. 733, 111–118. doi:10.1016/j.molstruc.2004.08.012
Yan, W., Lin, G., Zhang, R., Liang, Z., and Wu, W. (2020). Studies on the bioactivities and molecular mechanism of antioxidant peptides by 3D-QSAR, in vitro evaluation and molecular dynamic simulations. Food and Funct. 11 (4), 3043–3052. doi:10.1039/c9fo03018b
Yang, W., Shen, S. L., and Mu, H. (2011). Structure-activity relationship study on the binding of PBDEs with thyroxine transport proteins. Environ. Toxicol. Chem. 30, 2431–2439. doi:10.1002/etc.645
Yang, Y., Qin, J., Liu, H., and Yao, X. (2011). Molecular dynamics simulation, free energy calculation and structure-based 3D-QSAR studies of B-RAF kinase inhibitors. J. Chem. Inf. Model 28, 680–692. doi:10.1021/ci100427j
Yong, A., Shao-Teng, W., Chu, T., Ping-Hua, S., and Fa-Jun, S. (2011). 3D-QSAR and docking studies on pyridopyrazinones as BRAF inhibitors. Med. Chem. Res. 20, 1298–1317. doi:10.1007/s00044-010-9468-1
Keywords: osteosarcoma, nitrogen-mustard drugs, 2D-QSAR, 3D-QSAR, drug design
Citation: Zhuo W, Lian Z, Bai W, Chen Y and Xia H (2023) 3D- and 2D-QSAR models’ study and molecular docking of novel nitrogen-mustard compounds for osteosarcoma. Front. Mol. Biosci. 10:1164349. doi: 10.3389/fmolb.2023.1164349
Received: 17 February 2023; Accepted: 14 March 2023;
Published: 29 March 2023.
Edited by:
Hongzong Si, Qingdao University, ChinaReviewed by:
Jichao Chen, Nanjing University of Chinese Medicine, ChinaCopyright © 2023 Zhuo, Lian, Bai, Chen and Xia. This is an open-access article distributed under the terms of the Creative Commons Attribution License (CC BY). The use, distribution or reproduction in other forums is permitted, provided the original author(s) and the copyright owner(s) are credited and that the original publication in this journal is cited, in accordance with accepted academic practice. No use, distribution or reproduction is permitted which does not comply with these terms.
*Correspondence: Huanling Xia, bGluZGF4aWFodWFubGluZ0BxcS5jb20=; Yanrong Chen, eGlhb3Bhbmcta2tAMTYzLmNvbQ==
†These authors have contributed equally to this work and share first authorship
Disclaimer: All claims expressed in this article are solely those of the authors and do not necessarily represent those of their affiliated organizations, or those of the publisher, the editors and the reviewers. Any product that may be evaluated in this article or claim that may be made by its manufacturer is not guaranteed or endorsed by the publisher.
Research integrity at Frontiers
Learn more about the work of our research integrity team to safeguard the quality of each article we publish.