 Dongmei Zhu1,2†
 Junyu Li3,4,5†Yan Li2Ji Wu6Lin Zhu2Jian Li1Zimo Wang1
 Jinfeng Xu1*
 Fajin Dong1*
 Jun Cheng3,4,5*
- 1Department of Ultrasound, The Second Clinical Medical College, Jinan University, Shenzhen, China
- 2Department of Ultrasound, The Affiliated Nanchong Central Hospital of North Sichuan Medical College, Nanchong, China
- 3National-Regional Key Technology Engineering Laboratory for Medical Ultrasound, School of Biomedical Engineering, Health Science Center, Shenzhen University, Shenzhen, China
- 4Medical Ultrasound Image Computing (MUSIC) Laboratory, Shenzhen University, Shenzhen, China
- 5Marshall Laboratory of Biomedical Engineering, Shenzhen University, Shenzhen, China
- 6Department of Urology Surgery, The Affiliated Nanchong Central Hospital of North Sichuan Medical College, Nanchong, China
Objective: We aim to establish a deep learning model called multimodal ultrasound fusion network (MUF-Net) based on gray-scale and contrast-enhanced ultrasound (CEUS) images for classifying benign and malignant solid renal tumors automatically and to compare the model’s performance with the assessments by radiologists with different levels of experience.
Methods: A retrospective study included the CEUS videos of 181 patients with solid renal tumors (81 benign and 100 malignant tumors) from June 2012 to June 2021. A total of 9794 B-mode and CEUS-mode images were cropped from the CEUS videos. The MUF-Net was proposed to combine gray-scale and CEUS images to differentiate benign and malignant solid renal tumors. In this network, two independent branches were designed to extract features from each of the two modalities, and the features were fused using adaptive weights. Finally, the network output a classification score based on the fused features. The model’s performance was evaluated using five-fold cross-validation and compared with the assessments of the two groups of radiologists with different levels of experience.
Results: For the discrimination between benign and malignant solid renal tumors, the junior radiologist group, senior radiologist group, and MUF-Net achieved accuracy of 70.6%, 75.7%, and 80.0%, sensitivity of 89.3%, 95.9%, and 80.4%, specificity of 58.7%, 62.9%, and 79.1%, and area under the receiver operating characteristic curve of 0.740 (95% confidence internal (CI): 0.70–0.75), 0.794 (95% CI: 0.72–0.83), and 0.877 (95% CI: 0.83–0.93), respectively.
Conclusion: The MUF-Net model can accurately classify benign and malignant solid renal tumors and achieve better performance than senior radiologists.
Key points: The CEUS video data contain the entire tumor microcirculation perfusion characteristics. The proposed MUF-Net based on B-mode and CEUS-mode images can accurately distinguish between benign and malignant solid renal tumors with an area under the receiver operating characteristic curve of 0.877, which surpasses senior radiologists’ assessments by a large margin.
Introduction
Nowadays, cancer remains a serious threat to human health worldwide. The incidence of renal cancer is increasing annually, with more than 400,000 new cases every year worldwide (Shingarev and Jaimes, 2017; Sung et al., 2021). Clear cell renal cell carcinoma (ccRCC) is the most common type of renal cell carcinoma (RCC), accounting for 80% of all RCCs. Most renal tumors do not cause obvious clinical symptoms (Ljungberg et al., 2019). About 20%∼30% of patients with renal tumor resection were preoperatively misdiagnosed, resulting in unnecessary surgery with a final post-surgical diagnosis of being benign (Schachter et al., 2007). The diagnostic accuracy needs to be improved, especially for differentiating between hypoechoic benign solid tumors and malignant tumors. Noninvasive imaging modalities such as ultrasound, computed tomography (CT), and magnetic resonance imaging (MRI) have improved sensitivity and specificity in preoperatively differentiating among benign, malignant, and borderline tumors. Compared with these imaging modalities, contrast-enhanced ultrasound (CEUS) is more sensitive in visualizing the microcirculatory perfusion characteristics of renal tumors and thus is widely used. However, the diagnostic accuracy varies in terms of different lesion locations and radiologists.
Deep learning has shown promising results in the classification and diagnosis of renal tumors over the past few years (Oktay et al., 2018; Hussain et al., 2021; Wang et al., 2021), which does not require subjectively defined features and can capture the entirety of biological information from images compared with traditional machine learning (Sun et al., 2020; Bhandari et al., 2021; Giulietti et al., 2021; Khodabakhshi et al., 2021). The literature indicates that deep learning algorithms are better than human experts in diagnosing many kinds of diseases, such as liver, breast, lung, fundus, skin lesions (Wu et al., 2017; Lin et al., 2020; Li et al., 2021; Liu et al., 2021). These studies have shown that deep learning is stable and generalizable and can compensate for the diagnostic discrepancy among doctors with different levels of experience. To the best of our knowledge, there are no ultrasound-based radiomics studies for the differentiation between benign and malignant solid renal tumors (Esteva et al., 2017; Kokil and Sudharson, 2019; Zabihollahy et al., 2020; Hu et al., 2021; Mi et al., 2021).
In this study, we aim to establish a multimodal fusion deep neural network based on gray-scale ultrasound and CEUS images to discriminate between benign and malignant solid renal tumors. The performance of the multimodal fusion model is compared with that of the models built on single-modal data, as well as junior and senior radiologists’ assessments.
Materials and methods
Patients
This retrospective study was approved by our joint institutional review boards, and anonymized data was shared through a data-sharing agreement between institutions (The Second Clinical Medical College, Jinan University, and The Affiliated Nanchong Central Hospital of North Sichuan Medical College) (No. 18PJ149 and No. 20SXQT0140). Individual consent for this retrospective analysis was waived. From June 2012 to June 2021, the information for 1547 cases was obtained from the surgical pathology database in the Pathology Department of The Second Clinical Medical College of Jinan University and The Affiliated Nanchong Central Hospital of North Sichuan Medical College.
The inclusion criteria were as follows: (1) preoperative CEUS examinations were performed before surgery, and (2) all cases were confirmed by pathological diagnosis after surgery. Patients were excluded based on the following criteria: (1) renal pelvis cancer and other rare types of renal malignancies; (2) patients did not receive the ultrasound and CEUS examinations; (3) poor image quality, and (4) pathologic stage ≥ T2b. Figure 1 shows the flow diagram of patient enrollment for this study. Finally, 181 patients (100 solid malignant tumors and 81 solid benign tumors) were left. Patients’ demographic and clinical characteristics are shown in Table 1.
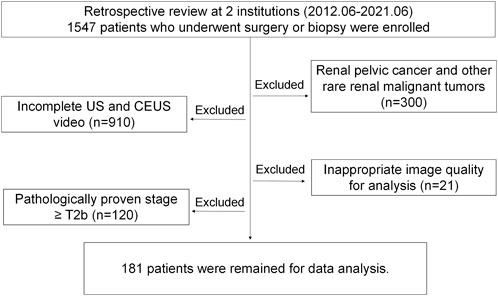
FIGURE 1. Flow diagram of patient enrollment.
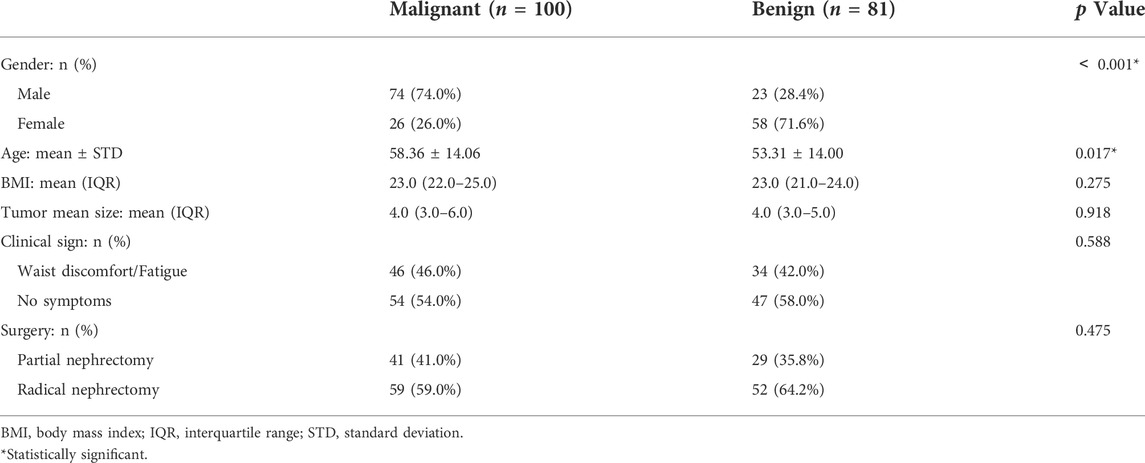
TABLE 1. Patient characteristics.
Contrast-enhanced ultrasound Imaging
CEUS examinations were performed using the following three ultrasound systems: LOGIQ E9 (GE Healthcare, Unites States), Resona7 (Mindray Ultrasound Systems, China), and IU22 (Philips Medical Systems, Netherlands), with a 1.0–5.0 MHz convex probe. CEUS was carried out by ultrasound machines with contrast-specific software and a bolus of 1.0∼1.2 ml microbubble contrast agent (SonoVue; Bracco, Milan, Italy) via an antecubital vein followed by 5.0 ml normal saline with a peripheral 18∼22 G needle. The CEUS digital video was at least 3∼5 min long each time. During contrast-enhanced imaging, low-acoustic power modes were used with a mechanical index of 0.05∼0.11. All the CEUS examination videos were retrospectively analyzed by two groups of radiologists with different levels of experience (three junior radiologists with more than 5∼6 years of experience in CEUS imaging and three senior radiologists with more than 10∼15 years of experience in CEUS imaging).
In this study, we used the following phase terms: (1) cortical phase began 10∼15 s after injection, and (2) medullary phase approximately began 30∼45 s after injection until the microbubble echoes disappeared. The entire course of CEUS was saved as Digital Imaging and Communication in Medicine format.
Data annotation and preprocessing
CEUS videos were annotated using the Pair annotation software package (Liang et al., 2022; Qian et al., 2022). In each CEUS video, about 50∼60 images were selected from the cortical and medullary phases. A senior radiologist classified the tumor as either benign or malignant and annotated its location in each selected image by a bounding box. Then, according to the bounding boxes, these images were cropped into smaller images as region of interest to exclude the non-tumor regions (Figure 2). This resulted in a total of 9794 images, of which 3659 images were benign (including 1531 from 36 atypical benign cases and 2128 images from 45 typical benign cases and 6135 images were malignant (including 2964 images from 62 ccRCC cases; 2114 images from 25 pRCC cases; 1057 images from 13 chRCC cases) (Table 2).
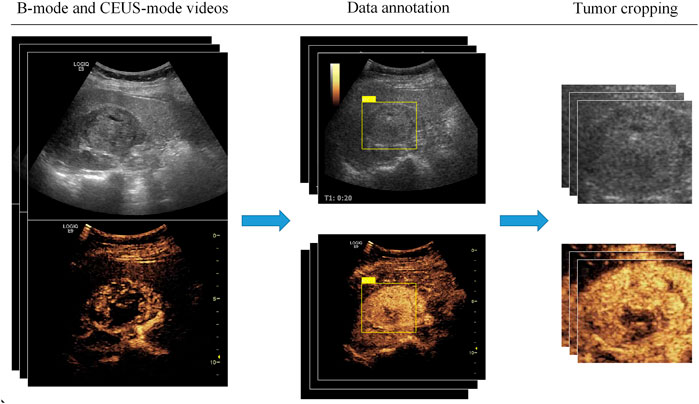
FIGURE 2. Data annotation and preprocessing.
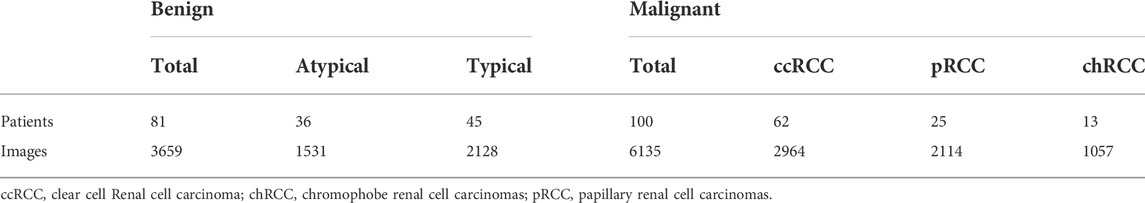
TABLE 2. Number distribution of patients and images among histologic types.
Multimodal ultrasound fusion network
The dataset used in this study contained B-mode and CEUS-mode images, and they were in one-to-one correspondence. Therefore, we proposed the MUF-Net to take full advantage of the multimodal features, which can independently extract features from each of the two modalities and learn adaptive weights to fuse features for each sample.
The overall architecture of MUF-Net is shown in Figure 3,
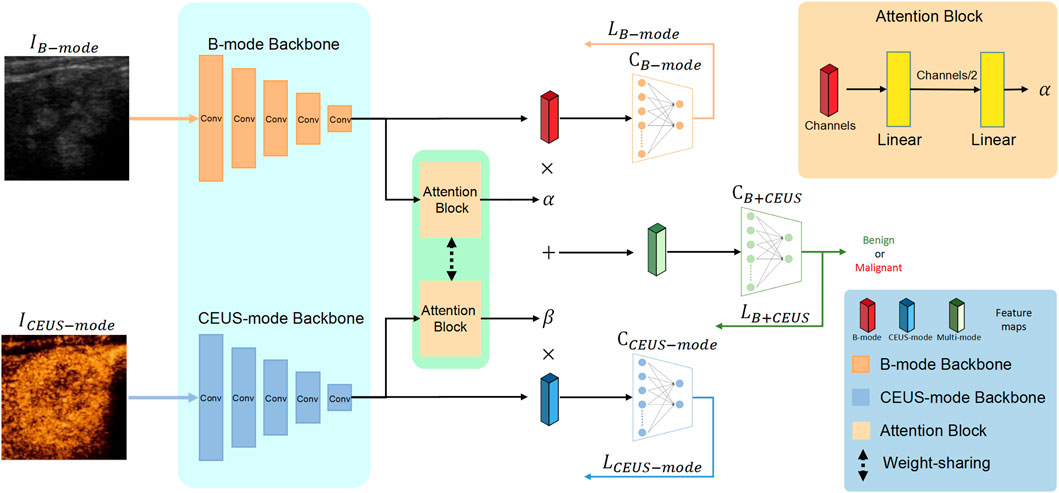
FIGURE 3. Overall architecture of the proposed MUF-Net framework.
Notably, to improve the feature learning ability of each backbone, we added two classifiers
Implementation details
All experiments were conducted using five-fold cross-validation. For data splitting, we ensured that the images from the same patient went into either the training set or the test set to avoid the data leakage problem. To avoid model overfitting, data augmentation techniques were applied to the training set, which included random spatial transformations, random non-rigid body transformations, and random noise.
The dataset used in this study had a weak class imbalance problem. The ratio of benign images to malignant images was 3:5. Re-sampling techniques (Zhang et al., 2021) were popularly used for dealing with long-tailed problems. We used class-balanced sampling to alleviate class imbalance by first sampling a class and then selecting an instance from the chosen class (Kang et al., 2019).
All backbones used in these experiments were pretrained on ImageNet. All models used in the experiments were implemented by PyTorch on a NVIDIA 3090 GPU. The stochastic gradient descent optimizer was used with a learning rate of 0.05 which was halved every 10 epochs. In each round of five-fold cross-validation, models based on B-mode, CEUS-mode, and B + CEUS mode were trained for 100 epochs, respectively, and the models with the highest accuracy on the validation set were saved.
Radiologists’ assessments
Original uncropped CEUS videos and images were evaluated by three junior and three senior radiologists and manually classified as benign or malignant. The radiologists were blinded to any clinical information of the patients. Intraclass correlation coefficients (ICCs) were used to evaluate the inter-rater agreement within each radiologist group, with an ICC greater than 0.75 indicating good agreement.
Statistical analysis
All statistical analyses were performed using the SciPy package in Python (version 3.8). Depending on whether data conformed to a normal distribution, continuous variables were compared using the Student’s t-test or the Mann-Whitney U test. The non-ordered categorical variables were compared by the chi-square test. Receiver operating characteristic (ROC) curve analysis was used to evaluate the performance of junior radiologists, senior radiologists, individual modality-based networks, and MUF-Net. In addition, we also used other metrics to evaluate model performance from various aspects, including sensitivity, specificity, positive predictive value (PPV), and negative predictive value (NPV). Comparison of the difference between areas under the ROC curve (AUCs) was performed using the Delong test. A two-sided p value < 0.05 was considered statistically significant.
Results
Patient characteristics
The age of the patients in the benign tumor group was less than that of the patients in the malignant tumor group (58.36 ± 14.06 vs. 53.31 ± 14.00 years) (p = 0.017). Regarding gender distribution, there was a significant difference between these two groups (p <0.001), with male patients being more frequent in the malignant group than in the benign group. Patient characteristics are shown in Table 1.
Performance of radiologists’ assessments
The ICCs in the junior and senior radiologist groups were 0.81 and 0.83, respectively, indicating good inter-rater agreement. Each radiologist classified a tumor as benign or malignant, and the radiologists’ assessments in each group were merged by majority voting. The performance of radiologists’ assessments is shown in Table 3. The AUC, accuracy, sensitivity, specificity, PPV, and NPV of junior radiologists were 0.740 (95% confidence interval (CI): 0.70–0.75), 70.6%, 89.3%, 58.7%, 58.0%, and 89.5%, respectively. The AUC, accuracy, sensitivity, specificity, PPV, and NPV of senior radiologists were 0.794 (95% CI: 0.72–0.83), 75.7%, 95.9%, 62.9%, 62.3%, and 95.9%, respectively. The ROC curves for the test set were shown in Figure 4.
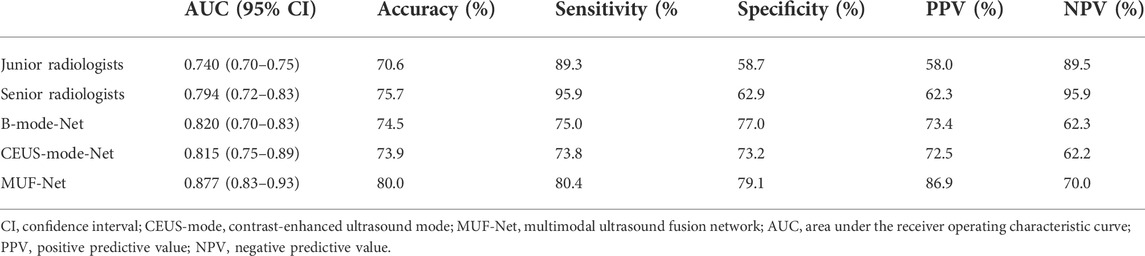
TABLE 3. Classification performance of deep learning models and radiologists.
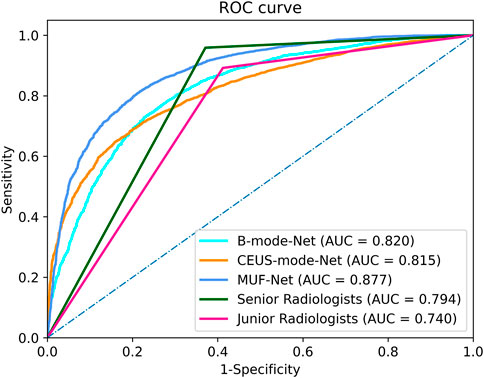
FIGURE 4. The receiver operating characteristic curves of the MUF-Net, single-mode models, and radiologists’ assessments in the test cohort.
Performance of deep learning models
The AUC, accuracy, sensitivity, specificity, PPV, and NPV of EffecientNet-b3 network trained on B-mode images were 0.820 (95% CI: 0.72–0.83), 74.5%, 75.0%, 77.0%, 73.4%, and 62.3%, respectively (Table 3). The AUC, accuracy, sensitivity, specificity, PPV, and NPV of EffecientNet-b3 network trained on CEUS-mode images were 0.815 (95% CI: 0.75–0.89), 73.9%, 73.8%, 73.2%, 72.5%, and 62.2%, respectively. The AUC, accuracy, sensitivity, specificity, PPV, and NPV of MUF-Net trained on B-mode and CEUS-mode images were 0.877 (95% CI: 0.83–0.93), 80.0%, 80.4%, 79.1%, 86.9%, and 70.0%, respectively. The proposed MUF-Net significantly outperformed junior and senior radiologists (p < 0.001).
Discussion
This study explored the performance of deep learning based on ultrasound images for benign/malignant classification of solid renal tumors. We proposed the MUF-Net for fusing complementary features of two modalities, which used two independent EffecientNet-b3 as backbones to extract features from B-mode and CEUS-mode ultrasound images. Our method reached expert-level diagnostic performance and had a higher diagnostic PPV compared with radiologists.
CEUS is an important supplement to conventional ultrasound, CT, and MRI in diagnosing solid renal tumors. Compared with conventional ultrasound, CEUS can display perfusion characteristics of renal tumors in cortical and medullary phases in real-time, which is an important tool for improving differential diagnosis of benign and malignant renal tumors. In this study, we observed that the deep learning models built on either B-mode or CEUS-mode images achieved better performance than junior or senior radiologists. Moreover, the deep learning model combing B-mode and CEUS-mode images further improved the classification performance. This indicates that B-mode and CEUS-mode images have complementary information for diagnosing solid renal tumors. To verify this point, we used class activation maps (Xu et al., 2022) to visualize the important regions that the model paid attention to in B-mode and CEUS-mode images. As shown in Figure 5, the important regions contributing to the final prediction were different between B-mode and CEUS-mode images. In other words, the MUF-Net can automatically extract complementary features from different modalities to improve the classification performance.
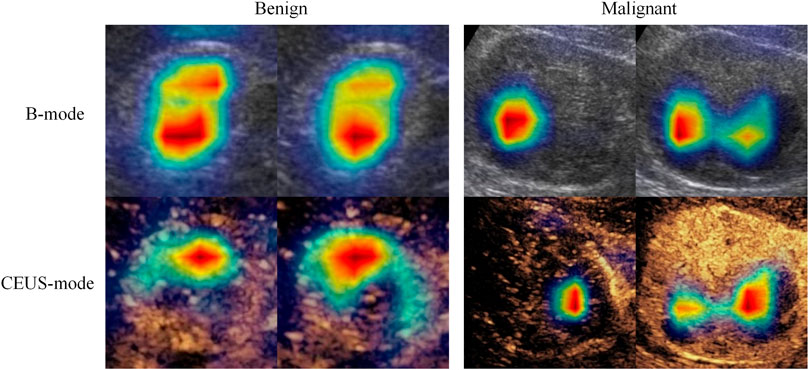
FIGURE 5. Feature heatmaps of a benign tumor and a malignant tumor to show B-mode and CEUS-mode images contain complementary information for diagnosis. The red color represents higher weights (i.e., the network pays more attention to this region).
According to the results from the comparative experiments, we found that the performance was similar between the two models built on B-mode or CEUS-mode images. The B-mode images-based model had slightly better performance, which might be due to the different microcirculatory perfusion characteristics of solid renal tumors. Solid renal tumors of different histopathological types have different vascular density, fat content, blood flow velocity, and the severity of arteriovenous fistulas.
Lin et al. reported an AUC of 0.846 for the classification of benign and malignant renal tumors on enhanced CT images using inception-v3 (Lin et al., 2020). Xu et al. used ResNet-18 to classify multimodal MRI images of renal tumors, with AUCs of 0.906 and 0.846 on T2WI and DWI, respectively (Xu et al., 2022). The AUC was improved to 0.925 by fusing the two modalities, exceeding the diagnostic performance of highly qualified radiologists. The results of this study were similar. The MUF-Net based on multimodal data surpassed the models based on individual modalities by a large margin. Therefore, we inferred that the adaptive weights learned by MUF-Net could help the network acquire the complementary information from the two modalities to improve the classification performance.
This study had several limitations. First, the classical and well-established convolutional neural network, EffecientNet-b3, was selected as the backbone based on previous experiments, which may not be optimal. The characteristics of multimodal ultrasound imaging data need to be analyzed in-depth, and other deep neural networks will be attempted in the future to see if better performance can be achieved. Second, only images of tumor regions were cropped and used in data analyses, and regions of tumor periphery might be able to provide more information to improve model performance, which requires further experimental analyses. Third, our model was implemented using the ultrasound images collected from two hospitals only. A larger dataset acquired from more hospitals with different types or models of ultrasound equipment may have the potential to further improve the performance and generalization ability of our model.
Conclusion
In this study, the proposed MUF-Net is able to classify benign and malignant solid renal tumors accurately, by extracting complementary features from B-mode and CEUS-mode images, which outperforms senior radiologists by a large margin.
Data availability statement
The original contributions presented in the study are included in the article/supplementary material, further inquiries can be directed to the corresponding authors.
Ethics statement
The studies involving human participants were reviewed and approved by the studies were reviewed and approved by The Second Clinical Medical College, Jinan University, and The Affiliated Nanchong Central Hospital of North Sichuan Medical College. Written informed consent for participation was not required for this study in accordance with the national legislation and the institutional requirements. Written informed consent was not obtained from the individual(s) for the publication of any potentially identifiable images or data included in this article.
Author contributions
DZ and JC contributed to conception and design of the study. DZ, YL, JW, LZ, JiL, and ZW collected the data. DZ, JuL, and JC analyzed and interpreted the data. DZ and JL wrote the first draft of the manuscript. JX, FD, and JC supervised the project and revised the manuscript. All authors contributed to the manuscript and approved the submitted version.
Funding
This project was supported by the Scientific Research Program of the Sichuan Health Commission and the Commission of Science and Technology of Nanchong (No. 21PJ195 and No. 20SXQT0140), National Natural Science Foundation of China (No. 61901275), and Shenzhen University Startup Fund (No. 2019131).
Conflict of interest
The authors declare that the research was conducted in the absence of any commercial or financial relationships that could be construed as a potential conflict of interest.
Publisher’s note
All claims expressed in this article are solely those of the authors and do not necessarily represent those of their affiliated organizations, or those of the publisher, the editors and the reviewers. Any product that may be evaluated in this article, or claim that may be made by its manufacturer, is not guaranteed or endorsed by the publisher.
Abbreviations
AUC: area under the receiver operating characteristic curve; CEUS: contrast-enhanced ultrasound; CT: computed tomography; ccRCC: clear cell renal cell carcinoma; chRCC: chromophobe renal cell carcinomas; MRI: magnetic resonance imaging; MUF-Net: multimodal ultrasound fusion network; NPV: negative predictive value; PPV: positive predictive value; pRCC: papillary renal cell carcinomas; ROC: receiver operating characteristic.
References
Bhandari, A., Ibrahim, M., Sharma, C., Liong, R., Gustafson, S., and Prior, M. (2021). CT-Based radiomics for differentiating renal tumours: A systematic review. Abdom. Radiol. 46 (5), 2052–2063. doi:10.1007/s00261-020-02832-9
Esteva, A., Kuprel, B., Novoa, R. A., Ko, J., Swetter, S. M., Blau, H. M., et al. (2017). Dermatologist-level classification of skin cancer with deep neural networks. Nature 542 (7639), 115–118. doi:10.1038/nature21056
Giulietti, M., Cecati, M., Sabanovic, B., Scirè, A., Cimadamore, A., Santoni, M., et al. (2021). The role of artificial intelligence in the diagnosis and prognosis of renal cell tumors. Diagn. (Basel, Switz. 11 (2), 206. doi:10.3390/diagnostics11020206
Hu, H.-T., Wang, W., Chen, L.-D., Ruan, S.-M., Chen, S.-L., Li, X., et al. (2021). Artificial intelligence assists identifying malignant versus benign liver lesions using contrast-enhanced ultrasound. J. Gastroenterol. Hepatol. 36 (10), 2875–2883. doi:10.1111/jgh.15522
Hussain, M. A., Hamarneh, G., and Garbi, R. (2021). Learnable image histograms-based deep radiomics for renal cell carcinoma grading and staging. Comput. Med. Imaging Graph. 90, 101924. doi:10.1016/j.compmedimag.2021.101924
Kang, B., Xie, S., Rohrbach, M., Yan, Z., Gordo, A., Feng, J., et al. (2019). Decoupling representation and classifier for long-tailed recognition. Available at: http:/arXiv.org/abs/1910.09217. doi:10.48550/arXiv.1910.09217
Khodabakhshi, Z., Amini, M., Mostafaei, S., Haddadi Avval, A., Nazari, M., Oveisi, M., et al. (2021). Overall survival prediction in renal cell carcinoma patients using computed tomography radiomic and clinical information. J. Digit. Imaging 34 (5), 1086–1098. doi:10.1007/s10278-021-00500-y
Li, W., Lv, X.-Z., Zheng, X., Ruan, S.-M., Hu, H.-T., Chen, L.-D., et al. (2021). Machine learning-based ultrasomics improves the diagnostic performance in differentiating focal nodular hyperplasia and atypical hepatocellular carcinoma. Front. Oncol. 11, 544979. doi:10.3389/fonc.2021.544979
Liang, J., Yang, X., Huang, Y., Li, H., He, S., Hu, X., et al. (2022). Sketch guided and progressive growing GAN for realistic and editable ultrasound image synthesis. Med. Image Anal. 79, 102461. doi:10.1016/j.media.2022.102461
Lin, Y., Feng, Z., and Jiang, G. (2020). Gray-scale ultrasound-based radiomics in distinguishing hepatocellular carcinoma from intrahepatic mass-forming holangiocarcinoma. Chin. J. Med. Imaging 28 (4), 269–272. doi:10.3969/j.issn.1005-5185.2020.04.007
Liu, Y., Zhou, Y., Xu, J., Luo, H., Zhu, Y., Zeng, X., et al. (2021). Ultrasound molecular imaging-guided tumor gene therapy through dual-targeted cationic microbubbles. Biomater. Sci. 9 (7), 2454–2466. doi:10.1039/d0bm01857k
Ljungberg, B., Albiges, L., Abu-Ghanem, Y., Bensalah, K., Dabestani, S., Fernández-Pello, S., et al. (2019). European association of urology guidelines on renal cell carcinoma: The 2019 update. Eur. Urol. 75 (5), 799–810. doi:10.1016/j.eururo.2019.02.011
Mi, S., Bao, Q., Wei, Z., Xu, F., and Yang, W. (2021). "MBFF-Net: Multi-Branch feature fusion network for carotid plaque segmentation in ultrasound," in International conference on medical image computing and computer-assisted intervention. (Strasbourg, France. Springer, Cham), 313–322.
Oktay, O., Schlemper, J., Folgoc, L. L., Lee, M., Heinrich, M., Misawa, K., et al. (2018). Attention u-net: Learning where to look for the pancreas. Available at: http:/arXiv.org/abs/1804.03999.doi:10.48550/arXiv.1804.03999
Qian, J., Li, R., Yang, X., Huang, Y., Luo, M., Lin, Z., et al. (2022). Hasa: Hybrid architecture search with aggregation strategy for echinococcosis classification and ovary segmentation in ultrasound images. Expert Syst. Appl. 202, 117242. doi:10.1016/j.eswa.2022.117242
Schachter, L. R., Cookson, M. S., Chang, S. S., Smith, J. A., Dietrich, M. S., Jayaram, G., et al. (2007). Second prize: Frequency of benign renal cortical tumors and histologic subtypes based on size in a contemporary series: What to tell our patients. J. Endourol. 21 (8), 819–823. doi:10.1089/end.2006.9937
Shingarev, R., and Jaimes, E. A. (2017). Renal cell carcinoma: New insights and challenges for a clinician scientist. Am. J. Physiol. Ren. Physiol. 313 (2), F145–F154. doi:10.1152/ajprenal.00480.2016
Kokil, P., and Sudharson, S. (2019). Automatic detection of renal abnormalities by off-the-shelf CNN features. IETE J. Edu. 60 (1), 14–23. doi:10.1080/09747338.2019.1613936
Sun, X.-Y., Feng, Q.-X., Xu, X., Zhang, J., Zhu, F.-P., Yang, Y.-H., et al. (2020). Radiologic-radiomic machine learning models for differentiation of benign and malignant solid renal masses: Comparison with expert-level radiologists. AJR. Am. J. Roentgenol. 214 (1), W44–W54. doi:10.2214/AJR.19.21617
Sung, H., Ferlay, J., Siegel, R. L., Laversanne, M., Soerjomataram, I., Jemal, A., et al. (2021). Global cancer statistics 2020: GLOBOCAN estimates of incidence and mortality worldwide for 36 cancers in 185 countries. Ca. Cancer J. Clin. 71 (3), 209–249. doi:10.3322/caac.21660
Wang, W., Chen, C., Ding, M., Yu, H., Zha, S., and Li, J. (2021). "TransBTS: Multimodal brain tumor segmentation using transformer," in International conference on medical image computing and computer-assisted intervention. (Strasbourg, France. Springer, Cham), 109–119.
Wu, J., You, L., Lan, L., Lee, H. J., Chaudhry, S. T., Li, R., et al. (2017). Semiconducting polymer nanoparticles for centimeters-deep photoacoustic imaging in the Second near-infrared window. Adv. Mat. 29, 1703403. doi:10.1002/adma.201703403
Xu, Q., Zhu, Q., Liu, H., Chang, L., Duan, S., Dou, W., et al. (2022). Differentiating benign from malignant renal tumors using T2- and diffusion-weighted images: A comparison of deep learning and radiomics models versus assessment from radiologists. J. Magn. Reson. Imaging. 55 (4), 1251–1259. doi:10.1002/jmri.27900
Zabihollahy, F., Schieda, N., Krishna, S., and Ukwatta, E. (2020). Automated classification of solid renal masses on contrast-enhanced computed tomography images using convolutional neural network with decision fusion. Eur. Radiol. 30 (9), 5183–5190. doi:10.1007/s00330-020-06787-9
Keywords: renal tumor, artificial intelligence, classification, deep learning, contrast-enhanced ultrasound
Citation: Zhu D, Li J, Li Y, Wu J, Zhu L, Li J, Wang Z, Xu J, Dong F and Cheng J (2022) Multimodal ultrasound fusion network for differentiating between benign and malignant solid renal tumors. Front. Mol. Biosci. 9:982703. doi: 10.3389/fmolb.2022.982703
Received: 30 June 2022; Accepted: 26 July 2022;
Published: 06 September 2022.
Edited by:
Feng Gao, The Sixth Affiliated Hospital of Sun Yat-sen University, ChinaReviewed by:
Yujia Zhou, Southern Medical University, ChinaQian Xiaoqin, Jiangsu University Affiliated People’s Hospital, China
Copyright © 2022 Zhu, Li, Li, Wu, Zhu, Li, Wang, Xu, Dong and Cheng. This is an open-access article distributed under the terms of the Creative Commons Attribution License (CC BY). The use, distribution or reproduction in other forums is permitted, provided the original author(s) and the copyright owner(s) are credited and that the original publication in this journal is cited, in accordance with accepted academic practice. No use, distribution or reproduction is permitted which does not comply with these terms.
*Correspondence: Jinfeng Xu, eHVqaW5mZW5nQHlhaG9vLmNvbQ==; Fajin Dong, ZG9uZ2ZhamluQHN6aG9zcGl0YWwuY29t; Jun Cheng, anVuY2hlbmdAc3p1LmVkdS5jbg==
†These authors have contributed equally to this work and share first authorship