 Arumay Pal
 Pinak Chakrabarti2
 Sucharita Dey
- 1School of Bioengineering, Vellore Institute of Technology, Bhopal, India
- 2Department of Biochemistry, Bose Institute, Kolkata, India
- 3Department of Bioscience and Bioengineering, Indian Institute of Technology Jodhpur, Karwar, India
Protein-DNA interactions play a crucial role in gene expression and regulation. Identifying the DNA binding surface of proteins has long been a challenge–in comparison to protein-protein interactions, limited progress has been made in the development of efficient DNA binding site prediction and protein-DNA docking methods. Here we present ProDFace, a web tool that characterizes the binding region of a protein-DNA complex based on amino acid propensity, hydrogen bond (HB) donor capacity (number of solvent accessible HB donor groups), sequence conservation at the interface core and rim region, and geometry. The program takes as input the structure of a protein-DNA complex in PDB (Protein Data Bank) format, and outputs various physicochemical and geometric parameters of the interface, as well as conservation of the interface residues in the protein component. Values are provided for the whole interface, and after dissecting it into core and rim regions. Details of water mediated HBs between protein and DNA, potential HB donor groups present at the binding surface of protein, and conserved interface residues are also provided as downloadable text files. These parameters can be useful in evaluating and validating protein-DNA docking solutions, structures derived from simulation as well as solutions from the available prediction tools, and facilitate the development of more efficient prediction methods. The web-tool is freely available at structbioinfo.iitj.ac.in/resources/bioinfo/pd_interface.
Introduction
Protein-nucleic acid recognition plays an essential role in all mechanisms of gene expression and control. Over the last two decades several groups have attempted to study and characterize the DNA-binding region that is crucial for recognition (Steitz 1990; Jones et al., 1999; Nadassy et al., 1999; Ahmad et al., 2004; Biswas et al., 2009; Corona and Guo 2016). Several features studied, such as the amino acid composition (Jones et al., 1999; Nadassy et al., 1999; Ahmad et al., 2004; Biswas et al., 2009), the conservation of amino acid residues as well as base-pairs (Luscombe and Thornton 2002; Mirny and Gelfand 2002; Kuznetsov et al., 2006; Ahmad et al., 2008), interactions at specific amino acid-base level (Mandel-Gutfreund and Margalit 1998), hydrophobic patches, non covalent interactions at atomic level (Luscombe et al., 2001), electrostatic potential (Jones et al., 2003; Stawiski et al., 2003), ionization state of amino acid side chains (the side chain pKa value) (Wang and Brown 2006), asymmetric distribution of electrostatic charge (Pal and Levy 2020) suggest that the amino acids at the interface possess characteristics that distinguish them from the rest of the protein. Thermodynamic and structural data on protein-DNA interactions have been combined to explore relationships between free energy, sequence conservation and structural cooperativity (Ahmad et al., 2008). Polar interactions at the interface also have an important role in binding. The importance of water molecules in protein-DNA interactions has been recognized, though to what extent they contribute to the binding specificity is still not clear (Reddy et al., 2001; Sarai and Kono 2005).
While there are a number of web servers dealing with the structural features of protein-protein interactions, such programs are almost non-existent for protein-DNA interactions, those few available earlier like WebPDA (Kim and Guo 2009), are now obsolete. Even databases like BIPA, PDIdb (Lee and Blundell 2009; Norambuena and Melo 2010) are either completely not functional now or outdated. DNAProDB (Sagendorf et al., 2017) is a more recently developed database in this area that provides precomputed structural features of protein-DNA complexes taken from PDB (until 2019). However, the interactive DNAProDB is mostly dedicated to give contact maps of interacting residues, given a protein-DNA complex. Similar to DNAProDB, COCOMAPS (Vangone et al., 2011) is another web-tool that also gives contact maps of interacting residues, given a protein-protein/DNA/RNA complex. A database named ProNAB (Harini et al., 2022) has been recently developed that provides experimentally validated thermodynamic parameters like dissociation constant (Kd), binding free energy (ΔG) and change in binding free energy upon mutation (ΔΔG) values, secondary structure and accessible surface area (ASA), for ∼20,000 protein-DNA/RNA complexes.
In our previous work (Dey et al., 2012), we have developed a set of parameters, based on a thoroughly curated non-redundant dataset of 130 protein-DNA interfaces, that could identify DNA binding region, both individually and in combination, to a high degree of accuracy (90.5% for the bound structures and 93.6% for the unbound form of the proteins). In this work, we have developed a web tool, ProDFace by tuning those parameters, viz., the number of evolutionary conserved residues (Ncons), the number of potential hydrogen bond donors (Dp) and residue propensity score (Rp), for community use. We have also integrated other important physicochemical and geometric features from two of our earlier developed web-tools ProFace (Saha et al., 2006), now hosted at structbioinfo.iitj.ac.in/resources/bioinfo/interface and PRICE (Guharoy et al., 2011), now hosted at structbioinfo.iitj.ac.in/resources/bioinfo/PPI_energetics, that deal with protein-protein interactions. With the availability of increasing amount of experimentally derived binding data such as dissociation constant (Kd) and binding free energy (ΔG) (Harini et al., 2022), our protein-DNA interface parameters can be used to correlate statistically derived features with experimental data.
Hence, we anticipate that ProDFace would be useful for analysing the increasing number of DNA-binding proteins and that the features it provides can be a useful implementation in the development of protein-DNA docking algorithms.
Implementation of the program
Given the atomic coordinates of a protein-DNA complex, ProDFace does data mining using a collection of in house programs running at the backend, and extracts various features that helps one to study the nature of the binding region. In addition, some free softwares used are: NACCESS (Hubbard, 1992) for the calculation of accessible surface area, HBPLUS (McDonald and Thornton 1994) for locating hydrogen bonds, DSSP (Kabsch and Sander 1983) for defining the secondary structural elements of proteins, and SURFNET (Laskowski 1995) for transforming the coordinates of the interface atoms along their principal axes and then projecting down the shortest axis. The work flow of the ProDFace pipeline is shown pictorially in Figure 1.
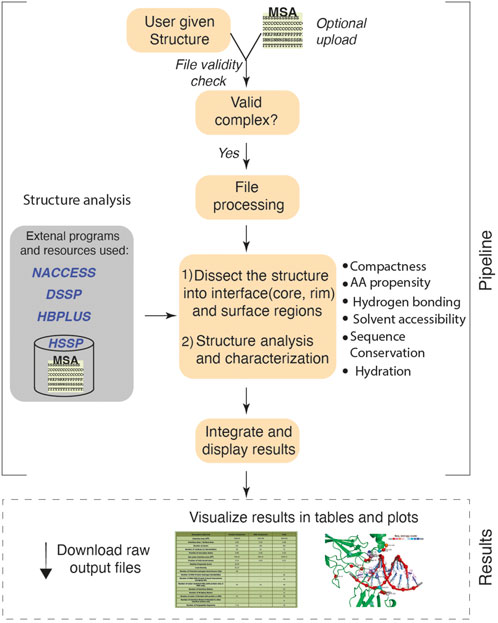
FIGURE 1. Workflow of ProDFace. The user uploads a query structure in PDB format. The protein-DNA binding region i.e. the interface and the rest of the surface region are identified for the whole complex, as well as for the protein and the DNA components. Structural, geometrical and physico-chemical properties of the interface region are calculated. Also, the interface hydration is analyzed. The interface is dissected into core and rim regions depending on their solvent accessibility (Guharoy and Chakrabarti, 2005) and the sequence conservation within these areas is calculated. All these properties have been described previously (Dey et al., 2012). The conserved residues are displayed in a separate plot.
ProDFace input
The user provides two main pieces of information to the program. First, a protein-DNA complex structure file in PDB (Berman et al., 2000) format is uploaded. The structure may contain one or more protein as well as DNA chains. The second information needed is the chain identifiers both for the protein and DNA, to be used for calculating the interface. The user can also provide a self generated multiple sequence alignment (MSA) of the query protein with its homologs, which is optional. If no alignment file is provided, the program generates the alignment using HSSP database (homology-derived secondary structure of proteins (Schneider et al., 1997)) of sequence-structure alignments.
Definition for different parameters and features
Briefly we define here the different characteristics that ProDFace investigates and we refer the reader to the original paper (Dey et al., 2012) where these properties have been described and benchmarked.
Interface atoms and residues
For each of the protein–DNA complex, residues residing at the interface are identified. Atoms/residues from both partners that lose >0.1 A2 of surface area upon complexation constitute the protein interface. Those residues that have at least one atom fully buried at the interface are referred as core of the interface; the remainder are referred as the rim, has a composition similar to the surface (Chakrabarti and Joël 2002; Janin et al., 2008).
Identification of conserved residues at the interface
The average sequence entropy for each interface with ‘n’ number of residues is calculated as:
Interface residues with sequence entropy lower than the average (<s> int ) were considered as conserved and their total number in each interface is denoted by Ncons. s(i) is the Shannon entropy of the aligned sequences at position i calculated from the MSA of the homologous proteins (Dey et al., 2012).
Potential hydrogen bond donors
Side-chain groups of positively charged amino acids such as arginine (PDB atom labels: NE, NH1, NH2), histidine (ND1, NE2) and lysine (NZ), as well as of asparagine (ND2), glutamine (NE2), tryptophan (NE1), serine (OG), threonine (OG1) and tyrosine (OH) with accessibility ≥10 Å2 are assumed to be capable of getting involved in hydrogen bonding with DNA and their number (Dp ) in each interface/patch is calculated.
Residue propensity score
Amino acid composition was used to calculate residue propensity score (Bahadur et al., 2004) given by
where ni is the number of residues of type i and pi is its propensity to be in the interface.
Interface water
Having identified the interface water molecules (those at a distance of ≼4.5Å from both protein and DNA molecule) we find out if they are hydrogen bonded to either of the components, or both (bridging water molecules), or only to other interface water.
The interface residues are spatially clustered using 20 Å as the default value (Biswas et al., 2009) of the distance, which can also be changed. The sequence entropy of the protein chain(s) is calculated either by using the local copy of the HSSP database (Schneider et al., 1997), or by using the MSA supplied by the user. The program uses 30% as the cutoff value for defining close homologs; one can provide even a higher value. In case of a protein-DNA complex whose HSSP file is unavailable (eg. for modelled structure), or the user desires to use his/her own MSA, it is possible to upload the same in FASTA format, the details are provided in the HELP link in the web-tool.
Test on docking decoys
The physico-chemical features (Rp, Dp and Ncons) described above were used to identify the DNA-binding region on the protein component and they performed very well (Dey et al., 2012). In order to further test the efficacy of the features, they were tested on several docking decoys of protein-DNA complexes. The decoy dataset was taken from Varani’s resource–course docking decoys (Robertson and Varani 2007) and were reconstructed by running Ftdock (Gabb et al., 1997). The decoy dataset, obtained from Gabriele Varani’s resource, contained 45 different entries. They are provided as FTDock output files, together with the FTDock parameters used in the original docking runs to minimize disk space. The PDB structures from these files were reconstructed using the ‘build’ program of the FTDock package. Among them 15 complexes were common to our dataset (Dey et al., 2012), for each of which we generated 100 decoys.
Results and discussion
Parameters and output files obtained from ProDFace
All the parameters, which are calculated, have already been defined in (Biswas et al., 2009; Dey et al., 2012) and explanations are also provided in the HELP file. The results are given in the form of tables, plots and downloadable text files. The first table provides information on 18 physicochemical and geometric properties of the whole interface, separately for the protein and the DNA components. The structure of the human NF-kappaB p52 homodimer-DNA complex (Cramer et al., 1997) is used as an example and the values are provided in Table 1. Other tabulated information are: 1) composition of the secondary structural elements, based on which the interface is classified as α, β, αβ or NR (non-regular) (Guharoy and Chakrabarti 2007); 2) dissection of the interface into core and rim regions, followed by the enumeration of the number of atoms, residues (or nucleotides) and interface areas contributed by them; 3) sequence entropies of the core and the rim (Table 2), with the core usually having a lower value (indicating a greater conservation among homologous proteins) than the rim (Guharoy and Chakrabarti 2005).
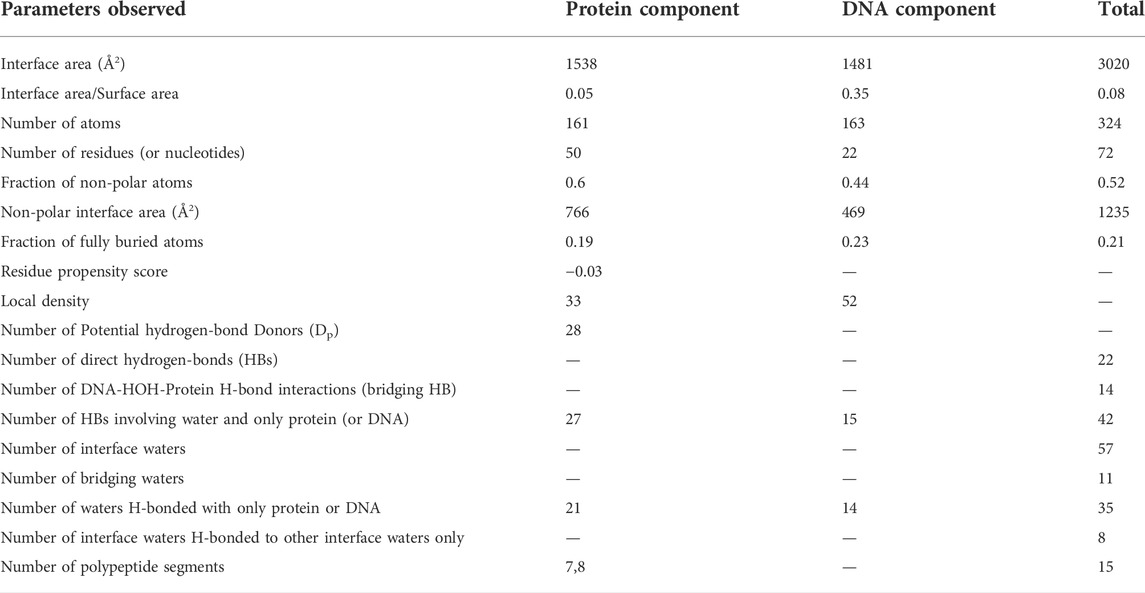
TABLE 1. Parameters for the interface in the human NF-kappaB p52 homodimer-DNA complex (PDB code, 1a3q).
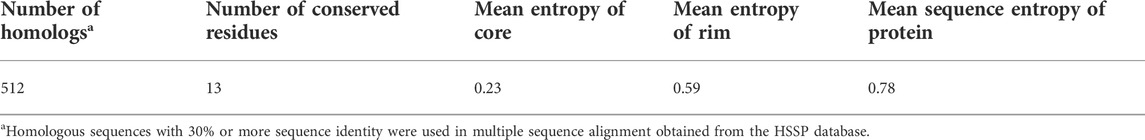
TABLE 2. Sequence entropy data for the interface residues in a subunit of human NF-kappaB p52 (PDB code, 1a3q).
Besides providing the physicochemical features of a protein-DNA interface in a given crystal structure (Tables 1, 2), the calculated parameters can also be used in identifying the most likely binding mode from among solutions provided by any docking program or among simulated conformations to represent a protein-DNA complex. Some of the parameters, such as the residue propensity score, potential hydrogen bond donors and the number of evolutionary conserved residues, have been shown to have high discriminatory power (Dey et al., 2012)—the correct solution is expected to have the highest value for all these parameters. While parameters such as the interface area, atoms, the number of hydrogen bonds, etc. would vary depending on the quality/resolution of the structure, others (notably the three mentioned above) may be more useful in locating the gross binding region even for structures of lower resolution, as shown below on applying to a number of docking decoys.
Among the different output files generated, the .int file contains the list of interacting residues and nucleotides across the interface; .ent file contains the Shannon entropies of interface residues representing evolutionary conservation; .ncons file contains the list of interface residues having entropies lower than the mean entropy of the whole interface (and these can be designated as conserved residues); .hbd file contains information about all possible hydrogen bond donor groups at the interface along with their accessible surfaces areas; .water file contains the information about all water-mediated hydrogen bonds between protein and DNA; and .cont files contain information about the nucleotides which are in contact with each of the protein residue, and vice versa (Pal et al., 2009). There are plots showing secondary structural segments along the sequence, for each of the protein chains; the interface residues (categorized as core or rim, or belonging to distinct interface patches) are indicated along the sequence. The distribution of the degree of conservation among residues, being colored according to their entropies, is shown in another plot (Figure 2A) by projecting the interface residues down the shortest axis. The same axis is also used to project and display the bound DNA–this enables the visualization of the relative positions of the two components (the cartoon representation of which is given in Figure 2B across the interface.
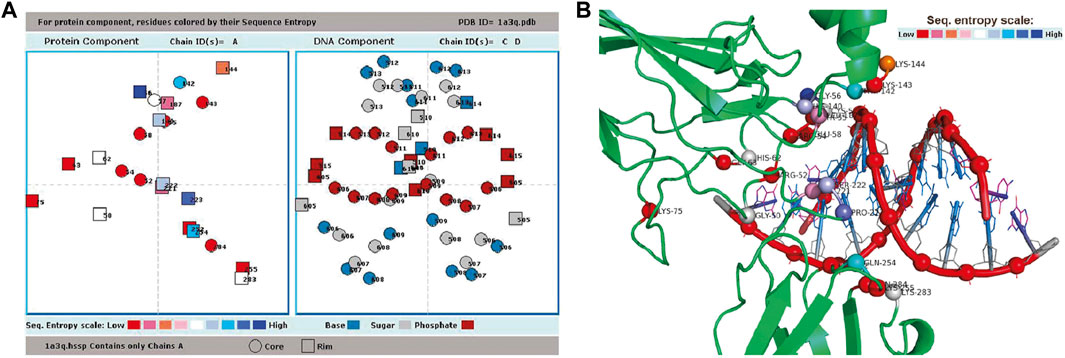
FIGURE 2. Result page of ProDFace. (A) Plot showing relative positions of the residues from one subunit (whose sequence entropies are shown color-coded, and also as circles and squares, depending on their location in core and rim, respectively) and nucleotides (separated into base, sugar and phosphate, shown in three distinct colors, and also distinguished into core and rim) in the file 1a3q.pdb (human NF-kappaB p52 homodimer-DNA complex as input). (B) Cartoon representation of human NF-kappaB p52 homodimer-DNA complex (PDB code, 1a3q, only one subunit shown), approximately in the orientation used in Figure 2A for displaying interface residues and nucleotides. Interface Cα atoms are shown as spheres and colored according to sequence entropy. DNA backbone is shown in red (phosphate in sphere), whereas base and sugar are shown in blue and gray sticks, respectively. Figure made using pymol (http://www.pymol.org).
Application to docking decoys
All the features mentioned above were calculated for all the docking decoys and these, along with the values for the actual interface, were ranked. The interface was ranked #1 if it occurred within the top 10% of all the decoys (Supplementary Figure S1). There were instances with more than 90% overlap (residue wise) between the decoy and the actual interface. In these cases the feature incorporating amino acid composition (Rp), which has been by far the best discriminator (Dey et al., 2012), did not perform well, identifying the interface as rank #1 in only 53.3% cases (Supplementary Figure S1C). Interestingly, even in these cases the hydrogen bond donor potential (Dp) performed notably well, discriminating the actual interface from a decoy having 94% overlapping residues. The reason behind this may be Dp is not merely a frequency of possible donor groups at the binding region, but an area criterion is also incorporated in its definition (only those with accessibility ≥10 Å2 are counted) (Dey et al., 2012). In these decoys even if the interface is the same as the real one in terms of residues, the appropriate donor atoms (which account to Dp) may be missing. As a result, for the real binding region there are more number of solvent exposed donor atoms capable of forming hydrogen bonds with DNA.
To see if the performance of Rp improves on removing the overlaps, we gradually removed the overlaps and re-ranked all at various percentages of overlaps, such as 50, 20, 10 and 0%. We found that at 10% overlap the performance of Rp improved considerably and it could identify the actual interface among the decoys, ranking it as 1 in 66% cases (Supplementary Figure S1A). At 0% overlap (i.e. no common residues) Rp performed the best, identifying 73% of the actual interfaces correctly as rank 1, with all but one in the top 3 ranks (Supplementary Figure S2). The lone entry (PDB: 1je8) for which Rp failed was found to have a very negative propensity score for the real interface itself and hence it could not be distinguished by amino acid propensity criterion, whereas it was ranked 1 by Dp. Dp identified 86% interfaces as rank 1 in the category of 0% overlap as well. There is only one entry (PDB: 2bop) for which Dp could not rank the actual interface in top 3, this however was ranked 1 by Rp. So, it seems that Dp and Rp complement each other and in all the entries the interface patch is ranked 1 by more than one parameter; as such there is no single entry whose interface cannot be discriminated from the decoys by any of the features defined by us. Performance of Ncons is also comparable to that of Rp but when overall top 3 rankings are considered Rp outperforms Ncons (Supplementary Figure S2). All the rankings at different percentage cutoffs of overlap—10, 50 and 100% are provided in Supplementary Figure S1. Results for 20 and 10% are similar, hence only data for 10% is shown.
Conclusion
We describe a web-tool, ProDFace that enables researchers to upload structures obtained from experimental methods, docking programs, or derived from simulation, for analysis. The program derives the overall characteristics of the binding region of a protein-DNA complex structure, in particular of the protein component.
Targeting protein-DNA complexes with small molecule inhibitors is difficult compared to protein-protein complexes. Recent developments in computer-aided drug discovery approaches are using key oncogenic transcription factors and have developed candidate inhibitors targeting the DNA binding region, are presently under clinical trials (Radaeva et al., 2021). Now, with the proteome wide increase in macromolecule structural data initiated by ALPHAFOLD (Jumper et al., 2021), it is anticipated that they would also come up with protein-DNA complex models. In all these cases, ProDFace pipeline can be efficiently used to study binding region characteristics specifically interactions, geometry, hydration and sequence conservation.
Further, understanding the various features that characterize protein-DNA interfaces would help us develop empirical algorithms that can identify the DNA-binding patch in protein structures (Jones et al., 2003; Stawiski et al., 2003; Paillard and Lavery 2004; Dey et al., 2012). The top solutions of protein-DNA complex structures obtained from the available docking and prediction programs can be cross validated with the help of ProDFace. Docking decoys are normally used to test complex scoring functions that are implemented in the docking algorithms. Our simple single statistical features performed quite satisfactorily in comparison to the various scoring functions that are rigorously generated. Thus the properties generated by the web-tool can be crucial in developing scoring functions for protein-DNA docking algorithms that are still in the developing stage. Likewise, the ProDFace tool can also be used to judge the stability of any protein-DNA complex conformation obtained from all-atom simulations. Present version of ProDFace is built dedicatedly for the analysis of protein-dsDNA complexes. Our approach, however, is general enough and currently the web-tool also supports structures of proteins bound to RNA or ssDNA for the analysis. In the future, we will include specific features for protein-RNA as well as protein-ssDNA complexes. Furthermore, the program presently takes a single input, batch upload service of multiple structures will also be one of the future implementations.
Data availability statement
Publicly available datasets were analyzed in this study. This data can be found here: We refer the reader to read the original paper (Dey et al., 2012; PMID: 22641851) where the properties used here, have been described and benchmarked. Also, important source codes of the program are available at https://github.com/sdeyLab-IITJ/ProDFace
Author contributions
AP, SD, and PC conceived the study, and participated in its design, analysis, and coordination. AP and SD participated in developing the software. AP wrote the source codes. AP, SD, and PC contributed to writing the final manuscript and interpretation of data.
Funding
This work was supported by the research grant from the Department of Biotechnology, Govt. India (RLS grant to SD: BT/RLF/Re-entry/10/2020, sacntion order serial number 145) and are gratefully acknowledged.
Acknowledgments
PC is acknowledging the JC Bose fellowship from the Department of Science and Technology, India and is a recipient of the Raja Ramanna Fellowship of the Department of Atomic Energy.
Conflict of interest
The authors declare that the research was conducted in the absence of any commercial or financial relationships that could be construed as a potential conflict of interest.
Publisher’s note
All claims expressed in this article are solely those of the authors and do not necessarily represent those of their affiliated organizations, or those of the publisher, the editors and the reviewers. Any product that may be evaluated in this article, or claim that may be made by its manufacturer, is not guaranteed or endorsed by the publisher.
Supplementary material
The Supplementary Material for this article can be found online at: https://www.frontiersin.org/articles/10.3389/fmolb.2022.978310/full#supplementary-material
References
Ahmad, S., Gromiha, M. M., and Sarai, A. (2004). Analysis and prediction of DNA-binding proteins and their binding residues based on composition, sequence and structural information. Bioinformatics 20 (4), 477–486. doi:10.1093/bioinformatics/btg432
Ahmad, S., Keskin, O., Sarai, A., and Nussinov, R. (2008). Protein-DNA interactions: Structural, thermodynamic and clustering patterns of conserved residues in DNA-binding proteins. Nucleic Acids Res. 36 (18), 5922–5932. doi:10.1093/nar/gkn573
Bahadur, R. P., Chakrabarti, P., Rodier, F., and Janin, J. (2004). A dissection of specific and non-specific protein-protein interfaces. J. Mol. Biol. 336 (4), 943–955. doi:10.1016/j.jmb.2003.12.073
Berman, H. M., Westbrook, J., Feng, Z., Gilliland, G., Bhat, T. N., Weissig, H., et al. (2000). The protein Data Bank. Nucleic Acids Res. 28 (1), 235–242. doi:10.1093/nar/28.1.235
Biswas, S., Guharoy, M., and Chakrabarti, P. (2009). Dissection, residue conservation, and structural classification of protein-DNA interfaces. Proteins 74 (3), 643–654. doi:10.1002/prot.22180
Chakrabarti, P., and Joël, J. (2002). Dissecting protein-protein recognition sites. Proteins 47, 334–343. doi:10.1002/prot.10085
Corona, R. I., and tao Guo, J. (2016). Statistical analysis of structural determinants for protein–DNA‐binding specificity. Proteins 84, 1147–1161. doi:10.1002/prot.25061
Cramer, P., Larson, C. J., Verdine, G. L., and Müller, C. W. (1997). Structure of the human NF-kappaB p52 homodimer-DNA complex at 2.1 A resolution. EMBO J. 16 (23), 7078–7090. doi:10.1093/emboj/16.23.7078
Dey, S., Pal, A., Guharoy, M., Sonavane, S., and Chakrabarti, P. (2012). Characterization and prediction of the binding site in DNA-binding proteins: Improvement of accuracy by combining residue composition, evolutionary conservation and structural parameters. Nucleic Acids Res. 40 (15), 7150–7161. doi:10.1093/nar/gks405
Gabb, H. A., Jackson, R. M., and Sternberg, M. J. (1997). Modelling protein docking using shape complementarity, electrostatics and biochemical information. J. Mol. Biol. 272 (1), 106–120. doi:10.1006/jmbi.1997.1203
Guharoy, M., and Chakrabarti, P. (2005). Conservation and relative importance of residues across protein-protein interfaces. Proc. Natl. Acad. Sci. U. S. A. 102 (43), 15447–15452. doi:10.1073/pnas.0505425102
Guharoy, M., and Chakrabarti, P. (2007). Secondary structure based analysis and classification of biological interfaces: Identification of binding motifs in protein–protein interactions. Bioinformatics 23, 1909–1918. doi:10.1093/bioinformatics/btm274
Guharoy, M., Pal, A., Dasgupta, M., and Chakrabarti, P. (2011). PRICE (PRotein interface conservation and energetics): A server for the analysis of protein–protein interfaces. J. Struct. Funct. Genomics 12, 33–41. doi:10.1007/s10969-011-9108-0
Harini, K., Srivastava, A., Kulandaisamy, A., and Michael Gromiha, M. (2022). ProNAB: Database for binding affinities of protein–nucleic acid complexes and their mutants. Nucleic Acids Res. 50, D1528–D1534. doi:10.1093/nar/gkab848
Hubbard, S. J. (1992). NACCESS: Program for calculating accessibilities. London, United Kingdom: Department of Biochemistry and Molecular Biology, University College of London.
Janin, J., Bahadur, R. P., and Chakrabarti., P. (2008). Protein-protein interaction and quaternary structure. Q. Rev. Biophys. 41 (2), 133–180. doi:10.1017/S0033583508004708
Jones, S., Shanahan, H. P., Berman, H. M., and Thornton, J. M. (2003). Using electrostatic potentials to predict DNA-binding sites on DNA-binding proteins. Nucleic Acids Res. 31 (24), 7189–7198. doi:10.1093/nar/gkg922
Jones, S., van Heyningen, P., Berman, H. M., and Thornton, J. M. (1999). Protein-DNA interactions: A structural analysis. J. Mol. Biol. 287 (5), 877–896. doi:10.1006/jmbi.1999.2659
Jumper, J., Evans, R., Alexander, P., Green, T., Figurnov, M., Ronneberger, O., et al. (2021). Highly accurate protein structure prediction with AlphaFold. Nature 596 (7873), 583–589. doi:10.1038/s41586-021-03819-2
Kabsch, W., and Sander, C. (1983). Dictionary of protein secondary structure: Pattern recognition of hydrogen-bonded and geometrical features. Biopolymers 22 (12), 2577–2637. doi:10.1002/bip.360221211
Kim, R., and Guo, J. T. (2009). PDA: An automatic and comprehensive analysis program for protein-DNA complex structures. BMC Genomics 10 (7), S13. doi:10.1186/1471-2164-10-S1-S13
Kuznetsov, I. B., Gou, Z., Li, R., and Hwang, S. (2006). Using evolutionary and structural information to predict DNA-binding sites on DNA-binding proteins. Proteins 64 (1), 19–27. doi:10.1002/prot.20977
Laskowski, R. A. (1995). Surfnet: A program for visualizing molecular surfaces, cavities, and intermolecular interactions. J. Mol. Graph. 13 (5323–30), 323–330, 307-308. doi:10.1016/0263-7855(95)00073-9
Lee, S., and Blundell, T. L. (2009). Bipa: A database for protein-nucleic acid interaction in 3D structures. Bioinformatics 25 (12), 1559–1560. doi:10.1093/bioinformatics/btp243
Luscombe, N. M., Laskowski, R. A., and Thornton, J. M. (2001). Amino acid-base interactions: A three-dimensional analysis of protein-DNA interactions at an atomic level. Nucleic Acids Res. 29 (13), 2860–2874. doi:10.1093/nar/29.13.2860
Luscombe, N. M., and Thornton, J. M. (2002). Protein-DNA interactions: Amino acid conservation and the effects of mutations on binding specificity. J. Mol. Biol. 320 (5), 991–1009. doi:10.1016/s0022-2836(02)00571-5
Mandel-Gutfreund, Y., and Margalit, H. (1998). Quantitative parameters for amino acid-base interaction: Implications for prediction of protein-DNA binding sites. Nucleic Acids Res. 26 (10), 2306–2312. doi:10.1093/nar/26.10.2306
McDonald, I. K., and Thornton, J. M. (1994). Satisfying hydrogen bonding potential in proteins. J. Mol. Biol. 238 (5), 777–793. doi:10.1006/jmbi.1994.1334
Mirny, L. A., and Gelfand, M. S. (2002). Structural analysis of conserved base pairs in protein-DNA complexes. Nucleic Acids Res. 30 (7), 1704–1711. doi:10.1093/nar/30.7.1704
Nadassy, K., Wodak, S. J., and Janin, J. (1999). Structural features of protein-nucleic acid recognition sites. Biochemistry 38 (7), 1999. doi:10.1021/bi982362d
Norambuena, T., and Melo, F. (2010). The protein-DNA interface database. BMC Bioinforma. 11 (5), 262. doi:10.1186/1471-2105-11-262
Paillard, G., and Lavery, R. (2004). Analyzing protein-DNA recognition mechanisms. Structure 12, 113–122. doi:10.1016/j.str.2003.11.022
Pal, A., Bahadur, R. P., Ray, P. S., and Chakrabarti, P. (2009). Accessibility and partner number of protein residues, their relationship and a webserver, ContPlot for their display. BMC Bioinforma. 10, 103. doi:10.1186/1471-2105-10-103
Pal, A., and Levy, Y. (2020). Balance between asymmetry and abundance in multi-domain DNA-binding proteins may regulate the kinetics of their binding to DNA. PLoS Comput. Biol. 16, e1007867. doi:10.1371/journal.pcbi.1007867
Radaeva, M., Ton, A. T., Hsing, M., Ban, F., and Cherkasov, A. (2021). Drugging the ‘undruggable’. Therapeutic targeting of protein–DNA interactions with the use of computer-aided drug discovery methods. Drug Discov. Today 26, 2660–2679. doi:10.1016/j.drudis.2021.07.018
Reddy, C. K., Das, A., and Jayaram, B. (2001). Do water molecules mediate protein-DNA recognition? 1 1Edited by B. Honig. J. Mol. Biol. 314, 619–632. doi:10.1006/jmbi.2001.5154
Robertson, T. A., and Varani., G. (2007). An all-atom, distance-dependent scoring function for the prediction of protein-DNA interactions from structure. Proteins 66 (2), 359–374. doi:10.1002/prot.21162
Sagendorf, J. M., Berman, H. M., and Rohs, R. (2017). DNAproDB: An interactive tool for structural analysis of DNA-protein complexes. Nucleic Acids Res. 45 (W1), W89–W97. doi:10.1093/nar/gkx272
Saha, R. P., Bahadur, R. P., Pal, A., Mandal, S., and Chakrabarti, P. (2006). ProFace: A server for the analysis of the physicochemical features of protein-protein interfaces. BMC Struct. Biol. 6 (6), 11. doi:10.1186/1472-6807-6-11
Sarai, A., and Kono, H. (2005). Protein-DNA recognition patterns and predictions. Annu. Rev. Biophys. Biomol. Struct. 34, 379–398. doi:10.1146/annurev.biophys.34.040204.144537
Schneider, R., de Daruvar, A., and Sander, C. (1997). The HSSP database of protein structure-sequence alignments. Nucleic Acids Res. 25 (1), 226–230. doi:10.1093/nar/25.1.226
Stawiski, E. W., Gregoret, L. M., and Mandel-Gutfreund, Y. (2003). Annotating nucleic acid-binding function based on protein structure. J. Mol. Biol. 326 (4), 1065–1079. doi:10.1016/s0022-2836(03)00031-7
Steitz, T. A. (1990). Structural studies of protein-nucleic acid interaction: The sources of sequence-specific binding. Q. Rev. Biophys. 23 (3), 205–280. doi:10.1017/s0033583500005552
Vangone, A., Spinelli, R., Scarano, V., Cavallo, L., and Oliva, R. (2011). Cocomaps: A web application to analyze and visualize contacts at the interface of biomolecular complexes. Bioinformatics 27 (20), 2915–2916. doi:10.1093/bioinformatics/btr484
Keywords: protein-DNA interactions, sequence conservation, interface core and rim, hydrogen bond, docking, Protein-DNA complexes
Citation: Pal A, Chakrabarti P and Dey S (2022) ProDFace: A web-tool for the dissection of protein-DNA interfaces. Front. Mol. Biosci. 9:978310. doi: 10.3389/fmolb.2022.978310
Received: 25 June 2022; Accepted: 09 August 2022;
Published: 06 September 2022.
Edited by:
Jessica Andreani, UMR9198 Institut de Biologie Intégrative de la Cellule (I2BC), FranceReviewed by:
Rong Liu, Huazhong Agricultural University, ChinaMichael Gromiha, Indian Institute of Technology Madras, India
Junfeng Xia, Anhui University, China
Copyright © 2022 Pal, Chakrabarti and Dey. This is an open-access article distributed under the terms of the Creative Commons Attribution License (CC BY). The use, distribution or reproduction in other forums is permitted, provided the original author(s) and the copyright owner(s) are credited and that the original publication in this journal is cited, in accordance with accepted academic practice. No use, distribution or reproduction is permitted which does not comply with these terms.
*Correspondence: Sucharita Dey, c2RleUBpaXRqLmFjLmlu