 Nikita Bhandari
 Rahee Walambe2,3*
 Ketan Kotecha
 Satyajeet P. Khare
- 1Computer Science Department, Symbiosis Institute of Technology, Symbiosis International (Deemed University), Pune, India
- 2Electronics and Telecommunication Department, Symbiosis Institute of Technology, Symbiosis International (Deemed University), Pune, India
- 3Symbiosis Center for Applied AI (SCAAI), Symbiosis International (Deemed University), Pune, India
- 4Symbiosis School of Biological Sciences, Symbiosis International (Deemed University), Pune, India
Computational analysis methods including machine learning have a significant impact in the fields of genomics and medicine. High-throughput gene expression analysis methods such as microarray technology and RNA sequencing produce enormous amounts of data. Traditionally, statistical methods are used for comparative analysis of gene expression data. However, more complex analysis for classification of sample observations, or discovery of feature genes requires sophisticated computational approaches. In this review, we compile various statistical and computational tools used in analysis of expression microarray data. Even though the methods are discussed in the context of expression microarrays, they can also be applied for the analysis of RNA sequencing and quantitative proteomics datasets. We discuss the types of missing values, and the methods and approaches usually employed in their imputation. We also discuss methods of data normalization, feature selection, and feature extraction. Lastly, methods of classification and class discovery along with their evaluation parameters are described in detail. We believe that this detailed review will help the users to select appropriate methods for preprocessing and analysis of their data based on the expected outcome.
1 Introduction
A genome is a complete set of genes in an organism. Genomics is a study of the information structure and function programmed in the genome. Genomics has applications in multiple fields, including medicine (Chen et al., 2018; Lai et al., 2020; Huang et al., 2021), agriculture (Abberton et al., 2016; Parihar et al., 2022), industrial biotechnology (Alloul et al., 2022), synthetic biology (Baltes and Voytas, 2015), etc. Researchers working in these domains create and use a variety of data such as DNA, RNA, and protein sequences, gene expression, gene ontology, protein-protein interactions (PPI), etc.
Genomics data can be broadly classified into sequence and numeric data (e.g., gene expression matrix). The DNA sequence information can be determined by first generation (Sanger, Nicklen and Coulson, 1977), second generation sequencing (Margulies et al., 2005; Shendure et al., 2005; Bentley et al., 2008; Valouev et al., 2008) or third generation sequencing (Harris et al., 2008; Eid et al., 2009; Eisenstein, 2012; Rhoads and Au, 2015) methods. The second and third generation sequencing are together referred to as Next Generation Sequencing (NGS). Applications of DNA sequence analysis include prediction of protein sequence and structure, molecular phylogeny, identification of intrinsic features, sequence variations, etc. Common implementations of these applications include splice site detection (Nguyen et al., 2016; Fernandez-Castillo et al., 2022), promoter prediction (Umarov and Solovyev, 2017; Bhandari et al., 2021), classification of diseased related genes (Peng, Guan and Shang, 2019; Park, Ha and Park, 2020), identification of protein binding sites (Pan and Yan, 2017; Uhl et al., 2021), biomarker discovery (Arbitrio et al., 2021; Frommlet et al., 2022), etc. The numeric data often generated from functional genomics studies include gene expression, single nucleotide polymorphism (SNP), DNA methylation, etc. Microarray and NGS technologies are the tools of choice for functional genomics studies. The functional genomics that deals with high-throughput study of gene expression is referred to as transcriptomics.
Gene expression data, irrespective of the platform used (e.g., microarray, NGS, etc.), contains the expression levels of thousands of genes experimentally evaluated in various conditions. Gene expression analysis helps us understand gene networks and molecular pathways. Gene expression information can be utilized for basic as well as clinical research (Behzadi, Behzadi and Ranjbar, 2014; Chen et al., 2016; Karthik and Sudha, 2018; Kia et al., 2021). In disease biology, gene expression analysis provides an excellent tool to study the molecular basis of disease as well as the identification of markers for diagnosis, prognosis, and drug discovery. Therefore, for this review, we will focus on computational methods in the analysis of gene expression data.
The data produced by microarray as well as NGS-based RNA sequencing goes through multiple phases of quality check before analysis. This data is further transmuted to a numerical matrix (Figure 1) where rows and columns represent genes and samples. The numeric value in each cell of a matrix links the expression level of a specific feature gene to a particular sample. The expression matrix is generally a flat dataset as the number of features is very high compared to the number of samples. Some of the standard DNA microarray platforms available are Affymetrix (Pease et al., 1994), Agilent (Blanchard, Kaiser and Hood, 1996), etc. Some of the standard commercial NGS platforms are Illumina (Bentley et al., 2008), Ion torrent (Rothberg et al., 2011) etc. The massive amount of data generated from publicly funded research is available through open access repositories such as Gene Expression Omnibus (GEO), ArrayExpress, Genomic Expression Archive (GEA), etc. (Table 1).
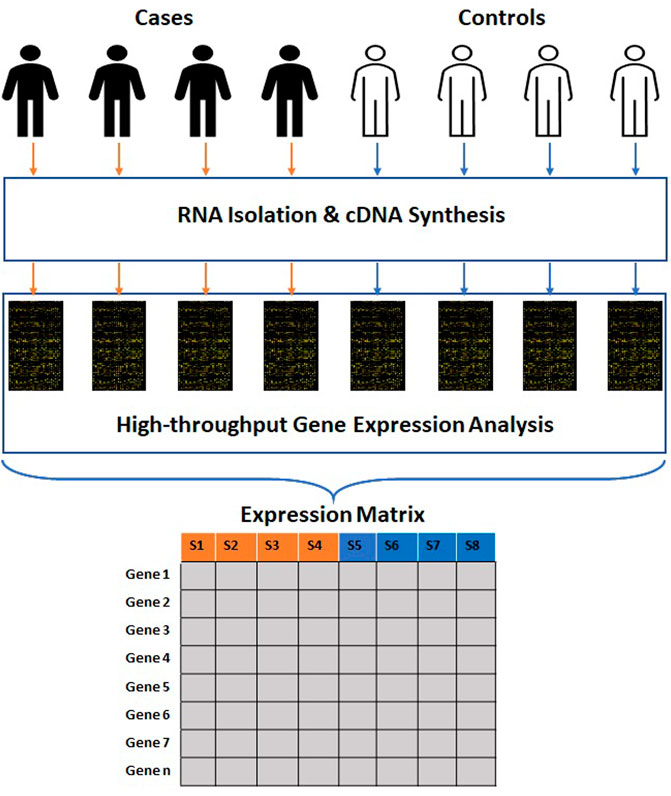
FIGURE 1. Process of generation of high-throughput gene expression data. The clinical samples are subjected to RNA isolation and cDNA synthesis. The cDNAs are subjected to high-throughput gene expression analysis. The raw data obtained from these methods is further transmuted into a numerical matrix where rows and columns represent genes and samples.
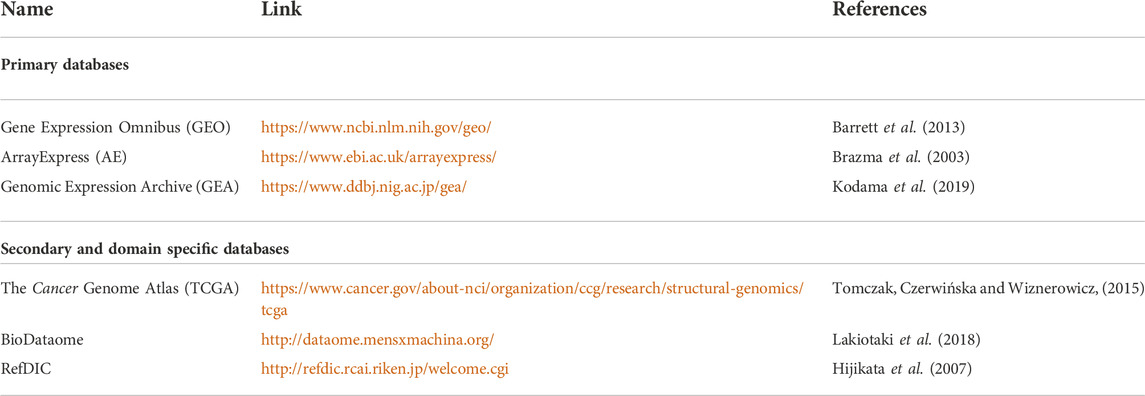
TABLE 1. Expression array repositories.
Identification of differentially expressed genes is the most common application in gene expression analysis. This type of class comparison analysis can be achieved using basic statistical techniques, for example, chi-squared test, t-test, ANOVA, etc. (Segundo-Val and Sanz-Lozano 2016). Commonly used packages for microarray-based gene expression analysis include limma (Smyth, 2005), affy (Gautier et al., 2004), lumi (Du, Kibbe and Lin, 2008), oligo (Carvalho and Irizarry, 2010); whereas, those for RNA sequencing analysis include EdgeR (Robinson, McCarthy and Smyth, 2009) and DESeq2 (Love, Huber and Anders, 2014). The classification and regression problems on the other hand depend on classical linear and logistic regression analysis. However, the data typically generated by the transcriptomic technologies creates a need for penalized or modified prospects as a solution to the problems of high dimensionality and overfitting (Turgut, Dagtekin and Ensari, 2018; Morais-Rodrigues et al., 2020; Tabares-Soto et al., 2020; Abapihi et al., 2021). The development of high-end computational algorithms, such as machine learning techniques, has created a new dimension for gene expression analysis.
Machine learning (ML) is an artificial intelligence-based approach that emphasizes building a system that learns automatically from data and improves performance without being explicitly programmed. ML models are trained using a significant amount of data to find hidden patterns required to make decisions (Winston, 1992; Dick, 2019; Micheuz, 2020). Artificial Neural Network (ANN), Classification and regression Trees (CART), Support vector machine (SVM), and vector quantization are some of the architectures used in ML. Recent advancement in the ML domain is deep learning (DL) which is based on artificial neural networks (ANN) (Deng and Yu, 2014; LeCun, Bengio and Hinton, 2015). ANN architectures comprise input, hidden, and output layers of neurons. When more than one hidden layer is used, the ANN method is referred to as the DL method. Basic ML and DL models can work on lower-end machines with less computing power; however, DL models require more powerful hardware to process vast and complex data.
ML techniques, in general, are broadly categorized into supervised and unsupervised learning methods (Jenike and Albert, 1984; Dayan, 1996; Kang and Jameson, 2018; Yuxi, 2018). Supervised learning, which makes use of well-labelled data, is applied for classification and regression analysis. A labelled dataset is used for the training process, which later produces an inferred function to make predictions about unknown instances. Classification techniques train the model to separate the input into different categories or labels (Kotsiantis, 2007). Regression techniques train the model and predict continuous numerical value as an output based on input variables (Fernández-Delgado et al., 2019). Unsupervised techniques, on the other hand, let the model discover information or unknown patterns from the data. We can roughly divide unsupervised learning into clustering and association rules. Clustering used for class discovery is the task of grouping a set of instances in such a way that samples in the same group or cluster are more similar in their properties than the samples in other groups or clusters. Association rules associate links between data instances inside large databases (Kotsiantis and Kanellopoulos, 2006).
The supervised ML techniques have been used for binary classification e.g., identification of cases in clinical studies, as well as multiclass classification analysis e.g., grading and staging of the disease. ML techniques have been extensively used to analyze gene expression patterns in various complex diseases, such as cancer (Sharma and Rani, 2021), Parkinson’s Disease (Peng, Guan and Shang, 2019), Alzheimer’s disease (Kong, Mou and Hu, 2011; Park, Ha and Park, 2020), diabetes (Li, Luo and Wang, 2019), arthritis (Liu et al., 2009; Zhang et al., 2020), etc. The classification algorithms have also contributed to biomarker identification (Jagga and Gupta, 2015), precision treatment (Toro-Domínguez et al., 2019), drug toxicity evaluation (Vo et al., 2020) etc. The unsupervised learning techniques for clustering are routinely used in transcriptomics. The clustering analysis is applied for the study of expression relationships between genes (Liu, Cheng and Tseng, 2011), extracting biologically relevant expression features (Kong et al., 2008), discovering frequent determinant patterns (Prasanna, Seetha and Kumar, 2014), etc.
In supervised and unsupervised learning, the data is subjected to preprocessing, e.g., missing value imputation, normalization, etc. (Figure 2). In supervised learning for classification analysis, the entire dataset is divided into two subsets viz. training and testing/validation. The training dataset, which typically comprises 70–80% of the samples, is used for the construction of a model. The training data can first be subjected to missing value imputation and feature scaling. The preprocessed data is then subjected to feature selection/extraction and model development. The model is then applied to the test/validation dataset, which is also preprocessed in a similar fashion. The preprocessing and feature selection steps are applied to the training dataset after the train-test split to avoid “data leakage”. The unsupervised learning which is based on unlabeled data, may include preprocessing steps and data-driven techniques for feature reduction.

FIGURE 2. Steps involved in preprocessing and analysis of gene expression data. The raw gene expression data may get subjected to missing value imputation, normalization, and feature reduction depending on the type of analysis.
Though missing value imputation, normalization, feature selection, and modelling are important steps in classification analysis, there appears to be very limited literature that reviews them together. Most of the reviews focus either on missing value imputation, features selection, or learning/modelling (Quackenbush, 2001; Dudoit and Fridlyannnd, 2005; Chen et al., 2007; Liew, Law and Yan, 2011; Sahu, Swarnkar and Das, 2011; Yip, Amin and Li, 2011; Khatri, Sirota and Butte, 2012; Tyagi and Mishra, 2013; Bolón-Canedo et al., 2014; Li et al., 2015; Manikandan and Abirami, 2018; Hambali, Oladele and Adewole, 2020; Zhang, Jonassen and Goksøyr, 2021). This creates gaps in understanding of the complete pipeline of the analysis process for researchers from different domains. The objective of this review is to bridge these gaps. Here we discuss various ways to analyze gene expression data and computational methods used at each step. Through this comprehensive review, we also discuss the need for interpretability to provide insights and bring trust to the predictions made. The review is organized into 6 sections. Section 2 broadly covers different missing value imputation approaches along with their advantages and limitations. Section 3 discusses feature scaling techniques applied to gene expression data. In Section 4, broad categories of feature selection and dimensionality reduction techniques are discussed. Section 5 covers the different types of gene expression analyses, including class comparison, classification (class prediction), and class discovery. In Section 6, we discuss conclusions and future directions.
2 Missing value imputation
Gene expression matrices are often riddled with missing gene expression values due to various reasons. In this section, we will discuss sources of missing values and various computational techniques utilized to perform the imputation of missing values. Missing data are typically grouped into three categories: Missing Completely At Random (MCAR), Missing At Random (MAR), and Missing Not At Random (MNAR) (Rubin, 1976; Schafer and Graham, 2002; Aydilek and Arslan, 2013; Mack, Su and Westreich, 2018) (Figure 3). In MCAR, the missing data is independent of their unobserved values and independent of the observed data. In other words, the data is completely missing at random, independent of the nature of the investigation. MAR is a more general class of MCAR where conditional dependencies are accounted for. In MAR, the missingness of data is random but conditionally dependent on observed and unobserved values. In transcriptomics, it can be assumed that all MAR values are also MCAR (Lazar et al., 2016); for example, a channel signal obscured accidentally by a dust particle. However, in meta-analysis, a missing value can be attributable to a specific dataset due to its architecture. In this case, the missing values are MAR and not MCAR. In MNAR, the missingness depends on the observed and/or unobserved data. In microarray analysis, values missing due to their low signal intensities are an example of MNAR data.
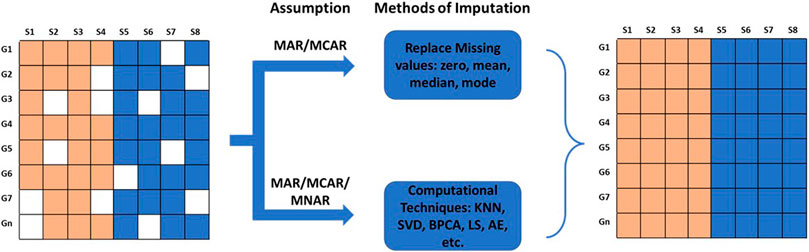
FIGURE 3. Types of missing data and methods of imputation for missing values. The missing values can be Missing Completely At Random (MCAR), Missing At Random (MAR), or Missing Not At Random (MNAR). The missing values are imputed by fixed values; by mean, mode, or median; or by values estimated using advanced computational methods.
Missing values can be imputed using two different approaches. MCAR/MAR values are either embedded with a fixed value, or mean, median, or mode. However, this method creates lots of similar values if missing data is high. MCAR/MAR and MNAR values can be imputed using advanced computational techniques. The choice of imputation method depends on the accuracy of the results obtained from the downstream analysis. Computational techniques for estimating missing values can be categorized into four different approaches: Global, Local, Hybrid, and Knowledge Assisted (García-Laencina et al., 2008; Moorthy et al., 2019; Farswan et al., 2020) (Table 2).
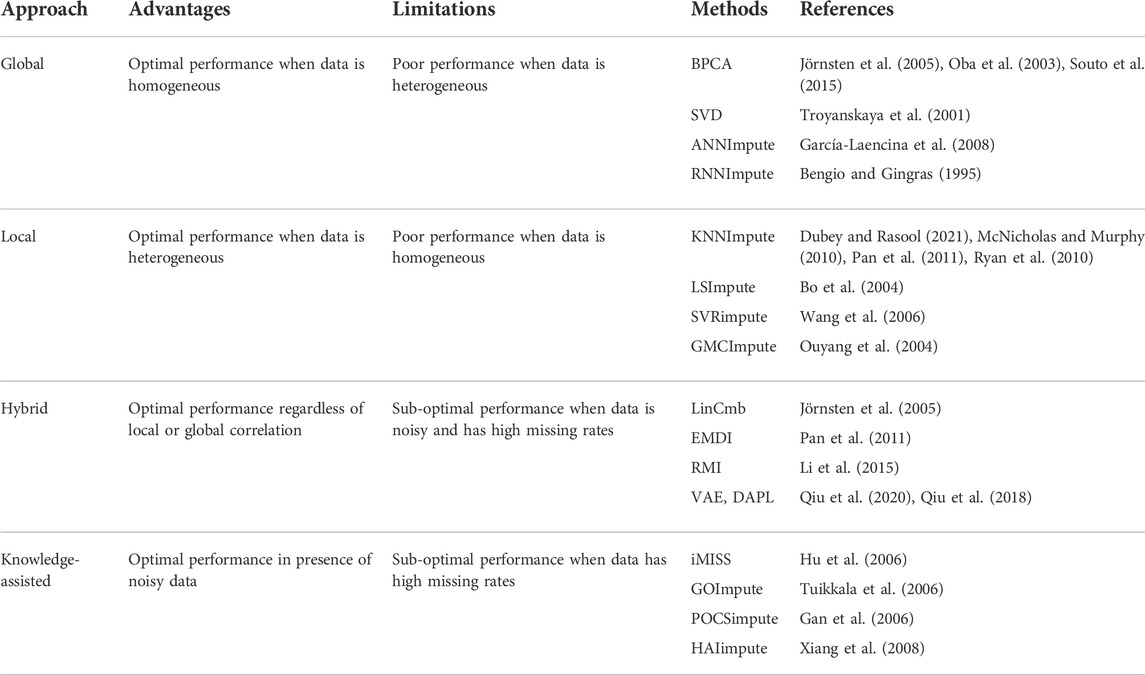
TABLE 2. Various approaches of missing value imputation.
2.1 Global approaches
Global approaches assume homogeneity of data and use global correlation information extracted from the entire data matrix to estimate missing values. The Bayesian framework for Principal Component Analysis (BPCA) is based on a probabilistic model that can handle large variations in the expression matrix (Oba et al., 2003; Jörnsten et al., 2005; Souto, Jaskowiak and Costa, 2015). In BPCA, the missing value is replaced with a set of random values that are estimated using the Bayesian principle to obtain the relevant principal axes for regression. Singular Value Decomposition (SVD) is another global approach for missing value imputation. SVD is a matrix decomposition method for reducing a matrix to its three constituent parts (Figure 4A). A new matrix that is similar to the original matrix is reconstructed using these constituents in order to reduce noise and impute missing values (Troyanskaya et al., 2001).
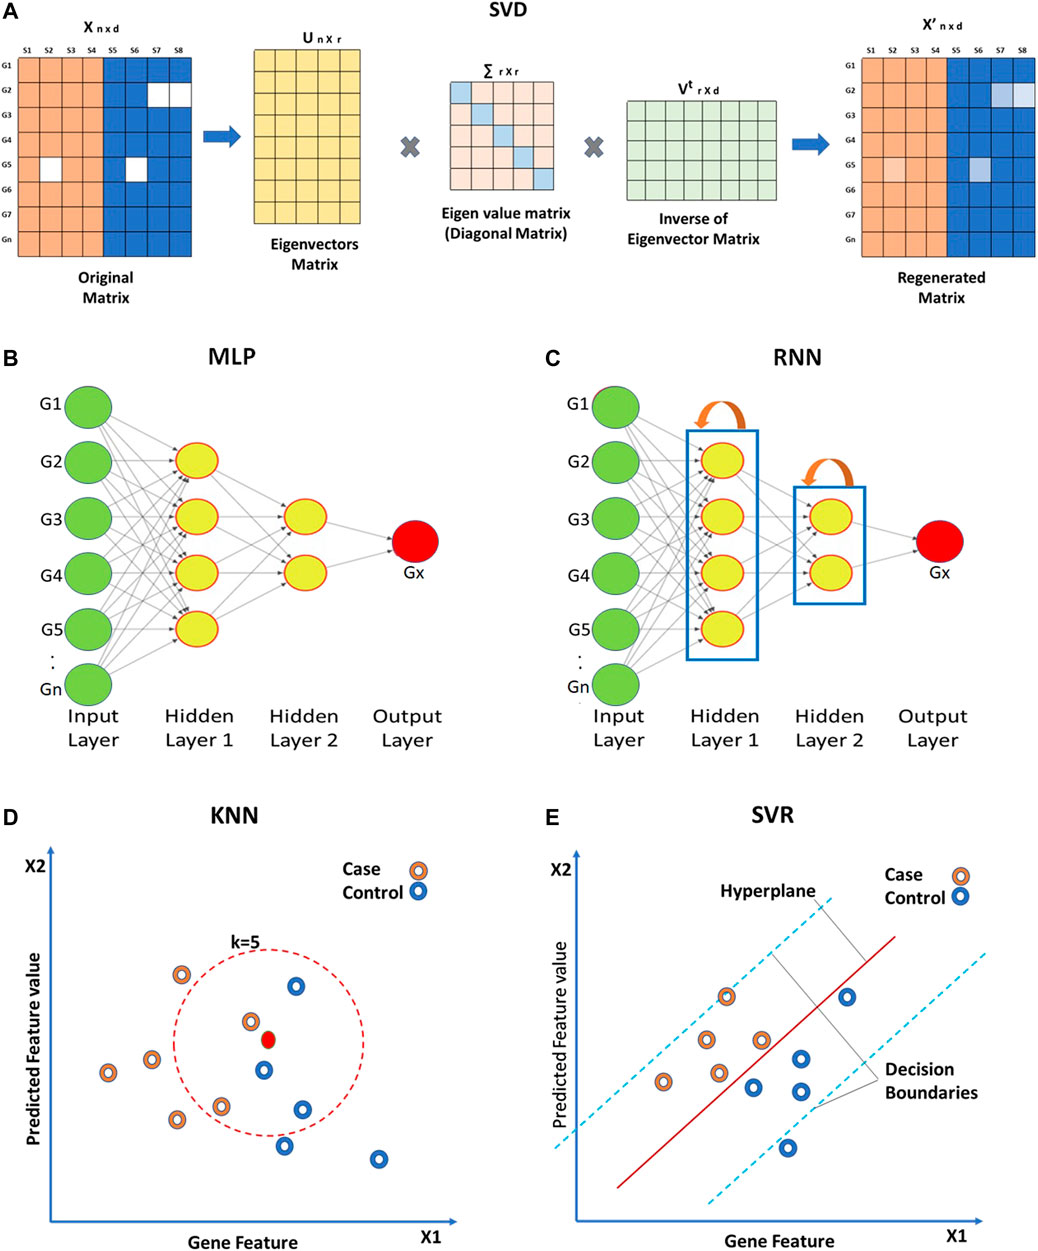
FIGURE 4. Approaches for missing value imputation. Global approaches such as (A) Singular value decomposition (SVD), (B) Multi-layered perceptron (MLP), and (C) Recurrent Neural Network use global correlation information extracted from gene expression array to estimate missing values. Local approaches such as (D) K-nearest neighbor (KNN) and (E) Support vector regression (SVR) utilize local similarity in the gene expression data. The solid green circles in (B,C) represent known gene expression values and solid red circles represent missing ones. Hollow circles in (D,E) represent samples.
Other than the above mentioned techniques, ANN-based techniques are also being utilized for the imputation of missing gene expression values. ANN-based methods for imputation include ANNimpute (García-Laencina et al., 2008), RNNimpute (Bengio and Gingras, 1995), etc. ANNimpute utilizes MLP (Multi-Layered Perceptron) based architecture that is trained with complete observed data (Saha et al., 2017) (Figure 4D). The final weight matrix generated through this process is further used for missing value imputation. RNNimpute utilizes Recurrent Neural Network architecture-based imputation (Bengio and Gingras, 1995) (Figure 4E). Since RNN has feedback connections from its neurons, it can preserve the long-term correlation between parameters.
2.2 Local approaches
Local approaches utilize a potential local similarity structure to estimate missing values. For heterogeneous data, the local approach is considered to be very effective. Many local imputation methods have been proposed since 2001. These techniques use a subset of the entire data by estimating underlying heterogeneity. K-Nearest Neighbor (KNN) is a standard ML-based missing-value imputation strategy (McNicholas and Murphy, 2010; Ryan et al., 2010; Pan et al., 2011; Dubey and Rasool, 2021) (Figure 4B). A missing value is imputed by finding the samples closest to the sample from which the gene expression value is missing. It should be noted that a lower number of neighboring points (K) may lead to overfitting of data (Batista and Monard, 2002) whereas a higher K may result in underfitting. Least Square (LS) imputation technique selects a number of most correlated genes using the L2-norm and/or Pearson’s correlation (Bo, Dysvik and Jonassen, 2004; Liew, Law and Yan, 2011; Dubey and Rasool, 2021). Support Vector Regression (SVR) method is a non-linear generalization of the linear model used for the imputation of missing gene expression values (Wang et al., 2006; Oladejo, Oladele and Saheed, 2018) (Figure 4C). A significant advantage of the SVR model is that it requires less computational time than other techniques mentioned above (Wang et al., 2006). However, the change in the missing data patterns and the high fraction of missing data limits the effects of SVR. Gaussian Mixture Clustering (GMC) is another technique used for the imputation of missing values that works with highly observable data (Ouyang, Welsh and Georgopoulos, 2004).
Some studies have compared the global and local approaches for their performances. SVD and KNN require re-computation of a matrix for every missing value, which results in prolonged evaluation time (Aghdam et al., 2017). SVR, BPCA, and LS try to mine the hidden pattern from the data and seem to perform better than SVD and KNN (Sahu, Swarnkar and Das, 2011) (Tuikkala et al., 2008; Subashini and Krishnaveni, 2011; Qiu, Zheng and Gevaert, 2020).
2.3 Hybrid approaches
The internal correlation among genes affects the homogeneity and heterogeneity of data and, therefore, the performance of global and local imputation approaches (Liew, Law and Yan, 2011). In order to cover both homogeneous and heterogeneous data, a hybrid approach can be very effective. LinCmb is one such hybrid approach for data imputation. LinCmb (Jörnsten et al., 2005) puts more weight on local imputation if data is heterogeneous and has fewer missing values. In contrast, it puts more weight on global methods if data is homogeneous with higher missing values. LinCmb takes an ensemble of row mean, KNN, SVD, BPCA, and GMC. When evaluated, LinCmb’s performance was found to be better than each technique it has ensembled. Ensemble missing data imputation method EMDI is another hybrid imputation approach composed of BPCA, matrix completion, and two types of LS and KNN estimators (Pan et al., 2011). It utilizes high-level diversity of data for the imputation of missing values. Recursive Mutual Imputation (RMI) is also a hybrid approach that comprises BPCA and LS to exploit global and local structures in the dataset, respectively (Li et al., 2015). ANN based autoencoders (AE) denoising autoencoder with partial loss (DAPL) (Qiu, Zheng and Gevaert, 2018) and variable autoencoders (VAE) (Qiu, Zheng and Gavaert, 2020) consist of encoder, and decoder layers. The encoder converts the input into the hidden representation and the decoder tries to reconstruct the input from the hidden representation. Hence, AE aims to produce output close to the input (García-Laencina et al., 2008).
2.4 Knowledge-assisted approaches
Knowledge-assisted approaches incorporate domain knowledge or external information into the imputation process. These approaches are applied when there exists a high missing rate, noisy data, or a small sample size. The solution obtained through this approach is not dependent on the global or local correlation structure that exists in the data but on the domain knowledge. Commonly used domain knowledge includes sample information such as experimental conditions, clinical information, and gene information which includes gene ontology, epigenetic profile, etc. Integrative MISSing Value Estimation (iMISS) (Hu et al., 2006) is one such knowledge-assisted imputation technique. iMISS incorporates knowledge from multiple related microarray datasets for missing value imputation. It obtains coherent neighbors set of genes for every gene with missing data by considering reference dataset. GOImpute (Tuikkala et al., 2006) is another knowledge-assisted imputation technique that uses GO database for knowledge assistance. This method integrates the semantic similarity in the GO with the expression similarity estimated using the KNN imputation algorithm. Projection onto convex sets impute (POCSimpute) (Gan, Liew and Yan, 2006) formulates every piece of prior knowledge into a corresponding convex set to capture gene-wise correlation, array-wise correlation, and known biological constraint. After this, a convergence-guaranteed iterative procedure is used to obtain a solution in the intersection of all these sets. HAIimpute (Xiang et al., 2008) utilizes epigenetic information e.g. histone acetylation knowledge for the imputation of missing values. First, it uses the mean expression values of each gene from each cluster to form an expression pattern. It obtains missing values in the sample by applying linear regression as a primary imputation and uses KNN or LS for secondary imputation. Since knowledge-based methods strongly rely on domain-specific knowledge, they may fail to estimate missing values from under-explored cases with low knowledge available (Wang et al., 2019).
Although a large number of missing value imputation methods are available to the users, there are still quite a few challenges when it comes to the application of imputation methods to the data. Firstly, there is only limited knowledge on the performance of different imputation methods on different types of missing data. The performance of the imputation methods may vary significantly depending on the experimental settings. Therefore, it is important to systematically evaluate the existing methods for their performance on different platforms and experimental settings (Aittokallio, 2009). Secondly, despite the many recent advances, better imputation algorithms that can adapt to both global and local characteristics of the data are still needed. Thirdly, the knowledge-based approaches can also be hybridized with local and/or global approaches to data imputation. More sophisticated algorithms which handle this combinatorial information may work better on the dataset with a higher rate of missing values and can be expected to perform better than those working on transcriptomics data alone (Liew, Law and Yan, 2011).
3 Data normalization
Once the missing values are imputed, the datasets can be subjected to downstream analysis. Efficacy of some of the classification methods, e.g., tree-based techniques, linear discriminant analysis, naïve Bayes, etc., does not get affected by variability in the data. However, the performance of class comparison, class discovery, and classification methods, e.g., KNN, SVM etc., may get affected due to technical variations in gene expression signals. The gene expression signals may vary from sample to sample due to technical reasons such as the efficiency of labeling, amount of RNA, and platform used for the generation of data. It is important to reduce the variability due to technical reasons but preserve the variability due to biological reasons. This can be achieved using data normalization or scaling techniques (Brown et al., 1999) (Table 3).
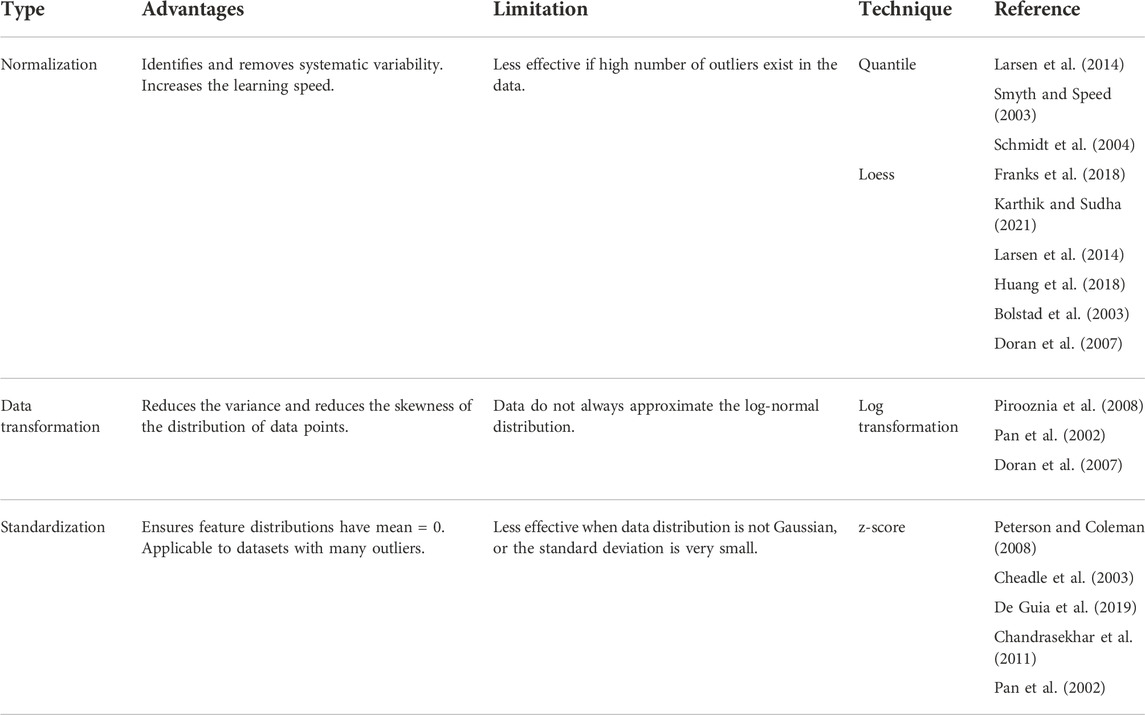
TABLE 3. List of data transformation and feature scaling techniques prior to dimensionality reduction.
Quantile normalization (Bolstad et al., 2003; Hansen, Irizarry and Wu, 2012) is a global mean or median technique utilized for the normalization of single channel expression array data. It arranges all the expression values of samples in order, takes average across probes, substitutes probe intensity with average value, and goes back to the original order. Low computational cost is the advantage of quantile normalization. Robust Multi-chip Average (RMA) is a commonly used technique to generate an expression matrix from Affymetrix data (Gautier et al., 2004) or oligonucleotide microarray (Carvalho and Irizarry, 2010). RMA obtains background corrected, quantile normalized gene expression values (Irizarry et al., 2003). Robust Spline Normalization (RSN) used for Illumina data also makes use of quantile normalization (Du, Kibbe and Lin, 2008). Quantile normalization is also used for single color Agilent data (Smyth, 2005). Loess is a local polynomial regression-based approach which can be utilized to adjust intensity levels between two channels (Yang et al., 2002; Smyth and Speed, 2003; Bullard et al., 2010; Baans et al., 2017). Loess normalization performs local regression for each pair of arrays which are composed of the difference and average of the log-transformed intensities derived from the two channels. Two color Agilent data (Smyth, 2005) (Du, Kibbe and Lin, 2008) use loess normalization. Log-transformation is the simplest and very common data normalization technique applied to gene expression data (Pochet et al., 2004; Li, Suh and Zhang, 2006; Aziz et al., 2017). This method does not shuffle the relative order of expression values, therefore, does not affect the rank-based test results. Log transformation is often applied to data subjected to prior normalization by other methods such as quantile and loess.
Standardization is a normalization technique that does not bind values to a specific range. Standardization is commonly applied by subtracting the mean value from each expression value. Z-score is one of the most frequently used methods of standardization. The Z-score transformation modifies expression values such that the expression value of each gene is denoted as a unit of standard deviation from the normalized mean of zero (Cheadle et al., 2003). The standardization can also be used with the median instead of the mean (Pan, Lin and Le, 2002). The use of the median is more robust against outliers. Standardization techniques are often used for data visualization.
Feature normalization can have positive and negative effects on the expression array analysis results. It lowers the bias but also decreases the sensitivity of the analysis (Freyhult et al., 2010). Existing normalization methods for microarray gene expression data generally assume a similar global expression pattern among samples being studied. However, scenarios of global shifts in gene expressions are dominant in the datasets of complex diseases, for example, cancers which makes the assumption invalid. Therefore, when applying it should be kept in mind that normalization techniques such as RMA or Loess may arbitrarily flatten the differences between sample groups which may lead to biased gene expression estimates.
4 Feature selection and feature extraction
High dimension data often results in the sparsity of information which is less reliable for prediction analysis. As a result, feature selection or feature extraction techniques are typically used to find informative genes and resolve the curse of dimensionality. The dimensionality reduction not only speeds up the training process but also helps in data visualization. Dimensionality reduction is achieved by either selection or extraction of features by transforming the original set of features into new ones. Dimensionality reduction serves as an important step in classification and class discovery analysis. For classification, the dataset is split into training and testing sets, and feature selection/extraction is carried out only on the training set to avoid data leakage. Feature selection and extraction techniques are broadly divided into four categories: filter methods, wrapper methods, embedded methods, and hybrid methods (Tyagi and Mishra, 2013; Dhote, Agrawal and Deen, 2015; Almugren and Alshamlan, 2019) (Figure 5) (Table 4).
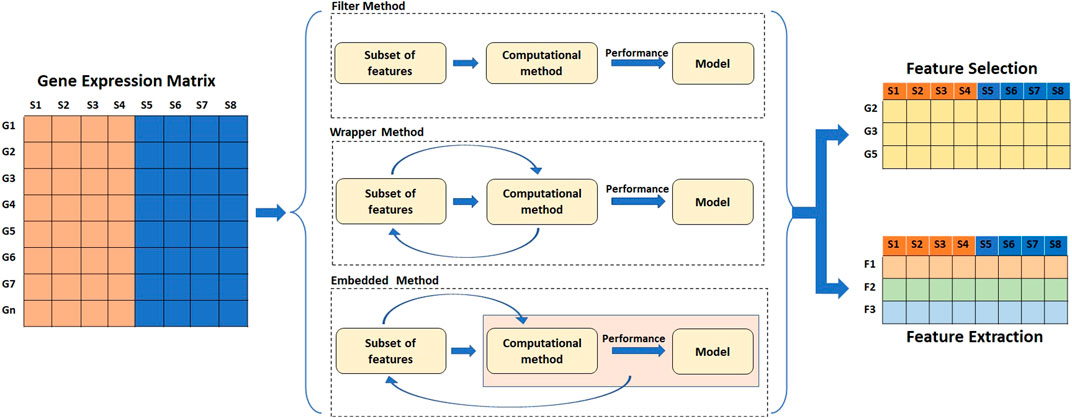
FIGURE 5. Methods of feature reduction. The filter methods of feature selection and extraction work independent of the performance of the learning algorithm. Feature wrapper methods select features based on the performance of the learning algorithm. Embedded methods perform feature selection as a part of learning process.

TABLE 4. List of different feature selection and feature extraction techniques.
4.1 Filter approaches
The filter methods are independent of the performance of the learning algorithm. Statistical methods such as ANOVA, chi-square, t-test, etc. (Pan, Lin and Le, 2002; Saeys, Inza and Larrañaga, 2007; Land et al., 2011; Önskog et al., 2011; Kumar et al., 2015) which are often used for class comparison are also used for the feature selection for prediction analysis. The fold change or p-value is often used as a cutoff parameter for the selection of features. Correlation-based unsupervised learning algorithms are also used for the features selection process (Figure 6A). In correlation-based features selection (CFS), Pearson’s coefficient is utilized to compute the correlation among feature genes (Al-Batah et al., 2019). As a next step, the network of genes that has a moderate to high positive correlation with the output variable is retained. Statistical approaches have also been coupled with correlation analysis for feature selection on Maximum Relevance and Minimum Redundancy (MRMR) principles (Radovic et al., 2017). MRMR is a filter approach that helps to achieve both high accuracy and fast speed (Ding and Peng, 2005; Abdi, Hosseini and Rezghi, 2012). The method selects genes that correlate with the condition but are dissimilar to each other. Another commonly used tool is Weighted Gene Co-expression Network Analysis (WGCNA) (Langfelder and Horvath, 2008). This approach is utilized to find the correlation patterns in gene expression across samples as an absolute value of Pearson’s correlation (Langfelder and Horvath, 2008). WGCNA groups genes into clusters or modules depending on their co-expression patterns (Agrahari et al., 2018). The eigenvectors generated through clustering can be thought of as a weighted average expression profile, also called eigengenes. These eigengenes can be used to study the relationship between modules and external sample traits. WGCNA is used more often in class comparison analysis for the identification of “hub” genes associated with a trait of interest. Another correlation-based technique, Fast Correlation Feature Selection (FCFS) utilizes a predominant correlation to identify relevant features and redundancy among them without pairwise correlation analysis (Yu and Liu, 2003) (Figure 6B).
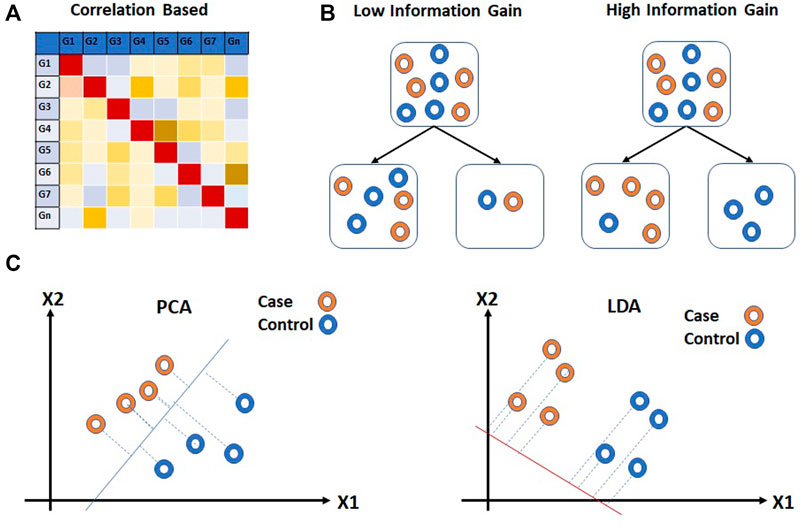
FIGURE 6. Filter approaches for feature reduction. (A) Correlation based feature selection (CFS) and (B) Information Gain (IG) are feature selection approaches for feature reduction. (C) Principal Component Analysis (PCA) and Linear Discriminant Analysis (LDA) extract information from multiple feature genes. Hollow circles in (B,C) represent samples.
The entropy-based methods are supervised learning methods that are used for feature selection. The entropy-based method selects features such that the probability distribution function across external traits have the highest entropy. Information Gain (IG) is a commonly used entropy-based method for feature selection applied to expression array data (Nikumbh, Ghosh and Jayaraman, 2012; Bolón-Canedo et al., 2014; Ayyad, Saleh and Labib, 2019). IG calculates the entropy of gene expression for the entire dataset. The entropy of gene expression for each external trait is then calculated. Based on entropy values, the information gain is calculated for each feature. Ranks are assigned to all the features and a threshold is used to select the features genes. The information gained is provided to the modeling algorithm as heuristic knowledge.
Feature extraction methods are multivariate in nature and are capable of extracting information from multiple feature genes. Classical Principal Component Analysis (PCA), an unsupervised linear transformation technique has been used for dimensionality reduction (Jolliffe, 1986; Pochet et al., 2004; Ringnér, 2008; Adiwijaya et al., 2018) (Figure 6C). PCA builds a new set of variables called principal components (PCs) using original features. To obtain principal components, PCA finds linear projection of gene expression levels with maximal variance over a training set. The PCs with the highest eigenvalues which explain the most variance in data are usually selected for further analysis. Independent component analysis (ICA), another unsupervised transformation method, generates a new set of features from the original ones by assuming them to be linear mixtures of latent variables (Lee and Batzoglou, 2003; Zheng, Huang and Shang, 2006). All features generated using ICA are considered to be statistically independent and hence equally important. As a result, unlike PCA, all components from ICA are used for further analysis. (Hyvärinen, 2013), however, as compared to PCA, ICA is slower. Linear Discriminant Analysis (LDA), on the other hand, is a supervised linear transformation feature reduction method that takes class labels into account and maximizes the separation between classes (Guo and Tibshirani, 2007; Sharma et al., 2014) (Figure 6C). The projection vectors are generated from original features. The projection vectors corresponding to the highest eigenvalue are used for downstream analysis. Similar to PCA, LDA also uses second order statistics. However, as compared to PCA and ICA, LDA offers faster speed and scalability.
All filter approaches (both simple filter and feature extraction methods) ignore the interface with classifier which can result in poor classification performance. This limitation can be overcome by wrapper and embedded approaches.
4.2 Wrapper approaches
The wrapper approach is a feature selection approach that wraps a specific machine learning technique applied to fit the data (Figure 7). The wrapper approach overcomes the limitation of the filter approach by selecting a subset of features and evaluating them based on the performance of the learning algorithm. The process of feature selection repeats itself until the best set of features is found.
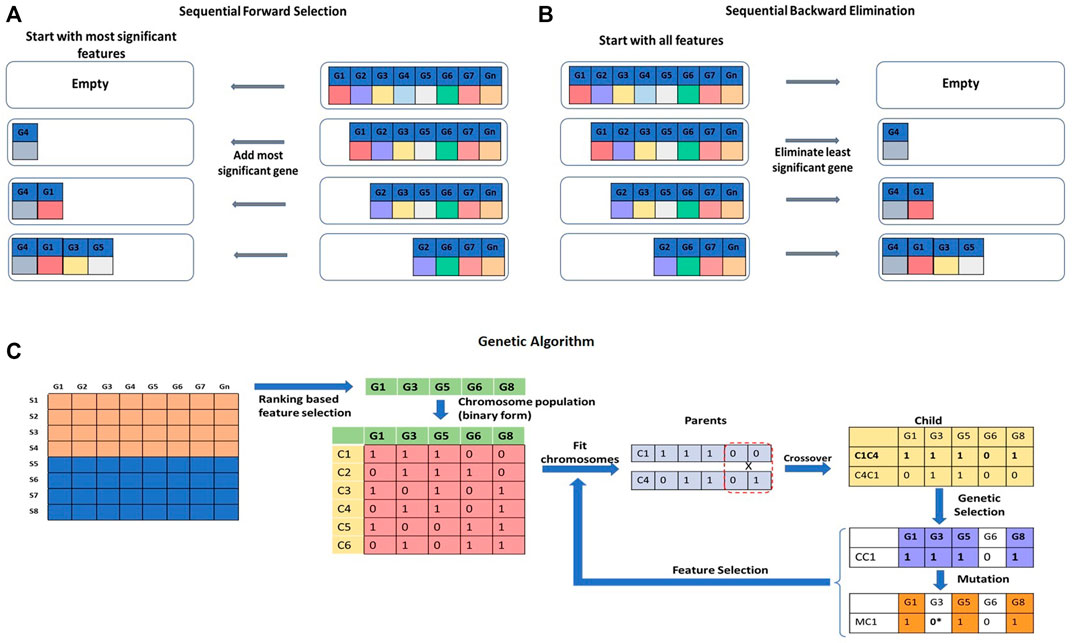
FIGURE 7. Wrapper approaches for feature selection. (A) Sequential Forward Selection (SFS), (B) Sequential Backward Elimination (SBE) are iterative methods of feature selection. (C) Genetic Algorithm (GA) is a stochastic and heuristic search technique that can be used for feature selection.
Sequential Forward Selection (SFS) is an iterative method of feature selection (Figure 7A). It calculates the performance of each feature and starts with the best performing feature. It then keeps adding a feature with each iteration and keeps checking the performance of the model. A set of features that will produce the highest improvement will be retained, and others will be discarded (Park, Yoo and Cho, 2007; Fan, Poh and Zhou, 2009). Sequential Backward Elimination (SBE), on the other hand, initiates the feature selection process by including all the features in the first iteration and by removing one feature with each iteration (Figure 7B). The effect of elimination of each feature is evaluated based on the prediction performance (Guyon et al., 2002; Dhote, Agrawal and Deen, 2015). Selection or elimination of features in SFS and SBE is based on a scoring function, e.g., p-value, r-square, or residuals sum of squares of the model to maximize performance. A Genetic Algorithm (GA) is a stochastic and heuristic search technique used to optimize a function based on the concept of evolution in biology (Pan, Zhu and Han, 2003) (Figure 7C). Evolution works on mutation and selection processes. In GA, the Information Index Classification (IIC) value for each gene feature is calculated. The IIC value for the feature gene represents its prediction power. As a first step, top gene features with high IIC values are selected for further processing. The selected feature genes are randomly assigned a binary form (0 or 1) to represent a ‘chromosome’. A set of chromosomes of the select genes with randomly assigned 0s and 1s creates a ‘chromosome population’. The fitness power of each chromosome is calculated by considering only the genes which are assigned a value of 1. ‘Fit’ chromosomes are selected using techniques such as Roulette-wheel selection, rank selection, tournament selection, etc. The select set of chromosomes is subjected to crossover or mutagenesis to generate the offspring. Upon crossover and mutagenesis, the chromosomes exchange or mutate their information contents. The offspring chromosomes are used for further downstream analysis (Aboudi and Benhlima, 2016; Sayed et al., 2019). There are quite a few variants of GAs to handle the feature selection problem (Liu, 2008, 2009; Ram and Kuila, 2019; Sayed et al., 2019). Other stochastic and heuristic methods are Artificial Bee Colony (ABC) (Li, Li and Yin, 2016), Ant Colony Optimization (ACO) (Alshamlan, Badr and Alohali, 2016), Particle Swarm Optimization (PSO) (Sahu and Mishra, 2012), etc.
Though, the wrapped methods provide optimized prediction results as compared to the filter methods they are computationally expensive. This limitation of wrapped methods is addressed by the embedded methods.
4.3 Embedded approaches
The embedded approaches perform feature selection as a part of the learning process and are typically specific to the learning algorithm. They integrate the importance of both wrapper and filter methods by including feature interaction at a low computational cost. The embedded approach extracts the most contributing features from iterations of training. Commonly used embedded techniques for feature selection are LASSO (Least Absolute Shrinkage and Selection Operator) and Ridge regression (Figure 8A). Both these techniques are regularized versions of multiple linear regression and can be utilized for feature selection (Tibshiranit, 1996). These techniques perform feature selection by eliminating weights of the least important features (Hoffmann, 2007; Ma, Song and Huang, 2007; Meier, Van De Geer and Bühlmann, 2008; Algamal and Lee, 2015). Other than LASSO and Ridge Regression, K-means clustering, Random Forest and ANN-based techniques are also used.
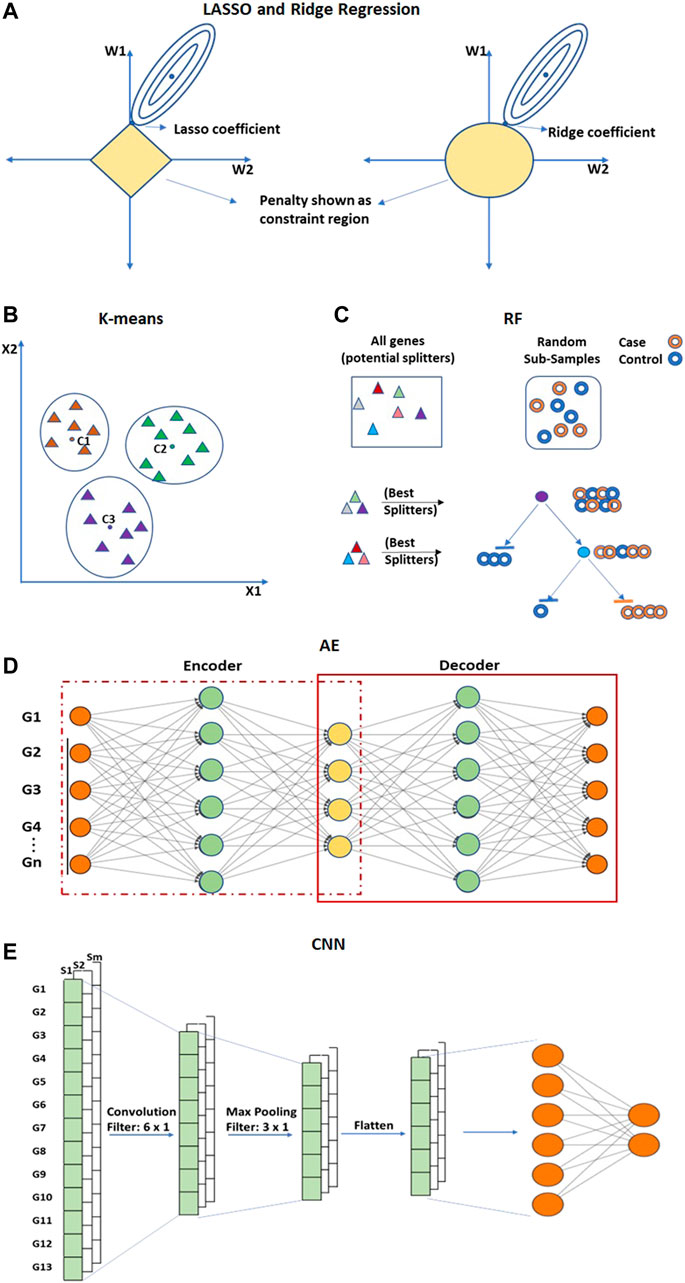
FIGURE 8. Embedded approaches performs feature selection and extraction. (A) LASSO and Ridge are regularized versions of multiple linear regression used for feature selection. (B) K-means clustering is an unsupervised method for dimensionality reduction that selects feature genes allocated to the nearest centroid. (C) Random Forest (RF) is an ensemble of decision trees. (D) Convolutional Neural network (CNN) and (E) Autoencoders (AE) are deep learning-based methods of feature reduction. Hollow circles in (C) represent samples, and solid triangles in (B,C) represent genes.
The K-means clustering technique is an unsupervised method that is utilized to eliminate redundancy in high-dimensional gene expression data (Aydadenta and Adiwijaya, 2018) (Figure 8B). In K-means clustering, an arbitrary K number of points from the data are selected as centroids, and all the genes are allocated to the nearest centroid (MacQueen, 1967; Kanungo et al., 2002). After clustering, a scoring algorithm such as Relief (Kira and Rendell, 1992) is utilized and high-scoring gene features of each cluster are selected for further analysis. The computational complexity of K-means is linear with respect to the number of instances, clusters, and dimensions. Though it is one of the fastest clustering techniques, it may also lead to an incorrect result due to convergence to a local minimum. The Random Forest (RF) is a supervised approach applied to obtain very small sets of non-redundant genes by preserving predictive accuracy (Díaz-Uriarte and Alvarez de Andrés, 2006; Moorthy and Mohamad, 2012) (Figure 8C). RF is an ensemble of decision trees constructed by randomly selecting data samples from the original data (Breiman, 2001). The final classification is obtained by combining results from the decision trees passed by vote. The bagging strategy of RF can effectively decrease the risk of overfitting when applied to large dimension data. RF can also incorporate connections among predictor features. The prediction performance of RF is highly competitive when compared with SVM and KNN. An important limitation of RF is that many trees can make the model very slow and unproductive for real-time predictions.
ANN-based Autoencoders (AE) (Kramer, 1991) is an unsupervised encoder and decoder technique (Figure 8D). It tries to obtain output layer neuron values as close as possible to input layer neurons using lower-dimensional layers in between. AE can obtain both linear and nonlinear relationships from the input information. AE such as Denoising Autoencoders (DAE) (Vincent and Larochelle, 2008), Stacked Denoising Autoencoder (SDAE) (Vincent et al., 2010; Danaee, Ghaeini and Hendrix, 2017) are utilized to extract functional features from expression arrays and are capable of learning from the dense network. Convolutional Neural Network (CNN) is another ANN-based architecture that is utilized for the feature extraction process in order to improve classification accuracy (Zeebaree, Haron and Abdulazeez, 2018; Almugren and Alshamlan, 2019) (Figure 8E). CNN can extricate local features from the data (LeCun et al., 1998; O’Shea and Nash, 2015). The convolutional layer of CNN extracts the high-level features from the input values. The pooling layer is utilized to reduce the dimensionality of feature maps from the convolution layer.
4.4 Hybrid approaches
A hybrid approach is considered as a combination of two or more filter and wrapper methods. It can reduce the error rate and the risk of overfitting. A well-known feature selection hybrid approach is Recursive Feature Elimination with a linear SVM (SVM-RFE) (Guyon et al., 2002). SVM-RFE utilizes SVMs classification capability and, from the ranked list, recursively deletes the least significant features. This method was taken as a benchmark feature selection method due to its performance. However, its main disadvantage is that it ignores the correlation hidden between the features and requires high computational time (Li, Xie and Liu, 2018). A combination of the mutual information maximization (MIM) and the adaptive genetic algorithm (AGA) has also been proposed for feature selection (Lu et al., 2017). MIM is able to select the advanced feature subset, and AGA speeds up the search in the identification of the substantial feature subsets. This combination of methods is more efficient and robust compared to the individual component (Lu et al., 2017). This technique streamlines the feature selection procedure without getting into classification accuracy on the reduced dataset. MIMAGA-Selection technique can reduce datasets with the number of genes up to 20,000 to below 300 with high classification accuracies. It also removes redundancy from the data and results in a lower error rate (Bolón-Canedo et al., 2014). This technique is an iterative feature reduction technique. Therefore, with an increase in the size of the microarray dataset, the computational time increases. Co-ABC is a hybrid approach for feature selection based on the correlation Artificial Bee Colony (ABC) algorithm (Alshamlan, 2018). The first step utilizes correlation-based feature selection to filter noisy and redundant genes from high dimensionality domains and the second step utilizes ABC technique to select the most significant genes.
Feature selection or feature extraction process can generate high quality data for classification and predication analysis. It should be noted that for classification analysis, feature selection is carried out only on the training dataset. For clinical applications, it should be noted that model interpretation is important, and feature extraction technique may cause the model interpretation challenging as compared to feature selection techniques.
5 Modeling/learning and analysis
The final step of analysis of microarray gene expression data is statistical analysis and model learning through computational techniques. Methods used for normalization, gene selection and analyses exhibit a synergistic relationship (Önskog et al., 2011). Class Comparison is one of the most common types of gene expression data analysis for the identification of differentially expressed genes (O’Connell, 2003). To solve the class comparison problems most researchers use standard statistical techniques e.g., t-test, ANOVA, etc. (Storey and Tibshirani, 2003). Scoring enrichment techniques such as z-score or odds ratio are hit-counting methods utilized to describe either the pathway or the functional enrichment of a gene list (Curtis, Orešič and Vidal-Puig, 2005). A higher number of hits shows a higher score and represents greater enrichment.
5.1 Classification (class prediction)
Classification is the process of classifying microarray data into categories or systematic arrangement of microarray data into different classes, e.g., cases and controls. For classification analysis, the entire dataset is divided into two subsets, viz. training and testing. The training dataset, which typically comprises 70–80% of the samples, is used for the construction of a model. To improve the efficiency of classification, it is essential to assess the performance of models. A common way to improve the performance of a model during training is to include an additional validation subset (Refaeilzadeh, Tang and Liu, 2009). The validation dataset comprises 10–15% of the total sample observations used for parameter optimization. The remaining samples are used as a testing dataset. (Refaeilzadeh, Tang and Liu, 2009). However, to assess the generalization ability and prevent model overfitting, instead of setting aside a single validation set, k-fold cross-validation can be an effective solution. Various ML algorithms have been used for classification analysis.
K-Nearest Neighbor (KNN) is one of the techniques that can be utilized for the classification of expression array data (Kumar et al., 2015; Ayyad, Saleh and Labib, 2019). The classification of a sample is achieved by measuring its distance (e.g., Euclidean distance etc.) from all training samples using the distance metric. The performance of KNN is dependent on the threshold of the feature selection method and is subject to the distance function (Deegalla and Bostr, 2007). An increase in sample size has been shown to increase the computational and time complexity of KNN (Begum, Chakraborty and Sarkar, 2015). Another classification technique for expression array data is Nearest Shrunken Centroid (NSC) (Tibshirani et al., 2003; Dallora et al., 2017). It calculates the centroid for each class and tries to shrink each of the class centroids toward the global centroid by threshold. A sample is classified into a class whose centroid is nearest to it based on the distance metric. This method can reduce the effects of noisy genes. However, an arbitrary choice of shrinkage threshold is a limitation of NSC.
A Decision Tree (DT) (Safavian and Landgrebe, 1991) approach can also be utilized for the classification of gene expression data (Peng, Li and Liu, 2006; Krętowski and Grześ, 2007; Chen et al., 2014). A decision tree is also a versatile ML technique that can perform classification as well as regression operations (Safavian and Landgrebe, 1991). DT requires less effort for data preparation during preprocessing. However, a slight variation in the input information can result in a significant variation in the optimal decision tree structure. Also, overfitting is a known limitation of the DT models. Random Forest (RF) (Breiman, 2001) is another algorithm used for the classification and regression analysis of gene expression data. RF is an ensemble of decision trees (Statnikov, Wang and Aliferis, 2008; Aydadenta and Adiwijaya, 2018). While Random Forest has lesser chances of overfitting and provides more accurate results, it is computationally expensive and more difficult to interpret as compared to DT.
Another technique that is utilized for classification analysis using expression arrays is an SVM (Brown et al., 2000; Furey et al., 2000; Ben-Hur, 2001; Abdi, Hosseini and Rezghi, 2012; Adiwijaya et al., 2018; Turgut, Dagtekin and Ensari, 2018). For complex non-linear data, higher degree polynomials can be added to the cost function of SVM. This will increase the combination of a number of features; however, this results in the reduction of computation speed. To overcome this situation, ‘kernel trick’ is used, which can handle complex non-linear data without the addition of any polynomial features. Various kernel types can be used with SVM, such as linear, polynomial, radial, etc. In some studies, SVMs performed better than DT and ANN-based techniques (Önskog et al., 2011), whereas, in others the performance of SVM was poor (Tabares-Soto et al., 2020) (Motieghader et al., 2017).
Multilayered CNN, a deep learning algorithm typically applied where the data can be visualized as an image (Neubauer, 1998; Collobert and Weston, 2008), has also been proposed for the analysis of microarray data (Zeebaree, Haron and Abdulazeez, 2018). Each neuron is scanned throughout the input matrix, and for every input, the CNN calculates the locally weighted sum and produces an output value. CNN can deal with insufficient data. CNN involves much less preprocessing and can do far better in terms of results as compared to other supervised techniques.
The performance evaluation for classification analysis using classification techniques can be achieved by error rate or accuracy parameters. Root Mean Squared Error (RMSE) or Root Relative Squared Error (RRSE) are examples of error-rate-based evaluation. The accuracy metric is the most common performance evaluation parameter utilized to find the accuracy of classification. However, accuracy alone is not enough for performance evaluation (McNee, Riedl and Konstan, 2006; Sturm, 2013) and therefore, a confusion matrix is computed. A set of predictions is compared with actual targets to compute the confusion matrix. The confusion matrix represents true positives (TP), true negatives (TN), false positives (FP), and false negatives (FN). TP, TN, FP and FN are utilized to calculate more concise metrics such as precision, recall (sensitivity), specificity, Matthew’s correlation coefficient (MCC), etc. ROC (Receiver Operating Characteristic) curve and Precision-Recall curve are other standard tools used by binary classifiers as performance measures. ROC and MCC are more robust measures as compared to accuracy since accuracy is affected by class imbalance (Chicco and Jurman, 2020).
The problem of classification of expression data is both biologically important and computationally challenging. From a computational perspective one of the major challenges in analyzing microarray gene expression data is a small sample size. Error estimation is greatly affected by the small sample size, and the possibility of overfitting of data is very high (Hambali, Oladele and Adewole, 2020). Another important issue in gene expression array data analysis is class imbalance for the classification tasks. In clinical research on rare diseases, generally, the number of case samples is very less as compared to healthy controls which may lead to biased results. With decreasing costs of microarray profiling and high-throughput sequencing, this challenge can be expected to be resolved in the near future.
5.2 Class discovery
The third type of microarray analysis is class discovery which involves the analysis of a set of gene expression profiles for the discovery of novel gene regulatory networks or sample types. Hierarchical Clustering Analysis (HCA) is a simple process of sorting instances into groups of similar features and is very commonly used for the analysis of expression array data (Eisen et al., 1998). Hierarchical clustering produces a dendrogram which is a binary tree structure and represents the distance relationships between clusters. HCA is a highly structured approach and the most widely used technique for expression analysis (Bouguettaya et al., 2015). However, the graphical representation of hierarchy is very complex in HCA. The lack of robustness and inversion problems complicate the interpretation of the hierarchy. HCA is also sensitive to small data variations. Self-Organizing Maps (SOM) is another clustering technique used for the identification of prevalent gene expression patterns and simple visualization of specific genes or pathways (Tamayo et al., 1999). SOM can perform non-linear mapping of data with a two-dimensional map grid. Unlike HCA, SOM is less sensitive to small data variations (Nikkila et al., 2002).
K-means is an iterative technique that minimizes the overall within-cluster dispersion. K-means algorithm has been utilized to discover transcriptional regulatory sub-networks of yeast without any prior assumptions of their structure (Tavazoie et al., 1999). The advantage of K-means over other clustering techniques is that it can deal with entirely unstructured input data (Gentleman and Carey, 2008). However, the K-means technique easily gets caught with the local optimum if the initial center points are selected randomly. Therefore various modified versions of K-means are applied for converging to the global optimum (Lu et al., 2004; Nidheesh, Abdul Nazeer and Ameer, 2017; Jothi, Mohanty and Ojha, 2019).
Another technique for class discovery analysis is the Bayesian probabilistic framework which uses Bayes theorem (Friedman et al., 2000; Baldi and Long, 2001). This technique is a good fit for small sample sizes of microarray studies; however, it is computationally exhaustive for a dataset with a very high number of samples and features. Nonnegative Matrix Factorization (NMF) is also a clustering technique utilized for pattern analysis of gene expression data (Kim and Tidor, 2003; Brunet et al., 2004). NMF involves factorization into matrices with nonnegative entries and recognizes the similarity between sub-portions of the data corresponding to localized features in expression space (Kim and Park, 2007; Devarajan and Ebrahimi, 2008).
Evaluation measures for clustering algorithms utilized for class discovery can be of three different types, viz. internal validation index, relative validation index, and external validation index (Dalton, Ballarin and Brun, 2009). The internal validation index method calculates properties of the resulting clusters based on internal properties of clusters such as compactness, separation, and roundness. Dunn’s Index and Silhouette Index are examples of internal validation indices. The relative validation indexing method compares clusters generated by algorithms with different parameters or subsets of the data. It can measure the stability of the technique against variations in the data, or consistency of the results in the case of redundancy. The figure of merit index and instability index are examples of relative validation indices. External validation index method compares the groups generated by the clustering technique to the actual cluster of the data. Generally, external methods are considered to be better correlated to the actual error as compared to internal and relative indexing methods. Hubert’s Correlation, Rand Statistics, Jaccard Coefficient, and Folke’s and Mallow’s index are a few examples of external evaluation parameters. Table 5 describes all the evaluation parameters discussed above.
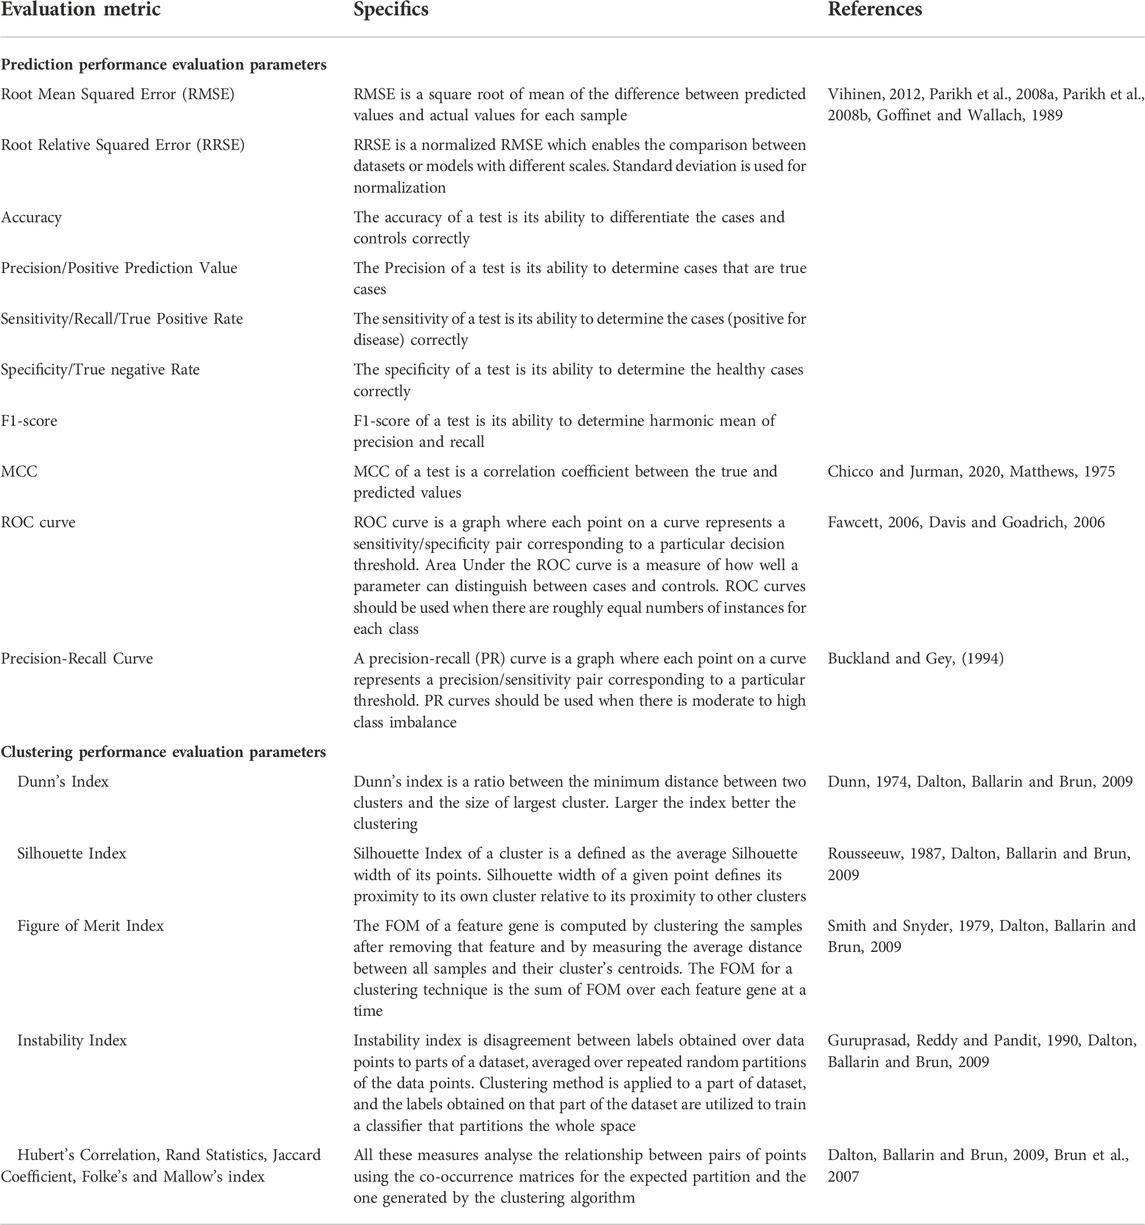
TABLE 5. Evaluation Parameters for analysis of microarray gene expression data.
While dealing with a very large number of gene features in expression arrays, multiple gene feature selection techniques are available to deal with dimensionality problem. However, an elaborate study is required to identify optimum methods for downstream analysis that can be combined with specific dimensionality reduction techniques.
6 Conclusion and future directions
In this paper, we have attempted to describe the complete pipeline for the analysis of expression arrays. Conventional ML methods for missing value imputation, dimensionality reduction, and classification analysis have achieved success. However, with an increase in data complexity, deep learning techniques may find increasing usage. The current applications of genomics in clinical research may benefit from the data coming from different modalities. For gene expression data analysis of complex diseases, data sparsity or class imbalance is a real concern. This issue can be addressed with the recent technology of data augmentation, for example, Generative Adversarial Networks (GANs) (Chaudhari, Agrawal and Kotecha, 2020). The aim of any class prediction algorithm for diagnostic applications in a clinical research is not only to predict but also to disclose the reasons behind the predictions made. This understanding of the undercover mechanism with some evidence makes the model interpretable. Therefore, it is important to develop interpretable models which help to understand the problem and the situation where the model may fail (Holzinger et al., 2017). Interpretation models such as perturbation-based, derivative-based, local and global surrogate-based should get attention to solve these problems (Ribeiro, Singh and Guestrin, 2016; Zou et al., 2019).
Author contributions
NB and SK wrote the manuscript. SK, RW, and KK outlined the manuscript. RW and KK reviewed the manuscript and inspired the overall work.
Funding
This work has been supported by the Scheme for Promotion of Academic and Research Collaboration (SPARC) 2018–19, MHRD (project no. P104). NB was supported by the Junior Research Fellowship Award 2018 by Symbiosis International Deemed University, India. Satyajeet Khare is also a beneficiary of a DST SERB SRG grant (SRG/2020/001414).
Conflict of interest
The authors declare that the research was conducted in the absence of any commercial or financial relationships that could be construed as a potential conflict of interest.
Publisher’s note
All claims expressed in this article are solely those of the authors and do not necessarily represent those of their affiliated organizations, or those of the publisher, the editors and the reviewers. Any product that may be evaluated in this article, or claim that may be made by its manufacturer, is not guaranteed or endorsed by the publisher.
References
Abapihi, B., Mukhsar,, , Adhi Wibawa, G. N., Baharuddin,, , Lumbanraja, F. R., Faisal, M. R., et al. (2021). Parameter estimation for high dimensional classification model on colon cancer microarray dataset. J. Phys. Conf. Ser. 1899 (1), 012113. doi:10.1088/1742-6596/1899/1/012113
Abberton, M., Batley, J., Bentley, A., Bryant, J., Cai, H., Cockram, J., et al. (2016). Global agricultural intensification during climate change: A role for genomics. Plant Biotechnol. J. 14 (4), 1095–1098. doi:10.1111/pbi.12467
Abdi, M. J., Hosseini, S. M., and Rezghi, M. (2012). A novel weighted support vector machine based on particle swarm optimization for gene selection and tumor classification. Comput. Math. Methods Med., 320698. doi:10.1155/2012/320698
Aboudi, N. El, and Benhlima, L. (2016). “Review on wrapper feature selection approaches,” in Proceedings - 2016 International Conference on Engineering and MIS, ICEMIS 2016 (IEEE). doi:10.1109/ICEMIS.2016.7745366
Adiwijaya, A., Wisesty, U., Kusumo, D., and Aditsania, A. (2018). Dimensionality reduction using Principal Component Analysis for cancer detection based on microarray data classification. J. Comput. Sci. 14 (11), 1521–1530. doi:10.3844/jcssp.2018.1521.1530
Aghdam, R., Baghfalaki, T., Khosravi, P., and Saberi Ansari, E. (2017). The ability of different imputation methods to preserve the significant genes and pathways in cancer. Genomics Proteomics Bioinforma. 15 (6), 396–404. doi:10.1016/j.gpb.2017.08.003
Agrahari, R., Foroushani, A., Docking, T. R., Chang, L., Duns, G., Hudoba, M., et al. (2018). Applications of Bayesian network models in predicting types of hematological malignancies. Scientific Reports. United States: Springer 8 (1), 1–12. doi:10.1038/s41598-018-24758-5
Aittokallio, T. (2009). Dealing with missing values in large-scale studies: Microarray data imputation and beyond. Brief. Bioinform. 11 (2), 253–264. doi:10.1093/bib/bbp059
Al-Batah, M., Zaqaibeh, B. M., Alomari, S. A., and Alzboon, M. S. (2019). Gene Microarray Cancer classification using correlation based feature selection algorithm and rules classifiers. Int. J. Onl. Eng. 15 (8), 62–73. doi:10.3991/ijoe.v15i08.10617
Algamal, Z. Y., and Lee, M. H. (2015). Penalized logistic regression with the adaptive LASSO for gene selection in high-dimensional cancer classification. Expert Syst. Appl. 42 (23), 9326–9332. doi:10.1016/j.eswa.2015.08.016
Alloul, A., Spanoghe, J., Machado, D., and Vlaeminck, S. E. (2022). Unlocking the genomic potential of aerobes and phototrophs for the production of nutritious and palatable microbial food without arable land or fossil fuels. Microb. Biotechnol. 15 (1), 6–12. doi:10.1111/1751-7915.13747
Almugren, N., and Alshamlan, H. (2019). A survey on hybrid feature selection methods in microarray gene expression data for cancer classification’. IEEE Access 7, 78533–78548. doi:10.1109/ACCESS.2019.2922987
Alshamlan, H. M., Badr, G. H., and Alohali, Y. A. (2016). ABC-SVM: Artificial bee colony and SVM method for microarray gene selection and Multi class cancer classification. Int. J. Mach. Learn. Comput. 6 (3), 184–190. doi:10.18178/ijmlc.2016.6.3.596
Alshamlan, H. M. (2018). Co-ABC: Correlation artificial bee colony algorithm for biomarker gene discovery using gene expression profile. Saudi J. Biol. Sci. 25 (5), 895–903. doi:10.1016/j.sjbs.2017.12.012
Arbitrio, M., Scionti, F., Di Martino, M. T., Caracciolo, D., Pensabene, L., Tassone, P., et al. (2021). Pharmacogenomics biomarker discovery and validation for translation in clinical practice. Clin. Transl. Sci. 14 (1), 113–119. doi:10.1111/cts.12869
Aydadenta, H., and Adiwijaya, (2018). A clustering approach for feature selection in microarray data classification using random forest. J. Inf. Process. Syst. 14 (5), 1167–1175. doi:10.3745/JIPS.04.0087
Aydilek, I. B., and Arslan, A. (2013). A hybrid method for imputation of missing values using optimized fuzzy c-means with support vector regression and a genetic algorithm. Inf. Sci. 233, 25–35. doi:10.1016/j.ins.2013.01.021
Ayyad, S. M., Saleh, A. I., and Labib, L. M. (2019). Gene expression cancer classification using modified K-Nearest Neighbors technique. Biosystems. 176 (12), 41–51. doi:10.1016/j.biosystems.2018.12.009
Aziz, R., Verma, C., Jha, M., and Srivastava, N. (2017). Artificial neural network classification of microarray data using new hybrid gene selection method. Int. J. Data Min. Bioinform. 17 (1), 42. doi:10.1504/ijdmb.2017.084026
Baans, O. S., Hashim, U., and Yusof, N. (2017). Performance comparison of image normalisation method for DNA microarray data. Pertanika J. Sci. Technol. 25 (S), 59–68.
Baldi, P., and Long, A. D. (2001). A Bayesian framework for the analysis of microarray expression data: Regularized t-test and statistical inferences of gene changes. Bioinformatics 17 (6), 509–519. doi:10.1093/bioinformatics/17.6.509
Baltes, N. J., and Voytas, D. F. (2015). Enabling plant synthetic biology through genome engineering. Trends Biotechnol. 33 (2), 120–131. doi:10.1016/j.tibtech.2014.11.008
Barrett, T., Wilhite, S. E., Ledoux, P., Evangelista, C., Kim, I. F., Tomashevsky, M., et al. (2013). NCBI GEO: Archive for functional genomics data sets - Update. Nucleic Acids Res. 41 (1), 991–995. doi:10.1093/nar/gks1193
Batista, G. E., and Monard, M. C. (2002). A study of k-nearest neighbour as an imputation method, 1–12.
Begum, S., Chakraborty, D., and Sarkar, R. (2015). “Data classification using feature selection and kNN machine learning approach,” in 2015 International Conference on Computational Intelligence and Communication Networks (CICN) (IEEE), 6–9. doi:10.1109/CICN.2015.165
Behzadi, P., Behzadi, E., and Ranjbar, R. (2014). The application of microarray in medicine. ORL 24, 36–38.
Bengio, Y., and Gingras, F. (1995). Recurrent neural networks for missing or asynchronous data. Adv. neural Inf. Process. Syst. 8.
Bentley, D. R., Balasubramanian, S., Swerdlow, H. P., Smith, G. P., Milton, J., Brown, C. G., et al. (2008). Accurate whole human genome sequencing using reversible terminator chemistry. Nature 456, 53–59. doi:10.1038/nature07517
Bhandari, N., Khare, S., Walambe, R., and Kotecha, K. (2021). Comparison of machine learning and deep learning techniques in promoter prediction across diverse species. PeerJ. Comput. Sci. 7, 3655–e417. doi:10.7717/peerj-cs.365
Blanchard, A. P., Kaiser, R. J., and Hood, L. E. (1996). High-density oligonucleotide arrays. Biosens. Bioelectron. 11 (6/7), 687–690. doi:10.1016/0956-5663(96)83302-1
Bo, T. H., Dysvik, B., and Jonassen, I. (2004). LSimpute: Accurate estimation of missing values in microarray data with least squares methods. Nucleic Acids Res. 32 (3), e34–e38. doi:10.1093/nar/gnh026
Bolón-Canedo, V., Sanchez-Marono, N., Alonso-Betanzos, A., Benitez, J., and Herrera, F. (2014). A review of microarray datasets and applied feature selection methods. Inf. Sci. 282, 111–135. doi:10.1016/j.ins.2014.05.042
Bolstad, B. M., Irizarry, R. A., AstrandM., , and Speed, T. P. (2003). A comparison of normalization methods for high density oligonucleotide array data based on variance and bias. Bioinformatics 19 (2), 185–193. doi:10.1093/bioinformatics/19.2.185
Bouguettaya, A., Yu, Q., Liu, X., Zhou, X., and Song, A. (2015). Efficient agglomerative hierarchical clustering. Expert Syst. Appl. 42 (5), 2785–2797. doi:10.1016/j.eswa.2014.09.054
Brazma, A., Parkinson, H., Sarkans, U., Shojatalab, M., Vilo, J., Abeygunawardena, N., et al. (2003). ArrayExpress - a public repository for microarray gene expression data at the EBI. Nucleic Acids Res. 31 (1), 68–71. doi:10.1093/nar/gkg091
Breiman, L., and Soo, K. (2001). Random forests. Mach. Learn. 45 (1), 117–127. doi:10.1007/978-3-662-56776-0_10
Brown, M. P. S., Grundy, W. N., Lin, D., CristiaNiNiN., , Sugnet, C. W., Furey, T. S., et al. (2000). Knowledge-based analysis of microarray gene expression data by using support vector machines. Proc. Natl. Acad. Sci. U. S. A. 97 (1), 262–267. doi:10.1073/pnas.97.1.262
Brown, M. P. S., Slonim, D., and Zhu, Q. (1999). Support vector machine classification of microarray gene expression data. Santa Cruz: University of California, 25–28. Technical Report UCSC-CRL-99-09.
Brun, M., Sima, C., Hua, J., Lowey, J., Carroll, B., Suh, E., et al. (2007). Model-based evaluation of clustering validation measures. Pattern Recognit. DAGM. 40, 807–824. doi:10.1016/j.patcog.2006.06.026
Brunet, J. P., Tamayo, P., Golub, T. R., and Mesirov, J. P. (2004). Metagenes and molecular pattern discovery using matrix factorization. Proc. Natl. Acad. Sci. U. S. A. 101 (12), 4164–4169. doi:10.1073/pnas.0308531101
Buckland, M., and Gey, F. (1994). The relationship between recall and precision. J. Am. Soc. Inf. Sci. 45 (1), 12–19. doi:10.1002/(sici)1097-4571(199401)45:1<12:aid-asi2>3.0.co;2-l
Bullard, J. H., Purdom, E., and Dudoit, S. (2010). Evaluation of statistical methods for normalization and differential expression in mRNA-Seq experiments James. BMC Bioinforma. 11 (94), 1–13. doi:10.1186/1471-2105-11-94
Carvalho, B. S., and Irizarry, R. A. (2010). “A framework for oligonucleotide microarray preprocessing,”, 2363–2367. doi:10.1093/bioinformatics/btq431Bioinformatics2619
Chandrasekhar, T., Thangave, K., and Sathishkumar, E. N. (2013). “Unsupervised gene expression data using enhanced clustering method,” in 2013 IEEE International Conference on Emerging Trends in Computing, Communication and Nanotechnology, ICE-CCN 2013 (IEEE), 518–522. doi:10.1109/ICE-CCN.2013.6528554
Chandrasekhar, T., Thangavel, K., and Elayaraja, E. (2011). Effective clustering algorithms for gene expression data. Int. J. Comput. Appl. 32 (4), 25–29.
Chaudhari, P., Agrawal, H., and Kotecha, K. (2020). Data augmentation using MG-GAN for improved cancer classification on gene expression data. Soft Comput. 24 (15), 11381–11391. doi:10.1007/s00500-019-04602-2
Cheadle, C., Vawter, M. P., Freed, W. J., and Becker, K. G. (2003). Analysis of microarray data using Z score transformation. J. Mol. Diagn. 5 (2), 73–81. doi:10.1016/S1525-1578(10)60455-2
Chen, J. J., Wang, S. J., Tsai, C. A., and Lin, C. J. (2007). Selection of differentially expressed genes in microarray data analysis. Pharmacogenomics J. 7, 212–220. doi:10.1038/sj.tpj.6500412
Chen, K. H., Wang, K. J., Tsai, M. L., Wang, K. M., Adrian, A. M., Cheng, W. C., et al. (2014). Gene selection for cancer identification: A decision tree model empowered by particle swarm optimization algorithm. BMC Bioinforma. 15 (1), 49–9. doi:10.1186/1471-2105-15-49
Chen, Y., Li, Y., Narayan, R., Subramanian, A., and Xie, X. (2016). Gene expression inference with deep learning. Bioinformatics 32 (12), 1832–1839. doi:10.1093/bioinformatics/btw074
Chen, Z., Dodig-Crnkovic, T., Schwenk, J. M., and Tao, S. C. (2018). Current applications of antibody microarrays’, Clinical Proteomics. Clin. Proteomics 15 (1), 7–15. doi:10.1186/s12014-018-9184-2
Chicco, D., and Jurman, G. (2020). The advantages of the Matthews correlation coefficient (MCC) over F1 score and accuracy in binary classification evaluation. BMC Genomics 21 (1), 6–13. doi:10.1186/s12864-019-6413-7
Collobert, R., and Weston, J. (2008) ‘A unified architecture for natural language processing: Deep neural networks with multitask learning’, in Proceedings of the 25th International Conference on Machine Learning, Helsinki, Finland, 160–167.
Curtis, R. K., Orešič, M., and Vidal-Puig, A. (2005). Pathways to the analysis of microarray data. Trends Biotechnol. 23 (8), 429–435. doi:10.1016/j.tibtech.2005.05.011
Dallora, A. L., Eivazzadeh, S., Mendes, E., Berglund, J., and Anderberg, P. (2017). Machine learning and microsimulation techniques on the prognosis of dementia: A systematic literature review. PLoS ONE 12 (6), e0179804–e0179823. doi:10.1371/journal.pone.0179804
Dalton, L., Ballarin, V., and Brun, M. (2009). Clustering algorithms: On learning, validation, performance, and applications to genomics. Curr. Genomics 10 (6), 430–445. doi:10.2174/138920209789177601
Danaee, P., Ghaeini, R., and Hendrix, D. A. (2017). “A deep learning approach for cancer detection and relevant gene identification,” in Pacific Symposium on Biocomputing 2017 Biocomputing, 219–229. doi:10.1142/9789813207813_0022
Davis, J., and Goadrich, M. (2006) ‘The relationship between precision-recall and ROC curves’, In Proceedings of the 23rd international conference on Machine learning, 233–240.
De Guia, J. M., Devaraj, M., and Vea, L. A. (2019). “Cancer classification of gene expression data using machine learning models,” in 2018 IEEE 10th International Conference on Humanoid, Nanotechnology, Information Technology, Communication and Control (Environment and Management, HNICEM 2018. IEEE). doi:10.1109/HNICEM.2018.8666435
Deegalla, S., and Bostr, H. (2007). “Classification of microarrays with kNN : Comparison of dimensionality reduction,” in International Conference on Intelligent Data Engineering and Automated Learning (Springer-Verlag), 800–809.
Deng, L., and Yu, D. (2014). “Deep learning: Methods and applications,” in Foundations and Trends® in signal processing, 198–349.
Devarajan, K., and Ebrahimi, N. (2008). Class discovery via nonnegative matrix factorization. Am. J. Math. Manag. Sci. 28 (3–4), 457–467. doi:10.1080/01966324.2008.10737738
Dhote, Y., Agrawal, S., and Deen, A. J. (2015). “A survey on feature selection techniques for internet traffic classification,” in Proceedings - 2015 International Conference on Computational Intelligence and Communication Networks (CICN 2015. IEEE), 1375–1380. doi:10.1109/CICN.2015.267
Díaz-Uriarte, R., and Alvarez de Andrés, S. (2006). Gene selection and classification of microarray data using random forest. BMC Bioinforma. 7 (3), 3–13. doi:10.1186/1471-2105-7-3
Dick, S. (2019). Artificial intelligence. Harv. Data Sci. Rev. 1 (1), 1–7. doi:10.4324/9780203772294-10
Ding, C., and Peng, H. (2005). Minimum redundancy feature selection from microarray gene expression data. J. Bioinform. Comput. Biol. 3 (2), 185–205. doi:10.1142/s0219720005001004
Dittman, D. J., Wald, R., and Hulse, J. (2010). “Comparative analysis of DNA microarray data through the use of feature selection techniques,” in Proceedings - 9th International Conference on Machine Learning and Applications (ICMLA 2010. IEEE), 147–152. doi:10.1109/ICMLA.2010.29
Doran, M., Raicu, D. S., Furst, J. D., Settimi, R., SchipMaM., , and Chandler, D. P. (2007). Oligonucleotide microarray identification of Bacillus anthracis strains using support vector machines. Bioinformatics 23 (4), 487–492. doi:10.1093/bioinformatics/btl626
Du, P., Kibbe, W. A., and Lin, S. M. (2008). lumi: A pipeline for processing Illumina microarray. Bioinformatics 24 (13), 1547–1548. doi:10.1093/bioinformatics/btn224
Dubey, A., and Rasool, A. (2021). Efficient technique of microarray missing data imputation using clustering and weighted nearest neighbour’, Scientific Reports. Sci. Rep. 11 (1), 24297–24312. doi:10.1038/s41598-021-03438-x
Dudoit, S., and Fridlyannnd, J. (2005). “Classification in microarray experiments,” in A practical approach to microarray data analysis, 132–149. doi:10.1007/0-306-47815-3_7
Dunn, J. C. (1974). Well-separated clusters and optimal fuzzy partitions. J. Cybern. 4 (1), 95–104. doi:10.1080/01969727408546059
Eid, J., Fehr, A., Gray, J., Luong, K., Lyle, J., Otto, G., et al. (2009). Real-time DNA sequencing from single polymerase molecules. Science 323, 133–138. doi:10.1126/science.1162986
Eisen, M. B., Spellman, P. T., Brown, P. O., and Botstein, D. (1998). Cluster analysis and display of genome-wide expression patterns. Proc. Natl. Acad. Sci. U. S. A. 95, 14863–14868. doi:10.1073/pnas.95.25.14863
Eisenstein, M. (2012). Oxford Nanopore announcement sets sequencing sector abuzz’. Nat. Biotechnol. 30 (4), 295–296. doi:10.1038/nbt0412-295
Fan, L., Poh, K. L., and Zhou, P. (2009). ‘A sequential feature extraction approach for naïve bayes classification of microarray data’. Expert Syst. Appl. 36, 9919–9923. doi:10.1016/j.eswa.2009.01.075
Farswan, A., Gupta, A., Gupta, R., and Kaur, G. (2020). Imputation of gene expression data in blood cancer and its significance in inferring biological pathways. Front. Oncol. 9, 1442–1514. doi:10.3389/fonc.2019.01442
Fawcett, T. (2006). An introduction to ROC analysis. Pattern Recognit. Lett. 27, 861–874. doi:10.1016/j.patrec.2005.10.010
Fernandez-Castillo, E., Barbosa-Santillan, L. I., Falcon-Morales, L., and Sanchez-Escobar, J. J. (2022). Deep splicer: A CNN model for splice site prediction in genetic sequences. Genes 13 (5), 907. doi:10.3390/genes13050907
Fernández-Delgado, M., Sirsat, M. S., Cernadas, E., Alawadi, S., Barro, S., and Febrero-BandeM., (2019). An extensive experimental survey of regression methods. Neural Netw. 111, 11–34. doi:10.1016/j.neunet.2018.12.010
Franks, J. M., Cai, G., and Whitfield, M. L. (2018). Feature specific quantile normalization enables cross-platform classification of molecular subtypes using gene expression data. Bioinformatics 34 (11), 1868–1874. doi:10.1093/bioinformatics/bty026
Freyhult, E., Landfors, M., Onskog, J., Hvidsten, T. R., and Ryden, P. (2010). Challenges in microarray class discovery: A comprehensive examination of normalization, gene selection and clustering. BMC Bioinforma. 11 (1), 503–514. doi:10.1186/1471-2105-11-503
Friedman, N., LinialM., , Nachman, I., and Pe'er, D. (2000). Using Bayesian networks to analyze expression data. J. Comput. Biol. 7 (3–4), 601–620. doi:10.1089/106652700750050961
Frommlet, F., Szulc, P., Konig, F., and Bogdan, M. (2022). Selecting predictive biomarkers from genomic data. Plos One 17 (6), e0269369. doi:10.1371/journal.pone.0269369
Furey, T. S., CristiaNiNiN., , DuffyN., , Bednarski, D. W., SchuMMerM., , and Haussler, D. (2000). Support vector machine classification and validation of cancer tissue samples using microarray expression data. Bioinformatics 16 (10), 906–914. doi:10.1093/bioinformatics/16.10.906
Gan, X., Liew, A. W. C., and Yan, H. (2006). Microarray missing data imputation based on a set theoretic framework and biological knowledge. Nucleic Acids Res. 34 (5), 1608–1619. doi:10.1093/nar/gkl047
García-Laencina, P. J., Sancho-Gómez, J. L., and Figueiras-Vidal, A. R. (2008). “Machine learning techniques for solving classification problems with missing input data,” in Proceedings of the 12th World Multi-Conference on Systems, Cybernetics and Informatics, 1–6.
Gautier, L., Cope, L., Bolstad, B. M., and Irizarry, R. A. (2004). Affy - analysis of Affymetrix GeneChip data at the probe level. Bioinformatics 20 (3), 307–315. doi:10.1093/bioinformatics/btg405
Gentleman, R., and Carey, V. J. (2008). “Unsupervised machine learning”, in Bioconductor case studies (New York: Springer), 137–157. doi:10.1007/978-0-387-77240-0_7
Goffinet, B., and Wallach, D. (1989). Mean squared error of prediction as a criterion for evaluating and comparing system models. Ecol. Model. 44, 299–306. doi:10.1016/0304-3800(89)90035-5
Guo, Y., and Tibshirani, R. (2007). Regularized linear discriminant analysis and its application in microarrays. Biostatistics 8 (1), 86–100. doi:10.1093/biostatistics/kxj035
Guruprasad, K., Reddy, B. V. B., and Pandit, M. W. (1990). Correlation between stability of a protein and its dipeptide composition: A novel approach for predicting in vivo stability of a protein from its primary sequence. Protein Eng. 4 (2), 155–161. doi:10.1093/protein/4.2.155
Guyon, I., Matin, N., and Vapnik, V. (1996). Discovering informative patterns and data cleaning, 145–156.
Guyon, I., Weston, J., and Vapnik, V. (2002). Gene selection for cancer classification using support vector machines. Mach. Learn. (46), 62–72. doi:10.1007/978-3-540-88192-6-8
Hambali, M. A., Oladele, T. O., and Adewole, K. S. (2020). Microarray cancer feature selection: Review, challenges and research directions. Int. J. Cognitive Comput. Eng. 1 (11), 78–97. doi:10.1016/j.ijcce.2020.11.001
Hansen, K. D., Irizarry, R. A., and Wu, Z. (2012). Removing technical variability in RNA-seq data using conditional quantile normalization. Biostatistics 13 (2), 204–216. doi:10.1093/biostatistics/kxr054
Harris, T. D., Buzby, P. R., Babcock, H., Beer, E., Bowers, J., Braslavsky, I., et al. (2008). Single-molecule DNA sequencing of a viral genome. Science 320 (5872), 106–109. doi:10.1126/science.1150427
Hijikata, A., Kitamura, H., Kimura, Y., Yokoyama, R., Aiba, Y., Bao, Y., et al. (2007). Construction of an open-access database that integrates cross-reference information from the transcriptome and proteome of immune cells. Bioinformatics 23 (21), 2934–2941. doi:10.1093/bioinformatics/btm430
Hoffmann, R. (2007). Text mining in genomics and proteomics. Fundam. Data Min. Genomics Proteomics 9780387475, 251–274. doi:10.1007/978-0-387-47509-7_12
Holzinger, A., Biemann, C., and Kell, D. (2017). What do we need to build explainable AI systems for the medical domain? 1–28. arXiv preprint arXiv:1712.09923.
Hu, J., Li, H., Waterman, M. S., and Zhou, X. J. (2006). Integrative missing value estimation for microarray data. BMC Bioinforma. 7, 449–514. doi:10.1186/1471-2105-7-449
Huang, C., Clayton, E. A., Matyunina, L. V., McDonald, L. D., Benigno, B. B., Vannberg, F., et al. (2018). Machine learning predicts individual cancer patient responses to therapeutic drugs with high accuracy. Sci. Rep. 8 (1), 16444–16449. doi:10.1038/s41598-018-34753-5
Huang, H. J., Campana, R., Akinfenwa, O., Curin, M., Sarzsinszky, E., Karsonova, A., et al. (2021). Microarray-based allergy diagnosis: Quo vadis? Front. Immunol. 11, 594978–595015. doi:10.3389/fimmu.2020.594978
Hyvärinen, A. (2013). Independent component analysis: Recent advances. Philos. Trans. A Math. Phys. Eng. Sci. 371, 20110534. doi:10.1098/rsta.2011.0534
Irizarry, R. A., Hobbs, B., Collin, F., Beazer-Barclay, Y. D., Antonellis, K. J., Scherf, U., et al. (2003). Exploration, normalization, and summaries of high density oligonucleotide array probe level data. Biostatistics 4, 249–264. doi:10.1093/biostatistics/4.2.249
Jagga, Z., and Gupta, D. (2015). Machine learning for biomarker identification in cancer research - developments toward its clinical application. Per. Med. 12 (6), 371–387. doi:10.2217/pme.15.5
Jenike, M. A., and Albert, M. S. (1984). The dexamethasone suppression test in patients with presenile and senile dementia of the Alzheimer’s type. J. Am. Geriatr. Soc. 32 (6), 441–444. doi:10.1111/j.1532-5415.1984.tb02220.x
Jörnsten, R., Wang, H. Y., Welsh, W. J., and Ouyang, M. (2005). DNA microarray data imputation and significance analysis of differential expression. Bioinformatics 21 (22), 4155–4161. doi:10.1093/bioinformatics/bti638
Jothi, R., Mohanty, S. K., and Ojha, A. (2019). DK-Means: A deterministic K-means clustering algorithm for gene expression analysis. Pattern Anal. Appl. 22 (2), 649–667. doi:10.1007/s10044-017-0673-0
Kang, M., and Jameson, N. J. (2018). ‘Machine learning: Fundamentals’. Prognostics Health Manag. Electron., 85–109. doi:10.1002/9781119515326.ch4
Kanungo, T., Mount, D., Netanyahu, N., Piatko, C., Silverman, R., and Wu, A. (2002). An efficient k-means clustering algorithm: Analysis and implementation. IEEE Trans. Pattern Anal. Mach. Intell. 24 (7), 881–892. doi:10.1109/tpami.2002.1017616
Karthik, S., and Sudha, M. (2018). A survey on machine learning approaches in gene expression classification in modelling computational diagnostic system for complex diseases. Int. J. Eng. Adv. Technol. 8 (2), 182–191.
Karthik, S., and Sudha, M. (2021). Predicting bipolar disorder and schizophrenia based on non-overlapping genetic phenotypes using deep neural network. Evol. Intell. 14 (2), 619–634. doi:10.1007/s12065-019-00346-y
Khatri, P., Sirota, M., and Butte, A. J. (2012). Ten years of pathway analysis: Current approaches and outstanding challenges. PLoS Comput. Biol. 8 (2), e1002375. doi:10.1371/journal.pcbi.1002375
Kia, D. A., Zhang, D., Guelfi, S., Manzoni, C., Hubbard, L., Reynolds, R. H., et al. (2021). Identification of candidate Parkinson disease genes by integrating genome-wide association study, expression, and epigenetic data sets. JAMA Neurol. 78 (4), 464–472. doi:10.1001/jamaneurol.2020.5257
Kim, H., and Park, H. (2007). Sparse non-negative matrix factorizations via alternating non-negativity-constrained least squares for microarray data analysis. Bioinformatics 23 (12), 1495–1502. doi:10.1093/bioinformatics/btm134
Kim, P., and Tidor, B. (2003). Subsystem identification through dimensionality reduction of large-scale gene expression data. Genome Res. 13 (7), 1706–1718. doi:10.1101/gr.903503
Kira, K., and Rendell, L. A. (1992). “A practical approach to feature selection, machine learning,” in Proceedings of the Ninth International Workshop (ML92) (Burlington, Massachusetts: Morgan Kaufmann Publishers, Inc). doi:10.1016/B978-1-55860-247-2.50037-1
Kodama, Y., Mashima, J., Kosuge, T., and Ogasawara, O. (2019). DDBJ update: The Genomic Expression Archive (GEA) for functional genomics data. Nucleic Acids Res. 47 (1), D69–D73. doi:10.1093/nar/gky1002
Kong, W., Mou, X., and Hu, X. (2011). Exploring matrix factorization techniques for significant genes identification of Alzheimer’s disease microarray gene expression data. BMC Bioinforma. 12 (5), 7–9. doi:10.1186/1471-2105-12-S5-S7
Kong, W., Vanderburg, C. R., Gunshin, H., Rogers, J. T., and Huang, X. (2008). A review of independent component analysis application to microarray gene expression data. BioTechniques 45 (5), 501–520. doi:10.2144/000112950
Kotsiantis, S., and Kanellopoulos, D. (2006). Association rules mining: A recent overview. Science 32 (1), 71–82.
Kotsiantis, S. (2007). Supervised machine learning: A review of classification techniques. Informatica 31, 249–268. doi:10.1007/s10751-016-1232-6
Kramer, M. A. (1991). Nonlinear principal component analysis using autoassociative neural networks. AIChE J. 37 (2), 233–243. doi:10.1002/aic.690370209
Krętowski, M., and Grześ, M. (2007). Decision tree approach to microarray data analysis. Biocybern. Biomed. Eng. 27 (3), 29–42.
Kumar, M., Rath, N. K., Swain, A., and Rath, S. K. (2015). Feature selection and classification of microarray data using MapReduce based ANOVA and K-nearest neighbor. Procedia Comput. Sci. 54, 301–310. doi:10.1016/j.procs.2015.06.035
Lai, Y. H., Chen, W. N., Hsu, T. C., Lin, C., Tsao, Y., and Wu, S. (2020). Overall survival prediction of non-small cell lung cancer by integrating microarray and clinical data with deep learning. Sci. Rep. 10 (1), 4679–4711. doi:10.1038/s41598-020-61588-w
Lakiotaki, K., Vorniotakis, N., Tsagris, M., Georgakopoulos, G., and Tsamardinos, I. (2018). BioDataome: A collection of uniformly preprocessed and automatically annotated datasets for data-driven biology. Database (Oxford). 2018, 1–14. doi:10.1093/database/bay011
Land, W. H., Qiao, X., Margolis, D. E., Ford, W. S., Paquette, C. T., Perez-Rogers, J. F., et al. (2011). Kernelized partial least squares for feature reduction and classification of gene microarray data. BMC Syst. Biol. 5, S13. doi:10.1186/1752-0509-5-S3-S13
Langfelder, P., and Horvath, S. (2008). Wgcna: An R package for weighted correlation network analysis. BMC Bioinforma. 9, 559. doi:10.1186/1471-2105-9-559
Larsen, M. J., Thomassen, M., Tan, Q., Sorensen, K. P., and Kruse, T. A. (2014). Microarray-based RNA profiling of breast cancer: Batch effect removal improves cross-platform consistency. Biomed. Res. Int. 2014, 651751. doi:10.1155/2014/651751
Lazar, C., Gatto, L., Ferro, M., Bruley, C., and Burger, T. (2016). Accounting for the multiple natures of missing values in label-free quantitative proteomics data sets to compare imputation strategies. J. Proteome Res. 15 (4), 1116–1125. doi:10.1021/acs.jproteome.5b00981
LeCun, Y., Bengio, Y., and Hinton, G. (2015). Deep learning. Nature 13 (1), 436–444. doi:10.1038/nature14539
LeCun, Y., Bottou, L., Bengio, Y., and Haffner, P. (1998). Gradient-based learning applied to document recognition. Proc. IEEE 86 (11), 2278–2324. doi:10.1109/5.726791
Lee, S., and Batzoglou, S. (2003). Application of independent component analysis to microarrays. Genome Biol. 4 (11), R76–R21. doi:10.1186/gb-2003-4-11-r76
Li, E., Luo, T., and Wang, Y. (2019). Identification of diagnostic biomarkers in patients with gestational diabetes mellitus based on transcriptome gene expression and methylation correlation analysis’, Reproductive Biology and Endocrinology. Reprod. Biol. Endocrinol. 17 (1), 112–12. doi:10.1186/s12958-019-0556-x
Li, H., Zhao, C., Shao, F., Li, G. Z., and Wang, X. (2015). A hybrid imputation approach for microarray missing value estimation. BMC Genomics 16 (9), 1–11. doi:10.1186/1471-2164-16-S9-S1
Li, W., Suh, Y. J., and Zhang, J. (2006). “Does logarithm transformation of microarray data affect ranking order of differentially expressed genes?,” in Conf. Proc. IEEE Eng. Med. Biol. Soc., 6593–6596. doi:10.1109/IEMBS.2006.260896
Li, X., Li, M., and Yin, M. (2016). Multiobjective ranking binary artificial bee colony for gene selection problems using microarray datasets. IEEE/CAA J. Autom. Sin., 1–16. doi:10.1109/JAS.2016.7510034
Li, Z., Xie, W., and Liu, T. (2018). Efficient feature selection and classification for microarray data. PLoS ONE 13 (8), 02021677–e202221. doi:10.1371/journal.pone.0202167
Liew, A. W. C., Law, N. F., and Yan, H. (2011). Missing value imputation for gene expression data: Computational techniques to recover missing data from available information. Brief. Bioinform. 12 (5), 498–513. doi:10.1093/bib/bbq080
Liu, Y.-C., Cheng, C.-P., and Tseng, V. S. (2011). Discovering relational-based association rules with multiple minimum supports on microarray datasets. Bioinformatics 27 (22), 3142–3148. doi:10.1093/bioinformatics/btr526
Liu, Y. (2008). Detect key gene information in classification of microarray data. EURASIP J. Adv. Signal Process., 612397. doi:10.1155/2008/612397
Liu, Y. (2009). Prominent feature selection of microarray data. Prog. Nat. Sci. 19 (10), 1365–1371. doi:10.1016/j.pnsc.2009.01.014
Liu, Z., Sokka, T., Maas, K., Olsen, N. J., and Aune, T. M. (2009). Prediction of disease severity in patients with early rheumatoid arthritis by gene expression profiling. Hum. Genomics Proteomics. 1 (1), 484351. doi:10.4061/2009/484351
Love, M. I., Huber, W., and Anders, S. (2014). Moderated estimation of fold change and dispersion for RNA-seq data with DESeq2. Genome Biol. 15 (12), 550–621. doi:10.1186/s13059-014-0550-8
Lu, H., Xie, R. D., Lin, R., Zhang, C., Xiao, X. J., Li, L. J., et al. (2017). Vitamin D-deficiency induces eosinophil spontaneous activation. Cell. Immunol. 256, 56–63. doi:10.1016/j.cellimm.2017.10.003
Lu, Y., Lu, S., and Deng, Y. (2004). Fgka: A fast genetic K-means clustering algorithm. Proc. ACM Symposium Appl. Comput. 1, 622–623. doi:10.1145/967900.968029
Ma, S., Song, X., and Huang, J. (2007). Supervised group Lasso with applications to microarray data analysis. BMC Bioinforma. 8, 60–17. doi:10.1186/1471-2105-8-60
Mack, C., Su, Z., and Westreich, D. (2018). Managing missing data in patient registries: Addendum to registries for evaluating patient outcomes. A User’s Guide’.
MacQueen, J. (1967). “Some methods for classification and analysis of multivariate observations,” in Proceedings of the fifth Berkeley symposium on mathematical statistics and probability, 281–297. doi:10.1007/s11665-016-2173-6
Manikandan, G., and Abirami, S. (2018). “A survey on feature selection and extraction techniques for high-dimensional microarray datasets,” in Knowledge computing and its applications (Springer Singapore), 311–333.
Margulies, M., Egholm, M., Altman, W. E., Attiya, S., Bader, J. S., Bemben, L. A., et al. (2005). Genome sequencing in microfabricated high-density picolitre reactors. Nature 437 (7057), 376–380. doi:10.1038/nature03959
Matthews, B. W. (1975). Comparison of the predicted and observed secondary structure of T4 phage lysozyme. Biochim. Biophys. Acta 405 (2), 442–451. doi:10.1016/0005-2795(75)90109-9
McNee, S. M., Riedl, J., and Konstan, J. A. (2006). “‘Being accurate is not enough: How accuracy metrics have hurt recommender systems’,” in Conference on Human Factors in Computing Systems - Proceedings, 1097–1101. doi:10.1145/1125451.1125659
McNicholas, P. D., and Murphy, T. B. (2010). Model-based clustering of microarray expression data via latent Gaussian mixture models. Bioinformatics 26 (21), 2705–2712. doi:10.1093/bioinformatics/btq498
Meier, L., Van De Geer, S., and Bühlmann, P. (2008). The group lasso for logistic regression. J. R. Stat. Soc. Ser. B Stat. Methodol. 70 (1), 53–71. doi:10.1111/j.1467-9868.2007.00627.x
Micheuz, P. (2020). “Approaches to artificial intelligence as a subject in school education,” in Open Conference on Computers in Education (Cham.: Springer), 3–13.
Moorthy, K., Jaber, A. N., Ismail, M. A., Ernawan, F., Mohamad, M. S., and Deris, S. (2019). Missing-values imputation algorithms for microarray gene expression data. Methods Mol. Biol., 255–266. doi:10.1007/978-1-4939-9442-7_12
Moorthy, K., and Mohamad, M. S. (2012). Random forest for gene selection and microarray data classification. Bioinformation 7 (3), 142–146. doi:10.6026/97320630007142
Morais-Rodrigues, F., Silv Erio-Machado, R., Kato, R. B., Rodrigues, D. L. N., Valdez-Baez, J., Fonseca, V., et al. (2020). Analysis of the microarray gene expression for breast cancer progression after the application modified logistic regression. Gene 726, 144168–8. doi:10.1016/j.gene.2019.144168
Motieghader, H., Najafi, A., Sadeghi, B., and Masoudi-Nejad, A. (2017). A hybrid gene selection algorithm for microarray cancer classification using genetic algorithm and learning automata. Inf. Med. Unlocked 9 (8), 246–254. doi:10.1016/j.imu.2017.10.004
Neubauer, C. (1998). Evaluation of convolutional neural networks for visual recognition. IEEE Trans. Neural Netw. 9 (4), 685–696. doi:10.1109/72.701181
Nguyen, N. G., Tran, V. A., Ngo, D. L., Phan, D., Lumbanraja, F. R., Faisal, M. R., et al. (2016). DNA sequence classification by convolutional neural network. J. Biomed. Sci. Eng. 09 (05), 280–286. doi:10.4236/jbise.2016.95021
Nidheesh, N., Abdul Nazeer, K. A., and Ameer, P. M. (2017). An enhanced deterministic K-Means clustering algorithm for cancer subtype prediction from gene expression data. Comput. Biol. Med. 91, 213–221. doi:10.1016/j.compbiomed.2017.10.014
Nikkila, J., Toronen, P., Kaski, S., Venna, J., Castren, E., and Wong, G. (2002). Analysis and visualization of gene expression data using Self-Organizing Maps. Neural Netw. 15, 953–966. doi:10.1016/s0893-6080(02)00070-9
Nikumbh, S., Ghosh, S., and Jayaraman, V. K. (2012). “Biogeography-based informative gene selection and cancer classification using SVM and Random Forests,” in 2012 IEEE Congress on Evolutionary Computation (Brisbane, QLD: CEC 2012), 1–6. doi:10.1109/CEC.2012.6256127
Oba, S., Sato, M. A., Takemasa, I., Monden, M., Matsubara, K. i., and Ishii, S. (2003). A Bayesian missing value estimation method for gene expression profile data. Bioinformatics 19 (16), 2088–2096. doi:10.1093/bioinformatics/btg287
O’Connell, M. (2003). Differential expression, class discovery and class prediction using S-PLUS and S+ArrayAnalyzer. SIGKDD Explor. Newsl. 5 (2), 38–47. doi:10.1145/980972.980979
Oladejo, A. K., Oladele, T. O., and Saheed, Y. K. (2018). Comparative evaluation of linear support vector machine and K-nearest neighbour algorithm using microarray data on leukemia cancer dataset. Afr. J. Comput. ICT 11 (2), 1–10.
Önskog, J., Freyhult, E., Landfors, M., Ryden, P., and Hvidsten, T. R. (2011). Classification of microarrays; synergistic effects between normalization, gene selection and machine learning. BMC Bioinforma. 12, 390. doi:10.1186/1471-2105-12-390
O’Shea, K., and Nash, R. (2015). An introduction to convolutional neural networks, 1–11. arXiv preprint, arXiv:1511.
Ouyang, M., Welsh, W. J., and Georgopoulos, P. (2004). Gaussian mixture clustering and imputation of microarray data. Bioinformatics 20 (6), 917–923. doi:10.1093/bioinformatics/bth007
Pan, H., Zhu, J., and Han, D. (2003). Genetic algorithms applied to multi-class clustering for gene ex- pression data partitional clustering techniques’. Genomics Proteomics Bioinforma. 1 (4), 279–287. doi:10.1016/S1672-0229(03)01033-7
Pan, W., Lin, J., and Le, C. T. (2002). Model-based cluster analysis of microarray gene-expression data. Genome Biol. 3 (2), RESEARCH0009–8. doi:10.1186/gb-2002-3-2-research0009
Pan, X., Tian, Y., Huang, Y., and Shen, H. B. (2011). Towards better accuracy for missing value estimation of epistatic miniarray profiling data by a novel ensemble approach’, Genomics. Genomics 97 (5), 257–264. doi:10.1016/j.ygeno.2011.03.001
Pan, X., and Yan, J. (2017) ‘Attention based convolutional neural network for predicting RNA-protein binding sites’, arXiv preprint, arXiv:1712, pp. 8–11.
Parihar, A., Mondal, S., and Singh, R. (2022). “Introduction, scope, and applications of biotechnology and genomics for sustainable agricultural production,” in Plant genomics for sustainable agriculture. Editor R. Lakhan (Springer), 1–14. doi:10.1007/978-981-16-6974-3
Parikh, R., Andjelković Apostolović, M., and Stojanović, D. (2008a). Understanding and using sensitivity, specificity and predictive values. Indian J. Ophthalmol. 56 (1), 341–350. doi:10.4103/0301-4738.41424
Parikh, R., Mathai, A., Parikh, S., Chandra Sekhar, G., and Thomas, R. (2008b). Understanding and using sensitivity, Specificity and predictive values. Indian J. Ophthalmol. 56 (1), 45–50. doi:10.4103/0301-4738.37595
Park, C., Ha, J., and Park, S. (2020). Prediction of Alzheimer’s disease based on deep neural network by integrating gene expression and DNA methylation dataset. Expert Syst. Appl. 140, 112873. doi:10.1016/j.eswa.2019.112873
Park, H.-S., Yoo, S.-H., and Cho, S.-B. (2007). Forward selection method with regression analysis for optimal gene selection in cancer classification. Int. J. Comput. Math. 84 (5), 653–667. doi:10.1080/00207160701294384
Pease, A. C., Solas, D., and Sullivan, E. J. (1994). “Light-generated oligonucleotide arrays for rapid DNA sequence analysis,” in Proceedings of the National Academy of Sciences of the United States of America, 5022–5026. doi:10.1073/pnas.91.11.5022
Peng, J., Guan, J., and Shang, X. (2019). Predicting Parkinson’s disease genes based on node2vec and autoencoder. Front. Genet. 10, 226–6. doi:10.3389/fgene.2019.00226
Peng, Y., Li, W., and Liu, Y. (2006). A hybrid approach for biomarker discovery from microarray gene expression data for cancer classification. Cancer Inf. 2, 117693510600200–117693510600311. doi:10.1177/117693510600200024
Peterson, L. E., and Coleman, M. A. (2008). Machine learning-based receiver operating characteristic (ROC) curves for crisp and fuzzy classification of DNA microarrays in cancer research. Int. J. Approx. Reason. 47 (1), 17–36. doi:10.1016/j.ijar.2007.03.006
Pirooznia, M., Yang, J. Y., Yang, M. Q., and Deng, Y. (2008). A comparative study of different machine learning methods on microarray gene expression data. BMC Genomics 9 (1), S13–S13. doi:10.1186/1471-2164-9-S1-S13
Pochet, N., De Smet, F., Suykens, J. A. K., and De Moor, B. L. R. (2004). Systematic benchmarking of microarray data classification: Assessing the role of non-linearity and dimensionality reduction. Bioinformatics 20 (17), 3185–3195. doi:10.1093/bioinformatics/bth383
Prasanna, K., Seetha, M., and Kumar, A. P. S. (2014). “CApriori: Conviction based Apriori algorithm for discovering frequent determinant patterns from high dimensional datasets,” in 2014 International Conference on Science Engineering and Management Research, ICSEMR 2014 (IEEE). doi:10.1109/ICSEMR.2014.7043622
Qiu, Y. L., Zheng, H., and Gevaert, O. (2018). A deep learning framework for imputing missing values in genomic data. BioRxiv, 406066.
Qiu, Y. L., Zheng, H., and Gevaert, O. (2020). Genomic data imputation with variational auto-encoders. Gigascience, 9. giaa082–12. doi:10.1093/gigascience/giaa082
Quackenbush, J. (2001). Computational analysis of microarray data. Nat. Rev. Genet. 2, 418–427. doi:10.1038/35076576
Radovic, M., Ghalwash, M., Filipovic, N., and Obradovic, Z. (2017). Minimum redundancy maximum relevance feature selection approach for temporal gene expression data’. BMC Bioinforma. 18 (1), 9–14. doi:10.1186/s12859-016-1423-9
Ram, P. K., and Kuila, P. (2019). Feature selection from microarray data : Genetic algorithm based approach. J. Inf. Optim. Sci. 40 (8), 1599–1610. doi:10.1080/02522667.2019.1703260
Refaeilzadeh, P., Tang, L., and Liu, H. (2009). Cross-validation. Encycl. Database Syst. 5, 532–538. doi:10.1007/978-0-387-39940-9_565
Rhoads, A., and Au, K. F. (2015). PacBio sequencing and its applications. Genomics Proteomics Bioinforma. 13 (5), 278–289. doi:10.1016/j.gpb.2015.08.002
Ribeiro, M. T., Singh, S., and Guestrin, C. (2016). “Why should I trust you?,” in Proceedings of the 22nd ACM SIGKDD International Conference on Knowledge Discovery and Data Mining - KDD ’16, 1135–1144. doi:10.1145/2939672.2939778
Ringnér, M. (2008). What is principal component analysis. Nat. Biotechnol. 26 (3), 303–304. doi:10.1038/nbt0308-303
Ritchie, M. E., Phipson, B., Wu, D., Hu, Y., Law, C. W., Shi, W., et al. (2015). Limma powers differential expression analyses for RNA-sequencing and microarray studies. Nucleic Acids Res. 43 (7), e47. doi:10.1093/nar/gkv007
Robinson, M. D., McCarthy, D. J., and Smyth, G. K. (2009). edgeR: A Bioconductor package for differential expression analysis of digital gene expression data. Bioinformatics 26 (1), 139–140. doi:10.1093/bioinformatics/btp616
Rothberg, J. M., Hinz, W., Rearick, T. M., Schultz, J., Mileski, W., Davey, M., et al. (2011). An integrated semiconductor device enabling non-optical genome sequencing’. Nature 475 (7356), 348–352. doi:10.1038/nature10242
Rousseeuw, P. J. (1987). Silhouettes: A graphical aid to the interpretation and validation of cluster analysis. J. Comput. Appl. Math. 20, 53–65. doi:10.1016/0377-0427(87)90125-7
Rubin, D. B. (1976). Inference and missing data. Biometrika 63 (3), 581–592. doi:10.1093/biomet/63.3.581
Ryan, C., Greene, D., Cagney, G., and Cunningham, P. (2010). Missing value imputation for epistatic MAPs. BMC Bioinforma. 11, 197. doi:10.1186/1471-2105-11-197
Saeys, Y., Inza, I., and Larrañaga, P. (2007). A review of feature selection techniques in bioinformatics. Bioinformatics 23 (19), 2507–2517. doi:10.1093/bioinformatics/btm344
Safavian, S. R., and Landgrebe, D. (1991). A survey of decision tree classifier methodology. IEEE Trans. Syst. Man. Cybern. 21 (3), 660–674. doi:10.1109/21.97458
Saha, S., Ghost, A., and Dey, K. (2017). “An ensemble based missing value estimation in DNA microarray using artificial neural network,” in Proceedings - 2016 2nd IEEE International Conference on Research in Computational Intelligence and Communication Networks, February 2019 (Kolkata, India: ICRCICN 2016), 279–284. doi:10.1109/ICRCICN.2016.7813671
Sahu, B., and Mishra, D. (2012). A novel feature selection algorithm using particle swarm optimization for cancer microarray data. Procedia Eng. 38, 27–31. doi:10.1016/j.proeng.2012.06.005
Sahu, M. A., Swarnkar, M. T., and Das, M. K. (2011). Estimation methods for microarray data with missing values : A review. Int. J. Comput. Sci. Inf. Technol. 2 (2), 614–620.
Sanger, F., Nicklen, S., and Coulson, A. R. (1977). DNA sequencing with chain-terminating inhibitors. Proc. Natl. Acad. Sci. U. S. A. 74 (12), 5463–5467. doi:10.1073/pnas.74.12.5463
Sayed, S., Nassef, M., Badr, A., and Farag, I. (2019). A Nested Genetic Algorithm for feature selection in high-dimensional cancer Microarray datasets. Expert Syst. Appl. 121 (C), 233–243. doi:10.1016/j.eswa.2018.12.022
Schafer, J. L., and Graham, J. W. (2002). Missing data: Our view of the state of the art. Psychol. Methods 7 (2), 147–177. doi:10.1037/1082-989X.7.2.147
Schmidt, L. J., Murillo, H., and Tindall, D. J. (2004). Gene expression in prostate cancer cells treated with the dual 5 alpha-reductase inhibitor dutasteride. J. Androl. 25 (6), 944–953. doi:10.1002/j.1939-4640.2004.tb03166.x
Segundo-Val, I. S., and Sanz-Lozano, C. S. (2016). Introduction to the gene expression analysis. Methods Mol. Biol. 1434, 29–43. doi:10.1007/978-1-4939-3652-6_3
Sharma, A., Paliwal, K. K., Imoto, S., and Miyano, S. (2014). A feature selection method using improved regularized linear discriminant analysis. Mach. Vis. Appl. 25, 775–786. doi:10.1007/s00138-013-0577-y
Sharma, A., and Rani, R. (2021). ‘A systematic review of applications of machine learning in cancer prediction and diagnosis’. Arch. Comput. Methods Eng. 28, 4875–4896. doi:10.1007/s11831-021-09556-z
Shendure, J., Porreca, G. J., Reppas, N. B., Lin, X., McCutcheon, J. P., Rosenbaum, A. M., et al. (2005). Accurate multiplex polony sequencing of an evolved bacterial genome. Science 309, 1728–1732. doi:10.1126/science.1117389
Smith, G. S., and Snyder, R. L. (1979). F<i>N</i>: A criterion for rating powder diffraction patterns and evaluating the reliability of powder-pattern indexing. J. Appl. Crystallogr. 12, 60–65. doi:10.1107/s002188987901178x
Smyth, G. K., and Speed, T. (2003). Normalization of cDNA microarray data. Methods 31 (4), 265–273. doi:10.1016/s1046-2023(03)00155-5
Smyth, G. K. (2005). ‘limma: Linear models for microarray data’. Bioinforma. Comput. Biol. Solutions Using R Bioconductor 11, 397–420. doi:10.1007/0-387-29362-0_23
Souto, M. C. P. D., Jaskowiak, P. A., and Costa, I. G. (2015). Impact of missing data imputation methods on gene expression clustering and classification. BMC Bioinforma. 16, 64–69. doi:10.1186/s12859-015-0494-3
Statnikov, A., Wang, L., and Aliferis, C. F. (2008). A comprehensive comparison of random forests and support vector machines for microarray-based cancer classification. BMC Bioinforma. 9, 319–410. doi:10.1186/1471-2105-9-319
Storey, J., and Tibshirani, R. (2003). “Statistical methods for identifying differentially expressed genes in DNA microarrays,” in Methods in molecular biology (Totowa, NJ: Humana Press), 149–157.
Sturm, B. L. (2013). Classification accuracy is not enough: On the evaluation of music genre recognition systems. J. Intell. Inf. Syst. 41, 371–406. doi:10.1007/s10844-013-0250-y
Subashini, P., and Krishnaveni, M. (2011). “Imputation of missing data using bayesian principal component analysis on tec ionospheric satellite dataset,” in Canadian Conference on Electrical and Computer Engineering (IEEE), 001540–001543. doi:10.1109/CCECE.2011.6030724–
Tabares-Soto, R., Orozco-Arias, S., Romero-Cano, V., Segovia Bucheli, V., Rodriguez-Sotelo, J. L., and Jimenez-Varon, C. F. (2020). A comparative study of machine learning and deep learning algorithms to classify cancer types based on microarray gene expression data. PeerJ. Comput. Sci. 6 (207), 2700–e322. doi:10.7717/peerj-cs.270
Tamayo, P., Slonim, D., and Zhu, Q. (1999). “Interpreting patterns of gene expression with self-organizing maps: Methods and application to hematopoietic differentiation,” in Proceedings of the National Academy of Sciences of the United States of America, 2907–2912. doi:10.1073/pnas.96.6.2907
Tavazoie, S., Hughes, J. D., Campbell, M. J., Cho, R. J., and Church, G. M. (1999). Systematic determination of genetic network architecture. Nat. Genet. 22 (3), 281–285. doi:10.1038/10343
Tibshirani, R., Hastie, T., Narasimhan, B., and Chu, G. (2003). Class prediction by nearest shrunken centroids , with applications to DNA microarrays. Stat. Sci. 18 (1), 104–117. doi:10.1214/ss/1056397488
Tibshiranit, B. R. (1996). Regression shrinkage and selection via the lasso. J. R. Stat. Soc. Ser. B Methodol. 58 (1), 267–288. doi:10.1111/j.2517-6161.1996.tb02080.x
Tomczak, K., Czerwińska, P., and Wiznerowicz, M. (2015). The Cancer Genome Atlas (TCGA): An immeasurable source of knowledge. Contemp. Oncol. 1, A68–A77. doi:10.5114/wo.2014.47136
Toro-Domínguez, D., Lopez-Dominguez, R., Garcia Moreno, A., Villatoro-Garcia, J. A., Martorell-Marugan, J., Goldman, D., et al. (2019). Differential treatments based on drug-induced gene expression signatures and longitudinal systemic lupus erythematosus stratification. Sci. Rep. 9 (1), 15502–15509. doi:10.1038/s41598-019-51616-9
Troyanskaya, O., CantorM., , Sherlock, G., Brown, P., HasTie, T., TibshiRani, R., et al. (2001). Missing value estimation methods for DNA microarrays. Bioinformatics 17 (6), 520–525. doi:10.1093/bioinformatics/17.6.520
Tuikkala, J., Elo, L. L., Nevalainen, O. S., and Aittokallio, T. (2008). Missing value imputation improves clustering and interpretation of gene expression microarray data. BMC Bioinforma. 9, 202–214. doi:10.1186/1471-2105-9-202
Tuikkala, J., Elo, L., Nevalainen, O. S., and Aittokallio, T. (2006). Improving missing value estimation in microarray data with gene ontology. Bioinformatics 22 (5), 566–572. doi:10.1093/bioinformatics/btk019
Turgut, S., Dagtekin, M., and Ensari, T. (2018). “Microarray breast cancer data classification using machine learning methods,” in 2018 Electric Electronics, Computer Science, Biomedical Engineerings’ Meeting, EBBT 2018 (IEEE), 1–3. doi:10.1109/EBBT.2018.8391468
Tyagi, V., and Mishra, A. (2013). A survey on different feature selection methods for microarray data analysis. Int. J. Comput. Appl. 67 (16), 36–40. doi:10.5120/11482-7181
Uhl, M., Tran, V. D., Heyl, F., and Backofen, R. (2021). RNAProt: An efficient and feature-rich RNA binding protein binding site predictor. Gigascience, 10. GigaScience, giab054–13. doi:10.1093/gigascience/giab054
Umarov, R. K., and Solovyev, V. V. (2017). Recognition of prokaryotic and eukaryotic promoters using convolutional deep learning neural networks. PLoS ONE 12 (2), e0171410–e0171412. doi:10.1371/journal.pone.0171410
Valouev, A., Ichikawa, J., Tonthat, T., Stuart, J., Ranade, S., Peckham, H., et al. (2008). A high-resolution, nucleosome position map of C. elegans reveals a lack of universal sequence-dictated positioning. Genome Res. 18 (7), 1051–1063. doi:10.1101/gr.076463.108
Vihinen, M. (2012). How to evaluate performance of prediction methods? Measures and their interpretation in variation effect analysis. BMC genomics 13, S2–S10. doi:10.1186/1471-2164-13-S4-S2
Vincent, P., Larochelle, H., and Lajoie, I. (2010). Stacked denoising Autoencoders: Learning useful representations in a deep network with a local denoising criterion. J. Mach. Learn. Res. 11, 3371–3408.
Vincent, P., and Larochelle, H. (2008). “Extracting and composing robust features with denoising,” in Proceedings of the 25th international conference on Machine learning, 1096–1103.
Vo, A. H., Van Vleet, T. R., Gupta, R. R., Liguori, M. J., and Rao, M. S. (2020). An overview of machine learning and big data for drug toxicity evaluation. Chem. Res. Toxicol. 33 (1), 20–37. doi:10.1021/acs.chemrestox.9b00227
Wang, A., Chen, Y., An, N., Yang, J., Li, L., and Jiang, L. (2019). Microarray missing value imputation: A regularized local learning method’. IEEE/ACM Trans. Comput. Biol. Bioinform. 16 (3), 980–993. doi:10.1109/TCBB.2018.2810205
Wang, X., Li, A., Jiang, Z., and Feng, H. (2006). Missing value estimation for DNA microarray gene expression data by Support Vector Regression imputation and orthogonal coding scheme. BMC Bioinforma. 7, 32–10. doi:10.1186/1471-2105-7-32
Winston, P. H. (1992). Artificial intelligence. Addison-Wesley Longman Publishing Co., Inc. ACM digital library.
Xiang, Q., Dai, X., Deng, Y., He, C., Wang, J., Feng, J., et al. (2008). Missing value imputation for microarray gene expression data using histone acetylation information. BMC Bioinforma. 9, 1–17. doi:10.1186/1471-2105-9-252
Yang, Y., Dudoit, S., Luu, P., Lin, D. M., Peng, V., Ngai, J., et al. (2002). Normalization for cDNA microarray data: A robust composite method addressing single andmultiple slide systematic variation. Nucleic Acids Res. 30 (4), e15–e10. doi:10.1093/nar/30.4.e15
Yip, W., Amin, S. B., and Li, C. (2011). “A survey of classification techniques for microarray data analysis,” in Handbook of statistical bioinformatics springer (Berlin, Heidelberg: Springer Berlin Heidelberg), 193–223. doi:10.1007/978-3-642-16345-610
Yu, L., and Liu, H. (2003). “Feature selection for high-dimensional data: A fast correlation-based filter solution,” in Proceedings, Twentieth International Conference on Machine Learning, 856–863.
Yuxi, L., Schukat, M., and Howley, E. (2018) ‘Deep reinforcement learning: An overview’, , arXiv preprint arXiv:1701.07274, 16, pp. 426–440. doi: doi:10.1007/978-3-319-56991-8_32
Zeebaree, D. Q., Haron, H., and Abdulazeez, A. M. (2018). “Gene selection and classification of microarray data using convolutional neural network,” in International Conference on Advanced Science and Engineering (ICOASE) (IEEE), 145–150. doi:10.1109/ICOASE.2018.8548836
Zhang, X., Jonassen, I., and Goksøyr, A. (2021). Machine learning approaches for biomarker discovery using gene expression data. Bioinformatics, 53–64.
Zhang, Y., Yang, Y., Wang, C., Wan, S., Yao, Z., and Zhang, Y. (2020). Identification of diagnostic biomarkers of osteoarthritis based on multi-chip integrated analysis and machine learning. DNA Cell Biol. 39, 2245–2256. doi:10.1089/dna.2020.5552
Zheng, C. H., Huang, D. S., and Shang, L. (2006). Feature selection in independent component subspace for microarray data classification. Neurocomputing 69, 2407–2410. doi:10.1016/j.neucom.2006.02.006
Keywords: gene expression, microarray, machine learning, deep learning, missing value imputation, feature selection, interpretation, explainable techniques
Citation: Bhandari N, Walambe R, Kotecha K and Khare SP (2022) A comprehensive survey on computational learning methods for analysis of gene expression data. Front. Mol. Biosci. 9:907150. doi: 10.3389/fmolb.2022.907150
Received: 29 March 2022; Accepted: 28 September 2022;
Published: 07 November 2022.
Edited by:
Deepak Kumar Jain, Chongqing University of Posts and Telecommunications, ChinaReviewed by:
Sameet Mehta, Yale University, United StatesStephen R. Piccolo, Brigham Young University, United States
Copyright © 2022 Bhandari, Walambe, Kotecha and Khare. This is an open-access article distributed under the terms of the Creative Commons Attribution License (CC BY). The use, distribution or reproduction in other forums is permitted, provided the original author(s) and the copyright owner(s) are credited and that the original publication in this journal is cited, in accordance with accepted academic practice. No use, distribution or reproduction is permitted which does not comply with these terms.
*Correspondence: Rahee Walambe, cmFoZWUud2FsYW1iZUBzaXRwdW5lLmVkdS5pbg==; Ketan Kotecha, ZHJrZXRhbmtvdGVjaGFAZ21haWwuY29t; Satyajeet P. Khare, c2F0eWFqZWV0LmtoYXJlQHNzYnMuZWR1Lmlu