- 1Yellow Sea Fisheries Research Institute, Chinese Academy of Fishery Sciences, Qingdao, China
- 2Laboratory for Marine Biology and Biotechnology, Qingdao National Laboratory for Marine Science and Technology, Qingdao, China
Background: The differential expression of the same gene in different tissues could be due to the genotype effect, tissue effect, and/or genotype × tissue interactions. However, the genetic mechanisms responsible for this differential expression have not been reported to date.
Methods: Four resistance genes to low temperature, the genes for antifreeze protein (AFP), cold induced RNA binding protein (CIRP), high mobility group protein box-1 (HMGB1), and Y-box binding protein (YB-1), were measured by PCR in the liver, spleen, kidney, brain, heart, intestine, muscle, gonad, and skin of Takifugu rubripes cultured under different temperature conditions (18, 13, 8, and 5°C). Split-split-plot analysis of variance, additive main effects and multiplicative interaction (AMMI) and genotype main effects and genotype × environment interaction (GGE) biplot analysis were used to evaluate the effects of genotype × tissue interactions on gene expression.
Results: The results of split-split-plot analysis of variance showed that water temperature has a significant effect on the expression of T. rubripes cold resistant genes, while tissue × gene interaction has a highly significant effect on it. AMMI analysis showed that the contributions of genotype, tissue, and genotype × tissue interactions to the total variation in gene expression followed two trends: 1) as temperature decreased, the gene effect increased gradually and the genotype × tissue interaction decreased gradually; 2) the gene effect at 18 and 13°C was significantly lower than that at 8 and 5°C, while the interaction at 18 and 13°C was significantly higher than that at 8 and 5°C. GGE analysis showed that: at all temperatures except 8°C, the expression rankings of all four genes were highly positively correlated in all tissues except muscle; the expression stability of the genes was the same at 18°C/13°C and at 8°C/5°C; and AFP1 showed the best expression and stability among the four genes.
Conclusion: 8°C/5°C as the suitable temperature for such experiments for T. rubripes. Among the four antifreeze genes evaluated in this study, AFP1 had the best expression and stability.
1 Introduction
Water temperature plays an important role in the growth and reproduction of aquatic animals. Water temperature that is too low leads to weakened fish activity and decreased levels of neurohormone secretion and digestive enzyme activity, resulting in the reduction of growth performance and even death (Abdel-Tawwab and Wafeek, 2014; Wen et al., 2017; Islam et al., 2019; Islam et al., 2020). The suitable growth temperature of the warm-water fish Takifugu rubripes is 16–25 °C, and colder water temperatures in winter seriously affect its growth performance. At present, heating the water of indoor tanks is usually used to solve this problem, but it is expensive and not environmentally friendly. Therefore, studying the molecular mechanisms involved in cold adaptation of T. rubripes and cultivating cold-resistant varieties is an alternative approach.
Studies of the mechanisms of cold tolerance of fish have been increasing since the 1960s. With the continuous development of molecular biology techniques, numerous genes related to cold tolerance have been discovered and applied to practical production. Antifreeze proteins (AFPs) were first found in polar marine organisms, and later studies reported that they are widespread in fish, plants, insects, bacteria, and fungi (Duman and Olsen, 1993; Cui et al., 2019; Xu et al., 2019; Zhang et al., 2020). AFPs are adsorbed onto the surface of ice crystals, where they inhibit the growth rate of ice crystals and reduce the freezing point of water molecules, thereby conferring cold resistance (Raymond and DeVries, 1977; Wang et al., 2012). Numerous studies of AFPs in fish have also been conducted (Hew et al., 1999; Zhong and Fan, 2002; Cai L. Y. et al., 2018). Early studies reported that cold-induced RNA binding protein (CIRP) was closely related to hypothermia stimulation, and its expression increased significantly with decreasing temperature (Nishiyama et al., 1997). In a low temperature environment, CIRP slows down the rate of apoptosis by inhibiting cell division and reducing the demand for nutrients, and it coordinates the transcription and translation of multiple genes (Al-Fageeh and Smales, 2006). In recent years, researchers have found that CIRP is involved in the response to low temperature stress in some fish (Hu et al., 2015; Miao et al., 2017; Xu et al., 2018). High speed migration protein family protein (HMGB1), which is ubiquitous in eukaryotes and highly conservative, participates in DNA transcription, recombination, and repair (Lange and Vasquez, 2009), and it regulates the expression of some genes related to low temperature (Vornanen et al., 2005). Y-box binding protein 1 (YB-1) is a highly conserved protein that widely exists in bacteria, plants, and vertebrates (Swamynathan et al., 1998). Its conserved region can not only bind to DNA and RNA, but it also can bind to other proteins that interact with transcription factors, thereby affecting the expression and regulation of related genes. It is a very important protein in the process of body regulation (Kloks et al., 2002; Eliseeva et al., 2011). As a stress response gene, YB-1 responds to a variety of stresses in different species (Rauen et al., 2016; Li et al., 2018). Several previous studies of HMGB1 and YB-1 have focused on fish immunity (Cai et al., 2014; Xie et al., 2014; Cai X. et al., 2018; He et al., 2019).
The same gene often shows different expression in different tissues in the same organism. This has been reported in livestock (Schwerin et al., 1999; Chen et al., 2011; Ahmadi et al., 2020; Li et al., 2020), plants (Ling et al., 2018), fish (Li et al., 2008; Sun, 2017; Yu et al., 2017), and even humans (Karges et al., 1994). To study the mechanism of low temperature tolerance of T. rubripes, Sun (2017) used quantitative real-time PCR to analyze the expression of AFP, CIRP, HMGB1, and YB-1 in the liver, spleen, kidney, brain, heart, intestine, muscle, gonad, and skin of fish cultured under different temperature conditions (18, 13, 8, and 5°C). They reported that the expression levels of the four genes differed among tissues and temperatures. The differential expression of the same gene in different tissues could be due to the genotype effect, tissue effect, and/or genotype × tissue interactions. However, the genetic mechanisms responsible for this differential expression have not been reported to date.
In this study, an additive main effects and multiplicative interaction (AMMI) (Gollob, 1968) and genotype main effects and genotype × environment interaction (GGE) biplot analysis (Yan and Kang, 2003) was used to analyze genotype × tissue interactions affecting expression of the AFP1, CIRP, YB-1, and HMGB1 genes in T. rubripes cultured under different low temperature conditions. The purpose of this study was to identify the genetic mechanisms at work for the four genes in different tissues in T. rubripes under different low temperature conditions in order to provide a reference for formulating a breeding plan to cultivate cold-resistant varieties of T. rubripes.
2 Materials and Methods
2.1 Experimental Materials
The experimental T. rubripes came from Tianzheng Industrial Company Limited, Dalian, China. We selected 360 young fish (body length 15 ± 0.5 cm) with strong physique, no damage, and good vitality, and cultured them for 2 weeks in 12 experimental barrels (500 L, each containing 30 fish) equipped with static water aeration. The water was changed once per day.
For the experiment, four temperatures (18, 13, 8, and 5°C) were set, with triplicate barrels for each temperature. After the temporary cultivation, we used acute water exchange and cooling to bring the barrels to the correct temperature. While discharging the seawater, seawater previously adjusted to the experimental temperature was added until the temperature reached the target temperature. Yameiguang 411-H titanium heaters (GermayHeater Co., Ltd., Hefei, Anhui, China) were used to control the temperature, and water temperature readings were taken every 2 h. The fish were not fed during the experiment, and the experiment ended after 24 h of stress. Three fish were taken from each breeding barrel. After being anesthetized with 200 mg/L of MS222 (tricaine methane sulfonate) (Maya Reagent, China), each fish was dissected on ice to obtain the liver, spleen, kidney, brain, heart, intestine, muscle, skin, and gonad. Tissues were immersed in 10 times the volume of RNA preservation solution (Tiangen Biotech Co., Ltd., Beijing, China) and stored at –80°C after storage at 4°C for 24 h. Yellow Sea Fisheries Research Institute, CAFS ethics committee approved the study (Decision no: YSFRI-2021023).
2.2 Extraction of Total RNA and Construction of the cDNA Library
Total RNA extraction kits (Tiangen Biotech Co., Ltd., Beijing, China) were used to extract RNA. Agarose gel electrophoresis was used to evaluate RNA quality, and UV spectrophotometry was used to detect the concentration of RNA. We used 1 µg of total RNA to synthesize the first strand cDNA according to the instructions of the transcript reverse transcription kit (Tiangen Biotech Co., Ltd., Beijing, China), and we froze the product at –80°C for use in the next experiment.
2.3 Real Time Fluorescence Quantitative PCR (RT-qPCR)
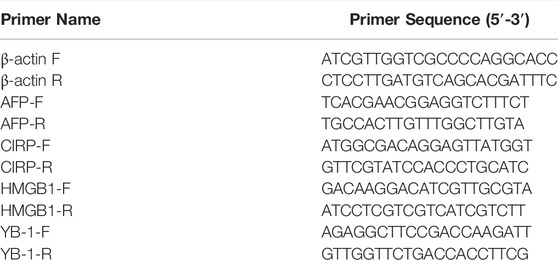
We used RT-qPCR to detect the expression of the four target genes and the reference gene (β-actin). Quantitative primers were designed using primer express 3.0 and synthesized by Sangon Biotech Co., Ltd. (Shanghai, China). The primer sequences are shown in Table 1. The 20 µL reaction volume contained the following: 10 µL of 2 × SuperReal PreMix Plus, 0.4 µL of 50 × ROX Reference Dye, 7.4 µL of RNase-Free ddH2O, 0.6 µL of each primer (upstream primer F and downstream primer R), and 1 µL of CDNA template. The RT-qPCR reaction was carried out on the ABI StepOnePlus platform (Applied Biosystems, Shanghai, China). The PCR reaction procedure was pre-denaturation at 94 °C for 30 s followed by two-step PCR (94°C for 5 s, 60°C for 30 s, 40 cycles). After the reaction, the dissolution curve was drawn to ensure the specificity and accuracy of amplification.
2.4 Data Processing
The expression patterns of the four genes in the nine tissues were analyzed using the 2–ΔΔCt method with β-actin as the reference gene.
2.5 Data Analysis
2.5.1 Split-Split-Plot Analysis of Variance
Refer to Piepho and Edmondson (2018), this experiment was laid out as a split-split-plot design, with temperature as the main-plot factor with the four temperature gradients (18, 13, 8, and 5°C) assigned to four main plots in each of three complete replicate blocks, tissue as the sub-plot (or split-plot) factor with the nine tissues (liver, spleen, kidney, brain, heart, intestine, muscle, gonad, and skin) assigned to nine sub-plots within each main plot and cold resistant genes as the sub-sub-plot (or split-split-plot) factor with the four cold resistant genes (AFP1, CIRP, YB-1, and HMGB1) assigned to individual sub-sub-plots within each sub-plot. The split-split-plot analysis model is written according Eq 1.
where
2.5.2 AMMI Analysis
The AMMI model for the gth genotype (AFP1, CIRP, YB-1, and HMGB1) in the eth tissue (brain, heart, intestine, kidney, liver, muscle, spleen, skin, and gonad) is written according Eq 2.
where
2.5.3 GGE Biplot Analysis
GGE biplot analysis can reveal the complex interactions between different factors (Yan, 1999; Yan, 2001; Yan and Holland, 2010). The gene expression data obtained from different tissues were sorted into a two-way table including genes expression and tissue, in which each value is the average value of the expression of the corresponding gene in the corresponding tissue (i.e., the phenotype value (
where
The split-split-plot analysis, AMMI and GGE biplot analyses were performed using the DPS Data Processing System (Tang, 2007).
3 Results
Table 2 shows the expression of AFP1, CIRP, YB-1, and HMGB1 in different tissues from fish cultured at different temperatures.
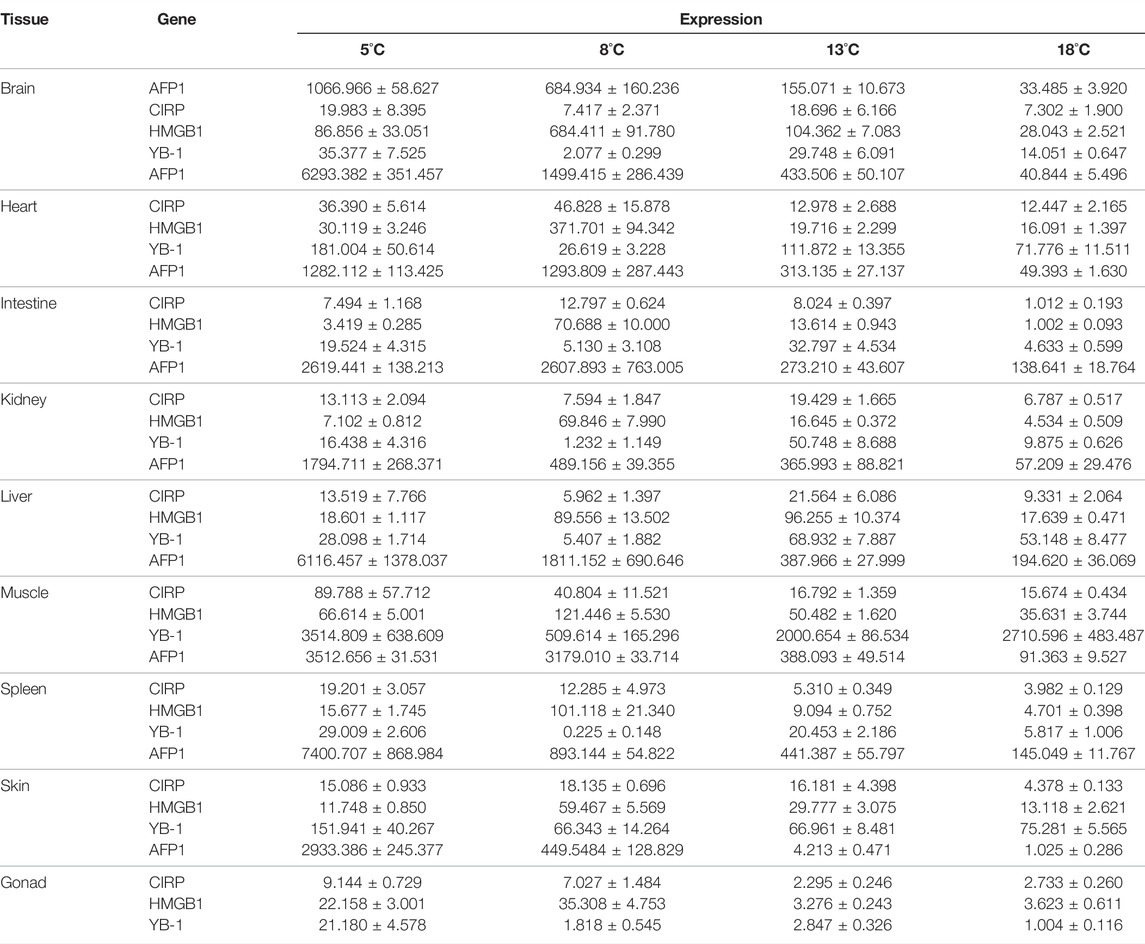
TABLE 2. Expression of AFP1, CIRP, YB-1, and HMGB1 in different tissues from fish cultured at different temperatures (means ± standard deviations).
3.1 Split-Split-Plot Analysis of Variance
The results of the split-split-plot analysis of variance were listed in Table 3. Table 3 showed that the p values of factors temperature, tissue, gene, temperature × tissue, temperature × gene, tissue × gene, and temperature × tissue ×gene were 0.0143, 0, 1E-07, 0, 1E-07, 1.887E-06 and 0.0152,694, respectively, indicating that the expression of the four cold resistant genes was significantly (p < 0.05) affected by temperature and temperature × tissue ×gene interaction, and was highly significantly (p < 0.01) affected by tissue, gene, temperature × tissue, temperature × gene and tissue × gene interaction (Table 3).

TABLE 3. Split-split-plot analysis of variance for T. rubripes cold resistant experiment with four cold resistant genes, four temperature gradients and nine tissues.
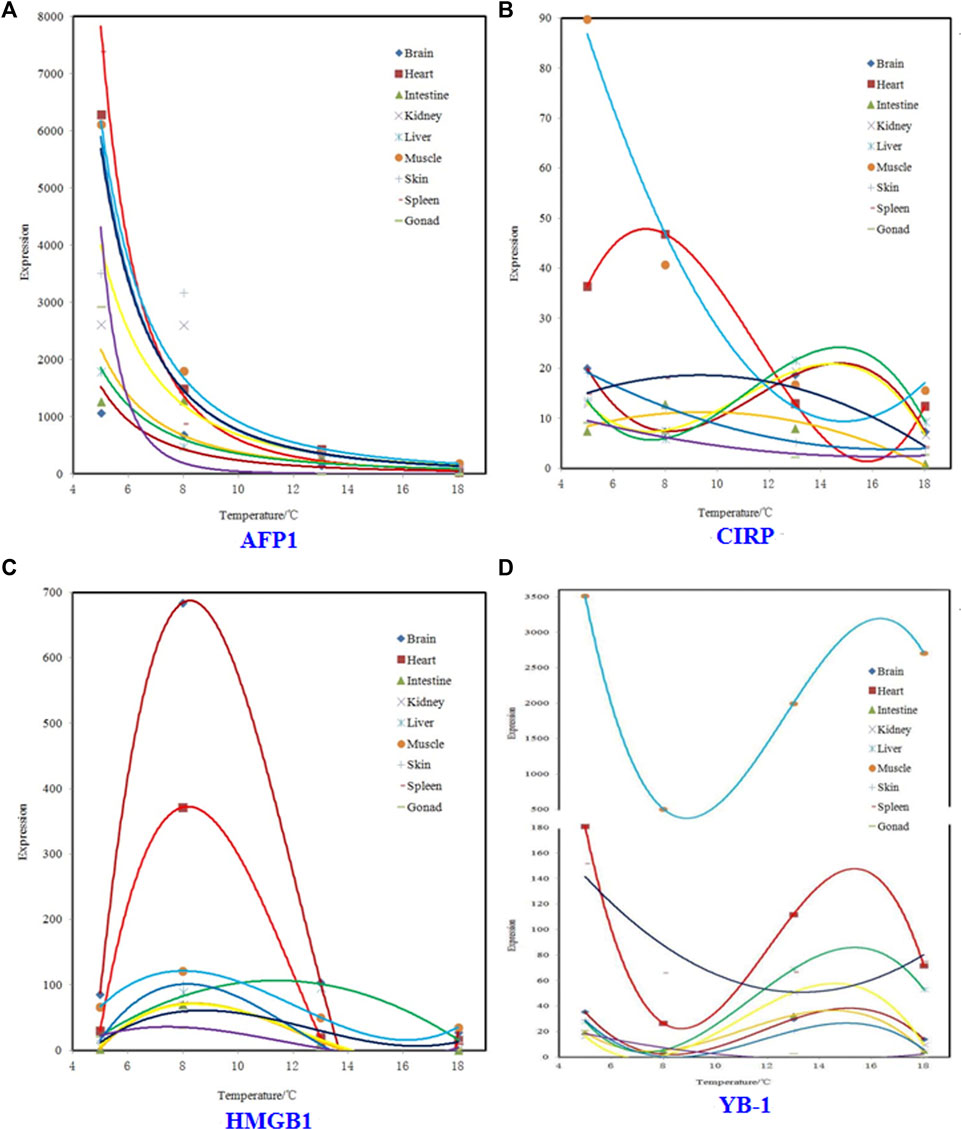
Regression models for relation between expression and temperature for four genes were showed in Figure 1. In Figure 1, panel A, all regression models are power functions. In Figure 1, panel B, regression models for brain, intestine, kidney, and liver are three-degree polynomial, and that for muscle, skin, spleen, and gonad are second-degree polynomial. In Figure 1, panel C, except that liver is second-degree polynomial, other tissues are three-degree polynomial. In Figure 1, panel D, except that spleen and gonad are second-degree polynomial, other tissues are three-degree polynomial.
3.2 AMMI Analysis
The results of AMMI analysis showed that the expression of the four genes was significantly affected by genotype, tissue, and genotype × tissue interactions at different temperatures (Table 4).
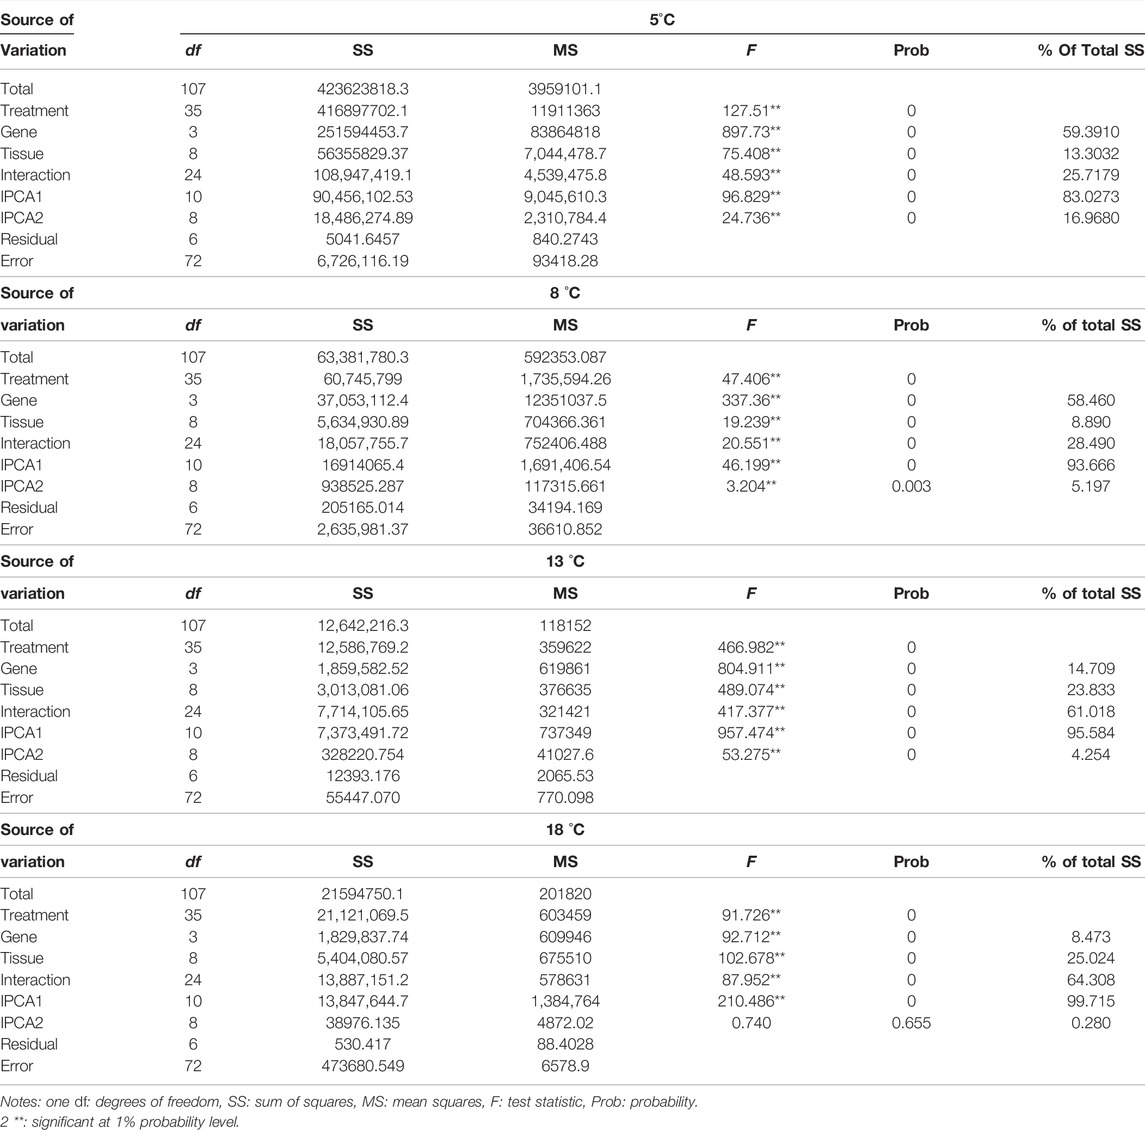
TABLE 4. Results of AMMI analysis of expression of the four genes in different tissues from fish cultured at different temperatures.
At 5°C, the AMMI analysis of variance indicated that 59.3910%, 13.3032%, and 25.7179% of the total sum of squares (SS) were attributable to genotype, tissue effects, and genotype × tissue interactions, respectively. IPCA1 and IPCA2 were obtained, which contributed to 83.0273 and 16.9680% of the genotype × tissue interactions, respectively.
At 8°C, the AMMI analysis of variance indicated that 58.460%, 8.890%, and 28.490% of the total SS were attributable to genotype, tissue effects, and genotype × tissue interactions, respectively. IPCA1 and IPCA2 contributed 93.666 and 5.197% of the genotype × tissue interactions, respectively.
At 13 °C, the AMMI analysis of variance indicated that 14.709%, 23.833%, and 61.018% of the total SS were attributable to genotype, tissue effects, and genotype × tissue interactions, respectively. IPCA1 and IPCA2 contributed 95.584 and 4.254% of the genotype × tissue interactions, respectively.
At 18 °C, the AMMI analysis of variance indicated that 8.473%, 25.024%, and 64.308% of the total SS were attributable to genotype, tissue effects, and genotype × tissue interactions, respectively. IPCA1 and IPCA2 contributed 99.715 and 0.280% of the genotype × tissue interactions, respectively.
3.3 GGE Biplot Analysis
GGE biplot analysis was carried out based on the mean expression of the four genes in the nine tissues at different culture temperatures. The “relationship among different tissues,” “which-won-where,” and “high expression and expression stability” view of the GGE biplots and the “concentric circles” view of the GGE biplots were drawn based on the conclusions of the GGE biplot analysis.
The GGE biplots of the “relationship among different tissues” (Figures 2–5, panel A) mainly focuses on the similarity of genes expression among tissues. The cosine of the angle between two line segments is the correlation coefficient of the gene expression in two tissues. An angle <90° indicates a positive correlation and that the expression of genes in the two tissues is similar, whereas an angle >90° indicates a negative correlation and that the expression of genes in the two tissues is in the opposite ranking. A 90° angle indicates that the gene expression in two tissues is not related. The length of the line segment indicates the ability of the tissue to distinguish gene expression: the longer the line segment, the stronger the ability to distinguish gene expression (Tang, 2007).
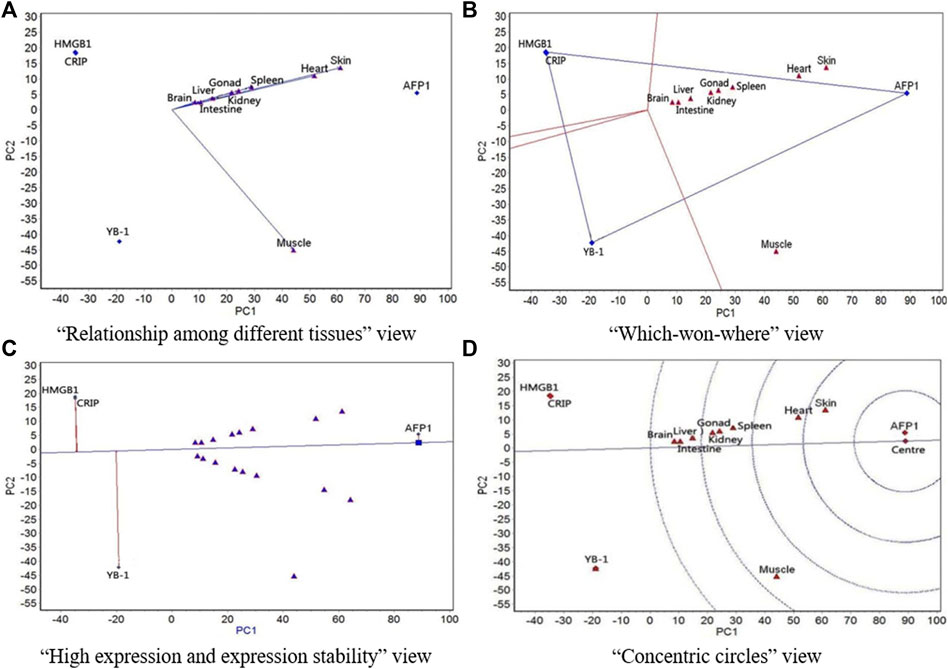
FIGURE 2. The GGE biplot for expression of four resistance genes to low temperature (AFP1, CIRP, YB-1, and HMGB1) in different tissues at 5°C. (A) “Relationship among different tissues” view. (B) “Which-won-where” view. (C) “High expression and expression stability” view. (D) “Concentric circles” view.
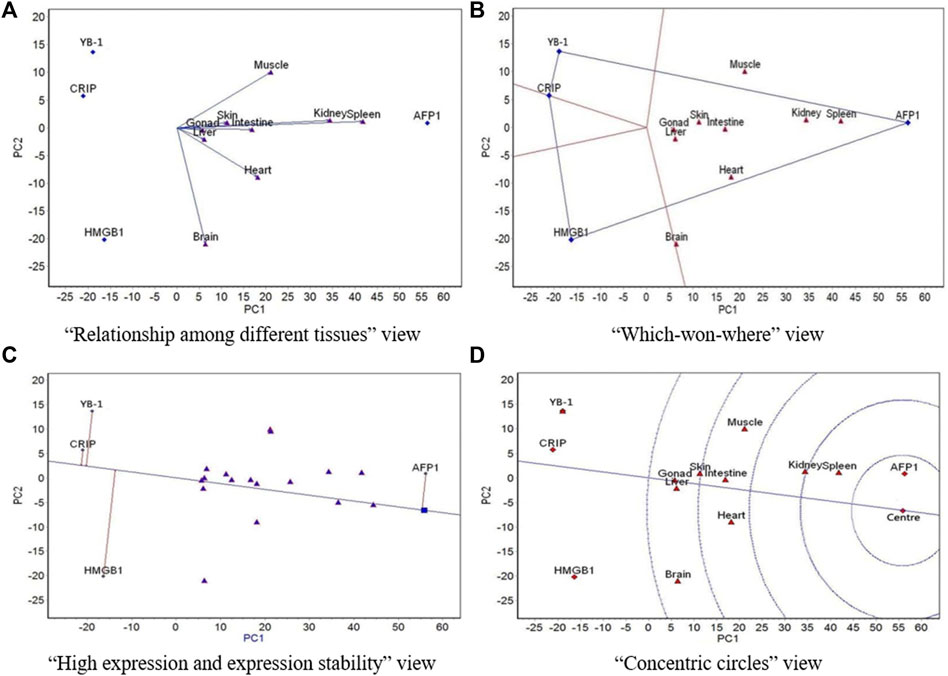
FIGURE 3. The GGE biplot for expression of four resistance genes to low temperature (AFP1, CIRP, YB-1, and HMGB1) in different tissues at 8°C. (A) “Relationship among different tissues” view. (B) “Which-won-where” view. (C) “High expression and expression stability” view. (D) “Concentric circles” view.
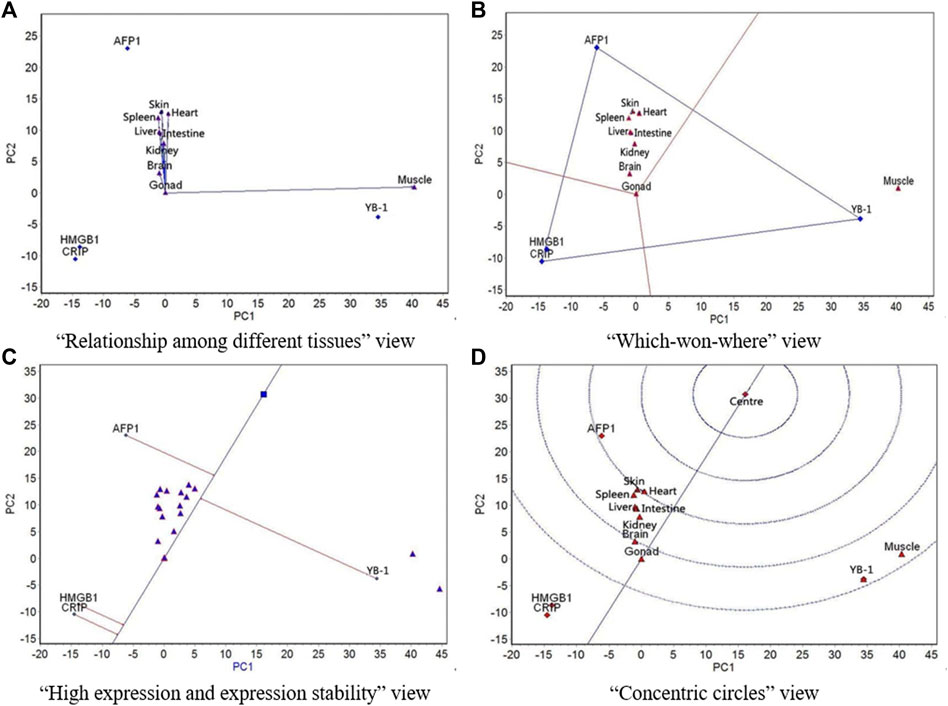
FIGURE 4. The GGE biplot for expression of four resistance genes to low temperature (AFP1, CIRP, YB-1, and HMGB1) in different tissues at 13°C. (A) “Relationship among different tissues” view. (B) “Which-won-where” view. (C) “High expression and expression stability” view. (D) “Concentric circles” view.
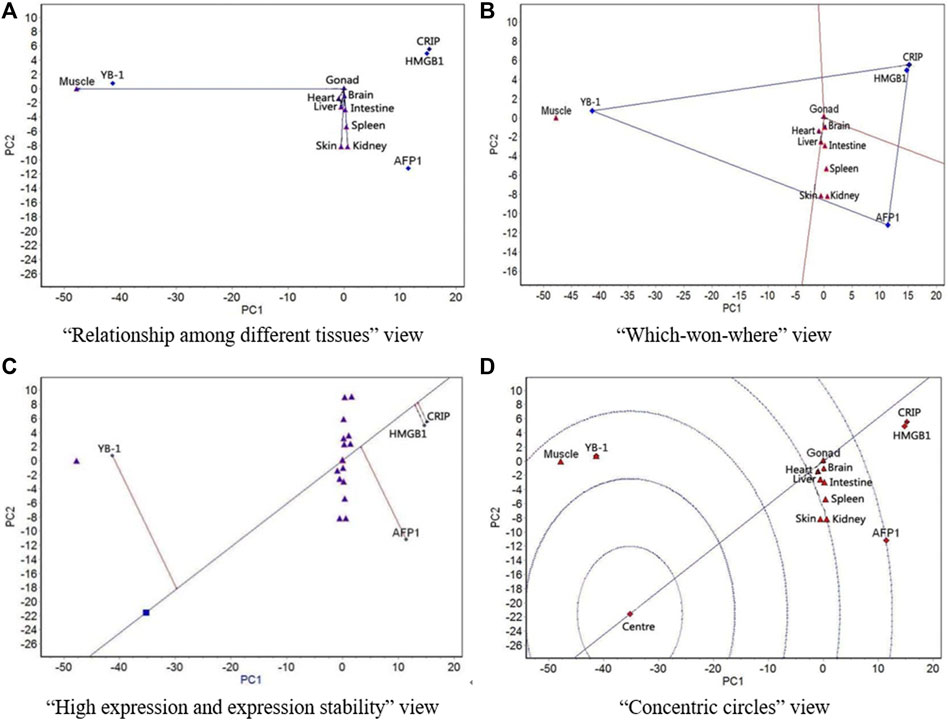
FIGURE 5. The GGE biplot for expression of four resistance genes to low temperature (AFP1, CIRP, YB-1, and HMGB1) in different tissues at 18°C. (A) “Relationship among different tissues” view. (B) “Which-won-where” view. (C) “High expression and expression stability” view. (D) “Concentric circles” view.
The “which-won-where” view of GGE biplots (Figures 2–5, panel B) divides the experimental regions according to the interaction between gene and tissue, and it reveals genes with the highest expression level in each region. The gene located at the top corner of the polygon in each region is the gene with the highest expression in this region (Tang, 2007).
The “high expression and expression stability” view of the GGE biplots (Figures 2–5, panel C) identifies genes with high and stable expression. The direction of the transverse oblique line to “ideal gene” is the approximate average expression of genes in all tissues: the closer to the ideal variety, the higher the average gene expression. The straight line perpendicular to the transverse slash represents the tendency of the gene × tissue interaction: the greater the deviation of the vertical line from the transverse oblique line, the more unstable the gene expression (Tang, 2007).
Finally, the GGE biplots with concentric circles (Figures 2–5, panel D) comprehensively evaluate the high expression and expression stability based on the distance of various genes to the central point of the genes: the smaller the distance, the higher and more stable the expression of the gene (Tang, 2007).
At 5°C, the relationship among different tissues (Figure 2A) showed that the angles between all tissues except for muscle were very small (the correlations among the eight tissues were highly positive), which indicates that expression rankings of all four genes was basically the same in the eight tissues. Muscle had the longest line segment length, which indicates that it had the strongest ability to distinguish expression of the four genes, followed by skin. The “which-won-where” view (Figure 2B) showed that all nine tissues belonged to a region, where AFP1 had the highest expression. The “high expression and expression stability” view of the GGE biplot (Figure 2C) showed that the expression of AFP1 was highest, followed by YB-1, CIRP, and HMGB1. AFP1 had the most stable expression, followed by CIRP, HMGB1, and YB-1. The concentric circles biplot (Figure 2D) showed that AFP1 had the best expression and stability, followed by YB-1, CIRP, and HMGB1.
At 8 °C, the angles between all tissues except for heart, brain, and muscle were very small (the correlations among the six tissues were highly positive), which indicates that expression rankings of all four genes was basically the same in the six tissues (Figure 3A). There was a low positive correlation of heart and muscle with these six tissues, and there was a negative correlation between brain and muscle. The spleen had the strongest ability to distinguish expression of the four genes, followed by the kidney. The nine tissues belonged to a region, and AFP1 had the highest expression in this region (Figure 3B). The expression of AFP1 was highest, followed by HMGB1, YB-1, and CIRP, and the most stable expression was CIRP, followed by AFP1, YB-1, and HMGB1 (Figure 3C). AFP1 had the best expression and stability, followed by HMGB1, CIRP, and YB-1 (Figure 3D).
At 13°C, with the exception of muscle, the other eight tissues showed similar expression of the four genes (Figure 4A). Muscle had the strongest ability to distinguish expression rankings of the four genes, followed by skin. The nine tissues were divided into two regions, with muscle in one region and the other eight tissues in the other region; YB-1 had the highest expression in the muscle region, whereas AFP1 had the highest expression in the other region (Figure 4B). The expression of AFP1 was highest, followed by YB-1, HMGB1, and CIRP, and the most stable expression was CIRP, followed by HMGB1, AFP1, and YB-1 (Figure 4C). AFP1 had the best expression and stability, followed by YB-1, HMGB1, and CIRP (Figure 4D).
At 18 °C, all tissues except for muscle showed similar expression of the four genes (Figure 5A). Muscle had the strongest ability to distinguish expression rankings of the four genes, followed by skin. The nine tissues were divided into two regions, with gonad, muscle, and heart in one region and the other six tissues in the other region; YB-1 had the highest expression in the gonad-muscle-heart region, and AFP1 had the highest expression in the other region (Figure 5B). The expression of YB-1 was the highest, followed by AFP1, HMGB1, and CIRP, and the most stable expression was CIRP, followed by HMGB1, AFP1, and YB-1 (Figure 5C). YB-1 had the best expression and stability, followed by AFP1, HMGB1, and CIRP (Figure 5D).
4 Discussion
4.1 Split-Split-Plot Analysis of Variance
The results of split-split-plot analysis of variance showed that water temperature has a significant (p < 0.05) effect on the expression of T. rubripes cold resistant genes, while tissue × gene interaction has a highly significant (p < 0.01) effect on it, which indicates that it is of great significance to carry out dissection of genotype × tissue interactions for T. rubripes cold resistant genes under different low-temperature conditions for determining temperature range of low temperature tolerance experiments, selecting tissues for gene expression analysis, and screening for antifreeze genes with high expression and high stability in cold-resistant strains of T. rubripes.
On the whole, the expression of AFP1, in the nine tissues, were power functions with temperature, that of CIRP were two- and three-degree polynomial with temperature, and that of HMGB1 and YB-1 were three-degree polynomial with temperature, which showed that different cold tolerant genes showed unique expression patterns under the same temperature gradient. Among them, the expression mechanism of AFP1 is quite different from that of the other three genes, while the expression mechanisms of HMGB1 and YB-1 are relatively consistent.
4.2 AMMI Analysis
The results of AMMI analysis showed that the expression of the four genes was significantly affected by genotype, tissue, and genotype × tissue interactions at different culture temperatures. However, at different temperatures, the contributions of gene, tissue, and interactions to the total variation in gene expression differed, but followed certain patterns. As temperature decreased, the gene effect increased gradually and the genotype × tissue interaction decreased gradually. This may be because it is easier to express cold tolerance genes at lower the temperature. In addition, the gene effect at 18 and 13 °C was significantly lower than that at 8 and 5°C, whereas the interaction at 18 and 13 °C was significantly higher than that at 8 and 5°C. The higher two temperatures may be in the range at which antifreeze gene expression is inactive, while it might be active at 8 and 5 °C. At 18, 13, and 8 °C, the tissue effect decreased gradually with decreasing temperature, but it increased at 5 °C. However, the tissue effect at 18 and 13 °C was significantly higher than that at 8 and 5 °C. We speculate that 8 °C may be in the temperature range in which inactive expression becomes active, and therefore this temperature affects the distribution of the three effects. It also may also be the key regulation point for T. rubripes to deal with low temperature stress. Temperature that is too low will cause regulation disorder, thus 8 °C may be a relevant basis for studying the regulation mechanism of the low temperature response of T. rubripes.
4.3 GGE Biplot Analysis
The GGE biplot analysis of the “relationship among different tissues” (Figures 2–5, panel A) showed that at 5, 13, and 18 °C, the expression of AFP1, CIRP, YB-1, and HMGB1 was highly positively correlated in all tissues except muscle, which indicates that the expression of the four genes in the liver, spleen, kidney, brain, heart, intestine, gonad, and skin was basically the same at these three temperatures. At 8 °C, the expression of the four genes in the brain, heart, and muscle was lower than that in the liver, spleen, kidney, intestine, gonad, and skin. At all four temperatures, the ability of the nine tissues to distinguish the expression of the four genes showed a law similar to the above changes. At 5, 13, and 18 °C, muscle had the strongest ability to distinguish expression of the four genes, followed by skin, which likely is related to the important roles of skin and muscle in coping with temperature changes, as these organs are in close contact with the external environment. At 8 °C, the spleen had the strongest ability to distinguish expression of the four genes, followed by the kidney. One possible explanation for the observed difference at this temperature is that 8 °C may be in the transition zone at which inactive gene expression becomes active.
The “which-won-where” view of the GGE biplot (Figures 2–5, panel B) showed that at 5 and 8 °C, all nine tissues belonged to the same region, in which AFP1 had the highest expression. At 13 °C, the nine tissues were divided into two regions, with muscle in one region and the other eight tissues in the other one; YB-1 had the highest expression in the muscle region, and AFP1 had the highest expression in the other region. At 18 °C, the nine tissues were divided into two regions, with the gonad, muscle, and heart in one region and the other six tissues in the other region; YB-1 had the highest expression in the gonad-muscle-heart region, and AFP1 had the highest expression in the other region. In the gonad-muscle-heart region, the gonad and heart were located very close to the other region and far away from the muscle, which shows that the regions at 18 and 13 °C were basically the same. Thus, on the whole, the region for 5 and 8 °C was similar and that for 13 and 18 °C was similar. This may be related to the different levels of antifreeze gene expression activity at 18 °C/13 and 8 °C/5 °C. Further analysis showed that at 5, 13, and 18 °C, muscle was far removed from the other eight tissues, while the other eight tissues were situated close to each other. At 8 °C, however, the pattern did not follow this structure, which shows that the regional division of other three temperatures was relatively consistent. Again, 8 °C is likely within the transition temperature range in which gene expression change from inactive to active.
In the “high expression and expression stability” view of the GGE biplot, the expression rankings of the four genes were similar at 5, 13, and 18 °C, but slightly different from those at 8 °C. Consistent with the other biplot views, this is likely because 8 °C is located in the transition temperature range in which gene expression changes from inactive to active. At 13 and 18 °C, the expression stability of the four genes was the same, and their stability at 5 and 8 °C was even more similar than at 13 and 18 °C. This is likely due to the different levels of antifreeze gene expression activity at 18 °C/13 vs 8 °C/5 °C. The expression of AFP1 was second highest at 18 °C and highest at the other three temperatures, and AFP1 expression became more and more stable as temperature decreased. The expression of CIRP ranked third at 5 °C and fourth at the other three temperatures, whereas the expression stability ranked second at 5 °C and first at the other three temperatures.
The “concentric circles” view of the GGE biplot illustrates the comprehensive evaluation of the expression amount and stability of the four genes at different temperatures. Both expression amount and stability were more similar at 5, 13, and 18 °C. AFP1 showed the best expression and stability among the four genes, as it ranked second at 18 °C and first at the other three temperatures.
5 Conclusion
The results of split-split-plot analysis of variance showed that water temperature has a significant effect on the expression of T. rubripes cold resistant genes, while tissue × gene interaction has a highly significant effect on it. On the whole, the expression of AFP1, in the nine tissues, were power functions with temperature, that of CIRP were two- and three-degree polynomial with temperature, and that of HMGB1 and YB-1 were three-degree polynomial with temperature.
The results of AMMI analysis showed that expression of AFP1, CIRP, YB-1, and HMGB1 was significantly affected by genotype, tissue, and genotype × tissue interactions at different temperatures and that the contributions of these effects followed certain trends. The patterns suggest that: 1) as temperature decreased, the gene effect increased gradually and the genotype × tissue interaction decreased gradually; 2) 18 and 13 °C are in the temperature range in which antifreeze gene expression is inactive, whereas expression is active at 8 and 5 °C; and 3) 8 °C may be in the transition temperature range in which gene expression changes from inactive to active.
The results of the GGE biplot analysis showed that at all temperatures except 8 °C, the expression of AFP1, CIRP, YB-1, and HMGB1 was highly positively correlated in all tissues except muscle, thus the expression rankings in those eight tissues were basically the same at the three temperatures. At 5, 13, and 18 °C, muscle had the strongest ability to distinguish expression of the four genes, followed by skin, which likely is because these two organs are in close contact with the changing external environment. At 5 and 8 °C, the nine tissues were clustered into one region and at 13 and 18 °C they were divided into two regions, possibly due to different levels of antifreeze gene expression activity at 18 °C/13 vs 8 °C/5 °C. At 5, 13, and 18 °C, the expression rankings of the four genes were similar, and the expression stability of the genes was the same at 18 °C/13 °C and at 8 °C/5 °C, possibly due to different levels of antifreeze gene expression at higher vs lower temperatures. Among the four genes, AFP1 showed the best expression and stability.
These findings can be used to develop cold-resistant strains of T. rubripes. When carrying out low temperature tolerance breeding, it is crucial to identify the temperature range for low temperature tolerance experiments. We identified 8 °C/5 °C as the suitable temperature for such experiments for T. rubripes. Due to the interaction between genes and the tissues in which they are expressed, the expression of the same gene differs among tissues. Therefore, in molecular breeding, selecting the best tissue for studying the expression of a specific gene is important. We found that muscle and skin were the preferred tissues for studying antifreeze gene expression in T. rubripes. Screening for antifreeze genes with high expression and high stability is the key to the success of low temperature tolerance breeding. Among the four antifreeze genes evaluated in this study, AFP1 had the best expression and stability.
Data Availability Statement
The original contributions presented in the study are included in the Supplementary Material, further inquiries can be directed to the corresponding author.
Author Contributions
Conceptualisation, funding acquisition, XW and AM; data curation, formal analysis, investigation, XW and ZL; methodology, writing—original draft preparation, XW; project administration, supervision, AM; resources, AM and ZL; writing—review and editing, all authors. All authors have read and agreed to the published version of the manuscript.
Funding
This work was supported by the National Key R and D Program of China (2018YFD0900102), the Earmarked Fund for the Modern AgroIndustry Technology Research System (Grant CARS-47-G01), the Agricultural Fine Breed Project of Shandong (2019LZGC013), the AoShan Talents Cultivation Program (2017ASTCPOS04), and the Central Public-interest Scientific Institution Basal Research Fund (grant number 2020TD25).
Conflict of Interest
The authors declare that the research was conducted in the absence of any commercial or financial relationships that could be construed as a potential conflict of interest.
Publisher’s Note
All claims expressed in this article are solely those of the authors and do not necessarily represent those of their affiliated organizations, or those of the publisher, the editors and the reviewers. Any product that may be evaluated in this article, or claim that may be made by its manufacturer, is not guaranteed or endorsed by the publisher.
Supplementary Material
The Supplementary Material for this article can be found online at: https://www.frontiersin.org/articles/10.3389/fmolb.2022.897935/full#supplementary-material
References
Abdel-Tawwab, M., and Wafeek, M. (2014). Influence of Water Temperature and Waterborne Cadmium Toxicity on Growth Performance and Metallothionein-Cadmium Distribution in Different Organs of Nile tilapia, Oreochromis niloticus (L.). J. Therm. Biol. 45, 157–162. doi:10.1016/j.jtherbio.2014.09.002
Ahmadi, F., Abadi, A.-R., Bazi, Z., and Movafagh, A. (2020). Novel Study of Model-Based Clustering Time Series Gene Expression in Different Tissues: Applications to Aging Process. Curr. Aging Sci. 13, 178–187. doi:10.2174/1874609812666191015140449
Al-Fageeh, M. B., and Smales, C. M. (2006). Control and Regulation of the Cellular Responses to Cold Shock: the Responses in Yeast and Mammalian Systems. Biochem. J. 397 (2), 247–259. doi:10.1042/BJ20060166
Cai, J., Xia, H., Huang, Y., Lu, Y., Wu, Z., and Jian, J. (2014). Molecular Cloning and Characterization of High Mobility Group Box1 (Ls-HMGB1) from Humphead Snapper, Lutjanus Sanguineus. Fish Shellfish Immunol. 40 (2), 539–544. doi:10.1016/j.fsi.2014.08.004
Cai, L. Y., Nian, L. Y., Cao, A. L., Wang, Y. B., Guan, R. F., Zhao, Y. H., et al. (2018). Research Progress in the Structure-Function Relationship of Aquatic Antifreeze Proteins and its Application in Food Processing and Storage. Sci. Technol. Food Industry 39 (22), 346–352. doi:10.13386/j.issn1002-0306.2018.22.060
Cai, X., Gao, C., Su, B., Tan, F., Yang, N., and Wang, G. (2018). Expression Profiling and Microbial Ligand Binding Analysis of High-Mobility Group Box-1 (HMGB1) in Turbot (Scophthalmus maximus L.). Fish Shellfish Immunol. 78, 100–108. doi:10.1016/j.fsi.2018.04.025
Chen, Y., Yang, S. L., Deng, W. D., and Mao, H. M. (2011). Differential Gene Expression in Different Tissues of Black-Bone Sheep and Normal Sheep. Asian J. Animal Veterinary Adv. 6 (4), 379–384. doi:10.3923/ajava.2011.379.384
Cui, J., Li, J. L., Wang, Z. Y., Dai, C. H., Liu, J. L., and Liu, T. J. (2019). Cloning of Gene of Carrot Antifreeze Protein and its Transformation to Sugar Beet. China Beet Sugar 3, 1–4. doi:10.3969/j.issn.1002-0551.2019.03.001
Duman, J. G., and Olsen, T. M. (1993). Thermal Hysteresis Protein Activity in Bacteria, Fungi, and Phylogenetically Diverse Plants. Cryobiology 30 (3), 322–328. doi:10.1006/cryo.1993.1031
Eliseeva, I. A., Kim, E. R., Guryanov, S. G., Ovchinnikov, L. P., and Lyabin, D. N. (2011). Y-box-binding Protein 1 (YB-1) and its Functions. Biochem. Mosc. 76 (13), 1402–1433. doi:10.1134/S0006297911130049
Gollob, H. F. (1968). A Statistical Model Which Combines Features of Factor Analytic and Analysis of Variance Techniques. Psychometrika 33, 73–115. doi:10.1007/BF02289676
He, J., Xie, T.-L., Li, X., Yu, Y., Zhan, Z.-P., Weng, S.-P., et al. (2019). Molecular Cloning of Y-Box Binding Protein-1 from Mandarin Fish and its Roles in Stress-Response and Antiviral Immunity. Fish Shellfish Immunol. 93, 406–415. doi:10.1016/j.fsi.2019.07.069
Hew, C., Poon, R., Xiong, F., Gauthier, S., Shears, M., King, M., et al. (1999). Liver-specific and Seasonal Expression of Transgenic Atlantic Salmon Harboring the Winter Flounder Antifreeze Protein Gene. Transgenic Res. 8, 405–414. doi:10.1023/a:1008900812864
Hu, J. W., You, F., Wang, Q., Wang, L. J., Weng, S. D., and Xin, M. J. (2015). Cloning and Expression Analysis of Cold-Tolerance Related Genes, CIRP and HMGB1, in Paralichthys olivaceus. Mar. Sci. 39 (1), 29–38. doi:10.11759/hykx20140304001
Islam, M. A., Uddin, M. H., Uddin, M. J., and Shahjahan, M. (2019). Temperature Changes Influenced the Growth Performance and Physiological Functions of Thai Pangas Pangasianodon Hypophthalmus. Aquac. Rep. 13, 100179. doi:10.1016/j.aqrep.2019.100179
Islam, M. J., Slater, M. J., Bögner, M., Zeytin, S., and Kunzmann, A. (2020). Extreme Ambient Temperature Effects in European Seabass, Dicentrarchus labrax: Growth Performance and Hemato-Biochemical Parameters. Aquaculture 522, 735093. doi:10.1016/j.aquaculture.2020.735093
Karges, W. J., Gaedigk, R., and Dosch, H. M. (1994). Quantitative Analysis of Gene Expression in Different Tissues by Template-Calibrated RT-PCR and Laser-Induced Fluorescence. Genome Res. 4, 154–159. doi:10.1101/gr.4.3.154
Kloks, C. P. A. M., Spronk, C. A. E. M., Lasonder, E., Hoffmann, A., Vuister, G. W., Grzesiek, S., et al. (2002). The Solution Structure and DNA-Binding Properties of the Cold-Shock Domain of the Human Y-Box Protein YB-1. J. Mol. Biol. 316 (2), 317–326. doi:10.1006/jmbi.2001.5334
Lange, S. S., and Vasquez, K. M. (2009). HMGB1: The Jack-Of-All-Trades Protein Is a Master DNA Repair Mechanic. Mol. Carcinog. 48 (7), 571–580. doi:10.1002/mc.20544
Li, G., Wang, L., Wang, Y., Li, H., Liu, Z., Wang, H., et al. (2018). Developmental Characterization and Environmental Stress Responses of Y-Box Binding Protein 1 Gene (AccYB-1) from Apis cerana Cerana. Gene 674, 37–48. doi:10.1016/j.gene.2018.06.071
Li, J., Mao, S. M., Zhou, D., Feng, W. W., Li, P., Chen, D. F., et al. (2020). The Study on mRNA Expression of MC4R and SIMI Genes in Different Tissues for Congjiang Pigs. Swine Prod. 3, 65–68. doi:10.3969/j.issn.1002-1957.2020.03.030
Li, Y., Ding, L., Li, Y., Hou, N., Chang, Y. M., Liang, L. Q., et al. (2008). Influence on the Expression Quantity of Five Genes in the Different Tissues of Common Carps Cyprinus carpio under the Low Temperature. Acta Zool. Sin. 54 (3), 460–466. doi:10.3969/j.issn.1007-1954.2010.04.003
Ling, A., Li, X., Hu, X., Ma, Z., Wu, K., Zhang, H., et al. (2018). Dynamic Changes in Polyphenol Compounds, Antioxidant Activity, and PAL Gene Expression in Different Tissues of Buckwheat during Germination. J. Sci. Food Agric. 98 (15), 5723–5730. doi:10.1002/jsfa.9119
Miao, L., Li, M. Y., Chen, Y. Y., Mou, H. U., and Chen, J. (2017). Cloning of Cold Inducible RNA-Binding Protein(CIRP) Gene in Larimichthys Crocea and its Expression Analysis under Cold Treatments. J. Fish. China 41 (4), 481–489. doi:10.11964/jfc.20160410364
Nishiyama, H., Itoh, K., Kaneko, Y., Kishishita, M., Yoshida, O., and Fujita, J. (1997). A Glycine-Rich RNA-Binding Protein Mediating Cold-Inducible Suppression of Mammalian Cell Growth. J. Cell Biol. 137 (4), 899–908. doi:10.1083/jcb.137.4.899
Piepho, H. P., and Edmondson, R. N. (2018). A Tutorial on the Statistical Analysis of Factorial Experiments with Qualitative and Quantitative Treatment Factor Levels. J. Agro. Crop. Sci. 204 (5), 429–455. doi:10.1111/jac.12267
Rauen, T., Frye, B. C., Wang, J., Raffetseder, U., Alidousty, C., En-Nia, A., et al. (2016). Cold Shock Protein YB-1 Is Involved in Hypoxia-dependent Gene Transcription. Biochem. Biophysical Res. Commun. 478 (2), 982–987. doi:10.1016/j.bbrc.2016.08.064
Raymond, J. A., and DeVries, A. L. (1977). Adsorption Inhibition as a Mechanism of Freezing Resistance in Polar Fishes. Proc. Natl. Acad. Sci. U.S.A. 74 (6), 2589–2593. doi:10.1073/pnas.74.6.2589
Schwerin, M., Voigt, J., Wegner, J., Kuhn, C., Ender, K., and Hagemeister, H. (1999). Gene Expression in Different Tissues of Lactating Cows of Differing Metabolic Type: 1. Comparison of mRNA Patterns by the Differential Display Method. J. Anim. Physiol. Anim. Nutr. 81, 113–123. doi:10.1046/j.1439-0396.1999.813177.x
Sun, J. H. (2017). Differential Gene Expression Analysis of Low Temperture Transcriptome and Genealogical Identification from Takifugu rubripes. Shanghai, China: Shanghai Ocean University. Master degree theses.
Swamynathan, S. K., Nambiar, A., and Guntaka, R. V. (1998). Role of Single‐stranded DNA Regions and Y‐box Proteins in Transcriptional Regulation of Viral and Cellular Genes. FASEB J. 12 (7), 515–522. doi:10.1096/fasebj.12.7.515
Vornanen, M., Hassinen, M., Koskinen, H., and Krasnov, A. (2005). Steady-state Effects of Temperature Acclimation on the Transcriptome of the Rainbow Trout Heart. Am. J. Physiol. Regul. Integr. Comp. Physiol. 289 (4), R1177–R1184. doi:10.1152/ajpregu.00157.2005
Wang, S. Y., Li, X. K., Zhou, Y. F., and Wu, J. H. (2012). Research Progress in Antifreeze Machanism and Genetic Engineering of Antifreeze Protein. J. Beijing Technol. Bus. Univ. Nat. Sci. Ed. 30 (2), 58–63. doi:10.3969/j.issn.1671-1513.2012.02.012
Wen, B., Jin, S.-R., Chen, Z.-Z., Gao, J.-Z., Wang, L., Liu, Y., et al. (2017). Plasticity of Energy Reserves and Metabolic Performance of Discus Fish (Symphysodon aequifasciatus) Exposed to Low-Temperature Stress. Aquaculture 481, 169–176. doi:10.1016/j.aquaculture.2017.09.002
Xie, J., Hodgkinson, J. W., Li, C., Kovacevic, N., and Belosevic, M. (2014). Identification and Functional Characterization of the Goldfish (Carassius auratus L.) High Mobility Group Box 1 (HMGB1) Chromatin-Binding Protein. Dev. Comp. Immunol. 44 (1), 245–253. doi:10.1016/j.dci.2013.12.015
Xu, D., You, Q., Chi, C., Luo, S., Song, H., Lou, B., et al. (2018). Transcriptional Response to Low Temperature in the Yellow Drum (Nibea Albiflora) and Identification of Genes Related to Cold Stress. Comp. Biochem. Physiology Part D Genomics Proteomics 28, 80–89. doi:10.1016/j.cbd.2018.07.003
Xu, K., Chen, D. H., Wang, Z., Liu, Y. L., Wang, Z., Niu, B., et al. (2019). Sequencing Analysis and Expression Characteristcs of AFP Gene in Bombus Terriestris. J. Shanxi Agric. Univ. Nat. Sci. Ed. 39 (5), 74–81. doi:10.13842/j.cnki.issn1671-8151.201901030
Yan, W. (2001). GGEbiplot-A Windows Application for Graphical Analysis of Multienvironment Trial Data and Other Types of Two‐Way Data. Agron. J. 93 (5), 1111–1118. doi:10.2134/agronj2001.9351111x
Yan, W., and Holland, J. B. (2010). A Heritability-Adjusted GGE Biplot for Test Environment Evaluation. Euphytica 171 (3), 355–369. doi:10.1007/s10681-009-0030-5
Yan, W. K., and Kang, M. S. (2003). GGE Biplot Analysis: A Graphical Tool for Breeders, Geneticists, and Agronomists. Boca Raton, Florida: CRC Press.
Yan, W. K. (1999). Methodology of Cultivar Evaluation Based on Yield Trial Data-With Special Reference to Winter Wheat in Ontario. Guelph: University of Guelph.
Yu, W. B., Zhu, K. H., Guo, H. Y., Zhang, N., Sun, X. X., Wu, N., et al. (2017). Cloning and Expression Analysis of MHC II β Gene in Trachinotus Ovatus. South China Fish. Sci. 13 (4), 69–79. doi:10.3969/j.issn.2095-0780.2017.04.009
Zhang, J. F., Tao, X. F., and Han, B. S. (2020). Function, Evolution, and Application of Antifreeze Proteins in Antarctic Fish. J. Fish. Sci. China 27 (3), 355–361. doi:10.3724/SP.J.1118.2020.19213
Keywords: genotype, tissue, interactions, Takifugu rubripes, resistance genes to low temperature
Citation: Wang X, Liu Z and Ma A (2022) Interpretation of the Genotype by Tissue Interactions of Four Genes (AFP1, CIRP, YB-1, and HMGB1) in Takifugu rubripes Under Different Low-Temperature Conditions. Front. Mol. Biosci. 9:897935. doi: 10.3389/fmolb.2022.897935
Received: 16 March 2022; Accepted: 08 June 2022;
Published: 30 June 2022.
Edited by:
Qian Han, Hainan University, ChinaReviewed by:
Edna Regina Amante, Federal University of Pará, BrazilHans-Peter Piepho, University of Hohenheim, Germany
Copyright © 2022 Wang, Liu and Ma. This is an open-access article distributed under the terms of the Creative Commons Attribution License (CC BY). The use, distribution or reproduction in other forums is permitted, provided the original author(s) and the copyright owner(s) are credited and that the original publication in this journal is cited, in accordance with accepted academic practice. No use, distribution or reproduction is permitted which does not comply with these terms.
*Correspondence: Aijun Ma, bWFhakB5c2ZyaS5hYy5jbg==
†These authors have contributed equally to this work and share first authorship
 Xinan Wang
 Zhifeng Liu
 Aijun Ma