 T. L. Horng
 R. S. Chen
 M. V. Leonardi3
 F. Franciolini
 L. Catacuzzeno
- 1Department of Applied Mathematics, Feng Chia University, Taichung, Taiwan
- 2Department of Life Science, Tunghai University, Taichung, Taiwan
- 3Department of Chemistry, Biology and Biotechnology, University of Perugia, Perugia, Italy
K+ channels allow a very efficient passage of K+ ions through the membrane while excluding Na+ ions, and these properties are essential for life. The 3D structure of the KcsA K+ channel, solved more than 20 years ago, allows to address many relevant aspects of K+ permeation and selectivity mechanisms at the molecular level. Recent crystallographic data and molecular dynamics (MD) studies suggest that no water is normally present inside the selectivity filter (SF), which can instead accommodate four adjacent K+ ions. Using a multi-scale approach, whereby information taken from a low-level simulation approach is used to feed a high-level model, we studied the mechanism of K+ permeation through KcsA channels. More specifically, we used MD to find stable ion configurations under physiological conditions. They were characterized by two adjacent K+ ions occupying the more central positions of the SF (sites S2 and S3), while the other two K+ ions could be found at the external and internal entrances to the SF. Sites S1 and S4 were instead not occupied by K+. A continuum Bikerman–Poisson–Boltzmann model that takes into account the volume of the ions and their dehydration when entering the SF fully confirmed the MD results, showing peaks of K+ occupancy at S2, S3, and the external and internal entrances, with S1 and S4 sites being virtually never occupied by K+. Inspired by the newly found ion configuration in the SF at equilibrium, we developed a simple kinetic permeation model which, fed with kinetic rate constants assessed from molecular meta-dynamics, reproduced the main permeation properties of the KcsA channel found experimentally, including sublinear current-voltage and saturating conductance-concentration relationships. This good agreement with the experimental data also implies that the ion configuration in the SF we identified at equilibrium would also be a key configuration during permeation.
Statement of Significance
K+ channels allow a very efficient passage of K+ ions through the membrane while excluding Na+ ions, and these properties are essential for life. We studied these mechanisms of K+ permeation through KcsA channels using a multi-scale approach, whereby information taken from low-level simulations is used to feed a high-level model. More specifically, we developed a simple kinetic permeation model which, fed with kinetic rate constants assessed from molecular meta-dynamics, reproduced the main permeation properties of the KcsA channel found experimentally.
Introduction
K+ channels are membrane proteins that allow a very efficient passage of K+ ions while excluding Na+ ions. They are essential for the establishment of the negative resting potential across the membrane and the repolarization phase of the action potential. The bacterial KcsA channel has been amongst the most studied K+ channels, and the first to have its structure solved by X-ray crystallography (Doyle et al., 1998). Soon after the resolution of the crystal structure, the group of Christopher Miller performed electrophysiology experiments on KcsA channels (Lemasurier et al., 2001) and found properties quite similar to those previously found for many mammalian K+ channels, such as sublinear current-voltage (IV) relationship under symmetrical K+ conditions, outward rectification (i.e., the channel conducts better in the outward direction), and saturating conductance-concentration relationship. Thus, any plausible mechanism of K+ permeation through the KcsA channel should explain and reproduce these features observed experimentally.
Structurally, the KcsA channel is formed by the juxtaposition of four identical protein subunits, each composed of two transmembrane segments, TM1 and TM2 (Doyle et al., 1998). Starting from the cytoplasmic side (the bundle crossing), the four TM2s of the KcsA channel form the lining of the water-filled internal cavity, which is ∼10 Å wide and extends into the lipid membrane for about two-thirds of its thickness. At the extracellular pore entrance, the four P loops from each subunit form a narrow selectivity filter (SF) that is about 12 Å long and 3 Å wide and allows the passage of only naked ions (without their hydration shell). The SF is formed by a highly conserved sequence of amino acids (TVGYG) that have their carbonyl (hydroxyl in the case of threonine) oxygens pointing toward the center of the pore. Since these oxygens have a partial negative charge, their electrostatic interactions with the permeating K+ ions likely contribute to the permeation process.
Our comprehension of the permeation properties of KcsA moved greatly forward when the high-resolution electron density maps allowed us to clearly identify four high electron density positions inside the selectivity filter (called sites S1 to S4, from extracellular to intracellular). Two other electron-dense positions were found: one immediately outside the extracellular entrance (site S0) and the other below S4, at the center of the intracellular cavity (site Scav) (Morais-Cabral et al., 2001). Unfortunately, at that time, it was not possible to determine whether the observed electron densities inside the selectivity filter originated from K+ ions or from water, as they give a very similar X-ray diffraction pattern. A number of observations and physicochemical considerations initially suggested that the four binding sites (S1–S4) within the SF were alternatingly occupied by two K+ ions—sitting either in S1 and S3 or in S2 and S4—and two water molecules in the remaining sites (Bernèche and Roux, 2001; Zhou and MacKinnon, 2003).
Later experiments, based on anomalous diffraction X-ray crystallography and solid-state nuclear magnetic resonance, pointed instead to a selectivity filter exclusively occupied by K+ ions (Langan et al., 2018; Öster et al., 2019). In accordance, in long MD simulations that allowed to observe thousands of K+ permeation events, K+ ions were frequently found simultaneously occupying the sites S2 and S3, and the passage of water molecules through the SF was virtually never seen (Furini et al., 2009; Köpfer et al., 2014; Wu, 2017).
In either case, permeation would occur with a K+ ion approaching the SF from one side and pushing the single file of K+ ions (and possibly water molecules) forward to the other side (Morais-Cabral et al., 2001). This mechanism is usually referred to as knock-on (“soft” or “hard”, depending on the presence or absence of water), meaning that the incoming K+ ion pushes forward the single file of whatever is in the SF. Interestingly, Kratochvil and colleagues (Kratochvil et al., 2016) made MD simulations with the SF displaying either KWKW (K-water-K-water; the soft knock-on mechanism) or 0KK0 (void-K-K-void; the hard knock-on mechanism) configuration. Their results showed that only an SF in the soft knock-on configuration could predict two-dimensional infrared (2D IR) spectra that matched experimental data from isotope-labeled semi-synthetic KcsA channels and were thus interpreted as evidence against the hard knock-on mechanism. However, a follow-up study using MD simulations found that both mechanisms can generate 2D IR spectra compatible with the experimental data (Kopec et al., 2018). This study in fact indicated that 2D IR spectroscopy cannot effectively distinguish between these two conduction mechanisms in K+ channels.
Unfortunately, none of the mechanisms proposed until now, based on structural considerations and MD results, has been tested for its ability to correctly predict the channel behavior in terms of current-voltage and conductance-concentration relationships. This is because if on one side MD simulations have revealed atomic details of the binding sites and the energetics in the SF, on the other side, they can hardly predict the shape of the IV relationships under different experimental conditions. Even very long simulations can greatly underestimate the channel conductance (i.e., by nearly 40 folds at a voltage of 300 mV as in Jensen et al., 2013). Also, the outcome of other approaches, such as Brownian dynamics (BD) simulation (Bernèche and Roux, 2003) and Poisson–Nernst–Planck (PNP) type models (Furini et al., 2006; Dyrka et al., 2013; Liu and Lu, 2017), employed to compute the IV curves, was rather unsuccessful in predicting the experimental data (Lemasurier et al., 2001). Taking all this together, it appears that more information and new approaches are required to determine the exact mechanism of K+ permeation through the SF, and more key physical properties need to be included in the modeling.
To find more quantitative and predictive mechanisms of permeation, kinetic models could be used in conjunction with MD simulations in a multi-scale approach. Kinetic models picture the channel pore in a few stable configurations, and the permeation process as ions hopping from one stable configuration to the next, with an associated probability given by the rate constant characterizing that transition (Hille, 2001). Although kinetic models can only give an approximate picture of the permeation process, they are able to connect the model output to experimental results through the flux equations that can easily be obtained from the model. This will allow to evaluate the soundness of a postulated permeation process derived from structural data and MD results. One such model has been recently found using long MD simulations, where K+ permeation through the KcsA channel can be described by a quite simple sequence of Markov states (Domene et al., 2021). In this type of model, which we may define as an association/dissociation model (A/D model, (Nelson, 2011)), the current is produced by the binding of a K+ ion to the SF on one side of the membrane and the unbinding of another K+ ion on the other side. In this case, the exit (unbinding) of the K+ ion is not to be seen as directly linked to (in fact, it is temporally separated from) the entry of a K+ ion on the other side. Notably, in contrast to the classical knock-on mechanism (Hodgkin and Keynes, 1955), these types of models do predict sublinear IV relationships and saturating current-concentration curves (Nelson, 2011), in line with experimental data.
Based on these considerations, in this study, we tested whether an A/D type permeation model could reproduce the experimentally observed permeation properties from KcsA channels. The approach used in this study was: 1) to exploit MD simulations and structure-based Poisson-Boltzmann (PB) modeling (modified to include steric and dehydration effects) for sketching the A/D reaction scheme of K+ permeation in the KcsA channel and defining its rate constants; 2) to test the consonance of the kinetic model output with experimental results.
Methods
Molecular Dynamics
We used the structure of the open conformation of a KcsA channel carrying the E71A mutation that prevents inactivation (PDB code 5VK6, (Cuello et al., 2017)). Previous MD results have shown that both the SF and the intracellular gate of this channel remain in an open-conductive configuration following time extensive simulations (Li et al., 2018). The channel protein was embedded in a membrane with 200 POPC lipid molecules, having a dimension of 100 × 100 Å. The system was solvated in two steps, and the distance between the maximum and minimum z coordinates and the water box edges in the z-axis was set to 12 Å. First, the system was solvated below the membrane plane with a water box of dimensions 102.69, 101.01, and 12.86 (x, y, and z in Å), using 11,508 TIP3 water (Jorgensen et al., 1983) molecules. Then, it was solvated above the membrane plane with a water box of dimensions 102.69, 101.01, and 12.76 (x, y, and z in Å), using 11,508 TIP3 water molecules. After the addition of the water molecules, the system presented a total net charge of 14.0 e0. The system was then neutralized by adding in a total of 100 Cl- ions plus 86 K+ ions, ending up with a salt concentration of 0.4 mol/L.
The MD simulations in the present study were performed employing the NAMD molecular dynamics package (Phillips et al., 2005). The CHARMM36 force field (MacKerell et al., 1998; Best et al., 2012), with no NBFIX modification, was used in all MD simulations. An initial minimization (2,000 steps) was performed with explicit solvent using the TIP3 water model in the NpT ensemble. A distance cut-off of 12.0 Å was applied to short-range, non-bonded interactions, and 10.0 Å for the smothering functions. Long-range electrostatic interactions were treated using the particle-mesh Ewald (PME) method (Darden et al., 1993). Annealing was then performed by raising the temperature from 60 to 300 K, using a simulated temperature ramp of 0.24 ns. The pressure was maintained at 1 atm using the Nosé-Hoover Langevin piston (Martyna et al., 1994; Feller et al., 1995). A distance cut-off of 12.0 Å was applied to short-range, non-bonded interactions, and 10.0 Å for the energy switching function. Long-range electrostatic interactions were treated using the PME method. The equations of motion were integrated using the r-RESPA multiple time step scheme (Phillips et al., 2005) to update the short-range interactions every 1 step and long-range electrostatic interactions every 2 steps. The time step of integration was chosen to be 2 fs for all simulations. In this step consisting of 0.29 ns of simulation, all the backbone protein atoms and the K+ ions in the selectivity filter (in S0 to S4) and immediately outside were restrained. After the annealing, a 1 ns equilibration was performed in which the temperature was maintained at 300 K using Langevin dynamics. Also, during this simulation time, all the backbone protein atoms and the K+ ions in the selectivity filter (in S0 to S4) and immediately outside were restrained (with a force constant of 1 kcal/(mol*Å2)). Finally, a fully unrestrained MD simulation was performed.
Adaptive biasing force. The energy profiles associated with the movement of K+ ions along the selectivity filter were assessed using the adaptive biasing force (ABF) method which allows the calculation of the free energy variation along a coordinate of reaction (Darve et al., 2008; Hénin et al., 2010). ABF is based on the computation of the potential of mean force (PMF) along the reaction coordinate ξ, which is neutralized by the equal and opposite biasing force which enables the system to escape from the free energy minima, which otherwise would not allow to study the whole energy landscape. In fact, the biasing force yields a uniform transition coordinate, with only minimal residual barriers that can be easily crossed only owing to thermal fluctuations. The application of the ABF method preserves the main dynamic characteristics, including the random fluctuating force, while flattening the potential of mean force to erase free-energy barriers and, in this way, promoting the transitions between states. All this is done in an adaptive manner, without the need for prior information on the PMF (Comer et al., 2015). This kind of simulation is performed with no constraint in the coordinate reaction ξ, which implies that during the simulation the complete reaction path is discretized into small increments δξ that are explored in a continuous fashion. We started these simulations from the already equilibrated structure of KcsA mentioned earlier and proceeded with the ABFs. To allow the system to stabilize, a total of 30 ns simulation was performed, at the end of which we verified that the assessed energy profile was stable and did not change with simulation time. Furthermore, to achieve a high-resolution profile, we performed all the ABF using a δξ of 0.05 Å. During this simulation time, the backbone protein atoms of the channel transmembrane helices, sufficiently far from the selectivity filter, were restrained to a specific range of motion.
Free energy perturbation. To assess the binding free energy for the K+ ions in the sites of the SF, which is described as
Continuum Model
Continuum models like Poisson–Boltzmann (PB) and Poisson–Nernst–Planck (PNP) equations can generally describe ion channels at equilibrium and non-equilibrium conditions, and therefore they can predict long-range behavior and stable configurations of the SF (Eisenberg, 1998; Nonner et al., 1999). However, considering ions as points without volume can deter their applicability under particular conditions, including the narrow SF of the KcsA channel where the negative charges carried by carbonyl oxygens are so strong to bring K+ ions to saturation levels inside it. This calls for modifications of the classical PB/PNP model to account for the steric effect of ions. To study the equilibrium situation, we consider, here, the Bikerman–PB model as one such alternative to the classical PB model. Moreover, as ion solvation energy is significant for K+ ions entering the narrow SF, this energy, calculated with the Born model, was included in our modeling.
Geometry. Using the mutant E71A KcsA structure and the water molecule with a radius of 1.4
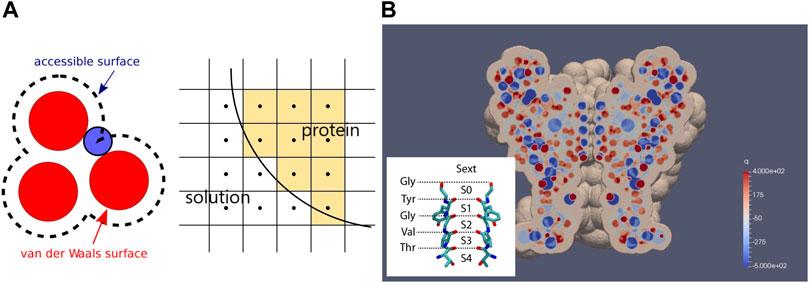
FIGURE 1. Geometry of the continuum model. (A) generation of protein domain by rolling ball mechanism. A mesh with its center inside an accessible surface is classified as a protein mesh. Otherwise, the mesh is classified as a solution mesh. (B) cross-section of KcsA with permanent charge distribution. The structure of the narrowest part of the channel, the SF, surrounded by carbonyl oxygens from the TVGYG motifs, with its binding sites, is shown in the inset. Note that unlike conventional notation, here, blue spots denote negative charges and red spots denote positive charges according to the color bar.
Bikerman–PB model. The Helmholtz free energy for the classical PB model is
with the internal energy U and entropy S described as follows:
where
By doing the variation of F with respect to p and n, we obtain the chemical potentials for cation and anion, respectively.
where solvation energy, based on the Born model, for cation and anion is
with
Herein, we include the steric effect to improve the classical PB model mentioned earlier. The steric effect has long been approached in modeling by modifying either internal energy or entropy in free energy (Bikerman, 1942; Borukhov et al., 1997; Horng et al., 2012). Through the entropy approach, Bikerman (Bikerman, 1942) modified classical Boltzmann distribution by adjusting bulk and local ion concentrations via excluded volume. Borukhov, Andelman, and Orland rigorously derived the same formula by adding solvent entropy through excluded volume into free energy (Borukhov et al., 1997). The Bikerman model has been a popular steric model due to its easiness of application and qualitatively good agreement with experiments. The original Bikerman model has no size distinction among ions, and all ion sizes are designated as
where
At equilibrium, the chemical potential is uniform everywhere and
with
where the subscript b denotes the bulk situation. Note that
where
Readers are referred to Horng (2020) for detailed derivation. Note that with
Eq. (4) together with Eqs. (13) and (14) form the governing equation to solve for
meaning no voltage bias applied across the channel. No-flux boundary conditions are applied to four sides of the computational domain,
where
where
We then solve for Eq. (21), instead of Eq. (4), until the steady state is reached. By the framework of the method of lines (MOL), finite volume method (FVM) is first used for the spatial discretization of Eq. (21). Then, the resultant system of ordinary differential equations (ODEs) after semi-discretization in space is integrated in time by RK4 until the steady state is reached.
As mentioned earlier, the steric effect and solvation energy difference are significant inside SF. Herein, we isolate the SF domain from the electrolyte solution domain by defining
1) Bulk solution concentration:
2) Dielectric constant distribution:
3) Ion diameter:
4) Bulk diffusion coefficients:
5) Grid size:
6) Computational domain:
Note that
Solution of the Kinetic Model
The solution of the kinetic model was obtained by assuming that the system is at steady state, meaning that the rate of formation of each state is equal to the rate of disappearance, giving a zero rate of change. More specifically, considering a kinetic model having N different states, under steady-state conditions, we can write a system of N equations of the type
where kji is the rate constant going from state j to state i, and nj is the fractional occupancy of state j, with j that varies over all the states connected with state i. Using this system of equations and considering the additional constraint that the sum of fractional occupancies is unity,
where
In our specific case, the kinetic scheme shown in Figure 4 gives rise to the following system of equations:
where
or equivalently
As with any cyclic kinetic model, the so-called microscopic reversibility needs to be respected at the equilibrium (zero voltage), that is, the product of the kinetic rate constants in the clockwise direction should equal the product of the rate constants in the counterclockwise direction. In our case, we have three cycles, thus the microscopic reversibility should read:
Multi-scale approach for predicting IV relationships. To predict the IV relationships for the KcsA channel, we considered the association/dissociation model shown in Figure 4, with the rate constants assessed from MD data. More specifically, we used the MD ABF method to assess the energy profiles associated with the various transitions present in the kinetic scheme and to estimate the diffusion rate constants outside and inside the selectivity filter of the channel. In order to take into account the effect of the transmembrane voltage on the voltage dependent rate constants of the model, kb and kf, an electrostatic energy corresponding to a linear voltage drop through the SF was added to the energy profile. Once these parameters are known, the kinetic rate constants can be estimated using Eqs. (28) and (29), to be described, and the currents under various voltages and K+ concentrations using Eqs. (25) and (26).
Results
Molecular Dynamics of K+ Permeation in KcsA Channel
We performed MD simulations starting from the newly determined crystallographic configuration of the selectivity filter of KcsA, with four K+ ions sitting in the four SF binding sites, very close to each other, plus a K+ ion in the cavity and another one in the external vestibule (Figure 2A, left). Since this configuration was obtained from crystallized channels held at a very low temperature, we first verified if it was also present as a relatively stable configuration at more physiological temperatures, which are easily reached by heating the crystal from 60 to 300 K and letting it equilibrate for about 400 ns. We performed this simulation ten times, each time randomly re-initializing the atoms’ velocities, and every time, at the end of the equilibration, we observed a K+ ion configuration invariably characterized by two K+ ions at the two most internal binding sites of the selectivity filter (S2 and S3) (Figure 2A, right). The S1 and S4 positions were instead empty or rarely occupied by water (water occupancy was 25.2 ± 7.3% for S1 and 11.5 ± 1.4% for S4).
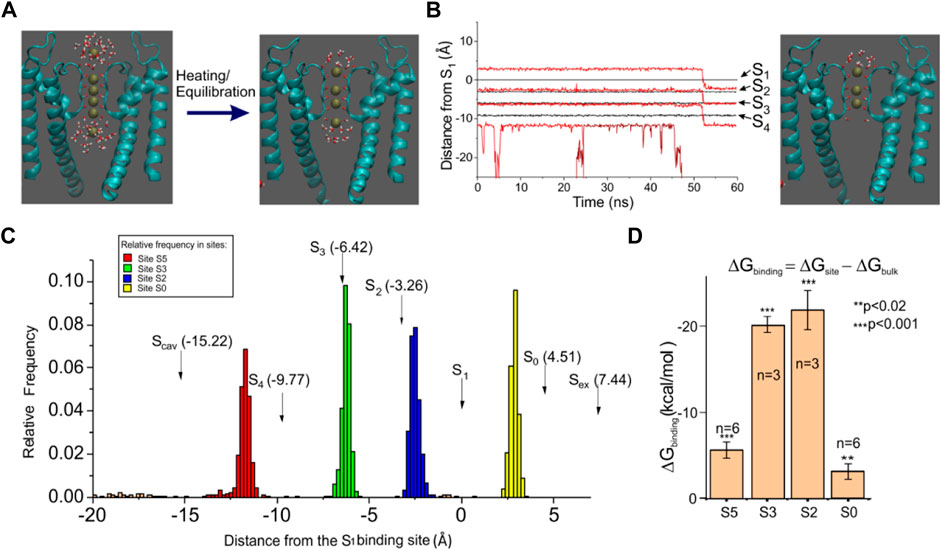
FIGURE 2. Molecular dynamics of the KcsA channel. (A) left: KcsA structure and initial K+ ion configuration used in our MD simulations. K+ ions were placed in sites S1–S4 inside the selectivity filter, at the cavity, and in the site Sex found in X-ray crystallography. Right: typical ion configuration found after heating and equilibration. (B) left: plot of the K+ ion position as a function of time for one typical MD simulation. The black lines represent the position of the four SF crystallographic sites (assessed as the center of mass of the eight carbonyl oxygens) while the red lines represent the position of the K+ ions. Right: SF configuration found at 50 ns, with only three K+ ions bound to the SF. (C) amplitude histogram of the K+ ion position assessed from a 400 ns long MD simulation, showing four preferential positions. The arrows indicate the K+ binding sites found in the high-resolution structure. (D) binding free energy assessed using the free energy perturbation technique for the four K+ binding sites found to be typically occupied in our simulations. The plot reports the difference between the free energy variation obtained following the annihilation of a K+ ion in water (ΔGbulk) and a K+ ion sitting in a binding site (ΔGsite). In the initial configuration, shown on the left of panel A, ions were constrained within +/- 1
Two other K+ ions were, respectively, found at the intracellular and extracellular entry of the selectivity filter. These K+ ions were instead only partially hydrated, as they also interacted with the protein residues. More specifically, the K+ at the external site interacted with the carbonyl oxygens of tyrosine 78, located at the extracellular entry of the selectivity filter, while the K+ at the intracellular entrance interacted with the hydroxyl oxygens of threonine 75. As can be seen from the frequency plot of Figure 2C, neither of the two sites exactly matches the corresponding binding sites found in the crystal (Scav and S0, indicated with arrows in the plot), especially the internal site which was clearly distinct from Scav. The position where we found the internal K+ site corresponds very closely to the S5 site found by Jensen et al. (2010) on Kv1.2, so we will refer to it as site S5. As for the external site that was found less distant from the crystal site S0, we kept this name. In any case, these simulations consistently showed the presence of the stable 0/2/3/5 configuration in the SF at the end of equilibration (cf. Figure 2B).
We also assessed the binding free energy of the four identified K+ binding sites, using free energy perturbation (a technique that essentially consists in slowly annihilating the K+ ion interactions with the environment and assessing the free energy change observed during the process). If the free energy change is significantly higher than for the annihilation of a K+ ion in water, then we can arguably talk about a K+ binding site. The bar plot in Figure 2D shows that the free energy increase for K+ annihilation in all the four binding sites is systematically higher than in the bath, meaning that these are all true binding sites for K+. Notice, however, the considerably smaller binding free energy for both external sites S0 and S5, compared to the internal sites S2 and S3, which is arguably the basis of the high conduction rates in this channel. In several simulations, we were in fact able to observe the unbinding of K+ from either the S0 or S5 position (Figure 2B, K+ unbinding from S5, occurring at 45 ns; lowest red trace), followed by a concerted motion of the three remaining ions as a single file along the selectivity filter (Figure 2B, concerted transition from 0/2/3 configuration to 2/3/5 configuration).
The Bikerman–PB Continuum Model of KcsA Channel
To verify if the stable 0/2/3/5 configuration, indicated by MD simulations, is a consistent occurrence at steady state, we applied the Bikerman–PB continuum model to the same channel structure used in MD simulations. PB/PNP-type continuum models can generally describe ion channels in equilibrium and non-equilibrium conditions, and therefore could be a useful integrative approach to MD, especially in predicting long-range behavior and stable configurations of the SF (Eisenberg, 1998; Nonner et al., 1999). The computation results based on the Bikerman–PB model for equilibrium situation,
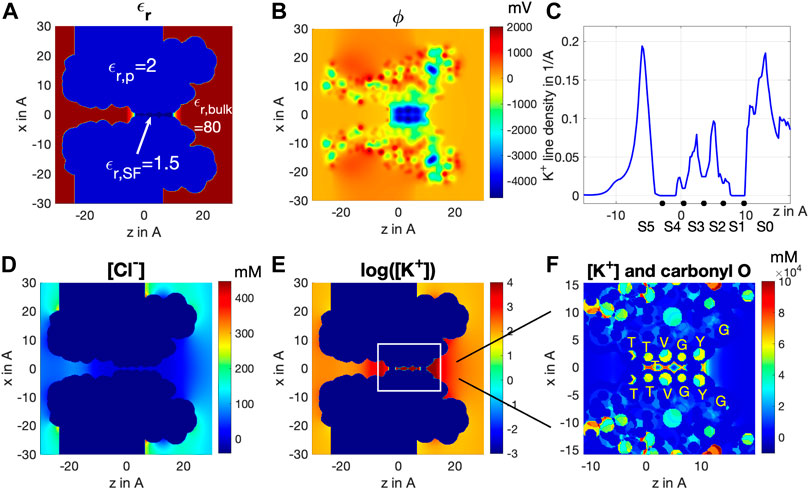
FIGURE 3. Cross-section distribution of (A) dielectric constant
Yet the K+ distribution along the central axis shown in Figure 3F cannot fully reveal the effective residence of K+ ions in the SF. For this reason, we integrated [K+] over the xy-plane cross-sectional area of the SF to obtain the line density of K+ ions as a real measure of the K+ spatial distribution along the SF, as shown in Figure 3C. Notably, we find peaks of K+ residence at sites S0, S2, S3, and S5, but basically none at sites S1 and S4. The fact that S0 and S5 display much larger peaks than S2 and S3 is mainly due to K+ ions having much more room at vestibule sites S0 and S5 than S2 and S3 do inside the SF, rather than a real difference in the concentration of the K+ ion at these sites, as indicated in Figure 3F. The slightly higher line density distribution at S2 than at S3 agrees with the observation from MD that S2 is a more stable binding site than S3 (Figure 2D) (Noskov et al., 2004). These results fully agree with MD simulations reported in Figure 2, showing the presence of a stable 0/2/3/5 configuration. Significant physics stays behind the stability of the 0/2/3/5 configuration, which is illustrated by comparing the results of the Bikerman–PB model with the classical PB model. Readers are referred to supplementary information in this article for further details.
The Association/Dissociation (A/D) Permeation Kinetic Model in KcsA Channel
MD and continuum modeling results shown above inspired us the A/D permeation mechanism shown in Figure 4. As we have seen, the channel shows an energetically stable configuration with sites S5, S3, S2, and S0 occupied by K+ ions and sites S4 and S1 empty (state 2 in Figure 4, also cf. first 45 ns simulation of Figure 2B). From this 4-K+ ion configuration, the channel can easily exchange with the bath either the K+ ion in S5 or in S0, as indicated by the binding energetics of Figure 2D. To verify if the stable 0/2/3/5 configuration, indicated by MD simulations, is a consistent occurrence at steady state, we applied the Bikerman–PB continuum. We also considered the occurrence that both K+ ions in S0 and S5 unbind in rapid succession, and in any case, before either ion in S2 or S3 moved, leaving the selectivity filter in the 2-K+ configuration (state 4) that we have observed in our MD simulations (data not shown, see also the supplementary movie in (Köpfer et al., 2014)).
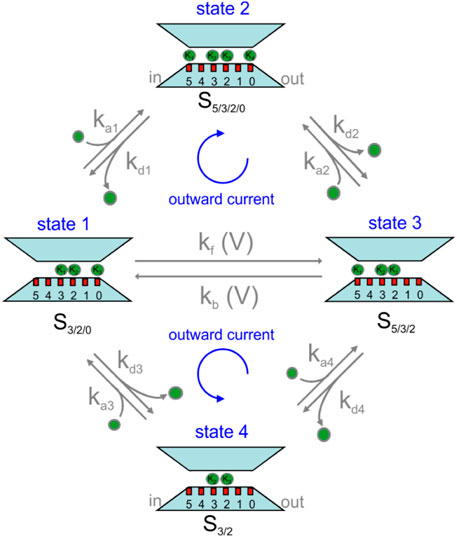
FIGURE 4. Permeation kinetic model for KcsA channel proposed in this article. See text for description.
From the above considerations, K+ permeation can be viewed as a K+ ion binding to either one of the two external sites, S5 or S0, in states 1 or 3, and another K+ ion being released (unbinding) from the opposite site (upper part of the scheme). In fact, the two events may also occur in the reverse order, with first the unbinding of a K+ ion and then the binding of another K+ at the opposite site (lower part of the scheme). In order for the system to give a continuous K+ flux, we finally need to picture how the two 3-K+ ion configurations, state 1 and state 3, can interconvert into one another through a single file movement, considering that in our model this inter-conversion must be voltage dependent. In fact, it is the only voltage-dependent process, given that the voltage applied across the membrane drops mostly inside the selectivity filter (Catacuzzeno et al., 2020), thus leaving the binding and unbinding of K+ to and from sites S0 and S5 essentially outside the electric field. We are aware that the states of our permeation model shown in Figure 4 are mainly derived from MD simulations under equilibrium conditions. It is, however, reassuring that a recent study performed on the same E71A mutant KcsA channel, under non-equilibrium conditions, has come up with essentially the same model (Domene et al., 2021).
To verify whether the permeation mechanism considered can predict the experimental current-voltage relationships, we estimated the model rate constants through MD simulations. For rate constants not involving the binding of K+ ions, namely the inter-conversion rates between states 1 and 3 and all the dissociation constants, kds, we used the mean first-passage time (MFPT) theory, originating from the Langevin’s diffusion model (Szabo, 1979; Cooper, Gates, and Eisenberg, 1988a; Cooper, Gates, and Eisenberg, 1988b; Schulten et al., 1981). According to this theory, a rate constant k can be estimated as the inverse of the mean first-passage time, that is, the time needed to go from the initial state i to the final state f of the transition.
where U(x) is the energy profile associated with the process, D is the diffusion constant, and k and T have their usual meanings. i, b, and f represent respectively the initial position, the point of maximal energy, and the final position along the reaction coordinate.
As for the K+ association rate constants, kas, we assumed that they are diffusion-limited and assessed their values from the following equation derived from the Smoluchowski (Debye, 1942):
where rc is the radius of the hemisphere through which K+ can enter the pore, here considered to be 1.5 Å and D is the bulk K+ diffusion coefficient. Notice that Eq. (29) is valid only under the assumption that K+ ions can freely diffuse to the binding site. While this is probably correct for the binding site S0, the binding to site S5 likely involves K+ diffusion through the more restricted region of the intracellular hydrophobic pore; thus, our estimate of ka1 and ka4 and the resulting estimated current would likely represent an upper limit.
As can be seen from Eqs. (28) and (29), the association rate constant depends obviously on the energy profile encountered during the process but also on the diffusion constant of K+ ions approaching the site involved in the transition. We estimated the K+ diffusion coefficient, both in the bath and the selectivity filter, from MD simulations, as the mean squared fluctuation of the K+ ion position along the z-direction (Bernèche and Roux, 2001; Bullerjahn et al., 2020). It may be noticed that the value assessed for K+ ions in the bath (0.235 ± 0.021 A2/ps) is slightly higher (yet within 20%) than the experimental value of 0.196 A2/ps. Inside the selectivity filter, we obtained, as expected, a much lower value for the diffusion coefficient, namely 0.040 ± 0.005 A2/ps, in substantial accordance with previous measurements (Allen et al., 2000).
We then estimated the energy profile associated with each of the transitions present in the reaction scheme. To this end, we used the adaptive biasing force (ABF) method, where the energy profile is adaptively assessed as the force needed to obtain a uniform distribution of the system along the reaction coordinate. Starting from the uneven distribution of K+ ions due to their accumulation at the energy wells of the actual energy profile, additional energy is applied and changed adaptively until the K+ distribution of the system is homogeneous along the reaction coordinate, meaning that the biasing energy exactly compensates for the original energy profile. The inverse of the biasing energy is then taken as the energy profile characterizing the process. Figure 5 shows the application of this method to assess the energy profiles associated with the various reaction steps present in the model considered. In the case of the interconversion between the 3-K+ ion configurations (Figure 5C), we performed a mono-dimensional ABF in which the reaction coordinate is the center of mass of the three K+ ions.
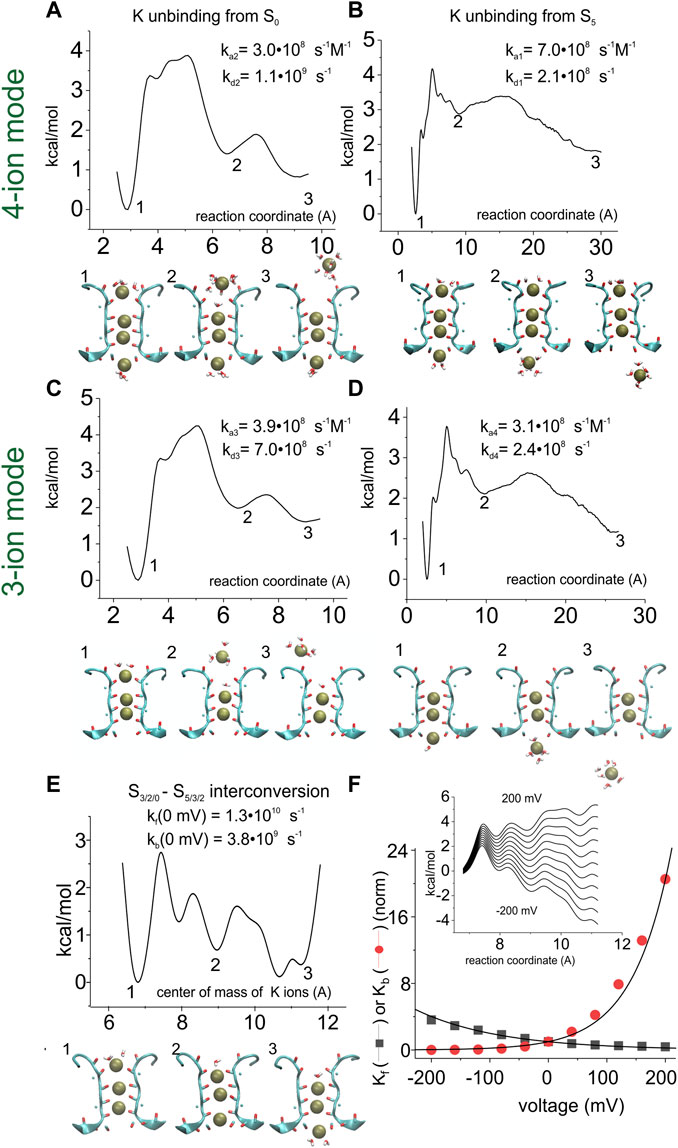
FIGURE 5. Assessment of the energy profiles and kinetic rate constants for the K+ permeation kinetic model. Energy profiles were assessed by using the adaptive biasing force (ABF) 1D method for the K+ unbinding from S0 into the extracellular solution (A when starting from a four-ion configuration, and C when starting from a three-ion configuration of the SF), from S5 into the intracellular solution (BD), and for the interconversion of the three K+ ions inside the SF (E). In (A) and (C), the reaction coordinate is the distance between the most extracellular K+ ion and the center of mass of the carbonyl oxygens forming site S1. In (B) and (D), the reaction coordinate is the distance between the most intracellular K+ ion and the center of mass of the carbonyl oxygens forming site S4. In (E), the reaction coordinate is the distance between the center of mass of the three K+ ions and the center of mass of the carbonyl oxygens of residue 79. (F) inset: energy profile for the 3-K+ ion configuration of the selectivity filter, plotted as in panel E but with the addition of linear electrostatic energy of variable amount (corresponding to potential differences from -200 to +200 mV). Compared to panel E, only the part of the energy profile going from configuration S3/S2/S0 (energy well #1) to configuration S5/S3/S2 (energy well #3) is reported. Main plot: forward and backward rate constants (Kf and Kb in the scheme of Figure 4, respectively) as a function of voltage, assessed from the energy profiles shown in the inset, using Eq. (28). The numbers associated with certain wells in the energy profiles define the configuration shown below the graphs.
Since we assumed the 3-K+ interconversion process to be voltage dependent, the assessment of the rate constants was performed both with the original energy profile and after adding various electric potential differences linearly dropping along the entire profile (Figure 5F inset). The plot in Figure 5F reports the estimated rate constants as a function of the applied potential.
As with any cyclic reaction, the model considered must respect the principle of microscopic reversibility, imposing that any molecular process and its reverse occur at equal rates, at equilibrium. Notably, the estimated rate constants were quite close to this condition, so we had to modify them only slightly (less than 25%, manually adjusted) to get perfect microscopic reversibility (Table 1).
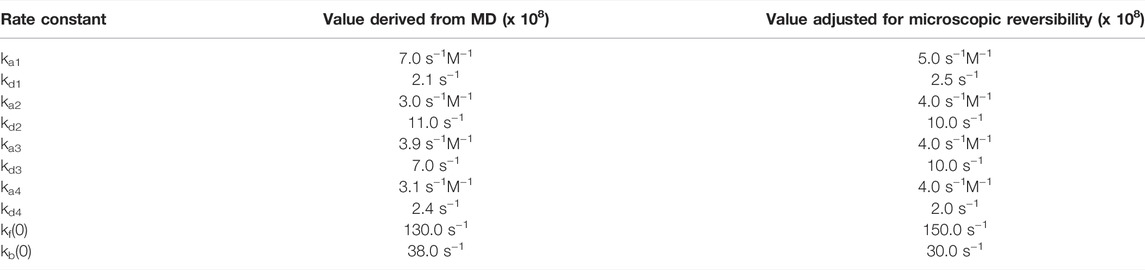
TABLE 1. Rate constants evaluated from MD and adjusted by microscopic reversibility.
To assess the effects of the diffusional restriction imposed by the intracellular vestibule, we also used the following Smoluchowski version of the association rate constant, where the accessibility to the S5 site is considered through a cylindrical hole of radius
Here,
Figure 6 top shows the predicted IV relationships at different K+ concentrations and compares them with those observed experimentally. Notably, all the major features of the experimental IVs, namely the amount of current carried, the rectification (less current at negative than positive voltages), the sub-linearity (saturation at highly positive and negative voltages), and the saturation of the chord conductance at high concentrations, appear quite well reproduced. Slightly lower predicted currents than those observed experimentally are instead found at relatively low K+ concentrations, especially at negative voltages. We think that this may originate from surface charge effects that would tend to increase the K+ concentration close to the channel, especially when the ionic strength is low. The bottom panels compare the conductance-concentration relationship derived at two potentials from our model with those found experimentally. Matching between experimental and modeling data is objectively good.
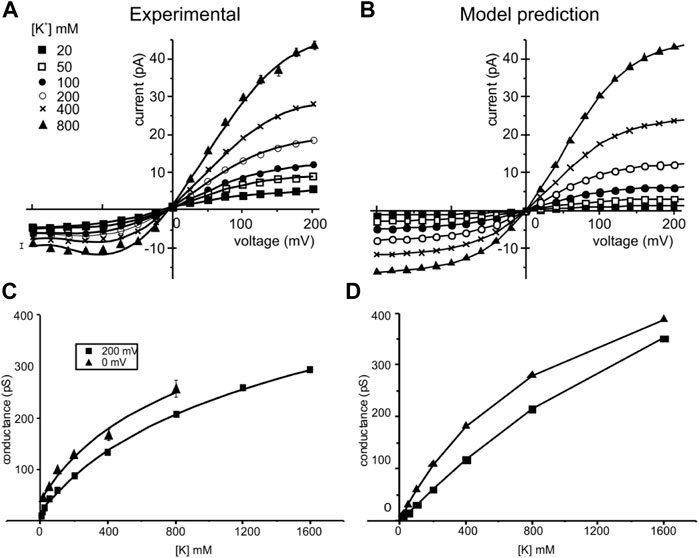
FIGURE 6. Experimental and simulated current-voltage (IV) and conductance-concentration plots. Left: experimental IV relationships (top) of the KcsA channels taken at different symmetrical K+ concentrations (indicated) and conductance-concentration relationships (bottom) at two membrane potentials. Data are from LeMasurier et al. (2001). Right: IV and conductance-concentration relationships predicted by our model using the kinetic scheme of Figure 4 and rate constants adjusted for microscopic reversibility in Table 1. The conditions used in our modeling were the same as those used to obtain the experimental results.
Discussion
Upon heating and equilibrating a K+-filled SF, as observed in X-ray crystallography, we found a stable SF configuration consisting of two K+ ions bound to the crystallographic binding sites S2 and S3, and two additional K+ ions weakly bound right at the entrances of the selectivity filter, at sites not apparent in the crystal, sites S0 and S5. K+ ions sitting in these two sites appear only partially hydrated, as they are in part stabilized by the carbonyl oxygens of tyrosine 78 and the hydroxyl oxygens of threonine 75, respectively. The Bikerman–PB continuum model, shown to correctly predict this stable 0/2/3/5 K+ ion distribution, confirmed the MD-derived configuration and provided clues on the physicochemical determinants behind it.
The configurations found suggested an association-dissociation kinetic model of permeation that could reproduce the experimentally observed conductance saturation and current-voltage sub-linearity, thus showing that an A/D model of permeation could well apply to the KcsA channel. Interestingly, our proposed mechanism is very similar to that found by Domene et al. (2021) where they analyze relatively long (microseconds) MD simulations from the E71A mutant KcsA channel in terms of transition probability matrix. However, in that study, the authors attempted neither to assess the kinetic rate constants related to various SF configurations nor to verify the prediction of the experimental electrophysiological data.
Notice that the experimental data used for comparison in Figure 6 is actually for WT KcsA (Lemasurier et al., 2001), whereas our multi-scale predictions are carried out using the E71A mutant. This is because there are only a few current-voltage measurements available in the literature for E71A (Hirano et al., 2010; Rotem et al., 2010; McCoy et al., 2014), and none of them has documented current-voltage curves under a wide range of bulk concentrations as carried out by LeMasurier et al. (Lemasurier et al., 2001). WT and E71A might differ in some aspects of the permeation. Generally speaking, the difference in outward current is small between WT and E71A but larger in the inward current (Rotem et al., 2010). It has been explained that E71A mutation reduces the outward rectification by increasing inward current at strong negative voltages, suggesting that the “flipped Asp80” creates a ring of extracellular charges and increases inward current with no effects on the outward current (Rotem et al., 2010). Our results presented in Figure 6 are in accordance with this observation, though Asp80 remained in the non-flipped position, as in WT, in our MD simulation (Supplementary Figure S2). Thus, the subtle current deviation of E71A from WT at strong negative voltages may indeed reflect their minor structural differences around the selective filter. However, it is not clear if the difference can be fully explained by the Asp80 side-chain orientation.
To identify a realistic mechanism of K+ permeation through KcsA channels, in this study we used a multi-scale approach, whereby the information obtained from MD and from continuum models at equilibrium is used to postulate a plausible kinetic model of permeation, in terms of both the number, types, and connections between the stable configurations considered and the quantitative values of the rate constants connecting them. Once this step is completed, the kinetic model can be easily verified for its predictive capability of the permeation properties experimentally available. The approach that we used here was necessary because the assessment of the single-channel current by MD typically requires a few weeks on a common workstation, a time that needs to be scaled up correspondingly because these assessments have to be repeated at several membrane potentials to construct more informative current-voltage relationships. This high computational cost strongly limits the range of possible analyses and imposes the use of non-physiological simulation conditions in terms of membrane potentials and ion concentrations. The second shortcoming of an approach fully based on MD simulations is the overwhelming number of details that the resulting trajectories provide (i.e., the positions and the velocities of all the atoms over time) most of which are not relevant for the conduction and selectivity mechanisms. On the contrary, they might be harmful as they could hinder the identification of the effectively relevant features for the process under investigation. The multi-scale approach proposed in this study tries to overcome these two current shortcomings of MD simulations on computational costs and data interpretability by using kinetic models of ion conduction. Possible shortcomings of our approach are instead represented by the limited molecular details taken into account and the use of the diffusion theory when assessing the rate constants.
A multi-scale approach has previously been used by Bernèche and Roux (2003) to predict the current passing through the KcsA channel. Similar to what we did, they derived the energy profile encountered by the ions during permeation as well as the ion diffusion coefficient, from MD, and used this information to predict the ion movements. However, instead of using the kinetic model approach, as we did, the ion permeation was predicted by the Langevin equation that assesses the random movement of a particle along the energy profile. Interestingly, the ion energy profile was assessed by assuming a 1/3 and 2/4 K+ ion configuration and water between K+ ions, in accordance with the soft knock-on model more in vogue then. Notably, the resulting energy profile correctly predicted the concentration-current relationship at varying voltages but not the IVs that were heavily hyperlinear and distant from experimental observations.
In the same study, they found that ionic currents in the tens of picoamperes, that is, in the order of those found experimentally in KcsA channels, were obtained with energy barriers of 2‐3 kcal/mol (Bernèche and Roux, 2003). These results are in apparent contrast with ours, as we obtain similar currents with an energy barrier about twice as high. Because of this incongruence, we made a few tests on our calculation procedure. First, we checked that the rate constants we assessed using the mean first-passage time theory were compatible with the height of our energy barriers. To this end, we considered a quadratic energy barrier 5 kcal/mol high and a 2 Å well-to-peak distance, that is, an energy barrier similar to what we obtained for the binding/unbinding of K+ ions to the external sites (using a diffusion coefficient of 0.235 A2/ps). Using Kramer’s equation, we analytically obtained a kinetic rate constant of about 108 s−1, that is, the same order of magnitude of our kinetic rate constants (cf. Table 1). Second, a rate of 108 ions per second going through the channel pore, each carrying a charge of 1.6 10−19 C is expected to result in a current in the order of 10–20 pA.
Another issue that needs to be addressed in this context is why long MD simulations carried out on the KcsA channel have often resulted in predicted currents significantly smaller than those observed experimentally (Köpfer et al., 2014; Furini and Domene, 2020; Mironenko et al., 2021). Imperfect force fields, lack of an intracellular domain in the structure used in the computation, differences in the phospholipid composition, the use of periodic boundary conditions, or the method for the application of the transmembrane potential have been suggested as possible causes1. We would like to draw attention here to another possible cause: the size of the intracellular vestibule. K+ channels conductance has been suggested to heavily depend on the physical dimension of the hydrophobic intracellular vestibule (Naranjo et al., 2016). This makes it possible that the width of the intracellular vestibule of the KcsA structure chosen for MD simulations can be a major cause of the variable current predicted, due to the quite variable dimensions experimentally found in different instances (Cuello et al., 2010a; Cuello et al., 2010b). Notably, simulations using a fairly large intracellular vestibule (Cα-Cα distance at Thr112 of 32 Å, as derived from PDB crystal structure 3f5w (Köpfer et al., 2014)) give KcsA currents in substantial accordance with that found experimentally (up to a factor of 2). By contrast, simulations using a much smaller size for the intracellular vestibule (22 Å, as derived from PDB structure 5vk6 (Furini and Domene, 2020; Domene et al., 2021)) give KcsA currents about one order of magnitude smaller. Our method to calculate the current through KcsA does not include the physical dimension of the intracellular vestibule but uses a rate constant for K+ binding to S5 assessed by assuming K+ diffusion through a (large) hemispherical surface surrounding the binding site (thus minimal K+ diffusion restrains to reach the site). We believe that this is the reason why our modeling predicts K+ current amplitudes substantially higher than those found by MD and in agreement with those found experimentally. In accordance, a version of the Smoluchowski equation taking into account the diffusional restriction present in the intracellular vestibule results in a reduction in the estimated current.
We have seen that site S5, which we found right at the internal entrance of the SF, can be a major determinant of the K+ flux through the KcsA channel. Although site S5 is not present in the crystal structure, it has already been seen in previous MD studies of the KcsA channel. Köpfer et al. (Köpfer et al., 2014) reported K+ ions partially hydrated and bound to site S5, in a position very close to that found in the present study, and suggested to be an important intermediate, in conjunction with site S0, of the permeation process. MD simulations of KcsA channel permeation performed by Domene et al. (Domene et al., 2021) also show K+ ions sitting at a center of mass position, slightly below the tyrosine hydroxyl oxygens. Although these authors described these K+ ions as sitting in the cavity (at site Scav), their position was completely different from that shown by the crystal electron density (Morais-Cabral et al., 2001), and in fact more similar to site S5 we found in this study and also found by Köpfer et al. (Köpfer et al., 2014). A K+ binding site positioned just below the hydroxyl oxygen, and termed S5, was also identified with MD simulations by Jensen et al. (Jensen et al., 2010), using the Kv1.2 channel structure. Our data and the cited literature suggest that partially hydrated K+ ions interact with the selectivity filter at site S5 in the internal entrance that arguably represents a stable position and an important intermediate for the permeation process of the KcsA channel.
Our data could also make a small contribution to the ongoing debate between hard and soft knock-on permeation models (see (Mironenko et al., 2021) for a recent review) for a recent review. Our equilibrium results showing the stable 0/2/3/5 configuration, with sites 1 and 4 empty (0KK0 configuration), explicitly indicate that water is not present inside the SF. In fact, we never observed water molecules stably sitting in the SF at equilibrium. Although we did not conduct real-time MD simulations that could have disclosed other K+ configurations in the SF, our results, for what little they can say, are consistent only with the hard knock-on permeation model. We wish to add that absence of water inside the SF during K+ permeation was also reported by Öster et al. (Öster et al., 2019), and our 0KK0 configuration was found to be the most probable state by Domene et al. (Domene et al., 2021) and a key configuration by Köpfer et al. (Köpfer et al., 2014). Notice that the latter two studies were carried out under permeation conditions.
Data Availability Statement
The raw data supporting the conclusion of this article will be made available by the authors, without undue reservation.
Author Contributions
MVL and LC performed molecular dynamics; T-LH performed continuum modeling; FF, T-LH, R-SC, and LC wrote the paper. All authors approved the final version of the manuscript.
Funding
This research was funded by the Ministry of Science and Technology of Taiwan with grant numbers: MOST 110-2115-M-035-003-MY2 (T-LH).
Conflict of Interest
The authors declare that the research was conducted in the absence of any commercial or financial relationships that could be construed as a potential conflict of interest.
Publisher’s Note
All claims expressed in this article are solely those of the authors and do not necessarily represent those of their affiliated organizations, or those of the publisher, the editors, and the reviewers. Any product that may be evaluated in this article, or claim that may be made by its manufacturer, is not guaranteed or endorsed by the publisher.
Supplementary Material
The Supplementary Material for this article can be found online at: https://www.frontiersin.org/articles/10.3389/fmolb.2022.880660/full#supplementary-material
Footnotes
1Incidentally, the fact that our method, essentially based on equilibrium MD computations, predicts currents close to those experimentally observed would exclude the possibility that the inconsistency derives from an erroneous force field.
References
Allen, T. W., Kuyucak, S., and Chung, S.-H. (2000). Molecular Dynamics Estimates of Ion Diffusion in Model Hydrophobic and KcsA Potassium Channels. Biophys. Chem. 86, 1–14. doi:10.1016/s0301-4622(00)00153-8
Bernèche, S., and Roux, B. (2003). A Microscopic View of Ion Conduction through the K+ Channel. Proc. Natl. Acad. Sci. U. S. A. 100, 8644–8648. doi:10.1073/pnas.1431750100
Bernèche, S., and Roux, B. (2001). Energetics of Ion Conduction through the K+ Channel. Nature 414, 73–77. doi:10.1038/35102067
Best, R. B., Zhu, X., Shim, J., Lopes, P. E. M., Mittal, J., Feig, M., et al. (2012). Optimization of the Additive CHARMM All-Atom Protein Force Field Targeting Improved Sampling of the Backbone ϕ, ψ and Side-Chain χ1 and χ2 Dihedral Angles. J. Chem. Theory Comput. 8, 3257–3273. doi:10.1021/ct300400x
Bikerman, J. J. (1942). XXXIX. Structure and Capacity of Electrical Double Layer. Lond. Edinb. Dublin Philosophical Mag. J. Sci. 33, 384–397. doi:10.1080/14786444208520813
Borukhov, I., Andelman, D., and Orland, H. (1997). Steric Effects in Electrolytes: A Modified Poisson-Boltzmann Equation. Phys. Rev. Lett. 79, 435–438. doi:10.1103/physrevlett.79.435
Bullerjahn, J. T., von Bülow, S., and Hummer, G. (2020). Optimal Estimates of Self-Diffusion Coefficients from Molecular Dynamics Simulations. J. Chem. Phys. 153, 024116. doi:10.1063/5.0008312
Catacuzzeno, L., Sforna, L., and Franciolini, F. (2020). Voltage-dependent Gating in K Channels: Experimental Results and Quantitative Models. Pflugers Arch. - Eur. J. Physiol. 472, 27–47. doi:10.1007/s00424-019-02336-6
Comer, J., Gumbart, J. C., Hénin, J., Lelièvre, T., Pohorille, A., and Chipot, C. (2015). The Adaptive Biasing Force Method: Everything You Always Wanted to Know but Were Afraid to Ask. J. Phys. Chem. B 119, 1129–1151. doi:10.1021/jp506633n
Cooper, K. E., Gates, P. Y., and Eisenberg, R. S. (1988a). Diffusion Theory and Discrete Rate Constants in Ion Permeation. J. cooper Biol. 106, 95–105. doi:10.1007/bf01871391
Cooper, K. E., Gates, P. Y., and Eisenberg, R. S. (1988b). Surmounting Barriers in Ionic Channels. Quart. Rev. Biophys. 21, 331–364. doi:10.1017/s0033583500004480
Cuello, L. G., Cortes, D. M., and Perozo, E. (2017). The Gating Cycle of a K+ Channel at Atomic Resolution. Elife 6. doi:10.7554/eLife.28032
Cuello, L. G., Jogini, V., Cortes, D. M., Pan, A. C., Gagnon, D. G., Dalmas, O., et al. (2010). Structural Basis for the Coupling between Activation and Inactivation Gates in K+ Channels. Nature 466, 272–275. doi:10.1038/nature09136
Cuello, L. G., Jogini, V., Cortes, D. M., and Perozo, E. (2010). Structural Mechanism of C-type Inactivation in K+ Channels. Nature 466, 203–208. doi:10.1038/nature09153
Darden, T., York, D., and Pedersen, L. (1993). Particle Mesh Ewald: AnN⋅Log(N) Method for Ewald Sums in Large Systems. J. Chem. Phys. 98, 10089–10092. doi:10.1063/1.464397
Darve, E., Rodríguez-Gómez, D., and Pohorille, A. (2008). Adaptive Biasing Force Method for Scalar and Vector Free Energy Calculations. J. Chem. Phys. 128, 144120. doi:10.1063/1.2829861
Debye, P. (1942). Reaction Rates in Ionic Solutions. Trans. Electrochem. Soc. 82, 265. doi:10.1149/1.3071413
Domene, C., Ocello, R., Masetti, M., and Furini, S. (2021). Ion Conduction Mechanism as a Fingerprint of Potassium Channels. J. Am. Chem. Soc. 143, 12181–12193. doi:10.1021/jacs.1c04802
Doyle, D. A., Cabral, J. M., Pfuetzner, R. A., Kuo, A., Gulbis, J. M., Cohen, S. L., et al. (1998). The Structure of the Potassium Channel: Molecular Basis of K + Conduction and Selectivity. Science 280, 69–77. doi:10.1126/science.280.5360.69
Dyrka, W., Bartuzel, M. M., and Kotulska, M. (2013). Optimization of 3D Poisson-Nernst-Planck Model for Fast Evaluation of Diverse Protein Channels. Proteins 81, 1802–1822. doi:10.1002/prot.24326
Eisenberg, B. (1998). Ionic Channels in Biological Membranes: Natural Nanotubes. Acc. Chem. Res. 31, 117–123. doi:10.1021/ar950051e
Feller, S. E., Zhang, Y., Pastor, R. W., and Brooks, B. R. (1995). Constant Pressure Molecular Dynamics Simulation: The Langevin Piston Method. J. Chem. Phys. 103, 4613–4621. doi:10.1063/1.470648
Furini, S., Beckstein, O., and Domene, C. (2009). Permeation of Water through the KcsA K+channel. Proteins 74, 437–448. doi:10.1002/prot.22163
Furini, S., and Domene, C. (2020). Critical Assessment of Common Force Fields for Molecular Dynamics Simulations of Potassium Channels. J. Chem. Theory Comput. 16, 7148–7159. doi:10.1021/acs.jctc.0c00331
Furini, S., Zerbetto, F., and Cavalcanti, S. (2006). Application of the Poisson-Nernst-Planck Theory with Space-dependent Diffusion Coefficients to KcsA. Biophysical J. 91, 3162–3169. doi:10.1529/biophysj.105.078741
Hénin, J., Fiorin, G., Chipot, C., and Klein, M. L. (2010). Exploring Multidimensional Free Energy Landscapes Using Time-Dependent Biases on Collective Variables. J. Chem. Theory Comput. 6, 35–47.
Hirano, M., Takeuchi, Y., Aoki, T., Yanagida, T., and Ide, T. (2010). Rearrangements in the KcsA Cytoplasmic Domain Underlie its Gating. J. Biol. Chem. 285, 3777–3783. doi:10.1074/jbc.m109.084368
Hodgkin, A. L., and Keynes, R. D. (1955). The Potassium Permeability of a Giant Nerve Fibre. J. Physiol. 128, 61–88. doi:10.1113/jphysiol.1955.sp005291
Horng, T.-L., Lin, T.-C., Liu, C., and Eisenberg, B. (2012). PNP Equations with Steric Effects: A Model of Ion Flow through Channels. J. Phys. Chem. B 116, 11422–11441. doi:10.1021/jp305273n
Horng, T. L. (2020). Review and Modification of Entropy Modeling for Steric Effects in the Poisson-Boltzmann Equation. Entropy (Basel) 22, 632. doi:10.3390/e22060632
Jensen, M. Ø., Borhani, D. W., Lindorff-Larsen, K., Maragakis, P., Jogini, V., Eastwood, M. P., et al. (2010). Principles of Conduction and Hydrophobic Gating in K + Channels. Proc. Natl. Acad. Sci. U.S.A. 107, 5833–5838. doi:10.1073/pnas.0911691107
Jensen, M. Ø., Jogini, V., Eastwood, M. P., and Shaw, D. E. (2013). Atomic-level Simulation of Current-Voltage Relationships in Single-File Ion Channels. J. Gen. Physiol. 141, 619–632. doi:10.1085/jgp.201210820
Jorgensen, W. L., Chandrasekhar, J., Madura, J. D., Impey, R. W., and Klein, M. L. (1983). Comparison of Simple Potential Functions for Simulating Liquid Water. J. Chem. Phys. 79, 926–935. doi:10.1063/1.445869
Kopec, W., Köpfer, D. A., Vickery, O. N., Bondarenko, A. S., Jansen, T. L. C., de Groot, B. L., et al. (2018). Direct Knock-On of Desolvated Ions Governs Strict Ion Selectivity in K+ Channels. Nat. Chem. 10, 813–820. doi:10.1038/s41557-018-0105-9
Köpfer, D. A., Song, C., Gruene, T., Sheldrick, G. M., Zachariae, U., and De Groot, B. L. (2014). Ion Permeation in K+ Channels Occurs by Direct Coulomb Knock-On. Science. 346, 352–355. doi:10.1126/science.1254840
Kratochvil, H. T., Carr, J. K., Matulef, K., Annen, A. W., Li, H., Maj, M., et al. (2016). Instantaneous Ion Configurations in the K + Ion Channel Selectivity Filter Revealed by 2D IR Spectroscopy. Science 353, 1040–1044. doi:10.1126/science.aag1447
Langan, P. S., Vandavasi, V. G., Weiss, K. L., Afonine, P. V., el Omari, K., Duman, R., et al. (2018). Anomalous X-Ray Diffraction Studies of Ion Transport in K+ Channels. Nat. Commun. 9, 4540–4545. doi:10.1038/s41467-018-06957-w
Lemasurier, M., Heginbotham, L., and Miller, C. (2001). Kcsa. J. Gen. Physiol. 118, 303–314. doi:10.1085/jgp.118.3.303
Li, J., Ostmeyer, J., Cuello, L. G., Perozo, E., and Roux, B. (2018). Rapid Constriction of the Selectivity Filter Underlies C-type Inactivation in the KcsA Potassium Channel. J. Gen. Physiol. 150, 1408–1420. doi:10.1085/jgp.201812082
Liu, P., Dehez, F., Cai, W., and Chipot, C. (2012). A Toolkit for the Analysis of Free-Energy Perturbation Calculations. J. Chem. Theory Comput. 8, 2606–2616. doi:10.1021/ct300242f
Liu, X., and Lu, B. (2017). Incorporating Born Solvation Energy into the Three-Dimensional Poisson-Nernst-Planck Model to Study Ion Selectivity in KcsA K+ Channels. Phys. Rev. E 96, 62416. doi:10.1103/physreve.96.062416
MacKerell, A. D., Bashford, D., Bellott, M., Dunbrack, R. L., Evanseck, J. D., Field, M. J., et al. (1998). All-atom Empirical Potential for Molecular Modeling and Dynamics Studies of Proteins. J. Phys. Chem. B 102, 3586–3616. doi:10.1021/jp973084f
Martyna, G. J., Tobias, D. J., and Klein, M. L. (1994). Constant Pressure Molecular Dynamics Algorithms. J. Chem. Phys. 101, 4177–4189. doi:10.1063/1.467468
McCoy, J. G., Rusinova, R., Kim, D. M., Kowal, J., Banerjee, S., Jaramillo Cartagena, A., et al. (2014). A KcsA/MloK1 Chimeric Ion Channel Has Lipid-dependent Ligand-Binding Energetics. J. Biol. Chem. 289, 9535–9546. doi:10.1074/jbc.m113.543389
Mironenko, A., Zachariae, U., de Groot, B. L., and Kopec, W. (2021). The Persistent Question of Potassium Channel Permeation Mechanisms. J. Mol. Biol. 433, 167002. doi:10.1016/j.jmb.2021.167002
Morais-Cabral, J. H., Zhou, Y., and MacKinnon, R. (2001). Energetic Optimization of Ion Conduction Rate by the K+ Selectivity Filter. Nature 414, 37–42. doi:10.1038/35102000
Naranjo, D., Moldenhauer, H., Pincuntureo, M., and Díaz-Franulic, I. (2016). Pore Size Matters for Potassium Channel Conductance. J. Gen. Physiol. 148, 277–291. doi:10.1085/jgp.201611625
Nelson, P. H. (2011). A Permeation Theory for Single-File Ion Channels: One- and Two-step Models. J. Chem. Phys. 134, 165102. doi:10.1063/1.3580562
Nonner, W., Chen, D. P., and Eisenberg, B. (1999). Progress and Prospects in Permeation. J. Gen. Physiol. 113, 773–782. doi:10.1085/jgp.113.6.773
Noskov, S. Y., Bernèche, S., and Roux, B. (2004). Control of Ion Selectivity in Potassium Channels by Electrostatic and Dynamic Properties of Carbonyl Ligands. Nature 431, 830–834. doi:10.1038/nature02943
Öster, C., Hendriks, K., Kopec, W., Chevelkov, V., Shi, C., Michl, D., et al. (2019). The Conduction Pathway of Potassium Channels Is Water Free under Physiological Conditions. Sci. Adv. 5, 6756. doi:10.1126/sciadv.aaw6756
Pearlman, D. A. (2002). A Comparison of Alternative Approaches to Free Energy Calculations. J. Phys. Chem. 98, 1487–1493. doi:10.1021/j100056a020
Phillips, J. C., Braun, R., Wang, W., Gumbart, J., Tajkhorshid, E., Villa, E., et al. (2005). Scalable Molecular Dynamics with NAMD. J. Comput. Chem. 26, 1781–1802. doi:10.1002/jcc.20289
Rotem, D., Mason, A., and Bayley, H. (2010). Inactivation of the KcsA Potassium Channel Explored with Heterotetramers. J. Gen. Physiol. 135, 29–42. doi:10.1085/jgp.200910305
Schulten, K., Schulten, Z., and Szabo, A. (1981). Dynamics of Reactions Involving Diffusive Barrier Crossing. J. Chem. Phys. 74, 4426–4432. doi:10.1063/1.441684
Szabo, A. (1979). Theory of Polarized Fluorescent Emission in Uniaxial Liquid Crystals. J. Chem. Phys. 72, 4620–4626. doi:10.1063/1.439704
Wang, J., Deng, Y., and Roux, B. (2006). Absolute Binding Free Energy Calculations Using Molecular Dynamics Simulations with Restraining Potentials. Biophysical J. 91, 2798–2814. doi:10.1529/biophysj.106.084301
Wu, D. (2017). Dynamic Water Patterns Change the Stability of the Collapsed Filter Conformation of the KcsA K+ Channel. PLoS One 12, e0186789. doi:10.1371/journal.pone.0186789
Keywords: K channels, permeation, KcsA, molecular dynamics, Bikerman–Poisson–Boltzmann, kinetic model, IV curve
Citation: Horng TL, Chen RS, Leonardi MV, Franciolini F and Catacuzzeno L (2022) A Multi-Scale Approach to Model K+ Permeation Through the KcsA Channel. Front. Mol. Biosci. 9:880660. doi: 10.3389/fmolb.2022.880660
Received: 21 February 2022; Accepted: 16 May 2022;
Published: 08 July 2022.
Edited by:
Simone Furini, University of Siena, ItalyReviewed by:
Vishwanath Jogini, D. E. Shaw Research, United StatesIgor Vorobyov, University of California, United States
Copyright © 2022 Horng, Chen, Leonardi, Franciolini and Catacuzzeno. This is an open-access article distributed under the terms of the Creative Commons Attribution License (CC BY). The use, distribution or reproduction in other forums is permitted, provided the original author(s) and the copyright owner(s) are credited and that the original publication in this journal is cited, in accordance with accepted academic practice. No use, distribution or reproduction is permitted which does not comply with these terms.
*Correspondence: T. L. Horng, dGxob3JuZ0BmY3UuZWR1LnR3; L. Catacuzzeno, bHVpZ2kuY2F0YWN1enplbm9AdW5pcGcuaXQ=