- 1Department of Pathology, The Second Affiliated Hospital of Dalian Medical University, Dalian, China
- 2Department of Hematology, The Second Affiliated Hospital of Dalian Medical University, Dalian, China
Although accumulating evidence has verified the relationship between CCNA2 and cancers, no pan-cancer analysis about the function and the upstream molecular mechanism of CCNA2 is available. For the first time, we analyzed potential oncogenic roles of CCNA2 in 33 cancer types via The Cancer Genome Atlas (TCGA) database. Overexpression of CCNA2 is widespread in almost all cancer types, and it is related to poor prognosis and advanced pathological stages in most cases. Moreover, we conducted upstream miRNAs and lncRNAs of CCNA2 to establish upstream regulatory networks in kidney renal clear cell carcinoma (LINC00997/miR-27b-3p/CCNA2), liver hepatocellular carcinoma (SNHG16, GUSBP11, FGD5-AS1, LINC00630, CD27-AS1, LINC00997/miR-22-3p/CCNA2, miR-29b-3p/CCNA2, miR-29c-3p/CCNA2, and miR-204-5p/CCNA2), and lung adenocarcinoma (miRNA-218-5p/CCNA2 and miR-204-5p/CCNA2) by expression analysis, survival analysis, and correlation analysis. The CCNA2 expression is positively correlated with Th2 cell infiltration and negatively correlated with CD4+ central memory and effector memory T-cell infiltration in different cancer types. Furthermore, CCNA2 is positively associated with expressions of immune checkpoints (CD274, CTLA4, HAVCR2, LAG3, PDCD1, and TIGIT) in most cancer types. Our first CCNA2 pan-cancer study contributes to understanding the prognostic and immunological roles and potential upstream molecular mechanisms of CCNA2 in different cancers.
Introduction
Cyclins are established regulators of the cell cycle through activation of a specific family of kinases, the cyclin-dependent kinases (CDKs). Cyclin A2 (CCNA2) is a member of the cyclin family that, promotes transition through G1/S and G2/M by binding and activating cyclin-dependent kinase 1 (CDK1) and cyclin-dependent kinase 2 (CDK2) (Baumann, 2016). In addition, there are additional functions of CCNA2, such as cytoskeleton dynamic and cell motility (Bendris et al., 2012). CCNA2 overexpression has been reported in certain types of cancer, such as pancreatic ductal adenocarcinoma (Dong et al., 2019), stomach adenocarcinoma (Zhang et al., 2018a), and hepatocellular carcinoma (Zhang et al., 2021). Moreover, its overexpression indicates poor prognosis of patients in some cancer types (Ko et al., 2013; Zhang et al., 2018a; Dong et al., 2019; Zhang et al., 2021). CCNA2 has been identified as a tumor therapeutic target involved in the processes of cell proliferation (Peng et al., 2018; Wang et al., 2021a; Xiong et al., 2021). However, there is still no pan-cancer evidence for CCNA2 in various tumor types based on large clinical data. Recently, large numbers of functional genomics databases have become available on public platforms. The Cancer Genome Atlas (TCGA) project has generated genomic, epigenomic, transcriptomic, and proteomic data on 33 different cancer types. In addition, TCGA has clinical data such as prognosis and pathological stage. Therefore, we conducted a pan-cancer analysis of CCNA2 using the TCGA project.
Noncoding RNAs (ncRNAs) lack protein-encoding capabilities. MicroRNAs (miRNAs) are a family of ncRNAs with a length of 20–25 nucleotides, which widely participate in post-transcriptional regulation by binding to complementary sites within the 3′-untranslated region (3′-UTR) of target mRNAs (Tang et al., 2018). LncRNAs are defined as a subtype of ncRNA longer than 200 nucleotides. The competing endogenous RNA (ceRNA) hypothesis described that lncRNAs, mRNAs, and transcribed pseudogenes compete for binding miRNAs via miRNA response elements (MREs) (Salmena et al., 2011). In other words, when lncRNAs competitively sequester miRNAs from their targeted mRNAs through complementary base pairing, known as “sponging”, they increase the mRNA expression by decreasing the binding of miRNAs and mRNAs (Karreth and Pandolfi, 2013). Accumulating evidence has shown that lncRNAs play a critical role in tumor development and metastasis by acting as a ceRNA for miRNAs (Wang et al., 2017; Yang et al., 2018; Qiao et al., 2019). Moreover, several lncRNAs have been verified as ceRNAs of CCNA2 in tumors. DNAH17-AS1 promotes the development of non-small cell lung cancer by targeting the miR-877-5p/CCNA2 pathway (Du et al., 2020). Data from the Gene Expression Omnibus (GEO) database shows that LINC00665 promotes lung adenocarcinoma by miR-let-7b-CCNA2 (Du et al., 2020). HMGA1P4 regulates CCNA2 by miR‐301b/miR‐508 in gastric cancer (Zhang et al., 2019). However, the miR‐301b/miR‐508 expression was not verified to be inversely correlated with CCNA2 mRNA and HMGA1P4.
Immune cells and inflammatory cytokines in the tumor microenvironment could influence tumors’ development and occurrence, and immune escape plays a key role in the process of tumorigenesis and development (Elinav et al., 2013). Tumor cells inhibit the activation of T cells to avoid antitumor immune attacks through immune checkpoints. Therefore, targeting immune checkpoints to remove inhibitory effects is a notable method of tumor immunotherapy (Tsai and Hsu, 2017). Cluster of differentiation 274 (CD274/PD-L1), programmed cell death protein 1 (PDCD1/PD-1), and cytotoxic T lymphocyte-associated antigen-4 (CTLA-4/CD152) are frequently clinically targeted immune checkpoints in recent years. However, immunotherapy targeting the above immune checkpoints is ineffective in many tumor patients. Therefore, more immune checkpoints are needed to expand the therapeutic range. Therapies targeting novel immune checkpoints such as lymphocyte activation gene-3 (LAG-3/CD223), hepatitis A virus cellular receptor 2 (HAVCR2/TIM-3), and T-cell immunoreceptor with Ig and ITIM domains (TIGIT) have been under clinical trials (Sasidharan Nair and Elkord, 2018). LAG-3 is upregulated on activated CD4+ T cells, CD8+ T cells, and a subset of natural killer (NK) cells, and inhibits T-cell responses, cooperating with PD-1 (Anderson et al., 2016). HAVCR2 marks the exhausted or dysfunctional CD8+ T cells (Anderson et al., 2016) and has a non-redundant synergy with PD-1 in the suppression of effector T-cell activity (Tsai and Hsu, 2017). TIGIT is confirmed to inhibit the responses of effector T cells in tumors synergizing with PD-1 or HAVCR2 (Tsai and Hsu, 2017; Solomon and Garrido-Laguna, 2018).
For the first time, our research uses the TCGA project to investigate a pan-cancer analysis of CCNA2, including gene expression, clinical survival prognosis, pathological stage, immune cell infiltration, immune cell markers, and immune checkpoints. Moreover, we identified upstream miRNAs and lncRNAs of CCNA2 to establish several ceRNA networks or miRNA-CCNA2 mRNA regulatory networks in kidney renal clear cell carcinoma (KIRC), liver hepatocellular carcinoma (LIHC), and lung adenocarcinoma (LUAD) by expression analysis, survival analysis, and correlation analysis. We believe that our work could assist in predicting the prognosis of patients with many cancer types and deepen our understanding of the potential regulation mechanism of CCNA2.
Methods
Data Source and Processing
The Cancer Genome Atlas (TCGA; http://cancergenome.nih.gov), which is a landmark cancer genomics program, has characterized over 20,000 primary cancer and normal samples in 33 cancer types until Sep 2021. Using UCSC Xena (https://xenabrowser.net/), we collected gene expression RNAseq data and survival data from various cancer and normal samples in the TCGA database (Goldman et al., 2020). Genotype-tissue expression (GTEx; http://commonfund.nih.gov/GTEx/) is a gene expression data from 54 normal tissue sites across nearly 1,000 people by RNA sequencing. We used normal samples from GTEx when there were none or <5 normal samples from TCGA in specific cancer types, to compare the CCNA2 expression from cancer and normal tissue.
CCNA2 Expression Profiles
Perl script and the R language were used to integrate and analyze the data. A Perl script was used to convert “Ensembl_ID” of the transcriptome data that was downloaded from UCSC Xena to the name of the corresponding gene. Then, we chose the “limma” package of the R language to perform difference analysis of the CCNA2 expression in cancer types with five or more adjacent normal tissues from the TCGA project. We took |log2FC|> 1 and an adjusted p-value < 0.05 as the cut-off criterion for further CCNA2-ceRNA network analysis. For certain tumor types without normal or <5 normal tissues from the TCGA project, we used the “Expression on Box Plots” module of the GEPIA (Gene Expression Profiling Interactive Analysis) web server (http://gepia.cancer-pku.cn/) to obtain the expression of CCNA2 in these tumor tissues and the normal tissues of the GTEx and TCGA databases (Tang et al., 2017).
Survival Analysis
We first analyzed overall survival (OS) and disease-free survival (DFS) based on the CCNA2 expression (50% high-expression group and 50% low-expression group) in all cancer types by the “Survival Plots” module of the GEPIA web server. GEPIA uses the Log-rank test, also known as the Mantel–Cox test, for hypothesis testing. To ensure that CCNA2 has a definite OS significance in some tumor types, we further performed OS analysis using the “survival” package in the R language by the Kaplan-Meier survival curve and the log-rank test based on the CCNA2 expression (50% high-expression group and 50% low-expression group) in cancer types with five or more TCGA adjacent normal tissues, and only tumor types with statistical significance by two methods will undergo further CCNA2-ceRNA network analysis. We also performed survival analysis by using the Kaplan–Meier survival curve based on miRNA and lncRNA expressions (at the best cutoff, there was the most significant difference in OS between the high- and the low-expression groups), which used “survival” and “survminer” packages in the R language.
Prediction of Upstream miRNA/lncRNA
The starBase database (https://starbase.sysu.edu.cn/) was employed to predict miRNA–lncRNA interactions and miRNA–mRNA interactions (Li et al., 2014), and the results were supported by Ago CLIP-seq data. Interactions of miRNA–mRNA were predicted by at least two programs from PITA, RNA22, miRmap, DIANA-microT, miRanda, PicTar, and TargetScan. The interactions of miRNA with lncRNA were predicted by using the miRanda program. According to the mechanism of ceRNA, CCNA2-related ceRNAs were selected according to the following criteria (Zhou et al., 2014; Xu et al., 2015): 1) The CCNA2 (upregulated in tumor, |log2FC|> 1), CCNA2-bound miRNAs (downregulated in tumor) and lncRNAs (upregulated in tumor) were significantly differentially expressed in tumor samples compared with normal samples from TCGA. 2) The lncRNAs and CCNA2 were positively correlated (rho value > 0.2, p value < 0.05, Spearman’s rank correlation test) in tumor samples, which were identified as co-expressed lncRNA–mRNA pairs. 3) For a given co-expressed lncRNA–CCNA2 mRNA pair, both CCNA2 and lncRNA in this pair were targeted and co-expressed negatively with a certain miRNA (rho value < −0.2, p value < 0.05, Spearman’s rank correlation test) in tumor samples. ceRNA networks and miRNA-CCNA2 networks were presented using the Cytoscape web tool (http://js.cytoscape.org). All analyses were performed in R 4.1.0 (https://www.r-project.org/).
Immune Infiltration
TIMER2.0 (http://timer.cistrome.org/) web server is a comprehensive resource for systematical analysis of immune infiltrates across diverse cancer types (Li et al., 2017; Li et al., 2020a). We used it to explore the association between CCNA2 expression and immune infiltrates (B cells, CD4+T cells, CD8+T cells, myeloid dendritic cells, macrophages, monocytes, NK cells, Tregs, and neutrophils) across TCGA tumors. Moreover, we used the “gene correlation” module of TIMER2.0 to explore the correlations between CCNA2 and expressions of immune checkpoints (CD274, CTLA4, HAVCR2, LAG3, PDCD1, and TIGIT). The p-values and partial rho values were obtained via the purity-adjusted Spearman’s rank correlation test.
Results
CCNA2 Is Overexpressed in Most Cancers
We first analyzed the CCNA2 expression in cancer types with five or more adjacent normal tissues from the TCGA project. As graphed in Figure 1A, the expression level of CCNA2 in all 18 cancers of bladder urothelial carcinoma (BLCA), breast invasive carcinoma (BRCA), cholangiocarcinoma (CHOL), colon adenocarcinoma (COAD), esophageal carcinoma (ESCA), glioblastoma multiforme (GBM), head and neck squamous cell carcinoma (HNSC), kidney chromophobe (KICH), KIRC, kidney renal papillary cell carcinoma (KIRP), LIHC, LUAD, lung squamous cell carcinoma (LUSC), prostate adenocarcinoma (PRAD), rectum adenocarcinoma (READ), stomach adenocarcinoma (STAD), thyroid carcinoma (THCA), and uterine corpus endometrial carcinoma (UCEC) is higher than their adjacent normal tissues (p < 0.01 in READ, and p < 0.001 in other cancer types). After including the normal tissues from the GTEx project as controls, we determined the expression level of CCNA2 in other cancer types. As is shown in Figure 1B, the expression of CCNA2 mRNA is higher in adrenocortical carcinoma (ACC), cervical squamous cell carcinoma and endocervical adenocarcinoma (CESC), diffuse large B-cell lymphoma (DLBC), ovarian serous cystadenocarcinoma (OV), pancreatic adenocarcinoma (PAAD), sarcoma (SARC), skin cutaneous melanoma (SKCM), testicular germ cell tumors (TGCT), thymoma (THYM), and uterine carcinosarcoma (UCS, p < 0.01 in SARC, and p < 0.001 in other cancer types). However, CCNA2 mRNA is lower in acute myeloid leukemia (LAML) than that in normal tissues from the GTEx project (p < 0.001), and we do not obtain a significant difference in brain lower grade glioma (LGG) and pheochromocytoma and paraganglioma (PCPG).
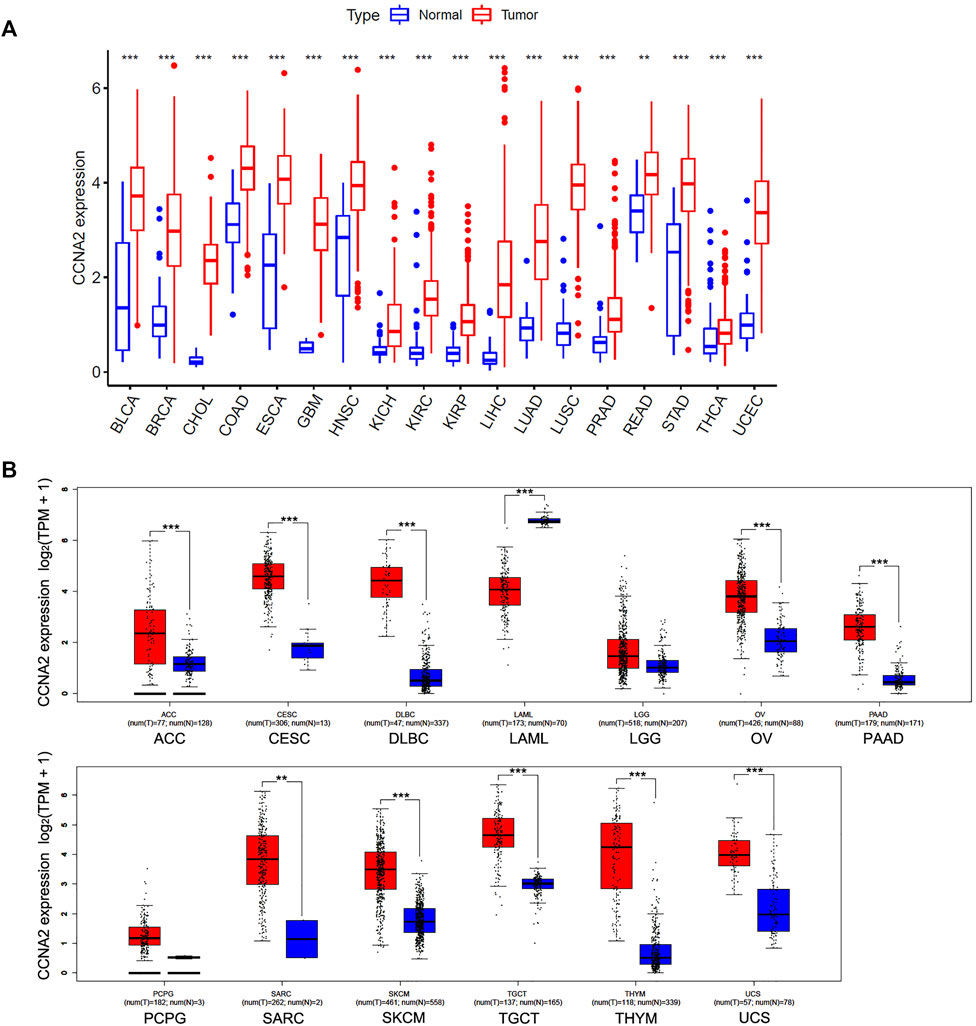
FIGURE 1. Expression Analysis of CCNA2 in various cancers. (A) The expression of the CCNA2 in 18 cancer types with five or more normal tissues from the TCGA project via R language. (B) The expression of the CCNA2 in 13 other cancer types, normal tissues from GTEx project, or TCGA + GTEx as controls. **p < 0.01, ***p < 0.001.
Significant Prognostic Value of CCNA2 in Cancers
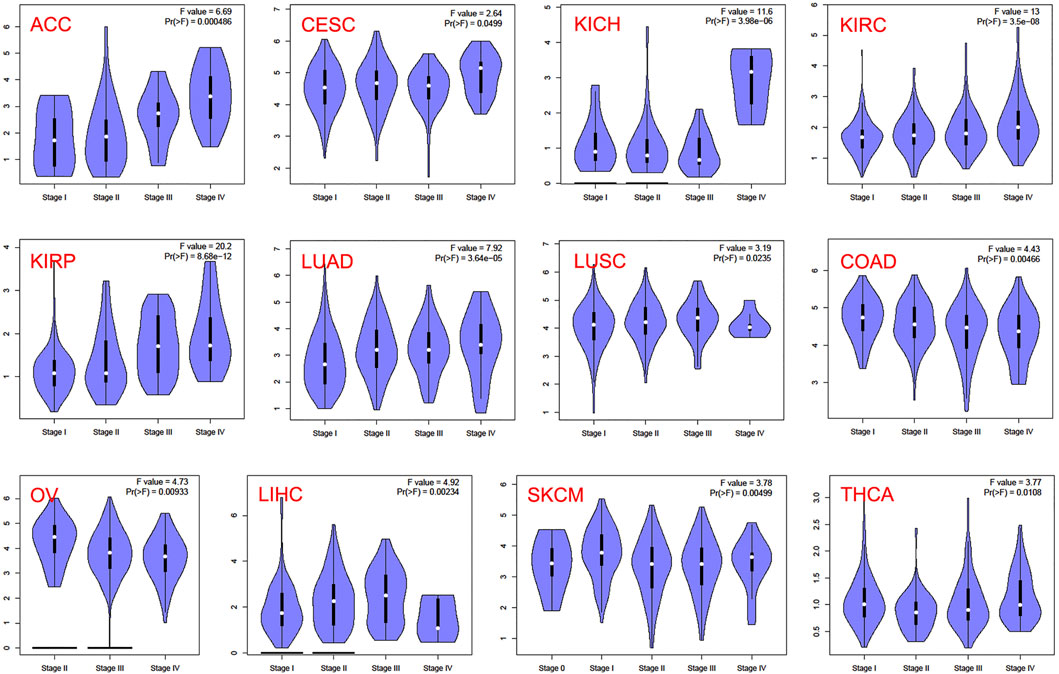
In the TCGA project, we used the “Survival Plots” module of GEPIA to analyze the relationship between CCNA2 expression level and the clinical prognosis of patients with different cancer types. We separated the cancer cases into high-expression groups (50%) and low-expression groups (50%) according to the expression levels of CCNA2. As is shown in Figure 2A, the high expression of CCNA2 is related to poor prognosis of overall survival (OS) in cancers of ACC (p < 0.001), KIRC (p = 0.0014), KIRP (p < 0.001), LGG (p < 0.001), LIHC (p = 0.0041), LUAD (p < 0.001), MESO (p < 0.001), PAAD (p = 0.0047), and SCKM (p = 0.011, Figure 1A). In addition, PRAD nearly reaches statistical significance (p = 0.054). However, high expression of CCNA2 is related to better OS in COAD (p = 0.039) and THYM (p = 0.025, Figure 2A). Disease-free survival (DFS) data indicates high expression of CCNA2 is related to poor prognosis in cancers of ACC (p = 0.0057), BLCA (p = 0.049), KIRP (p < 0.001), LGG (p < 0.001), LIHC (p = 0.0039), PAAD (p = 0.038), PRAD (p = 0.0015), SARC (p = 0.0014), THCA (p = 0.0025), UVM (p = 0.0064) (Figure 2B). In addition, KICH (p = 0.054), KIRC (p = 0.06), and SKCM (p = 0.061) nearly reach statistical significance. We also employed the “Pathological Stage Plot” module of GEPIA2 to observe the correlation between CCNA2 expression and the pathological stages of cancers. As is shown in Figure 3, high expression of CCNA2 is generally related to advanced staging in ACC, CESC, KICH, KIRC, KIRP, LUAD, and LUSC, and it is related to better staging in COAD and OV (all p values < 0.05). The results are also statistically significant in LIHC, SKCM, and THCA but do not have a tendency (all p values < 0.05).
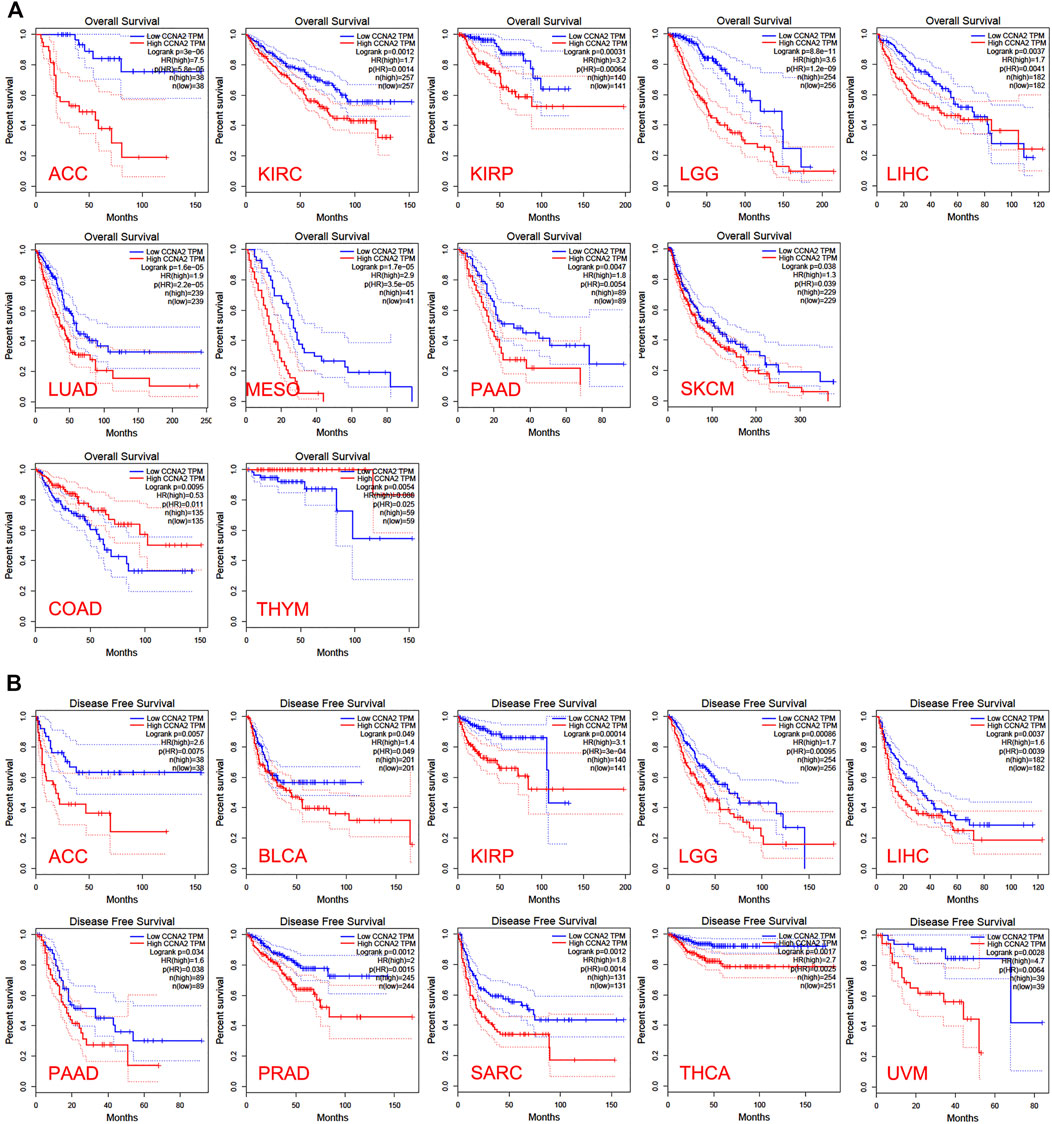
FIGURE 2. Overall survival analysis (A) and disease-free survival analysis (B) based on the CCNA2 expression in various cancers.
Predictive Analysis of Upstream miRNA of CCNA2
We further analyzed the predictive ceRNA network in cancer types with enough adjacent normal tissues of TCGA project. We chose the cancer types in which high CCNA2 expression is associated with poor OS by the Kaplan–Meier survival curve and log-rank test simultaneously (Table 1). The starBase database was used for predicting upstream miRNAs of CCNA2, and these 52 CCNA2-bound miRNAs have been supported by the CLIP-Seq experiment (Table 2). MicroRNA-27b-3p expression is significantly negatively correlated with CCNA2 in KIRC (R = −0.26, p < 0.001, Figure 4A), and it is lower in KIRC tissues than in normal tissues (p < 0.001, Figure 4B). KIRC patients with decreased miR-27b-3p expression have a poor prognosis (p < 0.001, Figure 4C). The expression of miR-22-3p (R = -0.49), miR-29c-3p (R = −0.42), miR-29a-3p (R = −0.29), miR-29b-3p (R = −0.29) and miR-204-5p (R = −0.20) is negatively correlated with CCNA2 in LIHC (all p values < 0.001, Figure 4D), and their expression is lower in LIHC tissues than in normal tissues (miR-29b-3p P = 0.011, other p values < 0.001, Figure 4E). LIHC patients with decreased expression levels of miR-22-3p (p < 0.001), miR-29b-3p (p = 0.044), miR-29c-3p (p < 0.001), miR-204-5p (p = 0.013) are correlated with poor prognosis (Figure 4F). However, miR-29a-3p shows the opposite tendency. In LUAD, there are ten miRNAs significantly negatively correlated with CCNA2 (all p values < 0.001, miR-204-5p and miR-218-5p are shown in Figure 4G, other miRNAs are shown in Supplementary Figure S1). However, only the expressions of miR-204-5p and miR-218-5p are lower in LUAD tissues than in normal tissues (p < 0.001, Figure 4H). LUAD patients with decreased expression levels of miR-204-5p (p = 0.009) and miR-218-5p (p = 0.015) are correlated with poor OS prognosis (Figure 4I).

TABLE 2. Predicting upstream miRNAs of CCNA2, and these miRNAs have been supported by the CLIP-Seq experiment.
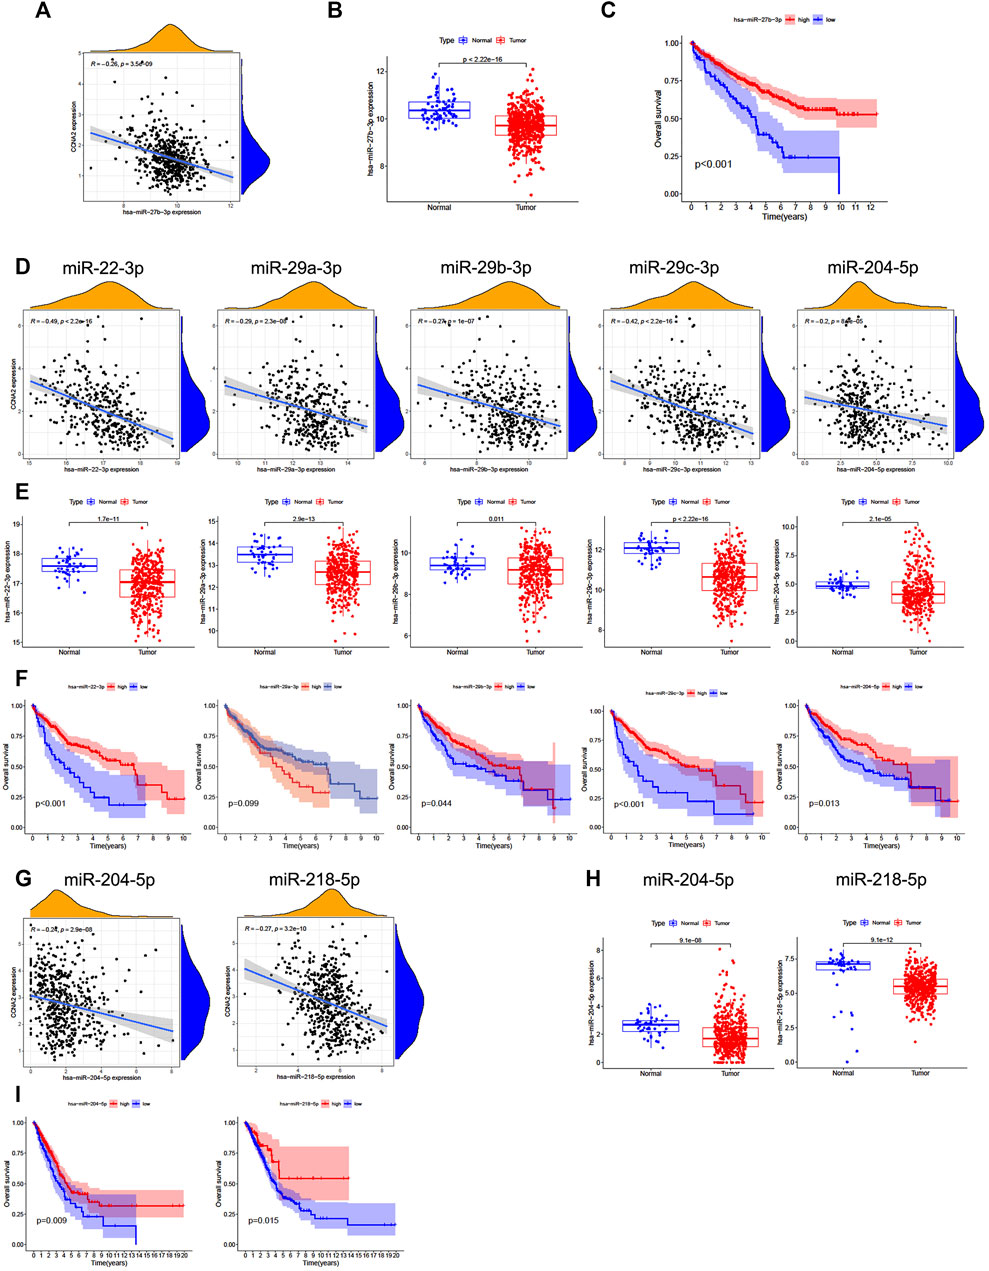
FIGURE 4. Predictive analysis of upstream miRNA of CCNA2. MicroRNA expression was shown as log2 (miRNA+1). (A) The negative correlation between miR-27b-3p and CCNA2 in KIRC. (B) The expression of miR-27b-3p in KIRC and normal tissues (num (T) = 545; num (N) = 71). (C) Overall survival analysis based on the miR-27b-3p expression in KIRC. (D) The negative correlation between miRNAs (miR-22-3p, miR-29c-3p, miR-29a-3p, miR-29b-3p, and miR-204-5p) and CCNA2 in LIHC. (E) The expression of miRNAs (miR-22-3p, miR-29c-3p, miR-29a-3p, miR-29b-3p, and miR-204-5p) in LIHC and normal tissues (num (T) = 375; num (N) = 50). (F) Overall survival analysis based on expression of miRNAs (miR-22-3p, miR-29c-3p, miR-29a-3p, miR-29b-3p, and miR-204-5p) in LIHC. (G) The negative correlation between miRNAs (miR-204-5p and miR-218-5p) and CCNA2 in LUAD. (H) The expression of miRNAs (miR-204-5p and miR-218-5p) in LUAD and normal tissues (num (T) = 521; num (N) = 46). (I) Overall survival analysis based on the expression of miRNAs (miR-204-5p and miR-218-5p) in LUAD.
Predictive Analysis of Upstream lncRNAs of CCNA2-Bound miRNAs
The starBase database was used to predict upstream lncRNAs for the above-mentioned miRNAs with expression and survival significance in KIRC, LIHC, and LUAD. According to the ceRNA mechanism, lncRNAs should be positively correlated with CCNA2 mRNA and negatively correlated with miRNAs, and the expression of lncRNAs should be higher than in normal tissues. In KIRC, LINC00997 is significantly negatively correlated with miR-27b-3p (R = −0.24, p < 0.001), and it is positively correlated with CCNA2 (R = 0.26, p < 0.001, Figure 5A). The expression of LINC00997 is higher in KIRC tissues than in normal tissues (p < 0.001, Figure 5B). In addition, KIRC patients with elevated LINC00997 expression levels show poor prognosis (p < 0.001, Figure 5C). In LIHC, SNHG16 (R = -0.40), GUSBP11 (R = −0.37), FGD5-AS1 (R = −0.32), TTC28-AS1 (R = −0.29), LINC00630 (R = −0.28), CD27-AS1 (R = −0.25), LINC02381 (R = -0.24), H19 (R = −0.22) and LINC00997 (R = −0.22) are significantly negatively correlated with miR-22-3p (all p values < 0.001, Table 3), while only 7 lncRNAs of them are higher in LIHC tissues compared to normal tissues (all p values < 0.001, Table 3). The expression of SNHG16 (R = 0.30), GUSBP11 (R = 0.31), FGD5-AS1 (R = 0.43), TLINC00630 (R = 0.43), CD27-AS1 (R = 0.28) and LINC00997 (R = 0.22) is positively correlated with CCNA2 in LIHC (all p values < 0.001, Table 4). Besides, TTC28-AS1 and CCNA2 in LIHC nearly reach a positive correlation (R = 0.196, Table 4). Furthermore, increased expression of SNHG16 (p = 0.006), GUSBP11 (p = 0.002), FGD5-AS1 (p = 0.016), TLINC00630 (p = 0.04) and TTC28-AS1 (p = 0.028) is significantly related to poor OS in LIHC, and CD27-AS1 (p = 0.061) and LINC00997 (p = 0.076) nearly reach significance in OS (Figure 5D). There is no lncRNA negatively correlated with other CCNA2-bound miRNAs (miR-29b-3p, miR-29c-3p, and miR-204-5p) in LIHC. Similar results were found in LUAD (miR-218-5p and miR-204-5p). Taken together, we summarized LINC00997/miR-27b-3p/CCNA2 ceRNA network in KIRC; SNHG16, GUSBP11, FGD5-AS1, LINC00630, CD27-AS1 and LINC00997/miR-22-3p/CCNA2 ceRNA network, miR-29b-3p/CCNA2, miR-29c-3p/CCNA2, and miR-204-5p/CCNA2 networks in LIHC; and miR-218-5p/CCNA2 and miR-204-5p/CCNA2 networks in LUAD (Figure 5E).
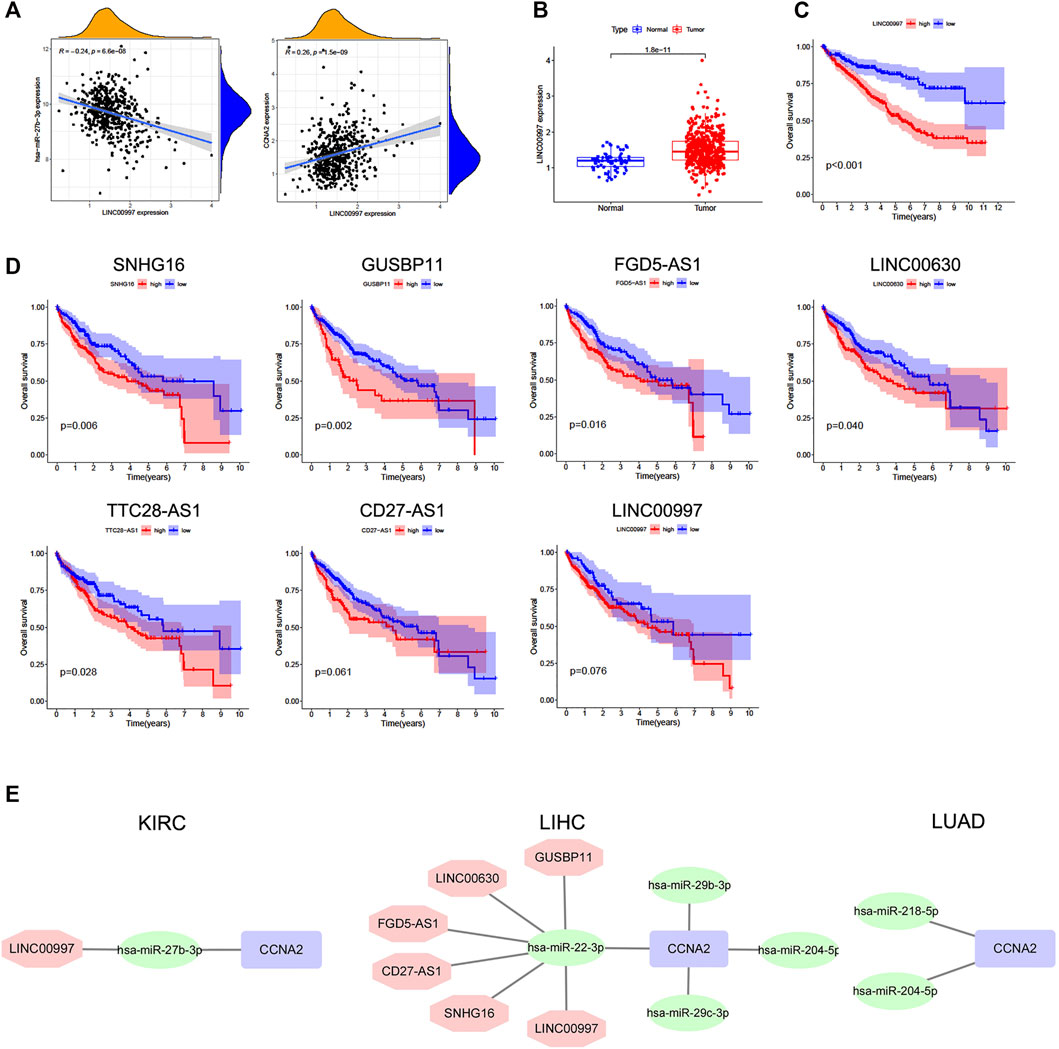
FIGURE 5. Predictive analysis of upstream lncRNAs of CCNA2-bound miRNAs. The lncRNA expression was shown as log2 (miRNA+1). (A) Correlation of LINC00997 expression with miR-27b-3p (left) and CCNA2 (right) in KIRC, num = 545. (B) The expression of LINC00997 in KIRC and normal tissues, (num (T) = 545; num (N) = 71). (C) Overall survival analysis based on the LINC00997 expression in KIRC, num = 545. (D) Overall survival analysis based on miR-22-3p-bound lncRNAs (SNHG16, GUSBP11, FGD5-AS1, TLINC00630, TTC28-AS1, CD27-AS1, and LINC00997) expression in LIHC, num = 375. (E) Predictive upstream regulatory networks of CCNA2 in KIRC, LIHC, and LUAD.
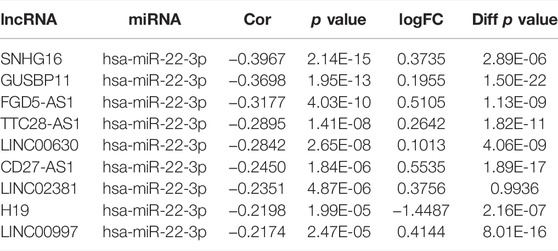
TABLE 3. lncRNAs are significantly negatively correlated with miR-22-3p in LIHC and their expression in LIHC and control tissues.
Immune Infiltration Analysis
We employed TIMER2.0 to show the landscape of CCNA2 correlating with various immune infiltrates in different cancer types (Figure 6A). Overall, the correlation of the CCNA2 expression with immune infiltration level in diverse cancer types is different. However, there is a significant positive correlation between CCNA2 and Th2 cells and significant negative correlations between CCNA2 and CD4+ central memory and effector memory T cells by the xCell estimation algorithm in almost all cancer types. In KIRC, the timer estimation algorithm shows that CCNA2 is positively correlated with immune infiltrating levels of CD4+T cells, CD8+T cells, myeloid dendritic cells, macrophages, and neutrophils (Figure 6B). In LIHC, CCNA2 is positively correlated with immune infiltrating levels of B cells, CD4+T cells, CD8+T cells, myeloid dendritic cells, macrophages, and neutrophils (Figure 6C). In LUAD, CCNA2 is positively correlated with CD8+T cells, macrophages, and neutrophils and negatively correlated with B cells and CD4+T cells (Figure 6D).
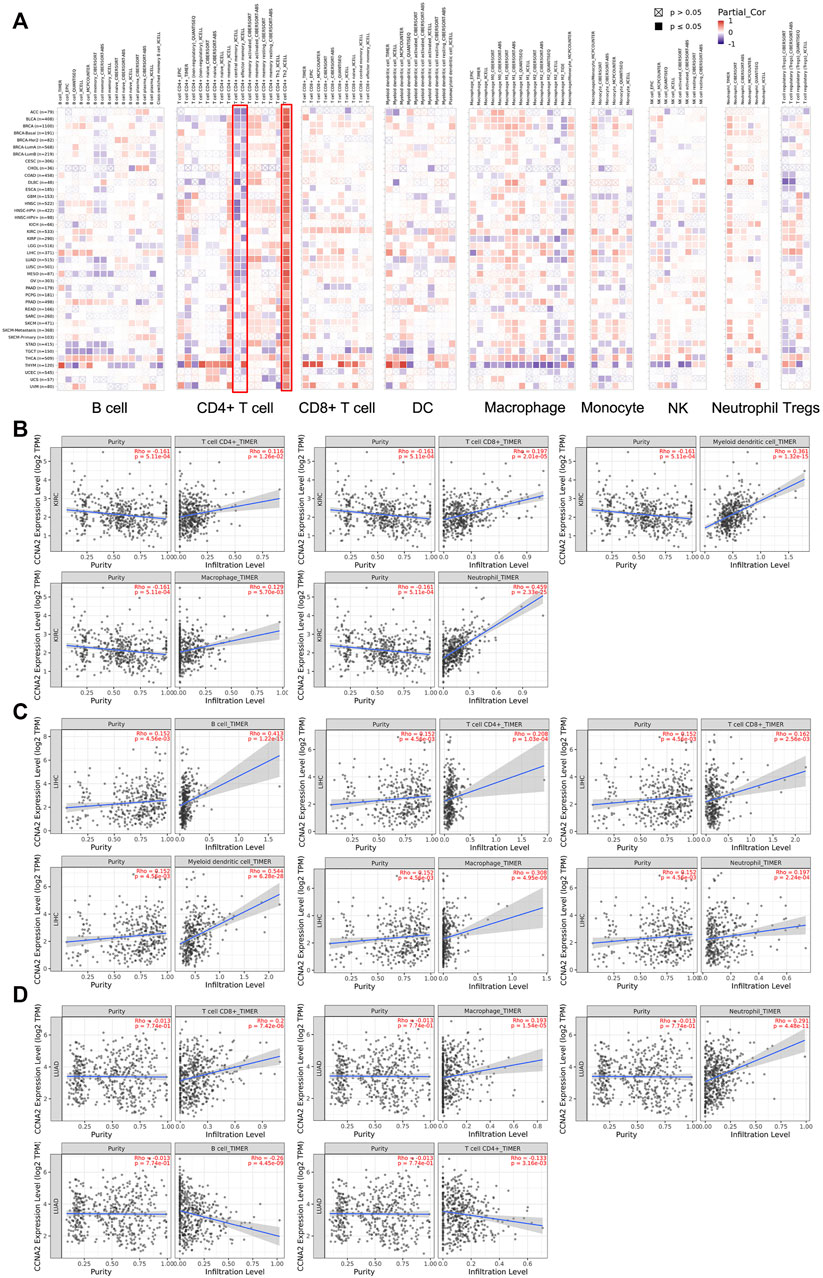
FIGURE 6. (A) Potential correlation between the CCNA2 expression and immune cell infiltration in all TCGA cancer types. (B–D) The scatter plots of related cancers generated by the TIMER algorithm, indicating association between immune infiltrates and CCNA2 expression in KIRC (B), LIHC (C) and LUAD (D).
Correlation Between CCNA2 and Immune Cell Biomarkers
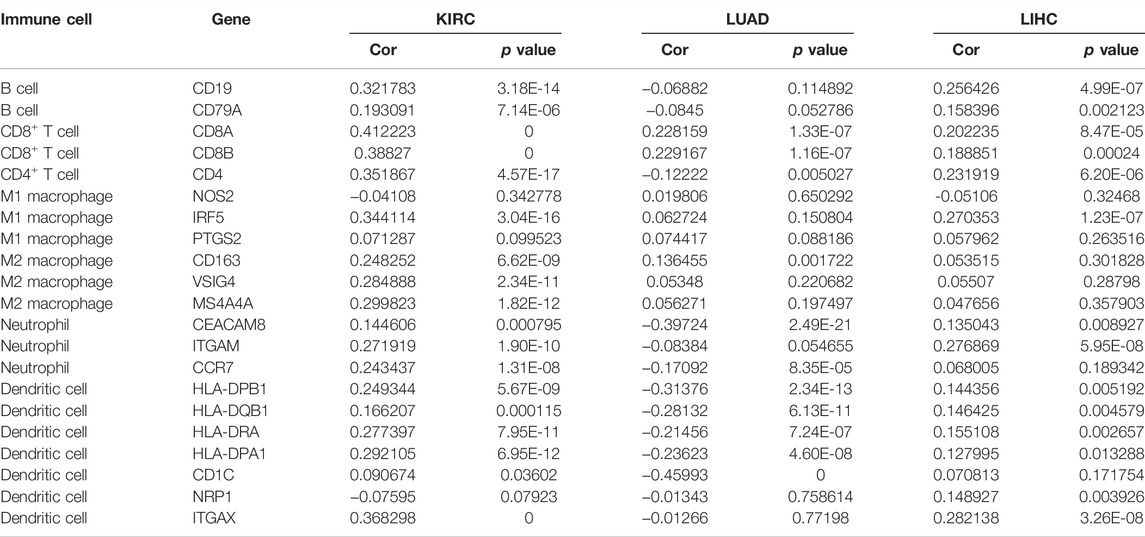
As is shown in Table 5, CCNA2 is positively correlated with the biomarker expressions of B cells, CD4+T cells, CD8+T cells, dendritic cells, M2 macrophages, and neutrophils in KIRC. In LIHC, CCNA2 is positively correlated with the biomarker expressions of B cells, CD4+T cells, CD8+T cells, dendritic cells, and neutrophils. In LUAD, CCNA2 is positively correlated with the biomarker expressions of CD8+T cells and negatively correlated with parts of the biomarker expressions of dendritic cells and neutrophils.
Correlations Between CCNA2 and Immune Checkpoints
Using the TIMER2.0 web tool, we further explored the correlations between CCNA2 and expressions of immune checkpoints (CD274, CTLA4, HAVCR2, LAG3, PDCD1, and TIGIT). Overall, CCNA2 is generally positively correlated with expressions of these immune checkpoints in most cancer types. In BLCA, BRCA, HNSC, KIRC, LIHC, LUAD, OV, SKCM, STAD, and THCA, it shows positive correlations between CCNA2 and all of the six immune checkpoints (all p values < 0.05, Figure 7A). However, CCNA2 is also negatively correlated with the immune checkpoints in a few cancer types. We observe a negative relationship with CTLA4, HAVCR2, LAG3, and TIGIT in THYM, CTLA4 and PDCD1 in TCGT, CTLA4 in GBM, HAVCR2 in KIRP, and PDCD1 in UCS (all p values < 0.05, Figure 7A). We further showed the significant positive correlations between CCNA2 and immune checkpoints in KIRC, LIHC, and LUAD (Figures 7B–D).
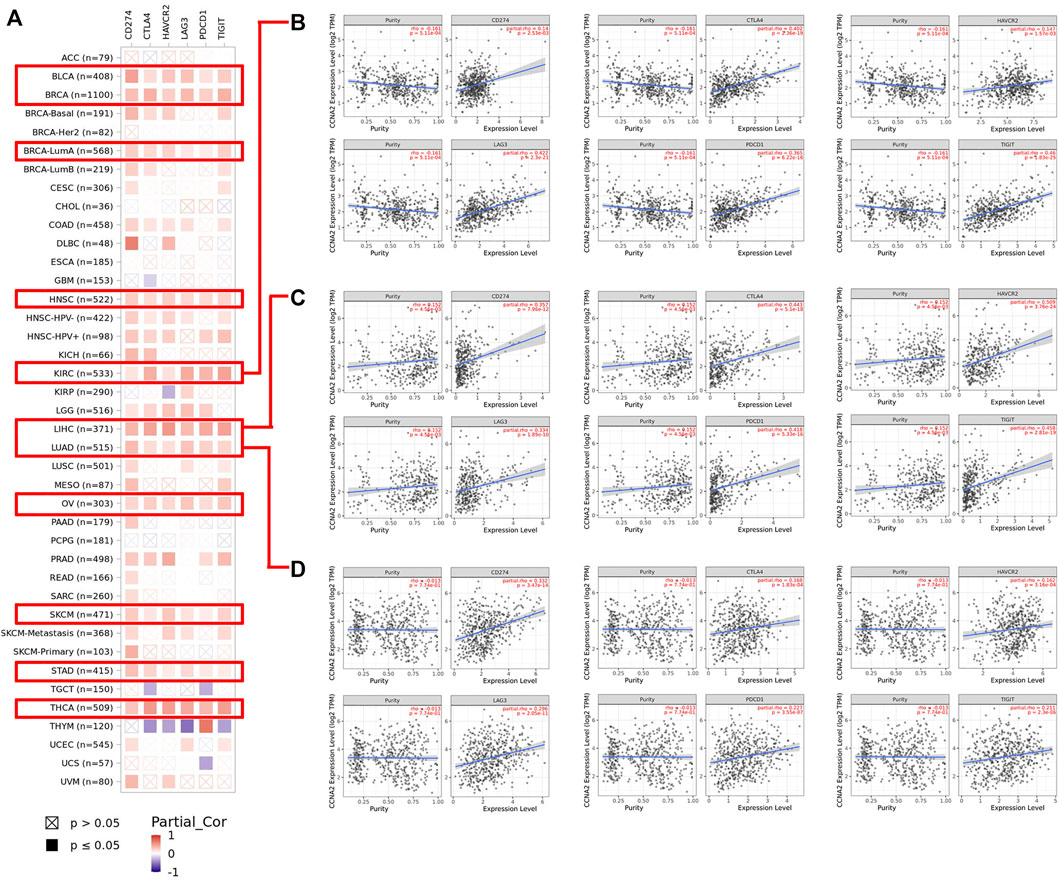
FIGURE 7. (A) Potential correlation between CCNA2 expression and immune checkpoints (CD274, CTLA4, HAVCR2, LAG3, PDCD1, and TIGIT) in all TCGA cancer types. (B–D) The scatter plots of related cancers generated by the TIMER algorithm, indicating correlation between immune checkpoints (CD274, CTLA4, HAVCR2, LAG3, PDCD1 and TIGIT) and CCNA2 expression in KIRC (B), LIHC (C) and LUAD (D).
Discussion
Accumulating evidence has documented CCNA2 is an important differentially expressed gene (DEG, mainly overexpressed) in various cancer types compared to normal tissues, such as LIHC (Li et al., 2021a), human epidermal growth factor 2 (HER2)+ breast cancer (Weng et al., 2021), LUSC (Gao et al., 2020), COAD (Li et al., 2021b), PRAD (Feng et al., 2021), HNSC (Zhang et al., 2020), KIRC (Zhan et al., 2021), THCA (Li et al., 2020b), medulloblastoma (Guo et al., 2020a), gastric cancer (Ji et al., 2021; Lu et al., 2021), and mantle cell lymphoma (Guo et al., 2020b). These bioinformatic results are credible because they are not only from the TCGA dataset (Li et al., 2020a; Gao et al., 2020; Zhang et al., 2020; Li et al., 2021a; Li et al., 2021b; Feng et al., 2021; Ji et al., 2021; Weng et al., 2021) but also from Gene Expression Omnibus (GEO) datasets or series (Guo et al., 2020a; Li et al., 2020a; Guo et al., 2020b; Li et al., 2020b; Gao et al., 2020; Li et al., 2021a; Li et al., 2021b; Lu et al., 2021; Weng et al., 2021; Zhan et al., 2021). However, it is unable to retrieve any available reports about a pan-cancer analysis of the CCNA2 expression across all cancer types. The results of our analysis corroborate that CCNA2 is overexpressed in all 18 cancer types with enough normal tissues from the TCGA project. When we added normal tissues from the GTEx program to other tumor types, they are still overexpressed in most cancer types. CCNA2 expression is only decreased in LAML. However, we found the K562 cell line was used as matched normal data from the GTEx database to be compared with acute myeloid leukemia (AML) cells in the TCGA database. K562 cells are from a chronic myeloid leukemia patient in a blast crisis, and they are not able to properly represent AML. Normal immature hematopoietic cells in the bone marrow (myeloblast, promyeloytes etc.) from healthy donors are a better choice. This finding suggests that the application of control tissues from GTEx has limitations. CCNA2 may not be downregulated in LAML when we choose suitable controls. Taken together, we verified that the upregulation of CCNA was widespread in most cancer types.
Furthermore, CCNA2 is thought to be a core gene in many cancer types. After getting DEGs in tumor tissues compared with normal tissues, network-based analyses (such as protein–protein interaction networks of the DEGs) verified that CCNA2 is a hub gene in LIHC (Li et al., 2021a), LUAD (Zeng et al., 2020), LUSC (Gao et al., 2020), STAD (Ji et al., 2021), PRAD (Feng et al., 2021), HNSC (Zhang et al., 2020), THCA (Li et al., 2020b), medulloblastoma (Guo et al., 2020a), mantle cell lymphoma (Guo et al., 2020b), and colorectal cancer (Wang et al., 2020). CCNA2 interacts with many other differentially expressed proteins, indicating its essential role in many cancers. In addition, we also provided substantial evidence in support of the prognostic values of CCNA2, and some of these findings were consistent with other studies. High expression of CCNA2 was connected with the poor OS in LIHC (Li et al., 2021a) and PRAD (Feng et al., 2021). CCNA2 expression was an essential component of the prognostic model in LUAD (Zhou et al., 2020), LUSC (Gao et al., 2020) and KIRC (Zhan et al., 2021).
Due to its important role in cancer, CCNA2 has become a therapeutic target for many cancer types. Chen et al. reported Roundabout homolog 1 inhibited pancreatic cancer via the YY1-ROBO1-CCNA2-CDK2 axis (Chen et al., 2021). The combination of metformin and pemetrexed exhibited an antiproliferative effect by affecting the cell cycle in non-small-cell lung cancer via downregulation of CCNA2 and CCND1, and the upregulation of CDKN1B (Wang et al., 2021b). Interestingly, CCNA2 deletion in oncogene-transformed mouse embryonic fibroblasts suppressed liver tumor formation, indicating its important role in tumorigenesis (Gopinathan et al., 2014). Although CCNA2 is related to poor prognosis and tumor-promoting function in most tumor types, COAD is an exception. The CCNA2 expression is upregulated in COAD tissues, but its high expression is related to better OS. Guo et al. (Guo et al., 2021) reported that CCNA2 deficiency in colonic epithelial cells led to epithelial changes in the mucosa, inducing inflammation and increasing cell proliferation and dysplasia in the colon. These changes make them more susceptible to chemically induced colon carcinogenesis in the mice. Meanwhile, they also verified that the higher expression of CCNA2 existed in pathological stage 1 or 2 colorectal cancer than in stage 3 or 4.
In this study, we first presented evidence of the potential ceRNA network based on CCNA2 in tumors. There was no report about the function of miR-27b-3p in KIRC. Through expression analysis, survival analysis, and correlation analysis, we found the miR-27b-3p/CCNA2 axis in KIRC. Furthermore, LINC00997 might be the regulatory lncRNA of the miR-27b-3p/CCNA2 axis in KIRC. MicroRNA-22-3p played a role in reducing tumor progression in LIHC. A study confirmed that the miR-22-3p overexpression could impair cell mobility and invasiveness in LIHC (Zhang et al., 2018b). In addition, catalpol had antitumor effects by upregulating miR-22-3p expression and targeting the metastasis associated with 1 family member 3 in LIHC (Zhao et al., 2019). Consistent with these studies, we found high expression of miR-22-3p was correlated with better OS in LIHC. CCNA2 should be one target of miR-22-3p, and SNHG16, GUSBP11, FGD5-AS1, LINC00630, CD27-AS1, and LINC00997 might be the regulatory lncRNAs of the miR-22-3p/CCNA2 axis. Among the miR-22-3p-bound lncRNAs, SNHG16 was verified as a miRNA sponge (ceRNA) and promoted LIHC metastasis and EMT progression in several studies (Li et al., 2020c; Hu et al., 2020) (not through CCNA2), and there was no report about other lncRNAs in LIHC.
We found CCNA2 played a significant but contradictory role in immune infiltration in different cancer types. For example, CCNA2 showed a significant positive correlation between CCNA2 and B cells in LIHC but a significant negative correlation in TGCT. Importantly, our work showed that there was a significant positive correlation between CCNA2 and Th2 cells by the xCell estimation algorithm. Th2 cells were thought to be associated with aggressive tumors through the production of the immunosuppressive cytokine IL-10 or through the activation of B cells. However, TH2 cells were also associated with favorable prognosis in follicular lymphoma, Hodgkin’s lymphoma, and breast cancer, which suggested a protective effect (Fridman et al., 2012). Besides, as there was a close correlation between immune checkpoints and immunotherapy, we analyzed the relationship between CCNA2 and immune checkpoints. CCNA2 was positively correlated with expressions of CD274, CTLA4, HAVCR2, LAG3, PDCD1, and TIGIT in most cancer types, which indicated the CCNA2 expression may act as a marker after immunotherapy.
Taken together, our first pan-cancer analysis of CCNA2 indicated its overexpression is widespread in different cancer types. In addition, high expression of CCNA2 is related to poor prognosis and advanced pathological stages in most cases. Through expression analysis, survival analysis, and correlation analysis, we built the upstream regulatory networks of CCNA2 in different cancer types (LINC00997/miR-27b-3p/CCNA2 ceRNA network in KIRC; SNHG16, GUSBP11, FGD5-AS1, LINC00630, CD27-AS1, and LINC00997/miR-22-3p/CCNA2 ceRNA network, miR-29b-3p/CCNA2, miR-29c-3p/CCNA2, and miR-204-5p/CCNA2 networks in LIHC; and miR-218-5p/CCNA2 and miR-204-5p/CCNA2 networks in LUAD). The CCNA2 expression is positively correlated with Th2 cell infiltration and negatively correlated with CD4+ central memory and effector memory T-cell infiltration. Furthermore, CCNA2 is positively associated with expressions of immune checkpoints in most cancer types. Our work of CCNA2 pan-analysis contributes to understanding the prognostic and immunological roles and potential upstream molecular mechanisms of CCNA2 in different cancers.
Data Availability Statement
The datasets presented in this study can be found in online repositories. The names of the repository/repositories and accession number(s) can be found in the article/Supplementary Material.
Author Contributions
SC, ZZ, QZ and LL performed the data analysis and interpreted the data. BT and XW prepared the draft. BT and SC performed the visualization and revised the draft. BT designed the research and supervised all the work. All authors contributed to the article and approved the submitted version.
Funding
The study was supported by National Natural Science Foundation of China (81800203) and Doctoral Scientific Research Foundation of Liaoning Province (20180540088).
Conflict of Interest
The authors declare that the research was conducted in the absence of any commercial or financial relationships that could be construed as a potential conflict of interest.
Publisher’s Note
All claims expressed in this article are solely those of the authors and do not necessarily represent those of their affiliated organizations, or those of the publisher, the editors, and the reviewers. Any product that may be evaluated in this article, or any claim that may be made by its manufacturer, is not guaranteed or endorsed by the publisher.
Supplementary Material
The Supplementary Material for this article can be found online at: https://www.frontiersin.org/articles/10.3389/fmolb.2022.809509/full#supplementary-material
References
Anderson, A. C., Joller, N., and Kuchroo, V. K. (2016). Lag-3, Tim-3, and TIGIT: Co-inhibitory Receptors with Specialized Functions in Immune Regulation. Immunity 44 (5), 989–1004. doi:10.1016/j.immuni.2016.05.001
Baumann, K. (2016). Genome Stability: Cyclin' on mRNA. Nat. Rev. Mol. Cel Biol 17 (11), 676–677. doi:10.1038/nrm.2016.142
Bendris, N., Loukil, A., Cheung, C., Arsic, N., Rebouissou, C., Hipskind, R., et al. (2012). Cyclin A2: a Genuine Cell Cycle Regulator? Biomol. Concepts 3 (6), 535–543. doi:10.1515/bmc-2012-0027
Chen, Q., Shen, P., Ge, W.-L., Yang, T.-Y., Wang, W.-J., Meng, L.-D., et al. (2021). Roundabout Homolog 1 Inhibits Proliferation via the YY1-ROBO1-CCNA2-CDK2 axis in Human Pancreatic Cancer. Oncogene 40 (15), 2772–2784. doi:10.1038/s41388-021-01741-5
Dong, S., Huang, F., Zhang, H., and Chen, Q. (2019). Overexpression of BUB1B, CCNA2, CDC20, and CDK1 in Tumor Tissues Predicts Poor Survival in Pancreatic Ductal Adenocarcinoma. Biosci. Rep. 39 (2). doi:10.1042/BSR20182306
Du, L.-j., Mao, L.-j., and Jing, R.-j. (2020). Long Noncoding RNA DNAH17-AS1 Promotes Tumorigenesis and Metastasis of Non-small Cell Lung Cancer via Regulating miR-877-5p/CCNA2 Pathway. Biochem. biophysical Res. Commun. 533 (3), 565–572. doi:10.1016/j.bbrc.2020.09.047
Elinav, E., Nowarski, R., Thaiss, C. A., Hu, B., Jin, C., and Flavell, R. A. (2013). Inflammation-induced Cancer: Crosstalk between Tumours, Immune Cells and Microorganisms. Nat. Rev. Cancer 13 (11), 759–771. doi:10.1038/nrc3611
Feng, T., Wei, D., Li, Q., Yang, X., Han, Y., Luo, Y., et al. (2021). Four Novel Prognostic Genes Related to Prostate Cancer Identified Using Co-expression Structure Network Analysis. Front. Genet. 12, 584164. doi:10.3389/fgene.2021.584164
Fridman, W. H., Pagès, F., Sautès-Fridman, C., and Galon, J. (2012). The Immune Contexture in Human Tumours: Impact on Clinical Outcome. Nat. Rev. Cancer 12 (4), 298–306. doi:10.1038/nrc3245
Gao, M., Kong, W., Huang, Z., and Xie, Z. (2020). Identification of Key Genes Related to Lung Squamous Cell Carcinoma Using Bioinformatics Analysis. Int. J. Mol. Sci. 21 (8), 2994. doi:10.3390/ijms21082994
Goldman, M. J., Craft, B., Hastie, M., Repečka, K., McDade, F., Kamath, A., et al. (2020). Visualizing and Interpreting Cancer Genomics Data via the Xena Platform. Nat. Biotechnol. 38 (6), 675–678. doi:10.1038/s41587-020-0546-8
Gopinathan, L., Tan, S. L. W., Padmakumar, V. C., Coppola, V., Tessarollo, L., and Kaldis, P. (2014). Loss of Cdk2 and Cyclin A2 Impairs Cell Proliferation and Tumorigenesis. Cancer Res. 74 (14), 3870–3879. doi:10.1158/0008-5472.can-13-3440
Guo, D., Wang, H., Sun, L., Liu, S., Du, S., Qiao, W., et al. (2020). Identification of Key Gene Modules and Hub Genes of Human Mantle Cell Lymphoma by Coexpression Network Analysis. PeerJ 8, e8843. doi:10.7717/peerj.8843
Guo, Y., Gabola, M., Lattanzio, R., Paul, C., Pinet, V., Tang, R., et al. (2021). Cyclin A2 Maintains colon Homeostasis and Is a Prognostic Factor in Colorectal Cancer. J. Clin. Invest. 131 (4), e131517. doi:10.1172/jci131517
Guo, Y., Huang, P., Ning, W., Zhang, H., and Yu, C. (2020). Identification of Core Genes and Pathways in Medulloblastoma by Integrated Bioinformatics Analysis. J. Mol. Neurosci. 70 (11), 1702–1712. doi:10.1007/s12031-020-01556-1
Hu, Y. L., Feng, Y., Chen, Y. Y., Liu, J. Z., Su, Y., Li, P., et al. (2020). SNHG16/miR‐605‐3p/TRAF6/NF‐κB Feedback Loop Regulates Hepatocellular Carcinoma Metastasis. J. Cel Mol Med 24 (13), 7637–7651. doi:10.1111/jcmm.15399
Ji, Y., Gao, L., Zhang, C., Sun, X., Dai, L., Ji, Z., et al. (2021). Identification of the Hub Genes and Prognostic Indicators of Gastric Cancer and Correlation of Indicators with Tumor-Infiltrating Immune Cell Levels. J. Cancer 12 (13), 4025–4038. doi:10.7150/jca.52105
Karreth, F. A., and Pandolfi, P. P. (2013). ceRNA Cross-Talk in Cancer: when Ce-Bling Rivalries Go Awry. Cancer Discov. 3 (10), 1113–1121. doi:10.1158/2159-8290.cd-13-0202
Ko, E., Kim, Y., Cho, E. Y., Han, J., Shim, Y. M., Park, J., et al. (2013). Synergistic Effect of Bcl-2 and Cyclin A2 on Adverse Recurrence-free Survival in Stage I Non-small Cell Lung Cancer. Ann. Surg. Oncol. 20 (3), 1005–1012. doi:10.1245/s10434-012-2727-2
Li, J. H., Liu, S., Zhou, H., Qu, L. H., and Yang, J. H. (2014). starBase v2.0: Decoding miRNA-ceRNA, miRNA-ncRNA and Protein-RNA Interaction Networks from Large-Scale CLIP-Seq Data. Nucleic Acids Res. 42 (Database issue), D92–D97. doi:10.1093/nar/gkt1248
Li, J., Zhou, L., Liu, Y., Yang, L., Jiang, D., Li, K., et al. (2021). Comprehensive Analysis of Cyclin Family Gene Expression in Colon Cancer. Front. Oncol. 11, 674394. doi:10.3389/fonc.2021.674394
Li, L., Zhu, M., Huang, H., Wu, J., and Meng, D. (2020). Identification of Hub Genes in Anaplastic Thyroid Carcinoma: Evidence from Bioinformatics Analysis. Technol. Cancer Res. Treat. 19, 1533033820962135. doi:10.1177/1533033820962135
Li, S., Peng, F., Ning, Y., Jiang, P., Peng, J., Ding, X., et al. (2020). SNHG16 as the miRNA Let‐7b‐5p Sponge Facilitates the G2/M and Epithelial‐mesenchymal Transition by Regulating CDC25B and HMGA2 Expression in Hepatocellular Carcinoma. J. Cel Biochem 121 (3), 2543–2558. doi:10.1002/jcb.29477
Li, T., Fan, J., Wang, B., Traugh, N., Chen, Q., Liu, J. S., et al. (2017). TIMER: A Web Server for Comprehensive Analysis of Tumor-Infiltrating Immune Cells. Cancer Res. 77 (21), e108–e110. doi:10.1158/0008-5472.can-17-0307
Li, T., Fu, J., Zeng, Z., Cohen, D., Li, J., Chen, Q., et al. (2020). TIMER2.0 for Analysis of Tumor-Infiltrating Immune Cells. Nucleic Acids Res. 48 (W1), W509–W514. doi:10.1093/nar/gkaa407
Li, Z., Lin, Y., Cheng, B., Zhang, Q., and Cai, Y. (2021). Identification and Analysis of Potential Key Genes Associated with Hepatocellular Carcinoma Based on Integrated Bioinformatics Methods. Front. Genet. 12, 571231. doi:10.3389/fgene.2021.571231
Lu, X.-Q., Zhang, J.-Q., Zhang, S.-X., Qiao, J., Qiu, M.-T., Liu, X.-R., et al. (2021). Identification of Novel Hub Genes Associated with Gastric Cancer Using Integrated Bioinformatics Analysis. BMC Cancer 21 (1), 697. doi:10.1186/s12885-021-08358-7
Peng, X., Pan, K., Zhao, W., Zhang, J., Yuan, S., Wen, X., et al. (2018). NPTX1 Inhibits colon Cancer Cell Proliferation through Down-Regulating Cyclin A2 and CDK2 Expression. Cell Biol Int 42 (5), 589–597. doi:10.1002/cbin.10935
Qiao, K., Ning, S., Wan, L., Wu, H., Wang, Q., Zhang, X., et al. (2019). LINC00673 Is Activated by YY1 and Promotes the Proliferation of Breast Cancer Cells via the miR-515-5p/MARK4/Hippo Signaling Pathway. J. Exp. Clin. Cancer Res. 38 (1), 418. doi:10.1186/s13046-019-1421-7
Salmena, L., Poliseno, L., Tay, Y., Kats, L., and Pandolfi, P. P. (2011). A ceRNA Hypothesis: the Rosetta Stone of a Hidden RNA Language? Cell 146 (3), 353–358. doi:10.1016/j.cell.2011.07.014
Sasidharan Nair, V., and Elkord, E. (2018). Immune Checkpoint Inhibitors in Cancer Therapy: a Focus on T-Regulatory Cells. Immunol. Cel Biol 96 (1), 21–33. doi:10.1111/imcb.1003
Solomon, B. L., and Garrido-Laguna, I. (2018). TIGIT: a Novel Immunotherapy Target Moving from Bench to Bedside. Cancer Immunol. Immunother. 67 (11), 1659–1667. doi:10.1007/s00262-018-2246-5
Tang, B., Xu, A., Xu, J., Huang, H., Chen, L., Su, Y., et al. (2018). MicroRNA-324-5p Regulates Stemness, Pathogenesis and Sensitivity to Bortezomib in Multiple Myeloma Cells by Targeting Hedgehog Signaling. Int. J. Cancer 142 (1), 109–120. doi:10.1002/ijc.31041
Tang, Z., Li, C., Kang, B., Gao, G., Li, C., and Zhang, Z. (2017). GEPIA: a Web Server for Cancer and normal Gene Expression Profiling and Interactive Analyses. Nucleic Acids Res. 45 (W1), W98–W102. doi:10.1093/nar/gkx247
Tsai, H.-F., and Hsu, P.-N. (2017). Cancer Immunotherapy by Targeting Immune Checkpoints: Mechanism of T Cell Dysfunction in Cancer Immunity and New Therapeutic Targets. J. Biomed. Sci. 24 (1), 35. doi:10.1186/s12929-017-0341-0
Wang, H., Huo, X., Yang, X.-R., He, J., Cheng, L., Wang, N., et al. (2017). STAT3-mediated Upregulation of lncRNA HOXD-AS1 as a ceRNA Facilitates Liver Cancer Metastasis by Regulating SOX4. Mol. Cancer 16 (1), 136. doi:10.1186/s12943-017-0680-1
Wang, H., Liu, Z., Wu, P., Wang, H., and Ren, W. (2021). NUSAP1 Accelerates Osteosarcoma Cell Proliferation and Cell Cycle Progression via Upregulating CDC20 and Cyclin A2. Ott 14, 3443–3454. doi:10.2147/ott.s295818
Wang, J.-L., Lan, Y.-W., Tsai, Y.-T., Chen, Y.-C., Staniczek, T., Tsou, Y.-A., et al. (2021). Additive Antiproliferative and Antiangiogenic Effects of Metformin and Pemetrexed in a Non-small-cell Lung Cancer Xenograft Model. Front. Cel Dev. Biol. 9, 688062. doi:10.3389/fcell.2021.688062
Wang, Z., Guo, M., Ai, X., Cheng, J., Huang, Z., Li, X., et al. (2020). Identification of Potential Diagnostic and Prognostic Biomarkers for Colorectal Cancer Based on GEO and TCGA Databases. Front. Genet. 11, 602922. doi:10.3389/fgene.2020.602922
Weng, Y., Liang, W., Ji, Y., Li, Z., Jia, R., Liang, Y., et al. (2021). Key Genes and Prognostic Analysis in HER2+ Breast Cancer. Technol. Cancer Res. Treat. 20, 1533033820983298. doi:10.1177/1533033820983298
Xiong, X., Xu, W., Gong, J., Wang, L., Dai, M., Chen, G., et al. (2021). miR-937-5p Targets SOX17 to Modulate Breast Cancer Cell Cycle and Cell Proliferation through the Wnt Signaling Pathway. Cell Signal. 77, 109818. doi:10.1016/j.cellsig.2020.109818
Xu, J., Li, Y., Lu, J., Pan, T., Ding, N., Wang, Z., et al. (2015). The mRNA Related ceRNA-ceRNA Landscape and Significance across 20 Major Cancer Types. Nucleic Acids Res. 43 (17), 8169–8182. doi:10.1093/nar/gkv853
Yang, X.-Z., Cheng, T.-T., He, Q.-J., Lei, Z.-Y., Chi, J., Tang, Z., et al. (2018). LINC01133 as ceRNA Inhibits Gastric Cancer Progression by Sponging miR-106a-3p to Regulate APC Expression and the Wnt/β-Catenin Pathway. Mol. Cancer 17 (1), 126. doi:10.1186/s12943-018-0874-1
Zeng, H., Ji, J., Song, X., Huang, Y., Li, H., Huang, J., et al. (2020). Stemness Related Genes Revealed by Network Analysis Associated with Tumor Immune Microenvironment and the Clinical Outcome in Lung Adenocarcinoma. Front. Genet. 11, 549213. doi:10.3389/fgene.2020.549213
Zhan, C., Wang, Z., Xu, C., Huang, X., Su, J., Chen, B., et al. (2021). Development and Validation of a Prognostic Gene Signature in Clear Cell Renal Cell Carcinoma. Front. Mol. Biosci. 8, 609865. doi:10.3389/fmolb.2021.609865
Zhang, D.-Y., Zou, X.-J., Cao, C.-H., Zhang, T., Lei, L., Qi, X.-L., et al. (2018). Identification and Functional Characterization of Long Non-coding RNA MIR22HG as a Tumor Suppressor for Hepatocellular Carcinoma. Theranostics 8 (14), 3751–3765. doi:10.7150/thno.22493
Zhang, H.-P., Li, S.-Y., Wang, J.-P., and Jun, L. (2018). Clinical Significance and Biological Roles of Cyclins in Gastric Cancer. Ott 11, 6673–6685. doi:10.2147/ott.s171716
Zhang, H., Liu, R., Sun, L., Guo, W., Ji, X., and Hu, X. (2021). Comprehensive Analysis of Gene Expression Changes and Validation in Hepatocellular Carcinoma. Ott 14, 1021–1031. doi:10.2147/ott.s294500
Zhang, J., Lin, H., Jiang, H., Jiang, H., Xie, T., Wang, B., et al. (2020). A Key Genomic Signature Associated with Lymphovascular Invasion in Head and Neck Squamous Cell Carcinoma. BMC Cancer 20 (1), 266. doi:10.1186/s12885-020-06728-1
Zhang, X., Zhang, W., Jiang, Y., Liu, K., Ran, L., and Song, F. (2019). Identification of Functional lncRNAs in Gastric Cancer by Integrative Analysis of GEO and TCGA Data. J. Cel Biochem 120 (10), 17898–17911. doi:10.1002/jcb.29058
Zhao, L., Wang, Y., and Liu, Q. (2019). Catalpol Inhibits Cell Proliferation, Invasion and Migration through Regulating miR-22-3p/MTA3 Signalling in Hepatocellular Carcinoma. Exp. Mol. Pathol. 109, 51–60. doi:10.1016/j.yexmp.2019.104265
Zhou, C., Wang, Y., Lei, L., Ji, M.-H., Yang, J.-J., and Xia, H. (2020). Identifying Common Genes Related to Platelet and Immunity for Lung Adenocarcinoma Prognosis Prediction. Front. Mol. Biosci. 7, 563142. doi:10.3389/fmolb.2020.563142
Keywords: CCNA2, pan-cancer analysis, ceRNA network, survival analysis, immune infiltration
Citation: Chen S, Zhao Z, Wang X, Zhang Q, Lyu L and Tang B (2022) The Predictive Competing Endogenous RNA Regulatory Networks and Potential Prognostic and Immunological Roles of Cyclin A2 in Pan-Cancer Analysis. Front. Mol. Biosci. 9:809509. doi: 10.3389/fmolb.2022.809509
Received: 05 November 2021; Accepted: 07 March 2022;
Published: 11 April 2022.
Edited by:
Junpeng Zhang, Dali University, ChinaReviewed by:
Xiaomei Li, University of South Australia, AustraliaMeng Huang, University of Tsukuba, Japan
Copyright © 2022 Chen, Zhao, Wang, Zhang, Lyu and Tang. This is an open-access article distributed under the terms of the Creative Commons Attribution License (CC BY). The use, distribution or reproduction in other forums is permitted, provided the original author(s) and the copyright owner(s) are credited and that the original publication in this journal is cited, in accordance with accepted academic practice. No use, distribution or reproduction is permitted which does not comply with these terms.
*Correspondence: Bo Tang, Ym9fdGFuZ0AxMjYuY29t
†These authors have contributed equally to this work and share first authorship
 Shenyong Chen
 Zhijia Zhao2†
 Li Lyu
 Bo Tang