
94% of researchers rate our articles as excellent or good
Learn more about the work of our research integrity team to safeguard the quality of each article we publish.
Find out more
ORIGINAL RESEARCH article
Front. Mol. Biosci. , 09 February 2022
Sec. Molecular Diagnostics and Therapeutics
Volume 9 - 2022 | https://doi.org/10.3389/fmolb.2022.758974
 Zijian Tian1,2
 Lingfeng Meng1,2
 Xin Wang1
 Tongxiang Diao1
 Maolin Hu1
 Miao Wang1
 Yaqun Zhang1*
 Ming Liu1,2*
 Jianye Wang1,2*
This study aimed to screen and verify the important prognostic genes related to clear cell renal cell carcinoma (ccRCC) and further analyze their relationship with the immune microenvironment. Gene expression profiles from the TCGA-KIRC, GSE46699, GSE36895, and GSE16449 datasets were utilized to explore differentially co-expressed genes in ccRCC. We screened 124 differentially co-expressed genes using a weighted gene co-expression network and differential gene expression analyses. Univariate and multivariate Cox survival analyses revealed that the expressions of genes CGN, FECH, UCHL1, and WT1 were independently related to the overall survival of ccRCC patients. Kaplan–Meier survival analysis was performed, and CGN was found to have the strongest correlation with the prognosis of ccRCC patients and was consequently selected for further analyses and experimental verification. The results showed that NK cell activation, resting dendritic cells, resting monocytes, and resting mast cells were positively correlated with CGN expression; CD4+ memory activated T cells, regulatory T cells, and M0 macrophages were negatively correlated with CGN expression. Finally, using western blotting and reverse transcription polymerase chain reaction, we verified that the CGN protein level was down-regulated in ccRCC samples, which was consistent with the mRNA levels. CGN was thus identified as diagnosis and prognosis biomarker for ccRCC and is related to the immune microenvironment.
Renal cell carcinoma (RCC) is one of the 10 most common cancers; 73,750 new cases of RCC and 14,830 RCC deaths were reported in 2020 in the United States (Siegel et al., 2020). Almost one-third of RCC patients have metastatic spread at the onset of disease, and nearly half of these patients die from the disease (Bhatt and Finelli, 2014; Bray et al., 2018). The histological subtypes of RCC are highly heterogeneous in terms of their biological characteristics and treatment results. The most common (70–80%) subtype is clear cell renal cell carcinoma (ccRCC), which is also the most aggressive (Linehan, 2012). The clinical manifestations of ccRCC are subtle. A triad with typical low back pain, visible hematuria, and a palpable abdominal mass is rare (6–10%) and is mostly associated with aggressive histology and advanced disease (Lee et al., 2002; Patard et al., 2003). Therefore, development of strategies for the early identification of ccRCC has been the focus of research in recent years.
Weighted gene co-expression network analysis (WGCNA) is a systems biology method that delineates gene association patterns between different samples and can be used to identify highly coordinated gene sets. This method considers not only the co-expression pattern between two genes but also the overlap of adjacent genes and identifies candidate biomarker genes or therapeutic targets based on the interconnectivity of gene sets and the association between gene sets and the phenotype (Langfelder and Horvath, 2008; Yang et al., 2014; Tian et al., 2021). Differential gene expression analysis primarily uses statistical methods to identify the differential genes related to the conditions between two groups and further analyzes the biological significance of the identified differential genes (San Segundo-Val and Sanz-Lozano, 2016).
Although several genes have been associated with the occurrence and development of renal cancer, such as BAP1, BIRC5, CXCR4, and SETD2 (Petitprez et al., 2021), there are other undiscovered genes that can be used as markers of ccRCC, which can provide new insights into the mechanism of occurrence and development of ccRCC. This study was intended at combining the results of WGCNA and differential gene expression analysis and then verifying the results experimentally to improve the recognition ability of highly related genes as candidate biomarkers. By analyzing the differentially co-expressed genes in ccRCC, this study provides a new idea for exploring the pathogenesis of ccRCC.
RNA sequencing data of 72 normal renal samples and 539 ccRCC samples with corresponding somatic mutation data and clinical data were obtained from The Cancer Genome Atlas (TCGA) database (https://cancerg enome.nih.gov/). Microarray data sets (GSE46699 (63 normal renal and 67 ccRCC samples), GSE36895 (23 normal renal and 29 ccRCC samples), and GSE16449 (18 normal renal and 52 ccRCC samples)) and clinical data (GSE3, GSE22541 and GSE29609) were downloaded from the Gene Expression Omnibus (GEO) database (http://www.ncbi.nlm.nih.gov/geo/).
Clinical and pathological data of 59 patients undergoing renal cancer resection in Beijing Hospital were collected retrospectively and further screening and analysis were performed. The inclusion criteria were as follows: (Siegel et al., 2020): patients who underwent nephrectomy and pathological diagnosis of ccRCC in Beijing Hospital; (Bray et al., 2018); surgery occurred between October 2019 and June 2021; and (Bhatt and Finelli, 2014) patients were ≥18 years old. The exclusion criterion was: (Siegel et al., 2020) no fresh tissue samples available. All fresh tissue samples were collected immediately after surgical resection, quickly frozen in liquid nitrogen and stored at −80 °C until RNA was extracted from the samples. Reverse transcription polymerase chain reaction (RT-PCR) and western blotting (WB) were performed on the fresh ccRCC samples to assess CGN expression. All protocols were approved by the Research Ethics Committee of Beijing Hospital.
To clarify the association between genes, a weighted gene co-expression network was constructed for the hierarchical clustering of all genes subjected to co-expression analysis. The protocol used was as follows: (Siegel et al., 2020): The Pearson correlation coefficient between genes was determined. (Bray et al., 2018). A weighted adjacency matrix αmn = |cmn|β was constructed, where αmn represents the adjacency matrix between gene m and gene n; cmn represents the Pearson correlation coefficient between gene m and gene n; and β is the soft power value. The pickSoftThreshold function of the WGCNA software package was used to select the appropriate soft threshold power β. An appropriate soft power value β can ensure that the network is in accordance with a standard non-scale network to achieve a scale-free topology. (Bhatt and Finelli, 2014). The adjacency matrix was converted into a topological overlap matrix (TOM), and the dissimilarity matrix between genes dissTOM = 1-TOM was calculated. (Linehan, 2012). Hierarchical clustering was performed using dissTOM such that genes with similar expression patterns are placed in the same gene module. (Lee et al., 2002). The minimum number of module genes was set at 50, and the dynamic hybrid cutting algorithm was used to obtain the gene modules and merge modules that were highly similar. (Patard et al., 2003). The Pearson correlation coefficient between each module and the disease traits was determined, and the p value was used to determine the hub module. The genes in the gene module with the highest association coefficient were used as candidate prognostic molecular markers and were included in subsequent analyses.
The DEGs were screened from the normal and tumor tissue groups. The screening criteria were false discovery rate (FDR) < 0.05 and │log2 FC│≥1.0, where FC is the fold change that is the multiple of the differential expression levels between the two groups. Subsequently, the genes of the hub module and the DEGs in the weighted co-expression network were intersected to identify the differentially co-expressed genes, which were visualized using the R package VennDiagram. A hypergeometric test was used to test the statistical significance of Venn diagram, and p < 0.05 was considered statistically significant.
The clusterProfiler package in the R software was used to perform a GO enrichment analysis on the intersecting genes. A recently developed algorithm based on the pathway topology to identify the functional roles of pathway components was used for pathway annotations (Sorokin et al., 2021).
R language survival package was used to perform a survival analysis on the intersecting genes. From the TCGA database, univariate Cox survival analysis-screened genes with a FDR<0.05 were included in the multivariate Cox survival analysis to obtain independent prognostic genes. A Kaplan–Meier (KM) survival analysis was then performed to screen for the most relevant genes for prognosis. Finally, TCGA, GSE3, GSE22541 and GSE29609 datasets were integrated with the application of the “ComBat” algorithm to eliminate batch effect, and the prognostic effect of CGN was verified.
To explore the relationship between CGN and clinical traits, CGN expression level was divided into two groups according to the median value. The Wilcox test was used to explore the relationship between CGN and age, sex, T stage, N stage, M stage, tumor grade, and tumor stage. Statistical significance was set at p < 0.05.
The “CIBERSORT” R package was used to analyze the infiltrating immune components of each sample, and the Pearson correlation analysis was used to determine the linear relationship between the 22 immune cell types (naïve B cells, memory B cells, plasma cells, CD8 T cells, CD4 naïve T cells, CD4 memory resting T cells, CD4 memory activated T cells, follicular helper T cells, regulatory T cells, gamma delta T cells, resting NK cells, activated NK cells, Monocytes, M0 macrophages, M1 macrophages, M2 macrophages, resting dendritic cells, activated dendritic cells, resting mast cells, activated mast cells, eosinophils, and neutrophils) and CGN. We further divided the expression of CGN into high and low expression groups according to the median value, and the Wilcoxon test was used to detect the immune cells related to CGN. Finally, the intersection of the two results identified the immune cells that are most closely related to CGN.
The linear relationship between CGN and TMB in the TCGA dataset was obtained by the Pearson correlation analysis. Then, CGN was divided into high and low expression groups based on the median value. The Wilcoxon test was used to compare the relationship between these two groups and TMB. TMB was divided into two groups based on the median value and a KM survival analysis was performed. The KM method and log-rank test shows the survival curves of CGN stratification and TMB stratification. The Wilcoxon test was used to compare the relationship between high and low expressions CGN and PD-L1 of TCGA and GSE16449.
The linear relationship between CGN and existing ccRCC biomarkers (BAP1, BIRC5, CXCR4, and SETD2) in the TCGA dataset was obtained by the Pearson correlation analysis. Statistical significance was set at p < 0.05.
Protein expression of the CGN gene in the tumor and normal tissues was obtained using the HPA database (https://www.proteinatlas.org/).
The mRNA transcription level of CGN in the tumor and normal tissues of the ccRCC patients that were preserved in our hospital was analyzed. TRI Reagent (Sigma) was used to extract the total RNA from the specimens. A NanoDrop® ND-1000 spectrophotometer was used to determine the RNA concentration and purity. Total RNA was reverse-transcribed into cDNA using SuperScriptTM III Reverse transcriptase (Invitrogen), and the cDNA was used as a template to detect the expression of each gene by RT-PCR. The primer sequences used were as follows:
CGN forward: 5′-CAGGGCATTGGCAGAGTATGT-3′;
CGN reverse: 5′-CCTCAACCTGGCGAGTATCT-3′; β-actin forward: 5′-GTGGCCGAGGACTTTGATTG-3′;
β-actin reverse: 5′-CCTGTAACAACGCATCTCATATT-3′.
Total protein was extracted with pre-chilled RIPA lysis buffer and was quantified using a BCA protein assay kit (Cwbiotech), according to the manufacturer’s guidelines. SDS-PAGE was performed on the protein samples and blocked at room temperature after transfer to PVDF (Millipore) membranes with added anti-CGN (Sigma) primary antibody diluted 1:1000 and incubated overnight. A secondary antibody (goat anti-rabbit IgG (H + L), HRP 1:10,000, Jackson) was added, and the samples were incubated for 1 h, washed with TBST washing solution, reacted with ECL reagent (Millipore), and visualized. The software used for grayscale analysis of the image was Gel Image System ver.4.00 (Tanon, China).
Wilcox test is a non-parametric statistical hypothesis test mainly used for comparison between two groups. Pearson correlation analysis is used to compare the association between two parameters. Univariate and multivariate Cox regression analysis were used to study the relationship between gene expression and the overall survival (OS) rate of patients. The expression level of CGN was divided into a high-risk group and a low-risk group according to the median, and the OS of the patients was analyzed by the Kaplan-Meier method. p < 0.05 was considered statistically significant, and all statistical analyses were performed using the R software (version 4.1.0).
The TCGA-KIRC, GSE46699, GSE36895, and GSE16449 datasets were used to construct a gene co-expression network, and 12, 11, 10, and 11 modules, respectively, were identified in these datasets (Supplementary Figure S1A–D). The module-trait relationship heat map (Figures 1A–D) shows the relationship between each module and the clinical characteristics. The results showed that the salmon module in TCGA-KIRC (R = 0.85, P = 7e-175), the blue module in GSE46699 (R = 0.86, P = 1e-39), the turquoise module in GSE36895 (R = 0.96, P = 2e-28), and the turquoise module in GSE16449 (R = 0.9, P = 3e-26) had the strongest association with normal tissues.

FIGURE 1. Module-trait relationship heat maps for (A) TCGA-KIRC, (B) GSE46699, (C) GSE36895, and (D) GSE16449. Each module displays the association coefficients and corresponding p-values between the genes in a specific module and selected clinical features (tumor tissue or normal tissue).
Considering |log2FC| ≥1.0 and FDR <0.05 as the threshold values, in the TCGA-KIRC dataset, there were 1902 down-regulated genes and 5467 up-regulated genes; in the GSE46699 dataset, there were 522 down-regulated genes and 484 up-regulated genes; in the GSE36895 dataset, there were 868 down-regulated genes and 728 up-regulated genes; in the GSE16449 dataset, there were 1777 down-regulated genes and 1646 up-regulated genes (Figures 2A–D). Subsequently, the intersection of genes was taken from the modules with the highest association obtained from the WGCNA and DEGs analysis. As shown in Figures 3A–C, there were 124 overlapping genes between the differential genes and the co-expression modules.
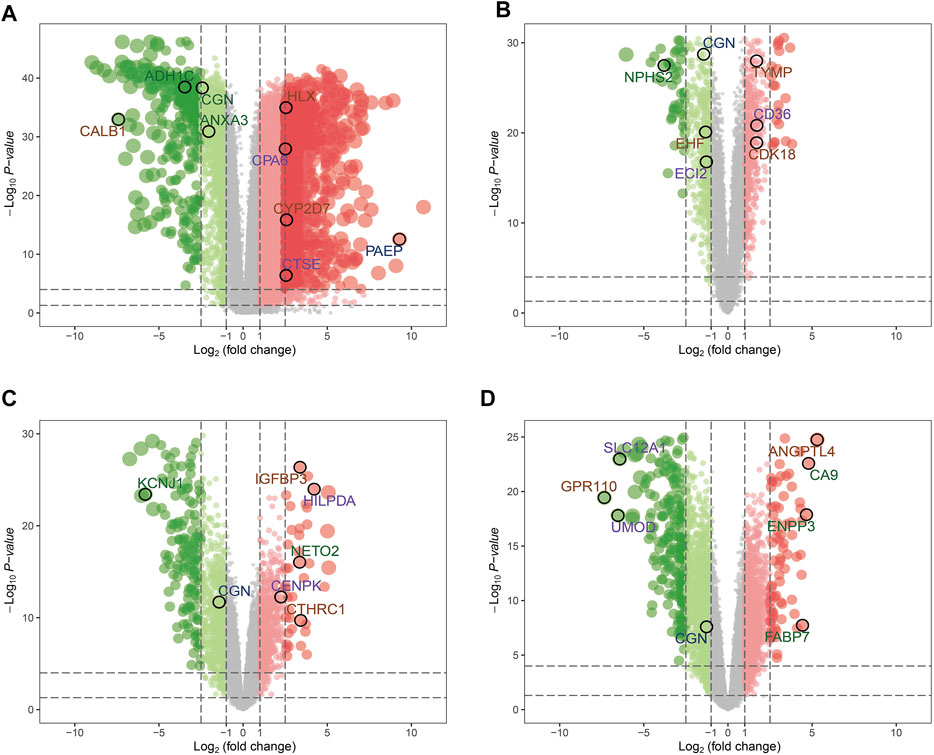
FIGURE 2. Volcano maps for the differentially expressed genes (DEGs) of (A) TCGA-KIRC, (B) GSE46699, (C) GSE36895, and (D) GSE16449.
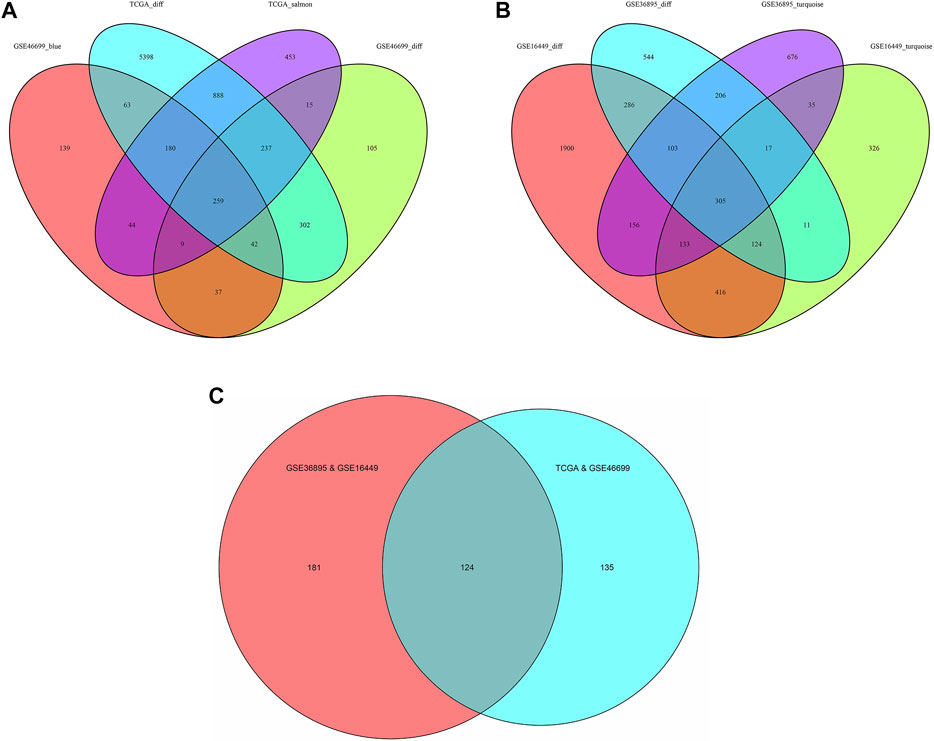
FIGURE 3. Venn diagram of the genes among the DEG lists and the co-expression modules. (A) Among TCGA-KIRC and GSE46699, the results were recorded as TCGA&GSE46699 (B) Among GSE16449 and GSE36895, the results were recorded as GSE36895&GSE16449 and (C) The intersection of Figure 3. (Abbreviations: TCGA_salmon, GSE46699_blue, GSE16449_ turquoise and GSE36895_turquoise: In WGCNA analysis, the modules with the highest association in the TCGA, GSE46699, GSE16449 and GSE36895 data sets, respectively; TCGA_diff, GSE46699_diff, GSE16449_diff and GSE36895_diff: Differentially expressed genes in the TCGA, GSE46699, GSE16449 and GSE36895 data sets, respectively).
To determine the biological functions of the intersecting genes, we performed a GO functional enrichment analysis (Supplementary Figure S2) and a pathway analysis (Supplementary Datasheet S1) on the intersecting genes. In the univariate Cox survival analysis, four overlapping genes were observed to be significantly correlated with the OS (FDR <0.05) (Supplementary Table S1). Multivariate Cox survival analysis also confirmed that the expression of the four genes CGN, FECH, UCHL1, and WT1 were independently correlated with the OS of ccRCC patients.
In the KM survival analysis, gene expression was divided into two groups, high and low, according to the median value. The results showed that low expression of CGN had the strongest correlation with a poor prognosis and low OS in ccRCC patients. (Supplementary Table S2 and Figure 4). The integrated datasets of TCGA, GSE3, GSE22541 and GSE29609 also showed a significant correlation between CGN and prognosis (Supplementary Figure S3). Therefore, the CGN gene was selected for further analysis and verification.
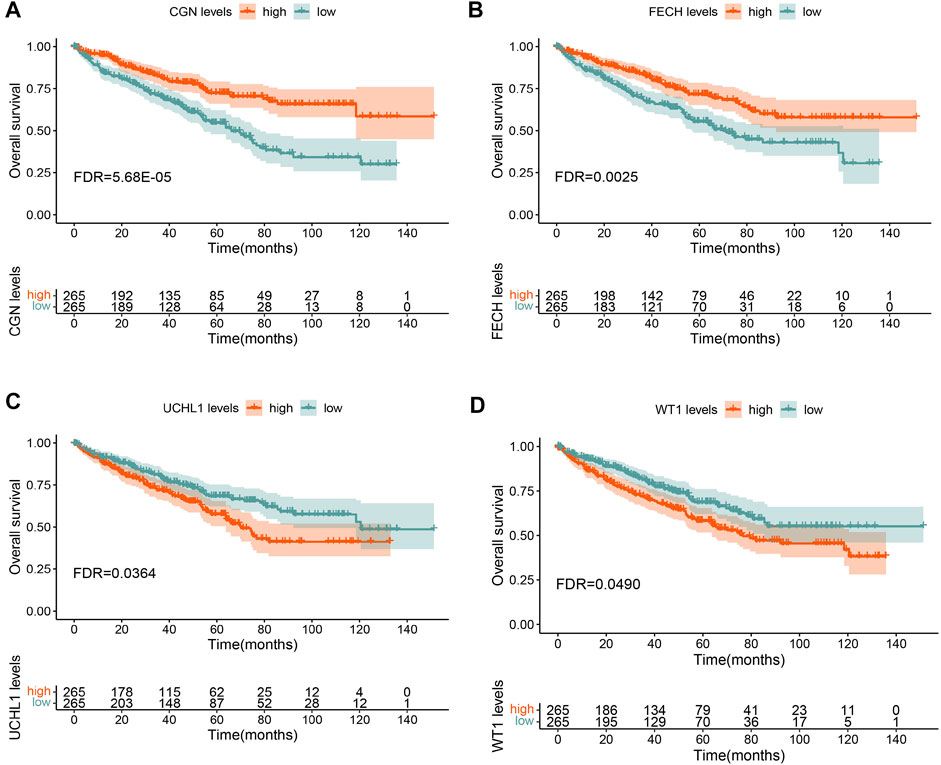
FIGURE 4. Overall survival (OS) analysis for (A) CGN, (B) FECH, (C) UCHL1, and (D) WT1 in TCGA-KIRC.
We analyzed the relationship between CGN expression and age, gender, tumor grade, tumor stage, T stage, N stage, and M stage. The results showed that CGN expression decreased significantly with age, advanced tumor stage, high grade, and advanced T, N, and M stages (Figure 5).
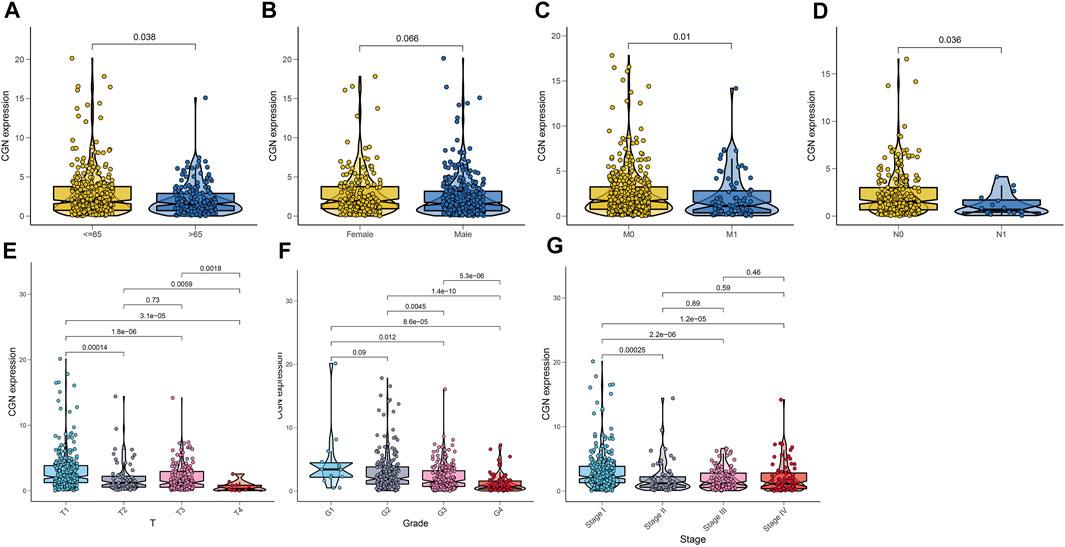
FIGURE 5. Relationship between CGN and (A) age, (B) gender, (C) stage M, (D) stage N, (E) stage T, (F) tumor grade, and (G) tumor stage.
The CIBERSORT algorithm was used to analyze the proportion of tumor-infiltrating immune subgroups, and 22 immune cell maps of the ccRCC samples and the association matrix of immune cells were constructed (Supplementary Figure S4). To confirm the association between the expression of CGN and immune cells, the Pearson correlation analysis (Figures 6A–G) and the Wilcoxon test (Figure 6H) were performed and the results corresponding to the intersection of these two analyses were used to identify the immune cell types that are most closely related to CGN. (Figure 6I). The results showed that six types of TICs are related to the expression of CGN. Among them, activated NK cells, resting dendritic cells, resting monocytes, and resting mast cells were positively correlated with CGN expression, while CD4+ memory activated T cells, regulatory T cells, and M0 macrophages were negatively correlated with CGN expression. These results further support the idea that changes in the expression levels of CGN can affect the immune activity of the tumor microenvironment (TME).
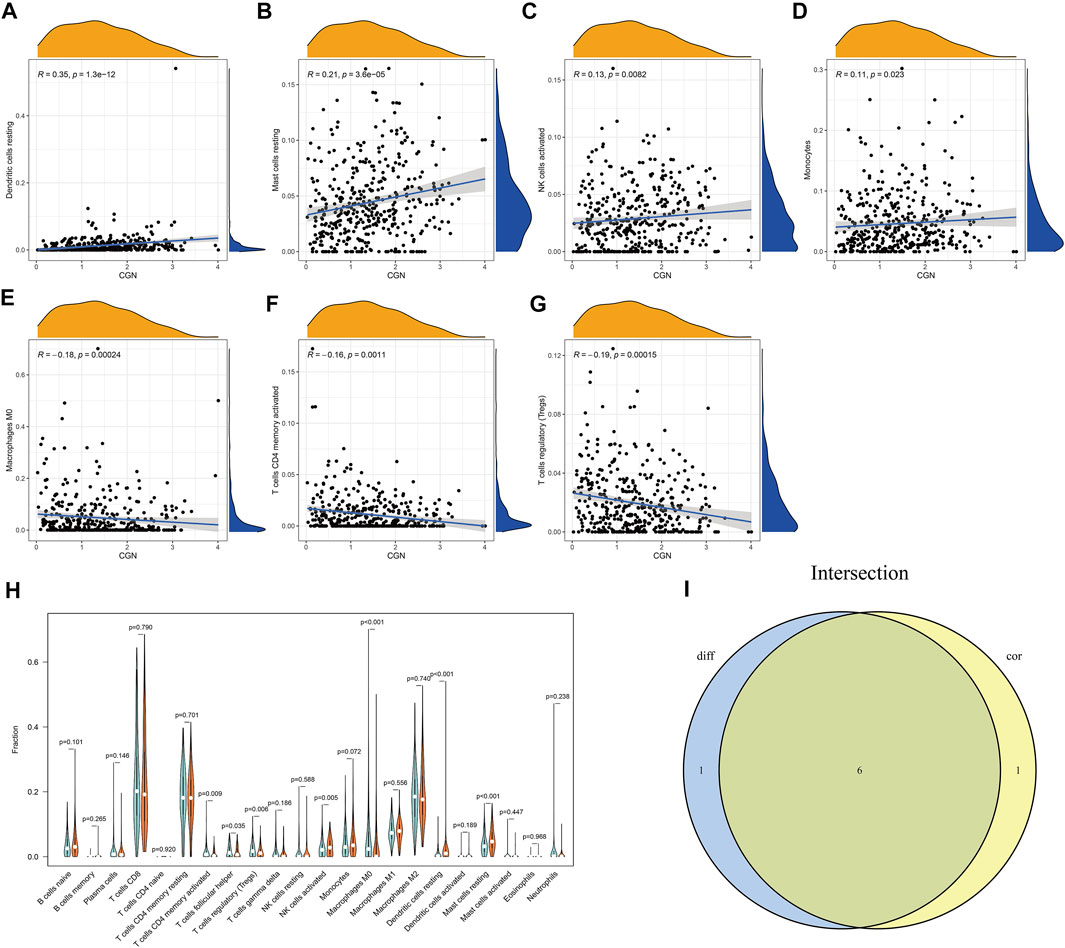
FIGURE 6. Association analysis between CGN and immune cells. (A–G) Scatter curve graphs for seven types of immune cells related to CGN expression. (H) Violin curve graph that shows the differentially expressed immune cells between the two groups with high and low expression of CGN. (I) Violin graph and scatter graph used to identify six types of immune cells related to CGN expression.
The results showed that the group with a high CGN expression had lower TMB (p < 0.001; Supplementary Figure S5A). Furthermore, a negative association between CGN expression and TMB (R = −0.21, p < 0.001) was also identified (Supplementary Figure S5B). The KM survival curve results for patients with low TMB showed significant clinical benefits and significantly prolonged rates of survival (p < 0.001; Supplementary Figure S5C). After CGN and TMB were grouped together, the ccRCC patients with high TMB and low CGN had the worst prognosis (p < 0.001; Figure 7A). In addition, we divided CGN expression into high and low groups according to the median value, and determined the relationship between these two groups and PD-L1 expression. Figures 7B–D shows that the expression of PD-L1 in patients with high CGN values is significantly increased (p < 0.05).
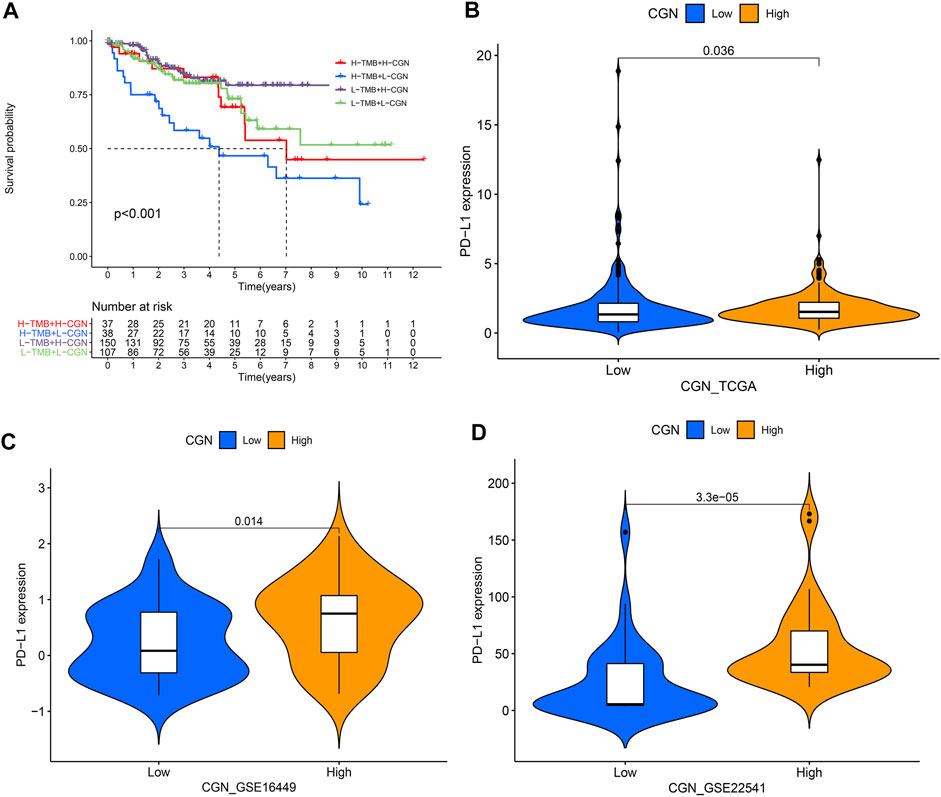
FIGURE 7. (A) Kaplan–Meier curve analyzing the survival of the patient subgroups stratified by CGN and TMB. H, high; L, low. Relationship between CGN and PD-L1 expression in (B) TCGA, (C) GSE16449 and (D) GSE22541.
As Supplementary Figures S6A,B showed, CGN expression was positively association with BAP1 and SETD2 (p < 0.05). In addition, CGN expression was negatively correlated with BIRC5 and CXCR4 (Supplementary Figures S6C,D).
According to the HPA database, the CGN protein level in the tumor tissues was significantly lower than that in the normal tissues (Figures 8A,B). To better study the expression levels of CGN in the normal tissues and tumor tissues of ccRCC patients, 59 samples (Supplementary Tables S3, S4) of each of these tissue types were collected. When compared with the normal tissues, the expression levels of CGN in the tumor tissues were significantly reduced (p < 0.001; Figure 8C). WB results also showed that protein level of CGN in the tumor tissues was significantly lower than that in the normal tissues (p < 0.001; Figure 8D).
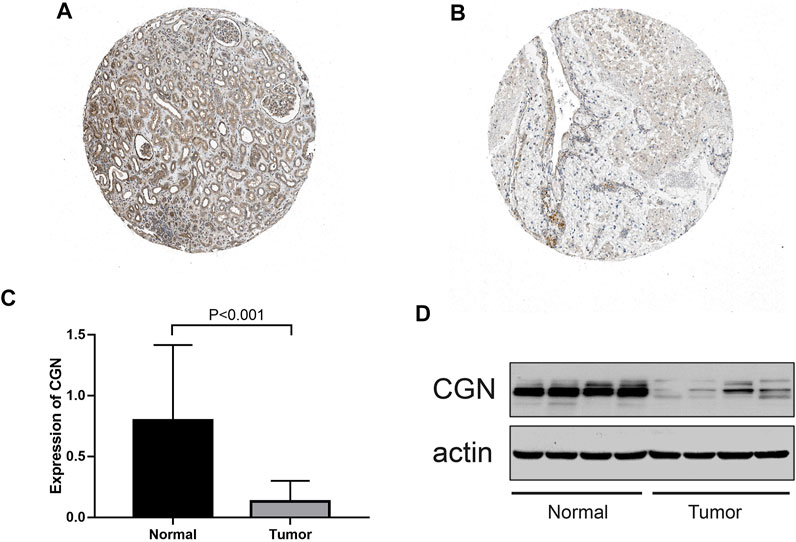
FIGURE 8. (A, B) Immunohistochemistry of the CGN gene in normal and tumor tissues from the HPA database. (C) RT-PCR analysis of the CGN mRNA expression in normal and tumor tissues. (D) Expressed CGN protein confirmed by western blot analysis in normal and tumor tissues.
In this study, a comprehensive bioinformatics analysis identified 124 differentially co-expressed genes in the TCGA-KIRC, GSE46699, GSE36895, and GSE16449 databases. By TCGA and GEO analysis, CGN was considered to be the differential gene in ccRCC. Further RT-PCR and WB analyses were performed on CGN to verify this. Survival analysis also showed that the expression of CGN was mostly correlated with the OS.
CGN is a tight junction-related protein that can bind to actin filaments and microtubules and participate in tight junction recombination (Citi et al., 2014). Studies have shown that tight junctions are essential for the barrier functions of the epithelium and the endothelium (Zihni et al., 2016). The downregulation of adhesion functions in tight junctions can lead to an increase in cancer invasion and metastasis (Paschoud et al., 2007), and this has been related to the occurrence of a variety of cancers (Brandner et al., 2015; Zihni et al., 2016). Previous studies have shown that CGN is related to the occurrence of lung cancer, and it is highly expressed in lung adenocarcinoma, but significantly reduced in squamous cell carcinoma (Paschoud et al., 2007). Bujko et al. (Bujko et al., 2015) found that when compared with normal tissues, CGN is expressed at lower levels in colon adenocarcinoma. In addition, during epithelial-mesenchymal transition in breast cancer model cells, the expression of CGN was observed to be downregulated (Papageorgis et al., 2010). Based on these previous findings and our research, it is presumed that the upregulation of CGN can inhibit tumor development. Meanwhile, CGN is also considered as a prognostic gene of ccRCC in renal clear cell carcinoma (Wu et al., 2021). BAP1, BIRC5, CXCR4, and SETD2 have been identified as important markers of ccRCC (Petitprez et al., 2021). Our results showed that CGN expression was positively associated with tumor suppressors BAP1 (Peña-Llopis et al., 2012) and SETD2 (Li et al., 2016). In addition, CGN expression was negatively associated with the tumor-promoting factors BIRC5 (Liu et al., 2014) and CXCR4 (Wang et al., 2021). These results indicated that CGN was associated with marker genes of existing ccRCC, and also demonstrated the credibility of our results.
The TME is composed of an extracellular matrix and related stromal cells, including immune cells, fibroblasts, and vascular networks. Inflammatory cytokines are already known to predict disease progression (Mihai et al., 2016; Mihai et al., 2019). In addition, the interaction between tumor cells and TME also can help determine tumor progression (Binnewies et al., 2018). Accordingly, we further explored the TICs related to CGN. The results showed that CGN was positively correlated with resting dendritic cells, resting mast cells, and activated NK cells. Dendritic cells are the most powerful antigen-presenting cells and are the main activating cells of CD4+T cells and CD8+T cells (Lin et al., 2019). It has been reported that curative tumor regression is mainly mediated by CD8+ T cells and cross-presented dendritic cells, suggesting that effective treatment could eliminate tumors through innate and acquired immune responses (Moynihan et al., 2016). Clinical trials for dendritic cell-related tumor immunotherapy have shown promising prospects and achieved success in phase three trials (Kimura et al., 2018). In addition, Guldur et al. (Guldur et al., 2014) found that there are more mast cells in ccRCC tissues than in non-ccRCC tissues. This phenomenon may promote ccRCC angiogenesis and lead to the progression of ccRCC (Chen et al., 2017). Under the guidance of pro-inflammatory chemokines produced by the innate immune and acquired immune cells in the TME, circulating NK cells can be recruited to the site of tumorigenesis (Bernardini et al., 2016). It has been reported that the degree of NK cell infiltration in tumor tissues can predict the prognosis of cancer patients (Mandal et al., 2016). In addition, we also found that CGN is negatively correlated with activated CD4+ memory T cells, regulatory T cells, and M0 macrophages. CD4+memory T cells are important immune cells in the human immune system. They are rapidly activated when antigens meet again and produce a strong response (Strutt et al., 2012). It has been reported that patients who received PD-L1/PD-1 blockade in response to treatment showed a high proportion of CD4+ memory T cells before the initiation of treatment (Zuazo et al., 2019). Vahidi et al. (Vahidi et al., 2018) found that an increase in the frequency of CD4+ memory cells in the tumor-draining lymph nodes of breast cancer patients could effectively prevent tumor recurrence and play a protective role in tumor progression. Regulatory T cells (Treg) also play a major role in tumor immunity, and the frequency of Treg cells in tumor immune infiltration is often much higher than that in normal tissues. It has been suggested that the common selection of Treg cells by tumors is an important feature of tumor development and a necessary condition for tumor progression in many tumor types (Gallimore et al., 2019). This study found that CGN expression is negatively correlated with ccRCC clinical staging and M0 macrophage content, which explains that the latter changes with the progression of tumor staging in patients. M0 macrophages form M1 macrophages under the stimulation of interferon (Billiau and Matthys, 2009), affecting the occurrence and the development of ccRCC. Therefore, the analysis of the proportion of TICs in the ccRCC patients suggests that CGN may be involved in the maintenance and regulation of immune activity in the TME.
In recent years, immune checkpoint inhibitors have rewritten the history of tumor treatment and improved drug treatments for ccRCC. TMB and PD-L1 have been reported as new biomarkers for cancer responses to immune checkpoint inhibitors (Rittmeyer et al., 2017; Ready et al., 2019). This study found that CGN expression is related to TMB and PD-L1, and the survival analysis curve also shows that the OS of ccRCC patients with a lower expression of CGN and elevated TMB is shorter. This also proves that CGN could be utilized as a biomarker to improve the precision of ccRCC treatments.
However, this study has some limitations. Firstly, this is a retrospective study, and selection bias cannot be avoided. Secondly, differentially co-expressed genes from RNA-seq data were intersected with differentially co-expressed genes from microarray. The numbers of genes in profiles differed significantly. This should be assessed as a factor that impacts gene intersection. Thirdly, we did not investigate the potential mechanisms underlying the involvement of CGN genes in the occurrence and development of ccRCC. Future studies should focus on such mechanisms to improve the efficiency of tumor treatment and the accuracy of diagnosis.
In summary, through TCGA and GEO screening, and further verification by RT-PCR and WB experiments, it was shown that CGN is expressed at low levels in ccRCC and is highly correlated with the immune microenvironment. This study illustrates the clinical role and potential biological characteristics of CGN in the treatment of ccRCC.
The datasets presented in this study can be found in online repositories. The names of the repository/repositories and accession number(s) can be found in the article/Supplementary Material.
The studies involving human participants were reviewed and approved by Beijing Hospital. The patients/participants provided their written informed consent to participate in this study.
Study concept and design: ZT and JW; data acquisition or data analysis/interpretation: LM, ML, YZ, and XW; manuscript drafting or manuscript revision for important intellectual content: ZT and XW; approval of final version of submitted manuscript: JW and TD; literature research: MH and MW.
This study was funded by the Beijing Municipal Science and Technology Project (Z201100005620007); the Discipline Construction Project of Peking Union Medical College (201920202101); and the Fundamental Research Funds for the Central Universities (3332020069).
The authors declare that the research was conducted in the absence of any commercial or financial relationships that could be construed as a potential conflict of interest.
All claims expressed in this article are solely those of the authors and do not necessarily represent those of their affiliated organizations, or those of the publisher, the editors and the reviewers. Any product that may be evaluated in this article, or claim that may be made by its manufacturer, is not guaranteed or endorsed by the publisher.
We would like to thank Editage (www.editage.cn) for English language editing. The authors would like to express their deep gratitude to the Clinical Biobank, Beijing Hospital for the biological sample collection, processing, storage, and information management.
The Supplementary Material for this article can be found online at: https://www.frontiersin.org/articles/10.3389/fmolb.2022.758974/full#supplementary-material
Bernardini, G., Antonangeli, F., Bonanni, V., and Santoni, A. (2016). Dysregulation of Chemokine/chemokine Receptor Axes and NK Cell Tissue Localization during Diseases. Front. Immunol. 7, 402. doi:10.3389/fimmu.2016.00402
Bhatt, J. R., and Finelli, A. (2014). Landmarks in the Diagnosis and Treatment of Renal Cell Carcinoma. Nat. Rev. Urol. 11, 517–525. doi:10.1038/nrurol.2014.194
Billiau, A., and Matthys, P. (2009). Interferon-γ: A Historical Perspective. Cytokine Growth Factor. Rev. 20, 97–113. doi:10.1016/j.cytogfr.2009.02.004
Binnewies, M., Roberts, E. W., Kersten, K., Chan, V., Fearon, D. F., Merad, M., et al. (2018). Understanding the Tumor Immune Microenvironment (TIME) for Effective Therapy. Nat. Med. 24, 541–550. doi:10.1038/s41591-018-0014-x
Brandner, J. M., Zorn-Kruppa, M., Yoshida, T., Moll, I., Beck, L. A., and De Benedetto, A. (2015). Epidermal Tight Junctions in Health and Disease. Tissue Barriers 3, e974451. doi:10.4161/21688370.2014.974451
Bray, F., Ferlay, J., Soerjomataram, I., Siegel, R. L., Torre, L. A., and Jemal, A. (2018). Global Cancer Statistics 2018: GLOBOCAN Estimates of Incidence and Mortality Worldwide for 36 Cancers in 185 Countries. CA: A Cancer J. Clinicians 68, 394–424. doi:10.3322/caac.21492
Bujko, M., Kober, P., Mikula, M., Ligaj, M., Ostrowski, J., and Siedlecki, J. A. (2015). Expression Changes of Cell-Cell Adhesion-Related Genes in Colorectal Tumors. Oncol. Lett. 9, 2463–2470. doi:10.3892/ol.2015.3107
Chen, Y., Li, C., Xie, H., Fan, Y., Yang, Z., Ma, J., et al. (2017). Infiltrating Mast Cells Promote Renal Cell Carcinoma Angiogenesis by Modulating PI3K→AKT→GSK3β→AM Signaling. Oncogene 36, 2879–2888. doi:10.1038/onc.2016.442
Citi, S., Guerrera, D., Spadaro, D., and Shah, J. (2014). Epithelial Junctions and Rho Family GTPases: the Zonular Signalosome. Small GTPases 5, 1–15. doi:10.4161/21541248.2014.973760
Gallimore, A., Quezada, S. A., and Roychoudhuri, R. (2019). Regulatory T Cells in Cancer: where Are We Now? Immunology 157, 187–189. doi:10.1111/imm.13088
Guldur, M. E., Kocarslan, S., Ozardali, H. I., Ciftci, H., Dincoglu, D., and Gumus, K. (2014). The Relationship of Mast Cells and Angiogenesis with Prognosis in Renal Cell Carcinoma. J. Pak Med. Assoc. 64, 300–303.
Kimura, H., Matsui, Y., Ishikawa, A., Nakajima, T., and Iizasa, T. (2018). Randomized Controlled Phase III Trial of Adjuvant Chemoimmunotherapy with Activated Cytotoxic T Cells and Dendritic Cells from Regional Lymph Nodes of Patients with Lung Cancer. Cancer Immunol. Immunother. 67, 1231–1238. doi:10.1007/s00262-018-2180-6
Langfelder, P., and Horvath, S. (2008). WGCNA: an R Package for Weighted Correlation Network Analysis. BMC Bioinformatics 9, 559. doi:10.1186/1471-2105-9-559
Lee, C. T., Katz, J., Fearn, P. A., and Russo, P. (2002). Mode of Presentation of Renal Cell Carcinoma Provides Prognostic Information. Urol. Oncol. Semin. Original Invest. 7, 135–140. doi:10.1016/S1078-1439(01)00185-5
Li, J., Kluiver, J., Osinga, J., Westers, H., van Werkhoven, M. B., Seelen, M. A., et al. (2016). Functional Studies on Primary Tubular Epithelial Cells Indicate a Tumor Suppressor Role of SETD2 in Clear Cell Renal Cell Carcinoma. Neoplasia 18 (6), 339–346. doi:10.1016/j.neo.2016.04.005
Lin, W., Liu, T., Wang, B., and Bi, H. (2019). The Role of Ocular Dendritic Cells in Uveitis. Immunol. Lett. 209, 4–10. doi:10.1016/j.imlet.2019.03.016
Linehan, W. M. (2012). Genetic Basis of Kidney Cancer: Role of Genomics for the Development of Disease-Based Therapeutics. Genome Res. 22, 2089–2100. doi:10.1101/gr.131110.111
Liu, S., Qi, L., Yu, Q., Song, Y., Han, W., Zu, X., et al. (2014). Survivin and HLA-I Expression Predicts Survival of Patients with clear Cell Renal Cell Carcinoma. Tumor Biol. 35 (8), 8281–8288. doi:10.1007/s13277-014-2058-y
Mandal, R., Şenbabaoğlu, Y., Desrichard, A., Havel, J. J., Dalin, M. G., Riaz, N., et al. (2016). The Head and Neck Cancer Immune Landscape and its Immunotherapeutic Implications. JCI Insight 1, e89829. doi:10.1172/jci.insight.89829
Mihai, S., Codrici, E., Popescu, I. D., Enciu, A. M., Rusu, E., Zilisteanu, D., et al. (2016). Proteomic Biomarkers Panel: New Insights in Chronic Kidney Disease. Dis. Markers 2016, 3185232. doi:10.1155/2016/3185232
Mihai, S., Codrici, E., Popescu, I. D., Enciu, A. M., Rusu, E., Zilisteanu, D., et al. (2019). Inflammation-Related Patterns in the Clinical Staging and Severity Assessment of Chronic Kidney Disease. Dis. Markers 2019, 1814304. doi:10.1155/2019/1814304
Moynihan, K. D., Opel, C. F., Szeto, G. L., Tzeng, A., Zhu, E. F., Engreitz, J. M., et al. (2016). Eradication of Large Established Tumors in Mice by Combination Immunotherapy that Engages Innate and Adaptive Immune Responses. Nat. Med. 22, 1402–1410. doi:10.1038/nm.4200
Papageorgis, P., Lambert, A. W., Ozturk, S., Gao, F., Pan, H., Manne, U., et al. (2010). Smad Signaling Is Required to Maintain Epigenetic Silencing during Breast Cancer Progression. Cancer Res. 70, 968–978. doi:10.1158/0008-5472.CAN-09-1872
Paschoud, S., Bongiovanni, M., Pache, J.-C., and Citi, S. (2007). Claudin-1 and Claudin-5 Expression Patterns Differentiate Lung Squamous Cell Carcinomas from Adenocarcinomas. Mod. Pathol. 20, 947–954. doi:10.1038/modpathol.3800835
Patard, J.-J., Leray, E., Rodriguez, A., Rioux-Leclercq, N., Guillé, F., and Lobel, B. (2003). Correlation between Symptom Graduation, Tumor Characteristics and Survival in Renal Cell Carcinoma. Eur. Urol. 44, 226–232. doi:10.1016/S0302-2838(03)00216-1
Peña-Llopis, S., Vega-Rubín-de-Celis, S., Liao, A., Leng, N., Pavía-Jiménez, A., Wang, S., et al. (2012). BAP1 Loss Defines a New Class of Renal Cell Carcinoma. Nat. Genet. 44 (7), 751–759. doi:10.1038/ng.2323
Petitprez, F., Ayadi, M., De Reyniès, A., Fridman, W. H., Sautès-Fridman, C., and Job, S. (2021). Review of Prognostic Expression Markers for Clear Cell Renal Cell Carcinoma. Front. Oncol. 28 (11), 659. eCollection 2021. doi:10.3389/fonc.2021.643065
Ready, N., Hellmann, M. D., Awad, M. M., Otterson, G. A., Gutierrez, M., Gainor, J. F., et al. (2019). First-line Nivolumab Plus Ipilimumab in Advanced Non-small-cell Lung Cancer (CheckMate 568): Outcomes by Programmed Death Ligand 1 and Tumor Mutational burden as Biomarkers. Jco 37, 992–1000. doi:10.1200/JCO.18.01042
Rittmeyer, A., Barlesi, F., Waterkamp, D., Park, K., Ciardiello, F., von Pawel, J., et al. (2017). Atezolizumab versus Docetaxel in Patients with Previously Treated Non-small-cell Lung Cancer (OAK): a Phase 3, Open-Label, Multicentre Randomised Controlled Trial. The Lancet 389, 255–265. doi:10.1016/S0140-6736(16)32517-X
San Segundo-Val, I., and Sanz-Lozano, C. S. (2016). Introduction to the Gene Expression Analysis. Methods Mol. Biol. 1434, 29–43. doi:10.1007/978-1-4939-3652-6_3
Siegel, R. L., Miller, K. D., and Jemal, A. (2020). Cancer Statistics, 2020. CA A. Cancer J. Clin. 70, 7–30. doi:10.3322/caac.21590
Sorokin, M., Borisov, N., Kuzmin, D., Gudkov, A., Zolotovskaia, M., Garazha, A., et al. (2021). Algorithmic Annotation of Functional Roles for Components of 3,044 Human Molecular Pathways. Front. Genet. 12, 139. doi:10.3389/fgene.2021.617059
Strutt, T. M., McKinstry, K. K., Kuang, Y., Bradley, L. M., and Swain, S. L. (2012). Memory CD4+ T-Cell-Mediated protection Depends on Secondary Effectors that Are Distinct from and superior to Primary Effectors. Proc. Natl. Acad. Sci. USA 109, E2551–E2560. doi:10.1073/pnas.1205894109
Tian, L., Chen, T., Lu, J., Yan, J., Zhang, Y., Qin, P., et al. (2021). Integrated Protein-Protein Interaction and Weighted Gene Co-expression Network Analysis Uncover Three Key Genes in Hepatoblastoma. Front. Cel Dev. Biol. 9, 631982. doi:10.3389/fcell.2021.631982
Vahidi, Y., Faghih, Z., Talei, A.-R., Doroudchi, M., and Ghaderi, A. (2018). Memory CD4+ T Cell Subsets in Tumor Draining Lymph Nodes of Breast Cancer Patients: A Focus on T Stem Cell Memory Cells. Cell Oncol. 41, 1–11. doi:10.1007/s13402-017-0352-6
Wang, W., Gan, Z., Liu, Q., Yan, S., Mulati, R., and Wang, Y. (2021). Silencing of the Chemokine CXC Receptor 4 (CXCR4) Hampers Cancer Progression and Increases Cisplatin (DDP)-sensitivity in clear Cell Renal Cell Carcinoma (ccRCC). Bioengineered 12 (1), 2957–2969. doi:10.1080/21655979.2021.1943112
Wu, Y., Wei, X., Feng, H., Hu, B., Liu, B., Luan, Y., et al. (2021). Integrated Analysis to Identify a Redox-Related Prognostic Signature for Clear Cell Renal Cell Carcinoma. Oxid Med. Cel Longev 2021, 6648093. doi:10.1155/2021/6648093
Yang, Y., Han, L., Yuan, Y., Li, J., Hei, N., and Liang, H. (2014). Gene Co-expression Network Analysis Reveals Common System-Level Properties of Prognostic Genes across Cancer Types. Nat. Commun. 5, 3231. doi:10.1038/ncomms4231
Zihni, C., Mills, C., Matter, K., and Balda, M. S. (2016). Tight Junctions: from Simple Barriers to Multifunctional Molecular gates. Nat. Rev. Mol. Cel Biol 17, 564–580. doi:10.1038/nrm.2016.80
Keywords: CGN, clear cell renal carcinoma, survival analysis, prognosis, tumor immune microenvironment
Citation: Tian Z, Meng L, Wang X, Diao T, Hu M, Wang M, Zhang Y, Liu M and Wang J (2022) CGN Correlates With the Prognosis and Tumor Immune Microenvironment in Clear Cell Renal Cell Carcinoma. Front. Mol. Biosci. 9:758974. doi: 10.3389/fmolb.2022.758974
Received: 23 September 2021; Accepted: 24 January 2022;
Published: 09 February 2022.
Edited by:
Anton A. Buzdin, I.M. Sechenov First Moscow State Medical University, RussiaReviewed by:
Cristiana Tanase, Victor Babes National Institute of Pathology (INCDVB), RomaniaCopyright © 2022 Tian, Meng, Wang, Diao, Hu, Wang, Zhang, Liu and Wang. This is an open-access article distributed under the terms of the Creative Commons Attribution License (CC BY). The use, distribution or reproduction in other forums is permitted, provided the original author(s) and the copyright owner(s) are credited and that the original publication in this journal is cited, in accordance with accepted academic practice. No use, distribution or reproduction is permitted which does not comply with these terms.
*Correspondence: Jianye Wang, d2FuZ2p5Ymp5eUAxMjYuY29t; Ming Liu, bGl1bWluZ2JqeXlAMTI2LmNvbQ==; Yaqun Zhang, emhhbmd5cWJqeXlAMTI2LmNvbQ==
Disclaimer: All claims expressed in this article are solely those of the authors and do not necessarily represent those of their affiliated organizations, or those of the publisher, the editors and the reviewers. Any product that may be evaluated in this article or claim that may be made by its manufacturer is not guaranteed or endorsed by the publisher.
Research integrity at Frontiers

Learn more about the work of our research integrity team to safeguard the quality of each article we publish.