
94% of researchers rate our articles as excellent or good
Learn more about the work of our research integrity team to safeguard the quality of each article we publish.
Find out more
ORIGINAL RESEARCH article
Front. Mol. Biosci. , 16 March 2022
Sec. Molecular Diagnostics and Therapeutics
Volume 9 - 2022 | https://doi.org/10.3389/fmolb.2022.756895
This article is part of the Research Topic Targetable RNA and Tumor Heterogeneity View all 4 articles
 Cheng Yang†
 Junqiang Li†
 Yongdong Guo†
 Dongxue Gan
 Chao Zhang
 Ronglin Wang
 Lei Hua
 Liaoliao Zhu
 Peixiang Ma
 Jingjie Shi
 Shanshan Li
 Haichuan Su*
Objective: To explore the expression of the transferrin receptor (TFRC) gene in pancreatic cancer and to analyze the pathogenesis and immunotherapy of TFRC in patients using bioinformatics methods.
Methods: We used public data from the cancer genome atlas (TCGA) and gene expression omnibus databases to explore the expression level of the TFRC gene in pancreatic cancer patients. At the same time, we analyzed the correlation between the TFRC gene expression and patient survival, and further analyzed the correlation between TFRC and survival time of patients with different clinicopathological characteristics. Co-expressed genes and pathway enrichment analyses were used to analyze the mechanism of the TFRC in the occurrence and development of pancreatic cancer. Ultimately, we used the R software to examine the relationship between TFRC and immune phenotypes and immune cell infiltration using the TCGA database.
Results: The results of the study showed that TFRC is highly expressed in pancreatic cancer tissue. The upregulated expression of TFRC was negatively correlated with the survival in patients with pancreatic cancer. The bioinformatics analysis showed that TFRC plays a role in the occurrence and development of pancreatic cancer mainly through signaling pathways (including cell adhesion molecule binding, condensed chromosomes, chromosome segregation, and cell cycle checkpoints). Finally, TFRC is associated with immune phenotypes and immune cell infiltration, which may influence immunotherapy.
Conclusion: TFRC is significantly increased in pancreatic cancer and is associated with a poor prognosis. Moreover, research on TFRC may generate new ideas for the immunotherapy of pancreatic cancer.
As a common gastrointestinal malignancy, pancreatic cancer is the 10th most common malignancy in the US. (Siegel et al., 2021) resulting in a high mortality rate over the past 20 years (Mizrahi et al., 2020). The occurrence and development of pancreatic cancer is a complex process with multi-stage and multi-gene involvement caused by a variety of factors, including the comprehensive effect of various external factors such as inflammation and diet, as well as internal factors such as gene mutations (Chen et al., 2020; Huber et al., 2020; Mizrahi et al., 2020). Although chemotherapy, radiotherapy, and immunotherapy (Schizas et al., 2020) for pancreatic cancer (Heinrich and Lang, 2017; Hosein et al., 2020) were broadly studied in the recent years, the early symptoms of pancreatic cancer are not clear and there is a lack of knowledge about specific biomarkers (Lee & Lee., 2014; Pereira et al., 2020; Zhang et al., 2018). Due to this, patients are often diagnosed at an advanced stage (Ansari et al., 2016; Chu et al., 2017; Goral, 2015; Wolfgang et al., 2013) with a poor prognosis (Mizrahi et al., 2020). Thus, specific biomarkers for the diagnosis and prognosis of pancreatic cancer should be urgently explored.
The transferrin receptor (TFRC) gene encodes a cell surface receptor that is required for cellular iron uptake. The receptor transports iron from the outside to the inside of the cell via the receptor-mediated endocytosis, which is important for cell growth. At the same time, TFRC has multiple alternatively spliced variants. TFR1 expressed highly in erythroblasts and rapidly proliferating cells, such as cancer cell. As a type II transmembrane glycoprotein, it can mediate endocytosis of iron bound by transferrin (TF), playing a major role in iron uptake (Kawabata, 2019). Conversely, although TFR2 is expressed in a variety of tissues, it plays a lesser role in iron transport. A previous study used quantitative seroproteomics to identify antibody biomarkers in pancreatic tissue and found that TFRC is a pancreatic cancer-associated antigen (Jhaveri et al., 2016). Another study reported that (Camp et al., 2013) transferrin receptors targeting wild-type p53 gene nanomedicines make pancreatic cancer sensitive to gemcitabine therapy. Moreover, TFRC can be used as a malignant marker of pancreatic cancer and pancreatic neuroendocrine tumor (Ryschich et al., 2004). However, the mechanism of TFRC in pancreatic cancer and its relationship with clinicopathological parameters in pancreatic cancer remain unclear.
As a new type of cancer therapy, immunotherapy has achieved good results in various cancers (Riley et al., 2019). However, because of the unique tumor microenvironment and low cancer immunogenicity in pancreatic cancer (Wang et al., 2020), single-agent immunotherapy is not effective in treating pancreatic cancer (Bear et al., 2020). Novel immunotherapy strategies include immune checkpoint inhibitors, cancer vaccines, adoptive cell transfer, combinations with other immunotherapeutic agents, chemoradiotherapy, or other molecularly targeted agents (Schizas et al., 2020). We think TFRC may play a role in various immunotherapy as a membrane protein associated with iron death.
This study deployed large sample data from databases and biochemical experiments to explore the expression level and clinical application of TFRC in pancreatic cancer. We also analyzed the mechanism of TFRC and its role in immunotherapy using bioinformatics technology to provide suggestions for pancreatic cancer.
We obtained three pairs of surgically resected pancreatic cancers and corresponding peritumoral tissues from the Xi-jing Hospital and immediately stored them in liquid nitrogen. The patients that met the 2020 cancer diagnostic criteria signed informed consent before the experiment. The experiment was approved by the ethics committee of the Air Force Military Medical University.
Normal pancreatic cells (HPDE6-C7) and pancreatic cancer cell lines (PANC-1, MIAPaCa-2, PaTu8988T, SW 1990, Canpan-2, BXPC-3, HPAF-II, and Capan-1) were obtained from Procell Life Science and Technology Company (Wuhan, China) and BeNa Culture Collection (BNCC, Beijing, China). The cells were cultured in the recommended medium (10% fetal bovine serum) and kept in a CO2-free humidifying incubator at 37°C.
Normal pancreatic cells and pancreatic cancer cell lines were lysed using lysis buffer (Applygen, Beijing, China) with a phosphatase and protease inhibitor cocktail (Roche, Branchburg, USA). Sodium dodecyl sulphate–polyacrylamide gel electrophoresis was used to fractionate the protein samples, and the protein bands were transferred onto a gel. After being blocked by using 5% nonfat milk for 3 h, polyvinylidene difluoride (PVDF) membranes were incubated using antibodies TFRC (1:1,000, 10084-2-AP, proteintech) and glyceraldehyde 3-phosphate dehydrogenase (1:1,0000, AC002, abcolone) overnight at 4°C. Then, we used horseradish peroxidase-conjugated secondary antibodies to incubate the PVDF membranes. In the end, the protein bands were detected using a Tanon-5200 hemiluminescent system (Shanghai, China).
Tumor tissue sections and peritumoral tissue sections were deparaffinized using xylene and then rehydrated using different concentrations of ethanol. We inhibited endogenous hydrogen peroxide activity with 3% hydrogen peroxide and immediately repaired the antigen using hot citric acid buffer. Then, 5% normal goat serum was used to block the tissue sections. The sections were subsequently washed in phosphate-buffered saline (PBS) and incubated overnight at 4°C with the antibody against TFRC (1:100, 10084-2-AP, Proteintech) and CD3 (1:6400, 60181-1-Ig, Proteintech). On the next day, after washing in PBS solution for 10 min, the peroxidase-conjugated secondary antibody was used to incubate the microarray and sections for 30 min. Then, these tissue microarray and tumor tissue sections were stained with diaminobenzidine for 3 min. Finally, the slides were counterstained with haematoxylin.
We downloaded the mRNA sequencing data and associated clinical information from the cancer genome atlas (TCGA) database, which involved 177 tumor tissues and four normal tissues. Furthermore, we downloaded other mRNA expression data from the GSE15471, GSE16515, GSE62452 and GSE45757 datasets from the gene expression omnibus (GEO) database. As these data are public network resources, the use of this particular data did not require any ethical approval or informed consent.
We used GEPIA (a web-based tool for analyzing the data provided by TCGA) to analyze the prognostic value of TFRC expression in pancreatic adenocarcinoma (PAAD) patients and calculate the hazard ratio (HR) with 95% confidence and log-rank p-value. The statistical package for the social sciences (SPSS) software was applied for multivariate and univariate analyses based on the TCGA data to determine whether it was an independent prognostic factor or not.
To further explore the TFRC-related molecular mechanisms in pancreatic cancer, we used the cBioPortal database (https://www.cbioportal.org/) to identify co-expressed genes and related miRNAs. Subsequently, we selected 10 genes and several miRNAs that were significantly correlated with TFRC for further analysis and verified their correlation with TFRC in the tumor immune estimation resource (TIMER) database.
We used STRING (a search tool for the retrieval of interacting genes) to construct the TFRC and related gene–protein interaction network with several aspects (interaction, co-expression, and co-localization). After the standard network diagram was constructed, the Cytoscape software was imported to beautify the network diagram.
We used the David (https://david.ncifcrf.gov/) online database to analyze the gene ontology (GO) and kyoto encyclopedia of genes and genomes (KEGG) pathways of TFRC and related genes. GO analysis includes biological processes (BP), molecular functions (MF), and cellular components (CC). Statistical significance was set at p < 0.05, while data visualization was executed using the GraphPad Prism5 software.
We evaluated the immune characteristics of TFRC in pancreatic cancer from four aspects: infiltration level of tumor infiltrating immune cells (TIICs), expression of inhibitory immune checkpoints, expression of immunomodulators, and activity of the cancer immunity cycle. The invasion level of TIICs in the tumor microenvironment was calculated using a variety of algorithms based on bulk RNA-seq data. Then, we examined the relationship between TFRC and common immune checkpoints (CTLA4, LAG3, PD1, and PDL1) in pan-cancer. We also collected information on 144 immunomodulators, including immune inhibitors, immune stimulators, MHC, chemokines, and receptors, and analyzed their relationship. Previous studies (Hu et al., 2021) have reported that a cancer immunity cycle reflects the anticancer immune response and comprises seven steps: release of cancer cell antigens (Step 1), cancer antigen presentation (Step 2), priming and activation (Step 3), trafficking of immune cells to tumors (Step 4), infiltration of immune cells into tumors (Step 5), recognition of cancer cells by T cells (Step 6), and killing of cancer cells (Step 7). We analyzed the correlation between TFRC and the cancer immunity cycle. We further evaluated the role of TFRC in immunotherapy by selecting some immune-checkpoint-relevant and immune-activity-relevant genes (Zhang et al., 2020) in PAAD. In addition, TIDE (Jiang et al., 2018) is a computational method to model two primary mechanisms of tumor immune evasion, we analyzed the correlation between TFRC and Interferon-gamma (IFNG) signature, microsatellite instability (MSI) signature, macrophage M2 type and TIDE score.
We used SPSS 20.0, GraphPad Prism 5 and R version 4.1.0 software to perform the data analysis and create plots and figures. We used the mean ± SD (standard deviation) to express the measurement characteristics. This is the basis for the analysis of the differential expression of TFRC in tumors and non-tumors of pancreatic cancer patients from the TCGA and GEO databases by Student’s t test. Moreover, the association between TFRC and clinical characteristic variables was analyzed using the Pearson chi-squared test. At the last step, the univariate and multivariate analyses of TFRC were conducted using Cox proportional hazards analysis.
We analyzed TCGA data related to TFRC expression levels in a variety of cancers (Figure 1A). Then, we investigated the difference in the expression levels of TFRC mRNA between pancreatic cancer and normal pancreas, and found that their levels were significantly higher in pancreatic cancer than that in normal pancreas (Figure 1B). Subsequently, we used the paired t-test to determine TFRC mRNA expression levels in pancreatic cancers and corresponding peritumoral tissues based on the data from the GEO database (Figures 1C–E). Then, we used immunohistochemistry to test the differences about TFRC protein levels in pancreatic tissues (Figure 1F). Besides, we found the same thing at the cellular level. The result of western blot showed that TFRC expression was significantly lower in normal pancreatic cell (HPDE6-C7) than that in pancreatic cancer cells (PANC-1, MIAPaCa-2, PaTu8988T, SW 1990, Canpan-2, BXPC-3, HPAF-II, Capan-1) (Figure 1G). Meanwhile, we verified TFRC mRNA levels in one pancreatic cell and 22 pancreatic cancer cell lines, which shows the TFRC mRNA levels were higher in most pancreatic cancer cell lines than in normal cell (Figure 1H).
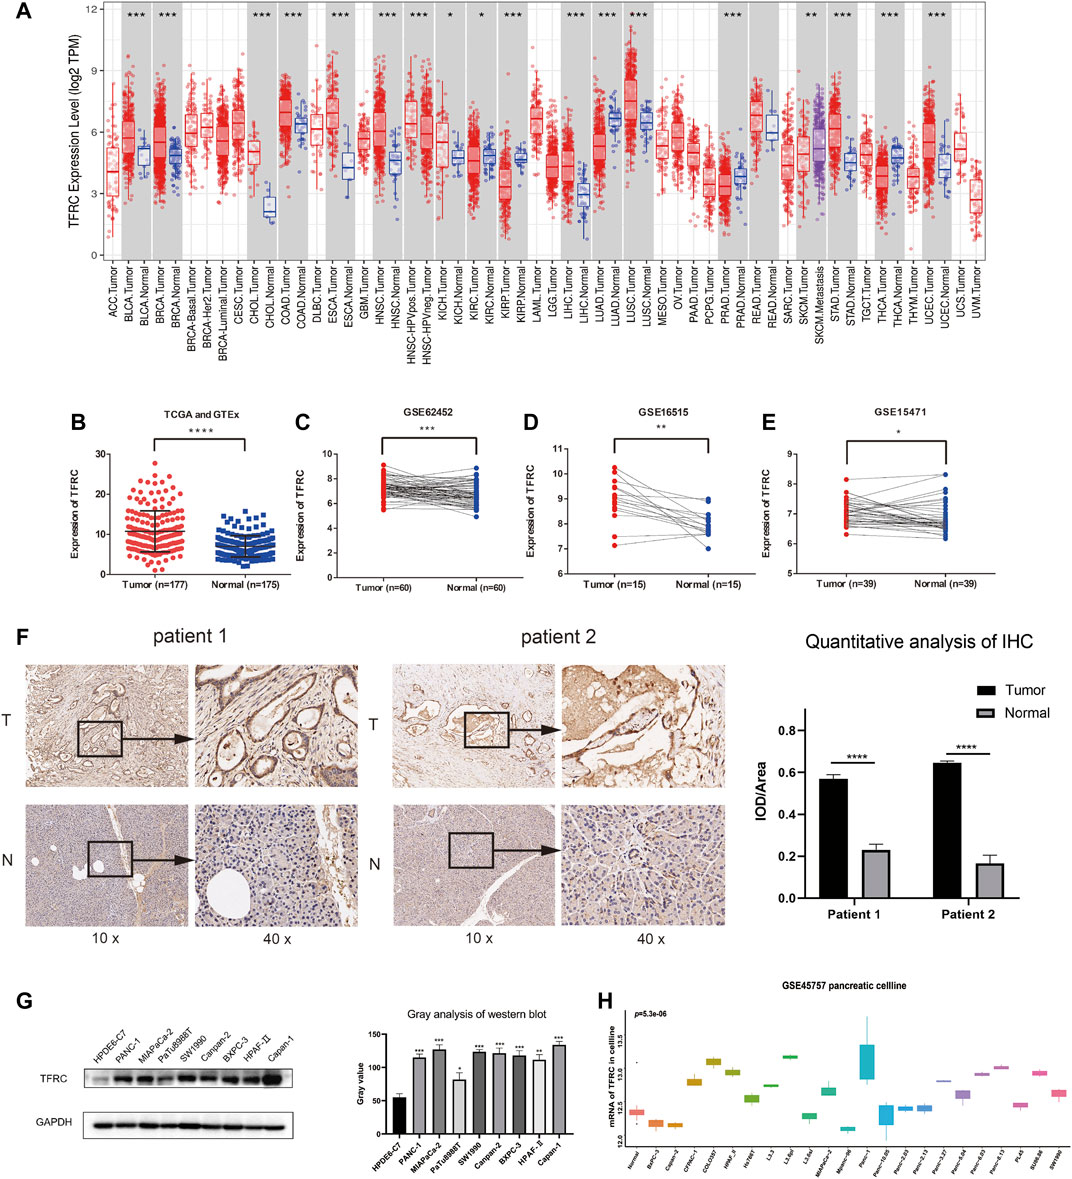
FIGURE 1. TFRC expression is elevated in pancreatic cancer. (A) TFRC mRNA is significantly higher in several cancer, including PAAD. (B) The difference in TFRC mRNA between pancreatic cancer and normal pancreas is significant (p < 0.0001). (C–E) In GEO database (GSE62452, GSE16515, GSE15471), TFRC mRNA is higher in pancreatic cancer tissues than corresponding peritumoral tissues (p = 0.0003, p = 0.0012, p = 0.0185). (F) Representative IHC staining of TFRC in matched PAAD and peritumoral tissues. (G) Western blotting shows TFRC protein expression levels in normal pancreatic cell (HPDE6-C7) and pancreatic cancer cell (PANC-1, MIAPaCa-2, PaTu8988T, SW 1990, Canpan-2, BXPC-3, HPAF-Ⅱ, Capan-1). (H) In GEO database (GSE45757), TFRC mRNA levels in normal pancreatic cell and pancreatic cancer cell.
Firstly, we use TCGA and GEO database to build ROC curve, and found the AUC = 0.856 (GSE16515) and 0.742 (TCGA and GTEx), which means the TFRC has diagnostic significance (Figure 2A). Then, we used GEPIA and found that the patients with high TFRC expression had poor overall survival (p = 0.036, group cutoff = median) and poor disease-free survival (p = 0.045, group cutoff = median) (Figure 2B). At the same time, the univariate analysis showed that grade (HR = 1.451, p = 0.011), tumor node metastasis classification (TNM) stage (HR = 1.279, p = 0.038), invasion depth (T) stage (HR = 1.614, p = 0.033), and lymph node (N) stage (HR = 1.598, p = 0.022), and TFRC expression (HR = 1.681, p = 0.043) influenced the overall survival of patients. (Figure 2C). However, the multivariate analysis did not help in defining the upregulated TFRC expression as an independent prognostic factor (Figure 2D).
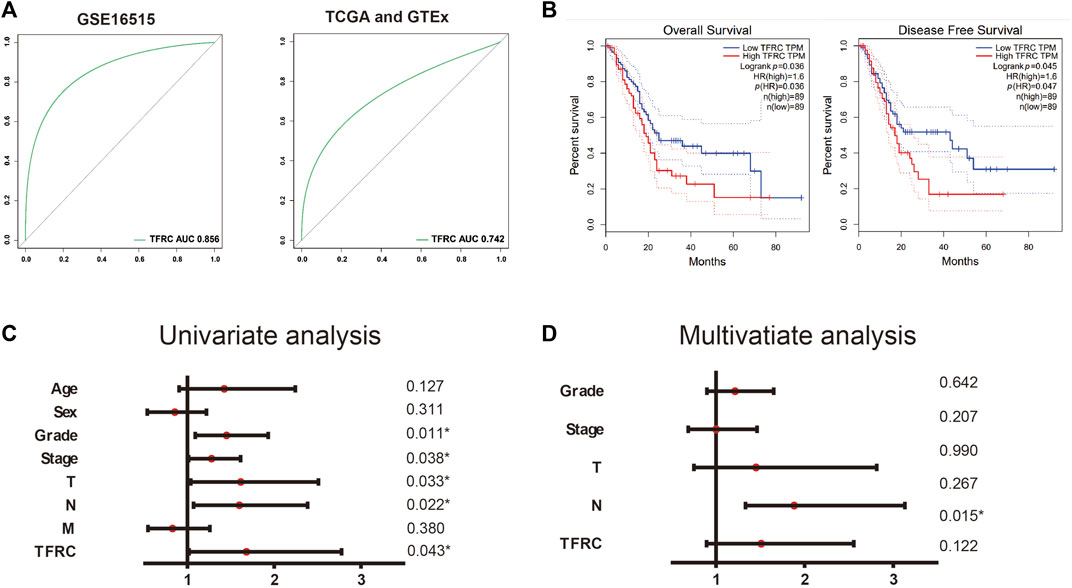
FIGURE 2. TFRC is a diagnostic and prognostic indicator. (A) ROC curve of TFRC about GSE16515 and TCGA. (B). Kaplan-Meier overall survival analysis of TFRC expression in patients with PAAD using TCGA samples (n = 178, p = 0.036, log-rank test), Kaplan-Meier disease-free survival analysis of TFRC expression in patients with PAAD using TCGA samples (n = 178, p = 0.035, log-rank test). (C, D) Univariate (C) and multivariate (D) analyses of the relationship of TFRC expression and overall survival with clinicopathological characteristics in TCGA samples.
To analyze the clinical value of TFRC in pancreatic cancer, we examined its relationship with the clinical factors of the patients. We used the median TFRC expression value to create a categorical dependent variable. The Pearson chi-squared test showed that TFRC expression was related to age (p = 0.001), pathological stage (Ⅰ vs. Ⅱ–Ⅳ, p = 5.97e-13), T stage (T1 vs. T2 vs. T3, T4, p = 0.047), and N stage (N0 vs. N1–Nx, p = 2.15e-05) (Table 1).
To further investigate the possible effect of TFRC in PAAD, the genes that were co-expressed with TFRC were identified using the STRING website with TCGA data (Figure 3A). The top ten significant genes correlated with TFRC were selected (Figure 3B). The results indicated that TFRC was significantly correlated with PGM2 (r = 0.6392, p = 7.537e−22), ECT2 (r = 0.5817, p = 1.671e-17), E2F8 (r = 0.581, p = 1.865e-17), MK167 (r = 0.5809, p = 1.9e−17), ESCO2 (r = 0.5662, p = 1.765e−16), DMAP1 (r = -0.5827, p = 1.431e−17), POMT1 (r = -0.5764, p = 3.813e-17), CIRBP (r = -0.5722, p = 7.218e-17), UCK1 (r = -0.5521, p = 1.374e−15) and R3HCC1 (r = -0.5465, p = 2.997e−15). Furthermore, the correlation between TFRC and these genes was verified using TIMER (Figure 3C). Besides, we used the database to analyze TFRC and these 10 genes in 46 pancreatic cell lines. (Figure 3D). Based on the above results, we found that TFRC was strongly correlated with ECT2 and E2F8.
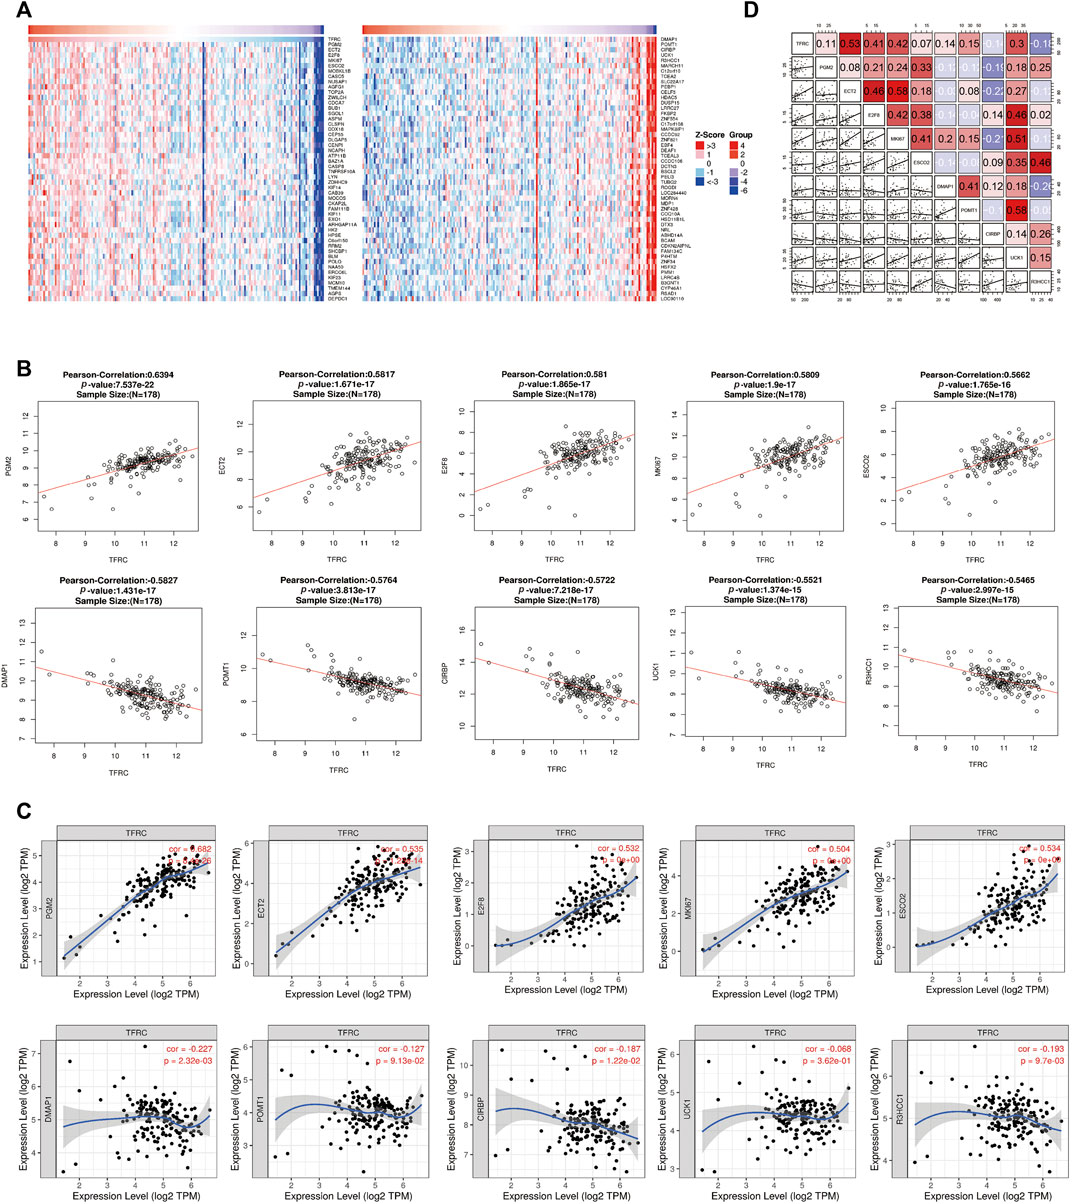
FIGURE 3. Correlative genes of TFRC in PAAD. (A) Heat map analysis of gene correlated with TFRC in pancreatic cancer samples. (B) The genes correlative with TFRC in PAAD (absolute Pearson’s r ≥ 0.5465) were assessed with the linkedomics database. TFRC was significantly correlated with PGM2 (r = 0.6392, p = 7.537e–22),ECT2 (r = 0.5817, p = 1.671e-17), E2F8 (r = 0.581, p = 1.865e-17), MK167 (r = 0.5809, p = 1.9e–17), ESCO2 (r = 0.5662, p = 1.765e–16), DMAP1 (r = −0.5827, p = 1.431e–17), POMT1 (r = −0.5764, p = 3.813e-17), CIRBP (r = −0.5722, p = 7.218e-17), UCK1 (r = −0.5521, p = 1.374e–15) and R3HCC1(r = −0.5465, p = 2.997e–15). (C) TFRC was significantly correlated with PGM2, ECT2, E2F8, MK167, ESCO2, DMAP1, POMT1, CIRBP, UCK1 and R3HCC1 in PAAD (via analysis in the TIMER database). (D) The relationship about TFRC and PGM2, ECT2, E2F8, MK167, ESCO2, DMAP1, POMT1, CIRBP, UCK1, R3HCC1 in 46 pancreatic cell lines.
Also, in order to analyze the relationship between TFRC and related miRNAs in PAAD and explore the molecular mechanism of TFRC, the STRING website analysis found that TFRC mainly interacts with mir-326, mir-378, mir-196b, mir-23a, mir-1247, mir-885, mir-30c-2, mir-2114, mir-488, and mir-190b (Figures 4A–C).
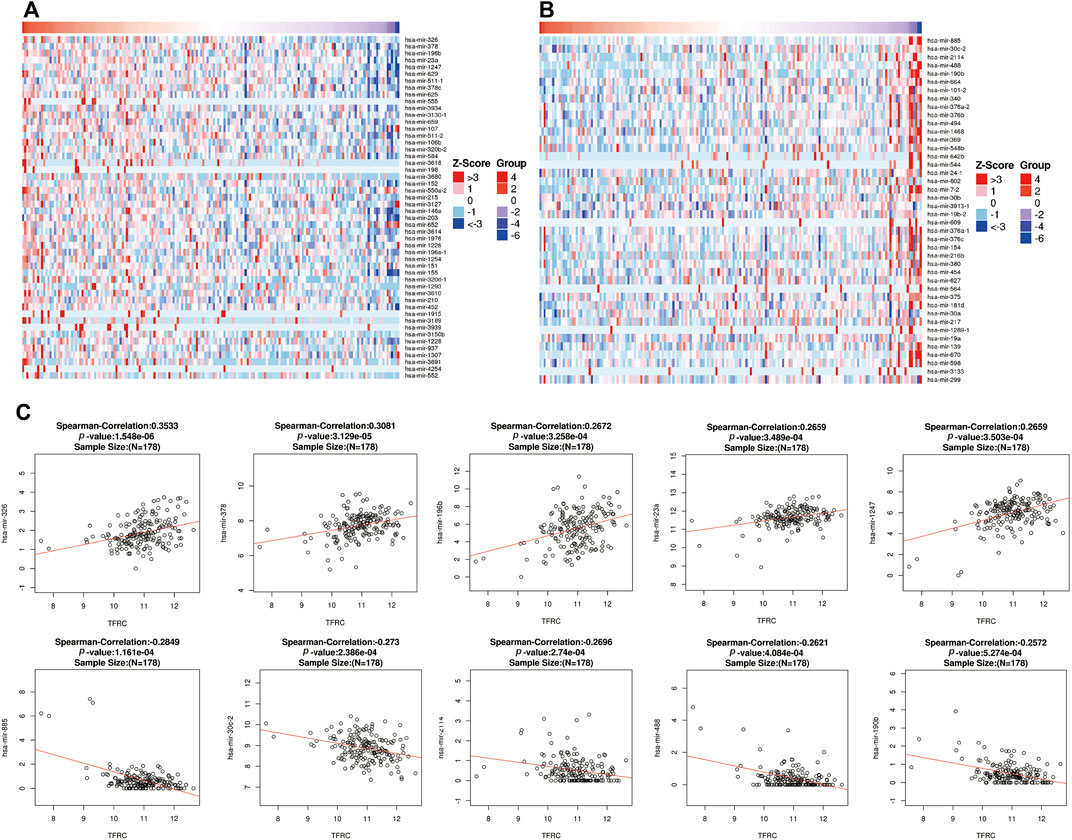
FIGURE 4. Correlative miRNAs of TFRC in PAAD. (A,B) Heat map analysis of miRNAs positively (A) and negatively (B) correlated with TFRC in pancreatic cancer samples. (C) The miRNAs correlative with TFRC in PAAD (absolute Pearson’s r ≥ 0.2391) were assessed with the STRING website. TFRC mainly interacts with mir-326, mir-378, mir-196, mir-23a, mir-1247, mir-885, mir-30c-2, mir-2114, mir-488 and mir-190b.
To analyze the relationship between TFRC and related proteins and to further study the molecular mechanism of TFRC, STRING analysis was conducted. It was found that TFRC mainly interacts with proteins such as ARF1, TGOLN2, LAMP1, VAMP2, and DNM2 to exert its function (as shown in Figure 5).
For better understanding of the molecular mechanism of TFRC, we performed GO (Table 2) and KEGG (Table 3; Figures 6G,H) enrichment analysis using the STRING website. In particular, the GO enrichment analysis divided the functional annotations of target genes into three categories: MF (Figures 6A,B), CC (Figures 6C,D), and BP (Figures 6E,F). In the KEGG and GO pathway analysis, some signaling pathways affected by TFRC are enriched during tumorigenesis. Cell adhesion molecule binding reflects the function of its surface position. Moreover, TFRC is associated with condensed chromosomes, chromosome segregation, and the cell cycle, so it may participate in cell division.
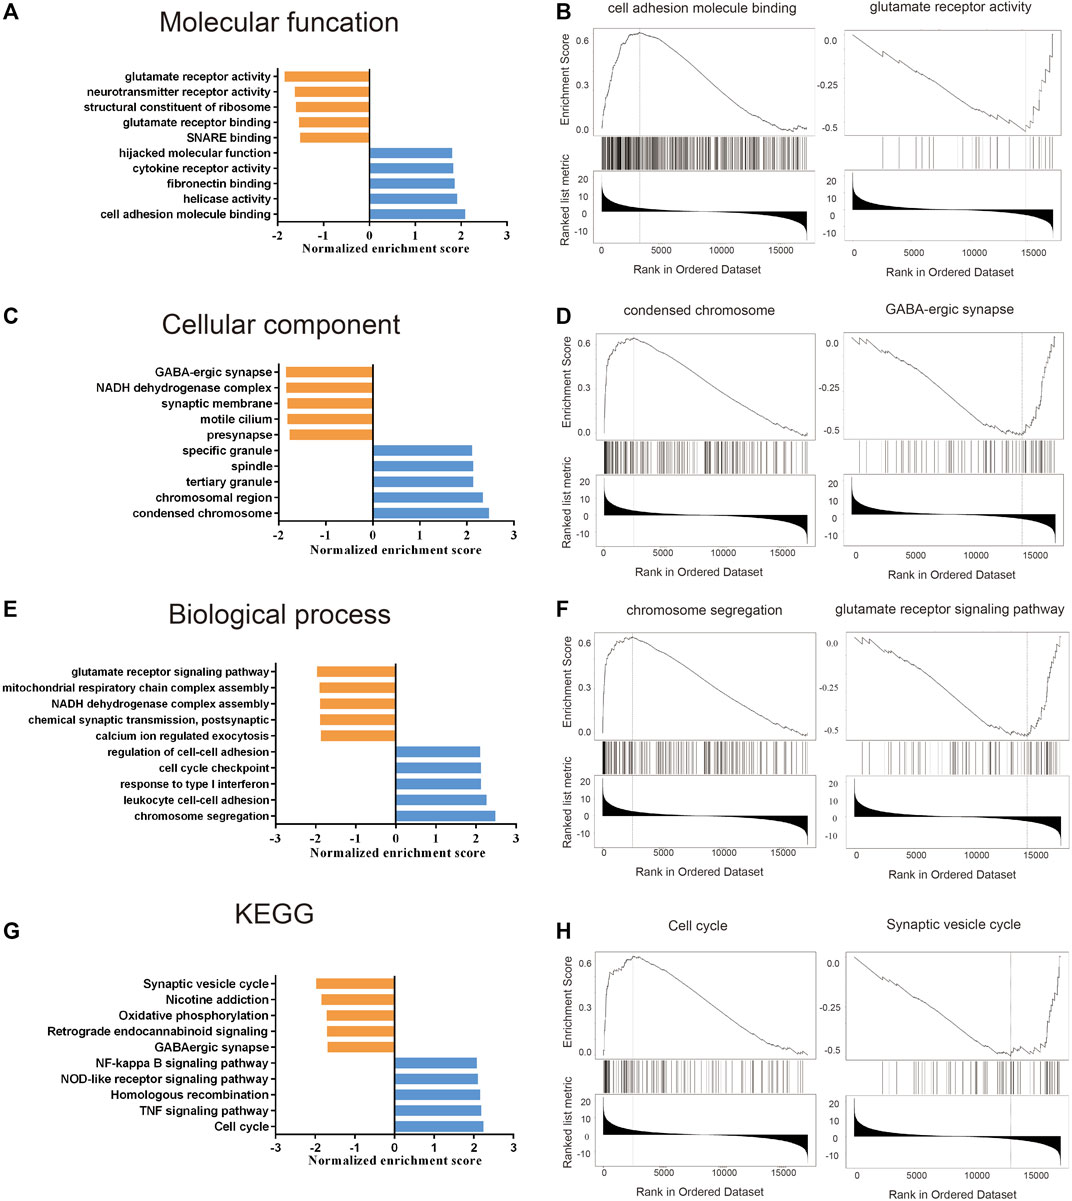
FIGURE 6. GO and KEGG enrichment analysis about TFRC based on the TCGA database. (A–F) GO enrichment analysis (including molecular function, cell components and Biological processes) about TFRC in PAAD. (G,H) KEGG enrichment analysis about TFRC in PAAD.
Firstly, we examined the relationship between TFRC and 144 immunomodulators, including immune inhibitors, immune stimulators, MHC, chemokines, and receptors in the TCGA cohort (Figure 7A). Then, we analyzed the immune activation of the high-TFRC and low-TFRC groups in the TCGA cohort. To this end, we selected several immune-related signatures, including immune-checkpoint-relevant signatures (CD274, CTLA4, HAVCR2, IDO1, LAG3, and PDCD1) and various immune-activity-related signatures (CD8A, CXCL10, CXCL9, GZMA, GZMB, PRF1, TBX2, and TNF). We used the Wilcoxon test to verify that the high-TFRC group had higher immune-related signatures, except for PDCD1, LAG3, and TBX2 (Figure 7B). Besides, we analyzed the activities of the cancer immunity cycles, which can evaluate the chemokine system and other immunomodulators. The high-TFRC group can activate several steps in the cycle, including the release of cancer cell antigens (Step 1), cancer antigen presentation (Step 2), trafficking of immune cells to tumors (Step 4) (CD8 T cells, MDSCs, neutrophils, TH1 cells, and TH22 cell recruiting), and infiltration of immune cells into tumors (Step 5) (Figure 7C). These steps may increase the number of infiltrating immune cells in the tumor microenvironment. Next, TFRC also enhances immunotherapy-positive gene signatures, including cell cycle, DNA replication, mismatch repair, P53 signaling pathway, and proteasome (Figure 7D). Subsequently, we used a butterfly heat map to determine the relationship between TFRC and the activities of the cancer immunity cycle (Figure 8A), immunotherapy-positive gene signatures (Figure 8B), immune cell infiltration (Figure 8C), and immune-relevant genes (Figure 8D) in PAAD. Overall, TFRC can used to predict immune phenotypes, molecular subtypes in PAAD, which can lay a foundation for new immunotherapies for pancreatic cancer.
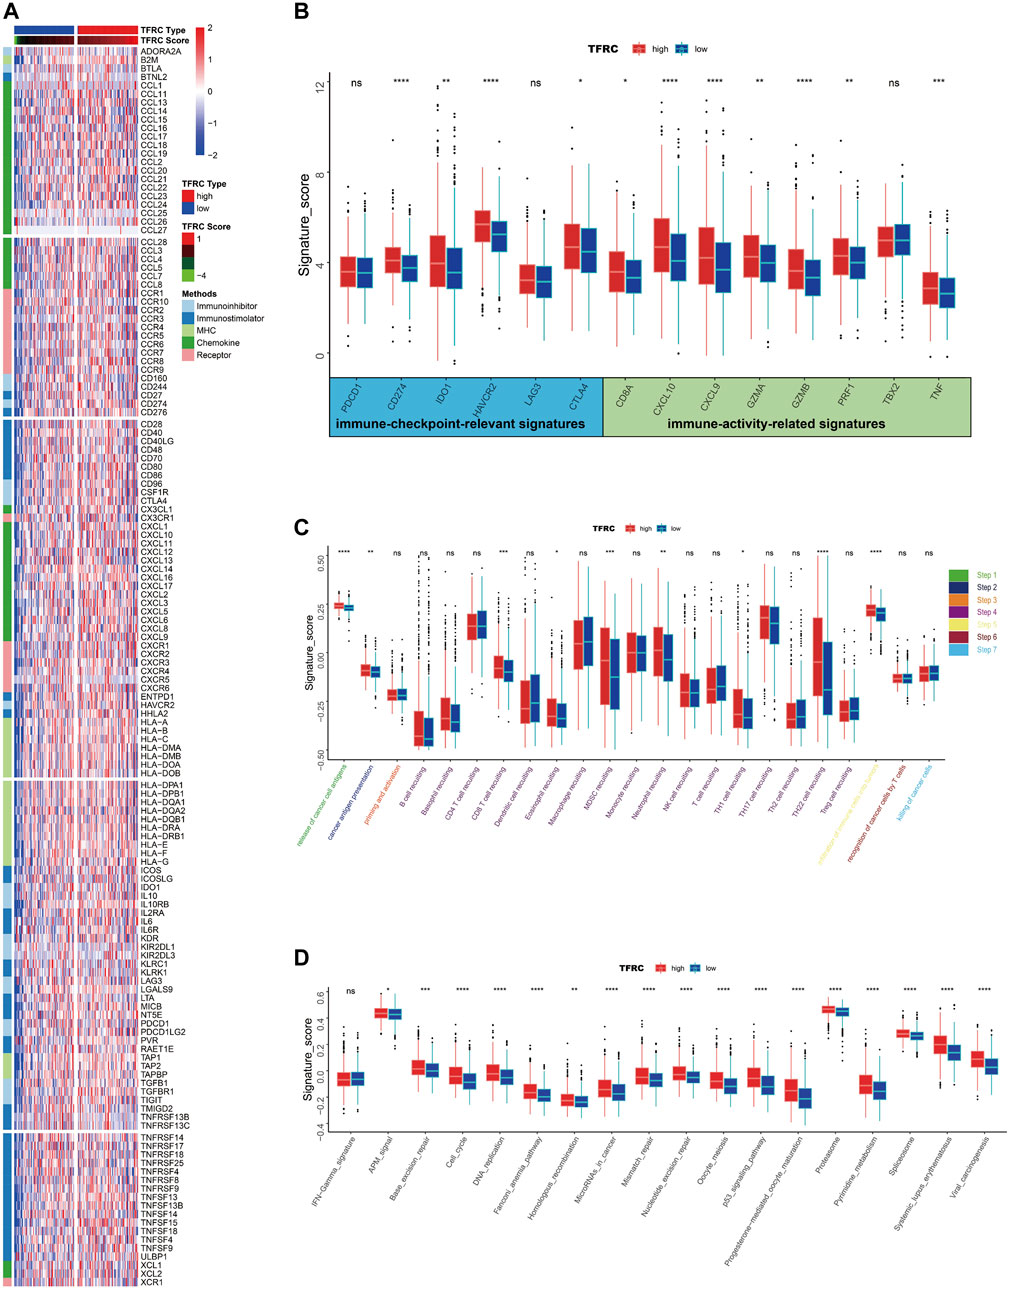
FIGURE 7. TFRC predicts immune phenotypes in pancreatic cancer. (A) Different expression of 144 immunomodulators (immune inhibitors, immune stimulators, MHC, chemokines and receptors) between high- and low-TFRC groups in pancreatic cancer. (B) Immune-checkpoint-relevant genes and immune-activation-relevant genes expressed in high- and low-TFRC groups. (C) Differences between high- and low-TFRC groups in each step of the cancer immune cycle. (D) Differences in immunotherapeutic pathway enrichment scores between high- and low-TFRC groups.
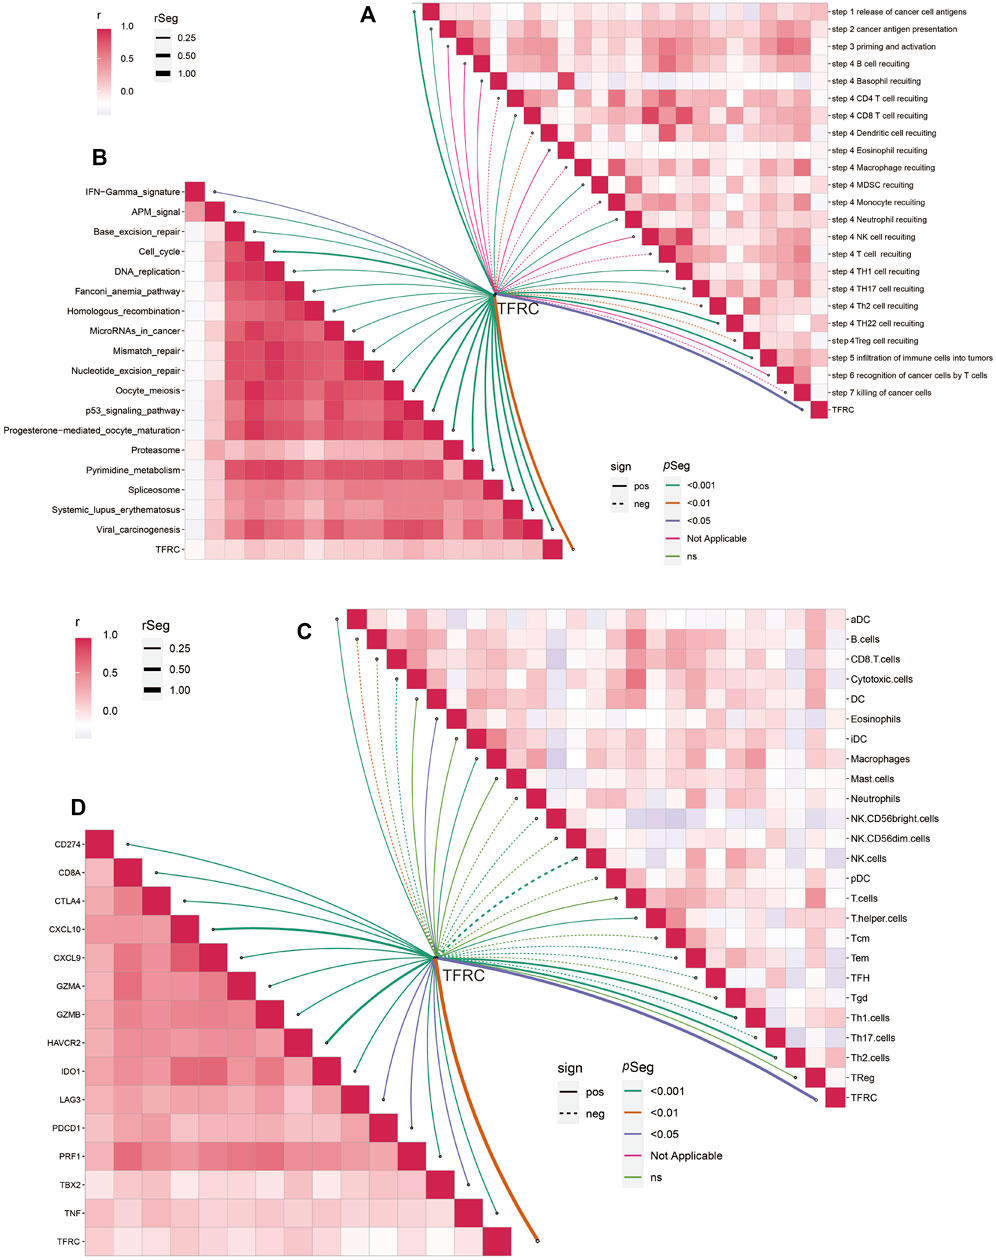
FIGURE 8. TFRC predicts immune phenotypes in pancreatic cancer. (A) Relationship between TFRC and various steps of the cancer immunity cycle. (B) Relationship between TFRC and the enrichment scores of immunotherapy-predicted pathways. (C) Relationship between TFRC and the tumor-infiltrating immune cell types. (D) Relationship between TFRC and Immune-checkpoint-relevant genes or immune-activation-relevant genes.
After analyzing the correlation between TFRC and immunophenotype, to further explore the relationship between TFRC and immunotherapy, we firstly calculated the immune cells infiltrating the tumor microenvironment on the strength of bulk RNA-seq data by using several algorithms (TIMER, CIBERSORT, quantiseq, MCPcounter, xCell, and EPIC) (Figure 9A). As a result, we found that the high expression levels of TFRC means more infiltrating immune cells. To verify the results of data analysis, we selected a common immune cell marker CD3 for immunohistochemical tests on tissues from three pancreatic cancer patients with high TFRC expression and observed numerous inflammatory infiltrates (Figure 9B). For the current common immunotherapy methods, we also demonstrated that TFRC was co-expressed with various immune checkpoints in several cancers, including PAAD (Figures 9C–F). Besides, tumor mutation burden (TMB) has always been considered as one of the criteria for immunotherapy, so we analyzed the TMB and found that it was positively correlated with TFRC (Figure 10A). Interferon-gamma (IFNG) signature and microsatellite instability (MSI) signature are also used to predicted the immunotherapy (Fu et al., 2020), so we used them to predict and got the same conclusion (Figures 10B,C). In addition, Peng Jiang (Jiang et al., 2018)developed TIDE (a computational method to model two primary mechanisms of tumor immune evasion), we found tumor associated macrophage M2 type (Fu et al., 2020) and TIDE score were negatively correlated with TFRC (Figures 10D,E), which further demonstrates the relationship between TFRC and immunotherapy.
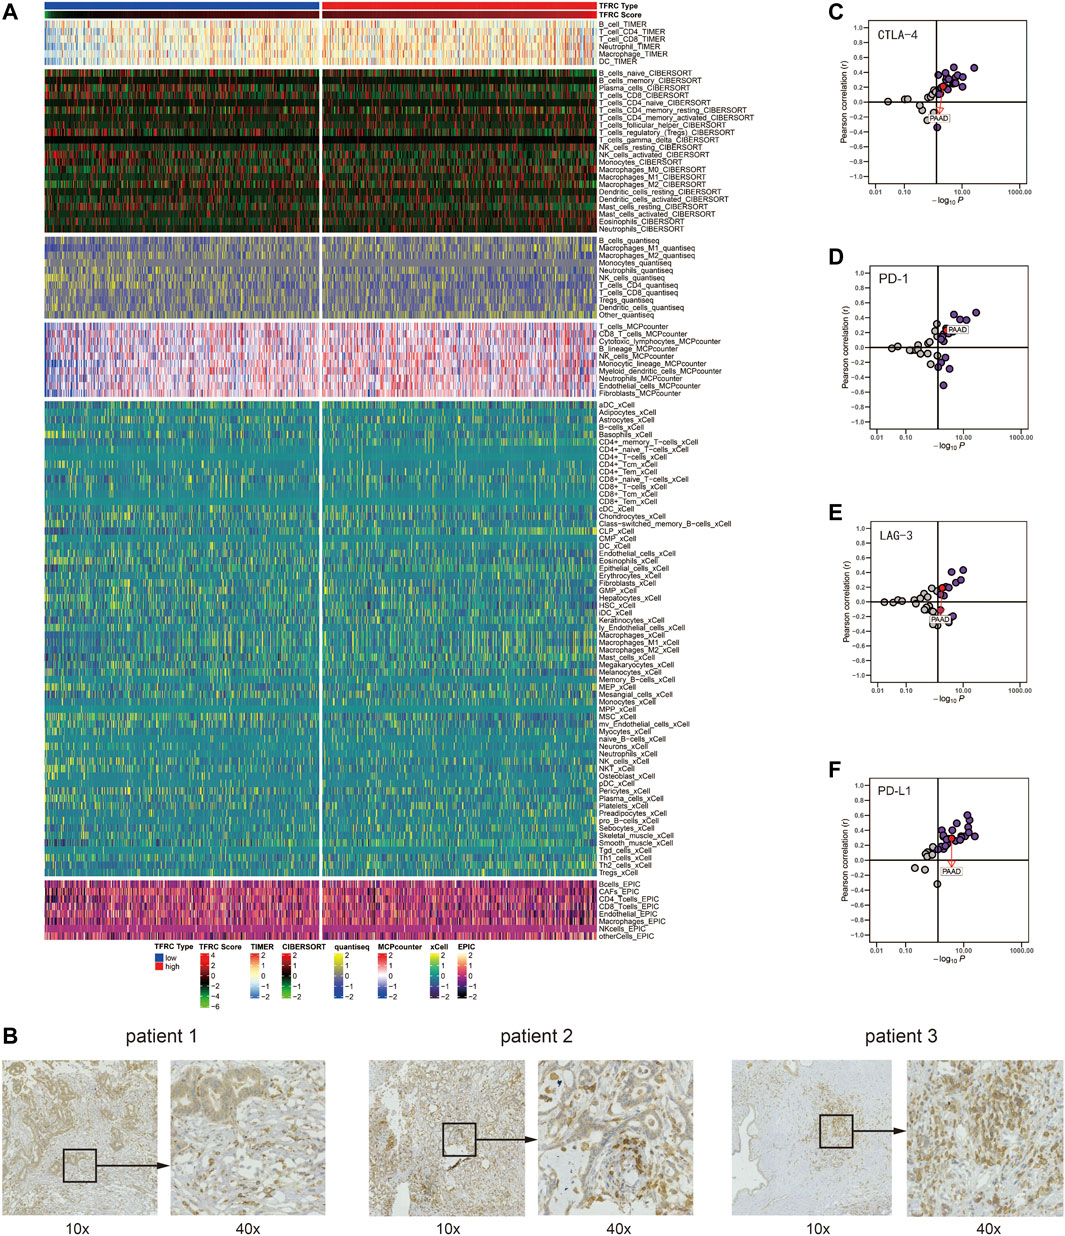
FIGURE 9. TFRC predicts immune cells infiltration in pancreatic cancer. (A) Correlation between TFRC and the infiltrating immune cells with six algorithms: TIMER, CIBERSORT, quantiseq, MCPcounter, xCell, and EPIC. (B). Representative IHC staining of CD3 in pancreatic cancer tissue. (C–F) Relationship between TFRC and CTLA-4, PD-1, LAG-3, PD-L1 in pan-cancer.
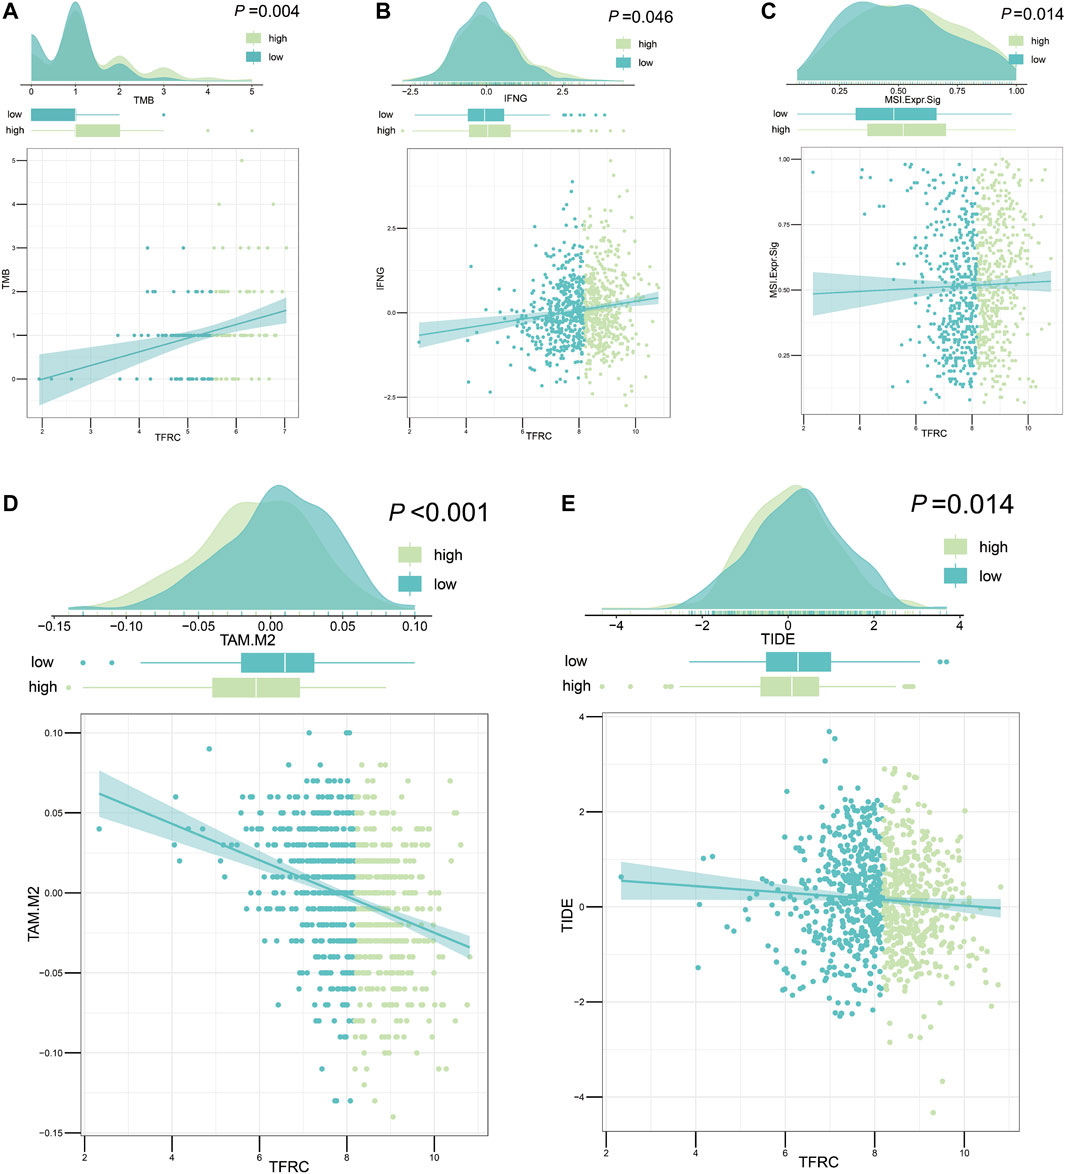
FIGURE 10. TFRC evaluates immunotherapy about pancreatic cancer. (A–C) TFRC was positively correlated with tumor mutation burden (p = 0.004) (A) interferon-gamma signature (p = 0.046) (B) and microsatellite instability signature (p = 0.014) (C). (D,E) TFRC was negatively correlated with tumor associated macrophage M2 type (p < 0.001) (D) and TIDE score (p = 0.014) (E).
Pancreatic cancer is a malignant tumor of the digestive tract and has a high mortality rate (Ansari et al., 2016; Mizrahi et al., 2020). China is a country with a high incidence of pancreatic cancer, which causes a serious social burden due to its high morbidity, mortality, and poor prognosis (Ilic and Ilic, 2016). In recent years, the treatment and prognosis of pancreatic cancer patients have improved given the improvements in treatment methods, but the survival rate is still low (Chu et al., 2017; Pereira et al., 2020; Wolfgang et al., 2013). Therefore, it is crucial to identify neutral biomarkers and related treatments for pancreatic cancer. In this study, we used bioinformatics and biochemical experiments to verify that the expression level of TFRC was increased in pancreatic cancer tissues and was associated with a poor prognosis. In addition, TFRC expression was significantly associated with clinical characteristics. We also analyzed the GO and KEGG pathways of TFRC and constructed a protein interaction network for TFRC. Cell adhesion molecule binding, helicase activity, fibronectin binding, cytokine receptor activity, chromosome segregation, leukocyte cell-cell adhesion, response to type I interferon, cell cycle checkpoint, and regulation of cell-cell adhesion may be related to signaling pathways regulated by TFRC in pancreatic cancer. These results indicate that TFRC participates in the formation of pancreatic cancer, which may be used as a biomarker and therapeutic site for a pancreatic cancer. Moreover, TFRC can be used for prediction of immune phenotypes and immune cell infiltration in pancreatic cancer. TFRC is positively associated with many immunomodulators and is co-expressed with several significant immune checkpoints. The cancer immunity cycle can also be activated in high-TFRC stations, and most immunotherapy-positive genes are high. Overall, TFRC can be applied to predict immune phenotypes, molecular subtypes, and immune cell infiltration in PAAD, which, in turn, can create a basis for new immunotherapies for pancreatic cancer in the future.
Some previous studies have classified cancers according to their immune infiltration (Nuti et al., 2018). The system, which classifies cancers through immunity rather than the cancer-based tumor classification, effectively introduces the concepts of “hot” (highly invasive) and “cold” (non-invasive) tumors (Galon and Bruni, 2019; Nuti et al., 2018). Pancreatic cancer is a highly malignant cancer with less immune invasion and is often classified as a cold tumor. At present, a combination of multiple immunotherapies is often used to overcome the lack of immune response in cold tumors and transform cold tumors into hot tumors. In pancreatic cancer, TFRC is associated with the tumor immune cycle by analyzing the relationship between TFRC and the immune cycle. The high-TFRC group recruited more immune cells, and infiltrating immune cells (dendritic cells, macrophages, Th1 cells, and Th2 cells) was increased in the high-TFRC group. Therefore, high TFRC expression often leads to a relatively “hot” tumor microenvironment. The relative efficacy of immunotherapy may be better due to the presence of a relatively high number of infiltrating immune cells and increased immune checkpoints. Moreover, TFRC, as a molecular protein on the cell surface that includes cell adhesion molecule binding, may be used in the future for CAR-T therapy related to pancreatic cancer immunotherapy (by targeting TFRC to induce the patient’s own immune cells to attack the tumor). We can apply these two immunotherapies together by using this method to unravel new therapeutic possibilities for patients with pancreatic cancer (Figure 11). Thus far, our laboratory has carried out CAR-T therapy, while the combination therapy would be clinically validated in the future.
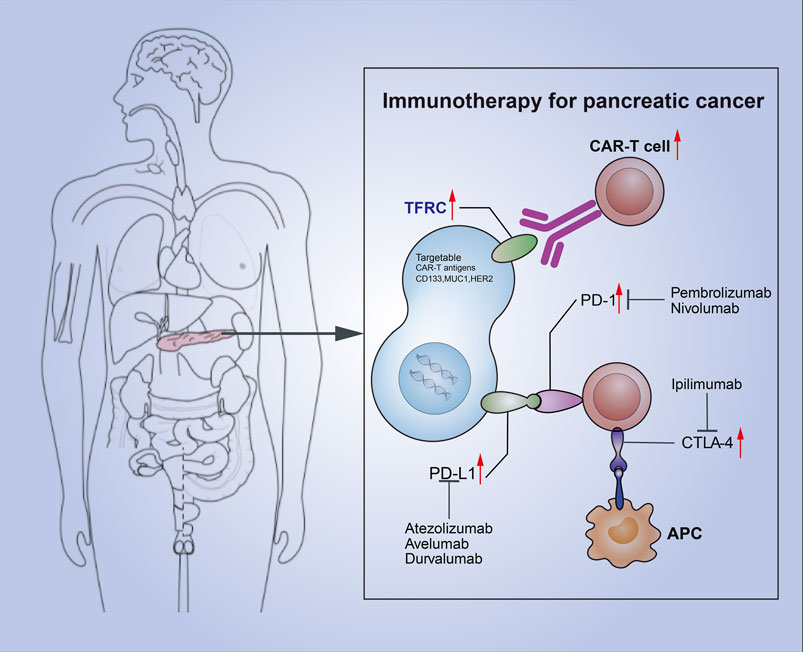
FIGURE 11. Combination of TFRC-associated CAR-T and immune checkpoint suppression for pancreatic cancer.
TFRC has been also extensively studied in other cancers. In the nervous system, the N-Myc proto-oncogene (MYCN) maintains TFRC expression in proliferating neural cells (Menon et al., 2019). Additionally, a subtype of TFRC is positively associated with the infiltration abundances of immune cells in breast cancer, and it is also considered to be a potential target for immunotherapy in breast cancer (Chen et al., 2021) (Corte-Rodríguez et al., 2019). Some studies have discovered that TFRC controls malignant behavior and stemness of tumor stem cells in hepatocellular carcinoma by regulating iron accumulation, which may improve therapeutic approaches (Xiao et al., 2020). In human fibrosarcoma cells, TFRC is a specific ferroptosis marker (Feng et al., 2020). TFRC is also highly expressed in hematological tumors; erythroid lineage cells and proliferating cells both have high surface TFRC expression. TFRC is the highest in T lymphoblasts (Acharya and Kala, 2019). Therefore, the findings of our current study should be comprehended alongside with the previous studies’ results, as we found that TFRC is involved in the occurrence and development of many cancers. In future studies, it is very important to focus on the basic and clinical research of TFRC.
The drawback of this study stems from the fact that the relevant data were obtained only from online databases. Although the results have certain suggestive significance, they also have certain limitations and need to be combined with relevant in vitro and in vivo experiments and practical results of the clinical studies should be further verified. This study can become an important step for the following basic and clinical studies of TFRC in pancreatic cancer, thus, further providing scientific arguments and evidences. Further studies are needed to explore the function of TFRC in pancreatic cancer as they will help to generate new ideas for the early diagnosis, targeted therapy, and prognosis judgment of patients.
To conclude, we used bioinformatics and biochemical experiments to verify that the level of TFRC is higher in pancreatic cancer than that in healthy pancreas. High-TFRC is also associated with a poor prognosis and is related to tumor immunology, suggesting that TFRC may be a potential prognostic molecular predictor for pancreatic cancer patients.
The datasets presented in this study can be found in online repositories. The names of the repository/repositories and accession number(s) can be found below: https://www.ncbi.nlm.nih.gov/genbank/, 7037.
Written informed consent was obtained from the individual(s) for the publication of any potentially identifiable images or data included in this article.
Experimental design: HS, JL Article writing and biochemical experiment: CY Data processing: YG, CZ Molecular screening: DG Data collection: RW, JS, LH, PM, LZ, and SL.
The authors declare that the research was conducted in the absence of any commercial or financial relationships that could be construed as a potential conflict of interest.
All claims expressed in this article are solely those of the authors and do not necessarily represent those of their affiliated organizations, or those of the publisher, the editors and the reviewers. Any product that may be evaluated in this article, or claim that may be made by its manufacturer, is not guaranteed or endorsed by the publisher.
Acharya, S., and Kala, P. (2019). Role of Cd71 in Acute Leukemia- an Immunophenotypic Marker for Erythroid Lineage or Proliferation? Indian J. Pathol. Microbiol. 62 (3), 418–422. doi:10.4103/IJPM.IJPM_604_18
Ansari, D., Tingstedt, B., Andersson, B., Holmquist, F., Sturesson, C., Williamsson, C., et al. (2016). Pancreatic Cancer: Yesterday, Today and Tomorrow. Future Oncol. 12 (16), 1929–1946. doi:10.2217/fon-2016-0010
Bear, A. S., Vonderheide, R. H., and O'Hara, M. H. (2020). Challenges and Opportunities for Pancreatic Cancer Immunotherapy. Cancer Cell 38 (6), 788–802. doi:10.1016/j.ccell.2020.08.004
Camp, E. R., Wang, C., Little, E. C., Watson, P. M., Pirollo, K. F., Rait, A., et al. (2013). Transferrin Receptor Targeting Nanomedicine Delivering Wild-type P53 Gene Sensitizes Pancreatic Cancer to Gemcitabine Therapy. Cancer Gene Ther. 20 (4), 222–228. doi:10.1038/cgt.2013.9
Chen, F., Fan, Y., Hou, J., Liu, B., Zhang, B., Shang, Y., et al. (2021). Integrated Analysis Identifies Tfr1 as a Prognostic Biomarker Which Correlates with Immune Infiltration in Breast Cancer. Aging 13 (17), 21671–21699. doi:10.18632/aging.203512
Chen, G., Guo, G., Zhou, X., and Chen, H. (2020). Potential Mechanism of Ferroptosis in Pancreatic Cancer (Review). Oncol. Lett. 19 (1), 579–587. doi:10.3892/ol.2019.11159
Chu, L. C., Goggins, M. G., and Fishman, E. K. (2017). Diagnosis and Detection of Pancreatic Cancer. Cancer J. 23 (6), 333–342. doi:10.1097/PPO.0000000000000290
Corte-Rodríguez, M., Blanco-González, E., Bettmer, J., and Montes-Bayón, M. (2019). Quantitative Analysis of Transferrin Receptor 1 (Tfr1) in Individual Breast Cancer Cells by Means of Labeled Antibodies and Elemental (Icp-ms) Detection. Anal. Chem. 91 (24), 15532–15538. doi:10.1021/acs.analchem.9b03438
Feng, H., Schorpp, K., Jin, J., Yozwiak, C. E., Hoffstrom, B. G., Decker, A. M., et al. (2020). Transferrin Receptor Is a Specific Ferroptosis Marker. Cel Rep. 30 (10), 3411–3423. doi:10.1016/j.celrep.2020.02.049
Fu, J., Li, K., Zhang, W., Wan, C., Zhang, J., Jiang, P., et al. (2020). Large-scale Public Data Reuse to Model Immunotherapy Response and Resistance. Genome Med. 12 (1), 21. doi:10.1186/s13073-020-0721-z
Galon, J., and Bruni, D. (2019). Approaches to Treat Immune Hot, Altered and Cold Tumours with Combination Immunotherapies. Nat. Rev. Drug Discov. 18 (3), 197–218. doi:10.1038/s41573-018-0007-y
Goral, V. (2015). Pancreatic Cancer: Pathogenesis and Diagnosis. Asian Pac. J. Cancer Prev. 16 (14), 5619–5624. doi:10.7314/apjcp.2015.16.14.5619
Heinrich, S., and Lang, H. (2017). Neoadjuvant Therapy of Pancreatic Cancer: Definitions and Benefits. Ijms 18 (8), 1622. doi:10.3390/ijms18081622
Hosein, A. N., Brekken, R. A., and Maitra, A. (2020). Pancreatic Cancer Stroma: an Update on Therapeutic Targeting Strategies. Nat. Rev. Gastroenterol. Hepatolgastroenterology Hepatology 17 (8), 487–505. doi:10.1038/s41575-020-0300-1
Hu, J., Yu, A., Othmane, B., Qiu, D., Li, H., Li, C., et al. (2021). Siglec15 Shapes a Non-inflamed Tumor Microenvironment and Predicts the Molecular Subtype in Bladder Cancer. Theranostics 11 (7), 3089–3108. doi:10.7150/thno.53649
Huber, M., Brehm, C. U., Gress, T. M., Buchholz, M., Alashkar Alhamwe, B., von Strandmann, E., et al. (2020). The Immune Microenvironment in Pancreatic Cancer. Ijms 21 (19), 7307. doi:10.3390/ijms21197307
Ilic, M., and Ilic, I. (2016). Epidemiology of Pancreatic Cancer. Wjg 22 (44), 9694–9705. doi:10.3748/wjg.v22.i44.9694
Jhaveri, D. T., Kim, M.-S., Thompson, E. D., Huang, L., Sharma, R., Klein, A. P., et al. (2016). Using Quantitative Seroproteomics to Identify Antibody Biomarkers in Pancreatic Cancer. Cancer Immunol. Res. 4 (3), 225–233. doi:10.1158/2326-6066.CIR-15-0200-T
Jiang, P., Gu, S., Pan, D., Fu, J., Sahu, A., Hu, X., et al. (2018). Signatures of T Cell Dysfunction and Exclusion Predict Cancer Immunotherapy Response. Nat. Med. 24 (10), 1550–1558. doi:10.1038/s41591-018-0136-1
Kawabata, H. (2019). Transferrin and Transferrin Receptors Update. Free Radic. Biol. Med. 133, 46–54. doi:10.1016/j.freeradbiomed.2018.06.037
Lee, E. S., and Lee, J. M. (2014). Imaging Diagnosis of Pancreatic Cancer: a State-Of-The-Art Review. Wjg 20 (24), 7864–7877. doi:10.3748/wjg.v20.i24.7864
Menon, V., Thomas, R., Elgueta, C., Horl, M., Osborn, T., Hallett, P. J., et al. (2019). Comprehensive Cell Surface Antigen Analysis Identifies Transferrin Receptor Protein-1 (Cd71) as a Negative Selection Marker for Human Neuronal Cells. Stem cells (Dayton, Ohio) 37 (10), 1293–1306. doi:10.1002/stem.3057
Mizrahi, J. D., Surana, R., Valle, J. W., and Shroff, R. T. (2020). Pancreatic Cancer. The Lancet 395 (10242), 2008–2020. doi:10.1016/S0140-6736(20)30974-0
Nuti, M., Zizzari, I. G., Botticelli, A., Rughetti, A., and Marchetti, P. (2018). The Ambitious Role of Anti Angiogenesis Molecules: Turning a Cold Tumor into a Hot One. Cancer Treat. Rev. 70, 41–46. doi:10.1016/j.ctrv.2018.07.016
Pereira, S. P., Oldfield, L., Ney, A., Hart, P. A., Keane, M. G., Pandol, S. J., et al. (2020). Early Detection of Pancreatic Cancer. Lancet Gastroenterol. Hepatol. 5 (7), 698–710. doi:10.1016/S2468-1253(19)30416-9
Riley, R. S., June, C. H., Langer, R., and Mitchell, M. J. (2019). Delivery Technologies for Cancer Immunotherapy. Nat. Rev. Drug Discovdrug Discovery 18 (3), 175–196. doi:10.1038/s41573-018-0006-z
Ryschich, E., Huszty, G., Knaebel, H. P., Hartel, M., Büchler, M. W., and Schmidt, J. (2004). Transferrin Receptor Is a Marker of Malignant Phenotype in Human Pancreatic Cancer and in Neuroendocrine Carcinoma of the Pancreas. Eur. J. Cancer 40 (9), 1418–1422. doi:10.1016/j.ejca.2004.01.036
Schizas, D., Charalampakis, N., Kole, C., Economopoulou, P., Koustas, E., Gkotsis, E., et al. (2020). Immunotherapy for Pancreatic Cancer: a 2020 Update. Cancer Treat. Rev. 86, 102016. doi:10.1016/j.ctrv.2020.102016
Siegel, R. L., Miller, K. D., Fuchs, H. E., and Jemal, A. (2021). Cancer Statistics, 2021. CA A. Cancer J. Clin. 71 (1), 7–33. doi:10.3322/caac.21654
Wang, S., Li, Y., Xing, C., Ding, C., Zhang, H., Chen, L., et al. (2020). Tumor Microenvironment in Chemoresistance, Metastasis and Immunotherapy of Pancreatic Cancer. Am. J. Cancer Res. 10 (7), 1937–1953.
Wolfgang, C. L., Herman, J. M., Laheru, D. A., Klein, A. P., Erdek, M. A., Fishman, E. K., et al. (2013). Recent Progress in Pancreatic Cancer. CA A Cancer J. Clinicians 63 (5), 318–348. doi:10.3322/caac.21190
Xiao, C., Fu, X., Wang, Y., Liu, H., Jiang, Y., Zhao, Z., et al. (2020). Transferrin Receptor Regulates Malignancies and the Stemness of Hepatocellular Carcinoma-Derived Cancer Stem-like Cells by Affecting Iron Accumulation. PLoS One 15 (12), e0243812. doi:10.1371/journal.pone.0243812
Zhang, L., Sanagapalli, S., and Stoita, A. (2018). Challenges in Diagnosis of Pancreatic Cancer. Wjg 24 (19), 2047–2060. doi:10.3748/wjg.v24.i19.2047
Keywords: TFRC, pancreatic cancer, bioinformatics, immunotherapy, CAR- T cells
Citation: Yang C, Li J, Guo Y, Gan D, Zhang C, Wang R, Hua L, Zhu L, Ma P, Shi J, Li S and Su H (2022) Role of TFRC as a Novel Prognostic Biomarker and in Immunotherapy for Pancreatic Carcinoma. Front. Mol. Biosci. 9:756895. doi: 10.3389/fmolb.2022.756895
Received: 11 August 2021; Accepted: 26 January 2022;
Published: 16 March 2022.
Edited by:
Liang Chen, University of Science and Technology of China, ChinaReviewed by:
Sanjay Mishra, The Ohio State University, United StatesCopyright © 2022 Yang, Li, Guo, Gan, Zhang, Wang, Hua, Zhu, Ma, Shi, Li and Su. This is an open-access article distributed under the terms of the Creative Commons Attribution License (CC BY). The use, distribution or reproduction in other forums is permitted, provided the original author(s) and the copyright owner(s) are credited and that the original publication in this journal is cited, in accordance with accepted academic practice. No use, distribution or reproduction is permitted which does not comply with these terms.
*Correspondence: Haichuan Su, c3VoY0BmbW11LmVkdS5jbg==
†These authors have contributed equally to this work
Disclaimer: All claims expressed in this article are solely those of the authors and do not necessarily represent those of their affiliated organizations, or those of the publisher, the editors and the reviewers. Any product that may be evaluated in this article or claim that may be made by its manufacturer is not guaranteed or endorsed by the publisher.
Research integrity at Frontiers

Learn more about the work of our research integrity team to safeguard the quality of each article we publish.