 Alexander Gudkov1Valery Shirokorad2Kirill Kashintsev2
 Dmitriy Sokov3Daniil Nikitin4Andrey Anisenko4
 Nicolas Borisov5
 Marina Sekacheva6Nurshat Gaifullin7
 Andrew Garazha8Maria Suntsova6Elena Koroleva5
 Anton Buzdin5,8,6,9
 Maksim Sorokin1,5,8,10*
- 1I. M. Sechenov First Moscow State Medical University, Moscow, Russia
- 2Moscow City Oncological Hospital №. 62, Moscow, Russia
- 3Moscow City Clinical Oncological Dispensary №. 1, Moscow, Russia
- 4Oncobox Ltd., Moscow, Russia
- 5Moscow Institute of Physics and Technology, Moscow, Russia
- 6World-Class Research Center “Digital Biodesign and Personalized Healthcare”, Sechenov First Moscow State Medical University, Moscow, Russia
- 7Department of Pathology, Faculty of Medicine, Lomonosov Moscow State University, Moscow, Russia
- 8OmicsWay Corp, Walnut, CA, United States
- 9Shemyakin-Ovchinnikov Institute of Bioorganic Chemistry, Moscow, Russia
- 10European Organization for Research and Treatment of Cancer (EORTC), Biostatistics and Bioinformatics Subgroup, Brussels, Belgium
Sorafenib is a tyrosine kinase inhibitory drug with multiple molecular specificities that is approved for clinical use in second-line treatments of metastatic and advanced renal cell carcinomas (RCCs). However, only 10–40% of RCC patients respond on sorafenib-containing therapies, and personalization of its prescription may help in finding an adequate balance of clinical efficiency, cost-effectiveness, and side effects. We investigated whether expression levels of known molecular targets of sorafenib in RCC can serve as prognostic biomarker of treatment response. We used Illumina microarrays to profile RNA expression in pre-treatment formalin-fixed paraffin-embedded (FFPE) samples of 22 metastatic or advanced RCC cases with known responses on next-line sorafenib monotherapy. Among them, nine patients showed partial response (PR), three patients—stable disease (SD), and 10 patients—progressive disease (PD) according to Response Evaluation Criteria In Solid Tumors (RECIST) criteria. We then classified PR + SD patients as “responders” and PD patients as “poor responders”. We found that gene signature including eight sorafenib target genes was congruent with the drug response characteristics and enabled high-quality separation of the responders and poor responders [area under a receiver operating characteristic curve (AUC) 0.89]. We validated these findings on another set of 13 experimental annotated FFPE RCC samples (for 2 PR, 1 SD, and 10 PD patients) that were profiled by RNA sequencing and observed AUC 0.97 for 8-gene signature as the response classifier. We further validated these results in a series of qRT-PCR experiments on the third experimental set of 12 annotated RCC biosamples (for 4 PR, 3 SD, and 5 PD patients), where 8-gene signature showed AUC 0.83.
Introduction
According to the estimates for 2020, globally there were ∼431,000 new cases of kidney cancer and ∼179,000 associated deaths (Sung et al., 2021). Renal cell carcinoma (RCC) is the most common subtype of kidney cancer in adults, responsible for nearly 90% of all cases and prone to distant metastasis (He et al., 2021). RCC arises from the renal parenchyma, and the incidence of RCC is still increasing in most countries (Bhatt and Finelli, 2014; Du et al., 2020). Approximately 25–30% of RCC patients are diagnosed at a metastatic or locally advanced disease stage, and another third of RCC patients will recur after receiving a successful first-line treatment (Sánchez-Gastaldo et al., 2017). RCC includes several different histological subtypes with distinct biological behaviors and prognoses.
RCCs are frequently characterized by inactivation of the VHL tumor suppressor gene. This leads to deficiency of its encoded protein, which is part of an E3 ubiquitin ligase complex that degrades alpha subunit of hypoxia inducible factor 2 (HIF-2α). The resulting excessive accumulation of HIF-2α can transcriptionally upregulate oncogenic hypoxia-responsive genes, including platelet-derived growth factor (PDGF) and vascular endothelial growth factor (VEGF) (Choueiri and Kaelin, 2020). In turn, VEGF and PDGF promote angiogenesis, cell growth and survival, and RCC progression by activating the respective tyrosine kinase receptors PDGFR and VEGFR. This leads to high vascularization of RCC and to its high metastatic potential (He et al., 2021). Patients with metastatic RCC are insensitive to chemotherapy and radiotherapy, and have a poor survival prognosis (Choueiri and Motzer, 2017).
Sorafenib is a tyrosine kinase inhibitor with multiple specificities that targets at least ten tyrosine kinase molecules: RAF1, BRAF, RET, FLT1, FGFR1, KIT, PDGFRB, FLT3, FLT4, and KDR (Adnane et al., 2006). Sorafenib is thought to have a dual suppressive effect on tumors by blocking both angiogenesis, and cell proliferation and survival through the inhibition of VEGFR/PDGFR and BRAF/RET/FLT/FGFR/KIT/KDR signaling axis, respectively (Wilhelm et al., 2004, 2006). It is the first targeted drug approved for treatment of metastatic or locally advanced RCC by US FDA, which revolutionized treatment of kidney cancer and accelerated development and registration of other targeted therapeutics (Escudier et al., 2019). Since then, several other specific agents against VEGF, PDGF, and their receptors have been approved for the treatment of RCC, including sunitinib, axitinib, cabozanitinib, lenvatinib, pazopanib, and bevacizumab (Dizman et al., 2020). In addition, mTOR-specific inhibitors temsirolimus and everolimus were also approved for the treatment of this disease (Dizman et al., 2020). According to the National Comprehensive Cancer Network (NCCN) guidelines, sorafenib and sunitinib are recommended as drugs for metastatic RCC, where sorafenib has a lower toxicity than sunitinib (Deng et al., 2019). Moreover, sorafenib is also approved as the first-line treatment of metastatic RCC according to the latest guidelines of Chinese Society of Clinical Oncology (He et al., 2021). In clinical practice, it is also effective in hepatocellular and thyroid cancers (Escudier et al., 2019), myeloid leukemia, mesothelioma, and prostate cancer (Méndez-Blanco et al., 2018).
However, only 10–40% of RCC patients respond on sorafenib-containing therapeutic schemes (Larkin and Eisen, 2006; Escudier et al., 2007; Guevremont et al., 2009), and personalization of its prescriptions may help in finding an adequate balance of clinical efficiency, cost-effectiveness, and side effects. Nowadays, there are no clinical biomarkers of response on sorafenib treatment in RCC, and the molecular mechanisms of sorafenib resistance in RCC are not sufficiently understood (He et al., 2021). Currently, several RCC sorafenib resistance biomarkers were identified by RNA expression assays in drug responder and non-responder tumors: long non-coding RNAs GAS5 (Liu et al., 2019) and SRLR (Xu et al., 2017), microRNA miR-21, and genes ANGPTL3 (Bao et al., 2018), CXCR4, CD34 (Aziz et al., 2014), FGFR1 (Ho et al., 2015), FRS2A, GLUT1, HO-1 (Zheng et al., 2015), SOX5, and SOX9 (Li et al., 2015; He et al., 2021). In addition, expression of AKT protein was reported to be a biomarker of enhanced resistance against sorafenib in RCC patients (Jonasch et al., 2010). However, despite those important observations, no diagnostic settings were constructed to predict effectiveness of sorafenib for RCC patients.
Drug target expression levels, e.g., determined by immunohistochemistry, are already used as the biomarkers of treatment response in some solid cancers (Hechtman et al., 2017) including breast cancer (Nicolini et al., 2018) and gastric cancer (Abrahao-Machado and Scapulatempo-Neto, 2016). In addition, profiling of gene expression at RNA level is a powerful tool for discovery of drug efficiency biomarkers and for cancer therapy personalization (Buzdin et al., 2019). Previously, we showed that gene expression levels established from standardized RNA sequencing data can be used as robust estimators of the corresponding protein levels for several cancer biomarkers in tumor biosamples, including formalin-fixed paraffin-embedded (FFPE) specimens (Sorokin et al., 2020b).
In this study, we investigated FFPE biosamples of pre-treatment RCC tissues from 47 patients with known response status on next-line monotherapy with sorafenib. Illumina microarrays were used to profile RNA expression in FFPE samples of 22 metastatic or advanced RCC cases. Among them, nine patients showed partial response (PR), three patients—stable disease (SD), and 10 patients—progressive disease (PD) according to RECIST criteria. We then classified PR + SD patients as “responders” and PD patients as “poor responders”. We found that gene signature including eight sorafenib target genes was congruent with the drug response characteristics, and enabled high-quality separation of the responders and poor responders [area under a receiver operating characteristic curve (AUC) 0.89]. We validated these findings on another set of 13 experimental annotated FFPE RCC samples (for 2 PR, 1 SD, and 10 PD patients) that were profiled by RNA sequencing and observed AUC 0.97 for 8-gene signature as the response classifier. We further validated these results in a series of qRT-PCR experiments on the third experimental set of 12 annotated RCC biosamples (for 4 PR, 3 SD, and 5 PD patients), where 8-gene signature showed AUC 0.83.
Materials and Methods
Patients and Samples
All patients enrolled in this study have previously signed written informed consents to participate in the observational clinical investigation, and for publication of depersonalized molecular profiles and study results in the form of gene activity profiles associated with age, sex, and results of sorafenib monotherapy treatment estimated according to RECIST criteria (Eisenhauer et al., 2009). The patients provided written informed consent that their tumor samples will be subjected to gene expression profiling using either microarray technology or next-generation sequencing or qRT-PCR. Twenty-two patients signed agreement that their biosamples are profiled with the Illumina HT-12 bead arrays (Table 1). Thirteen patients signed agreement that their biosamples are profiled by RNA sequencing using Illumina HiSeq3000 next generation sequencing platform (Table 2). Twelve patients signed agreement that their biosamples are profiled by qRT-PCR, but not using expression microarrays or RNA sequencing (Table 3).
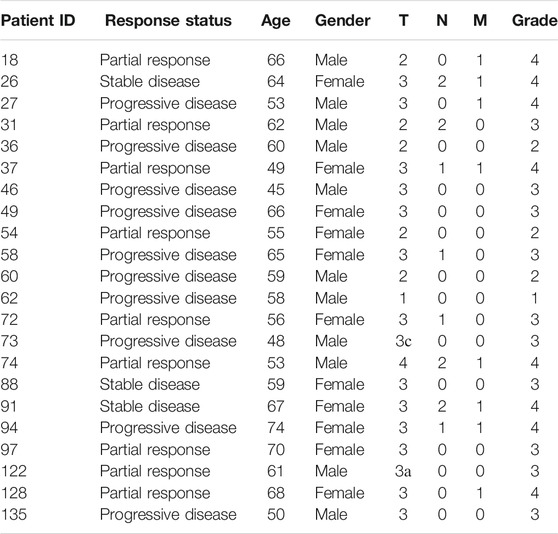
TABLE 1. Clinical information for RCC patients profiled using Illumina HumanHT-12 WG-DASL V4.0 R2 gene expression arrays
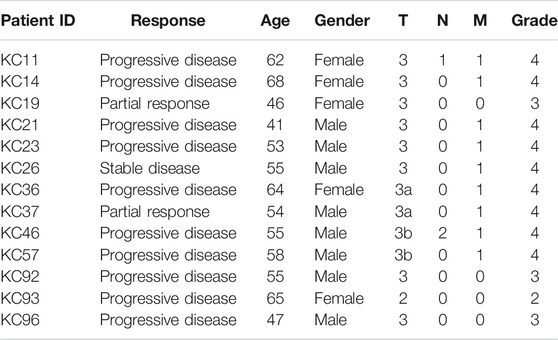
TABLE 2. Clinical information for RCC patients profiled using Illumina HiSeq3000 next-generation sequencing platform in this study
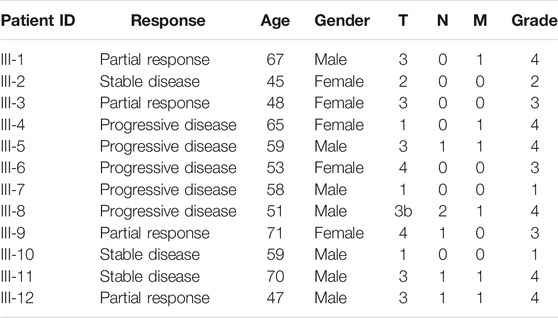
TABLE 3. Outline of clinical information of patients whose samples were profiled using RT-PCR platform in this study
The study was conducted in accordance with the Declaration of Helsinki ethical principles. The patient groups, design of this study, and its public presentation in the form of a research paper were approved by the local ethical committees at I.M. Sechenov First Moscow State Medical University, Moscow City Oncological Hospital №. 62, and Moscow City Clinical Oncological Dispensary №. 1.
Biosamples were collected prospectively in the period from May 2015 until July 2020. All biosamples obtained from all the patients in this study were FFPE RCC tumor blocks obtained from primary tumor sites and evaluated by a pathologist, with cancer cell content of at least 60%. All patients were treated with sorafenib in first-line therapy and their responses were assessed according to RECIST criteria (Eisenhauer et al., 2009).
Twenty-two samples from kidney cancer patients were analyzed using Illumina HumanHT-12 WG-DASL V4.0 R2 gene expression array (Table 1). Among them, patients with progressive disease were considered as poor responders (n = 10), whereas patients with partial response and stable disease were classified as the responders (n = 12).
Gene expression for 13 other RCC samples was profiled by RNA sequencing using Illumina HiSeq3000 next generation sequencing platform (Table 2). Similarly, patients with progressive disease were considered as poor responders (n = 10), whereas patients with partial response and stable disease were classified as the responders (n = 3).
Finally, patients in the third set of 12 RCC patients were profiled by quantitative reverse transcription PCR (qRT-PCR) assay (Table 3). According to the aforementioned criteria, five patients were considered poor responders, and seven patients—treatment responders.
Gene Expression Assays
RNA Extraction
To isolate RNA, 10-µm-thick paraffin slices were trimmed from each FFPE RCC tissue block using microtome. RNA was extracted from FFPE slices using QIAGEN RNeasy FFPE Kit following the manufacturer’s protocol. RNA 6000 Nano or Qubit RNA Assay kits were used to measure RNA concentration. RNA Integrity Number (RIN) was measured using Agilent 2100 bio-Analyzer.
Microarray Gene Expression Profiling
Gene expression profiling was done according to Lezhnina et al. (2014) at Dr. Olga Kovalchuk’s laboratory, University of Lethbridge, Alberta, Canada. The profiling was done using Illumina HumanHT-12 WG-DASL V4.0 R2 gene expression bead arrays. BeadChips were scanned using Illumina BeadArray Reader and the Bead Scan Software (Illumina).
RNA Sequencing
RNA sequencing was done according to Suntsova et al. (2019) and Sorokin et al. (2020d) at the Department of Pathology and Laboratory Medicine, University of California Los Angeles. For depletion of ribosomal RNA and library construction, KAPA RNA Hyper with rRNA erase kit (HMR only) was used. Different adaptors were used for multiplexing samples in one sequencing run. Library concentrations and quality were measured using Qubit ds DNA HS Assay kit (Life Technologies) and Agilent Tapestation (Agilent). RNA sequencing was done using Illumina HiSeq 3000 equipment for single-end sequencing, 50 bp read length, for approximately 30 million (mln) raw reads per sample. Data quality check was done on Illumina SAV. De-multiplexing was performed with Illumina Bcl2fastq2 v 2.17 program.
Quantitative Reverse Transcription PCR
Quantitative reverse transcription PCR (qRT-PCR) panel was developed to measure the expression level of eight target and six housekeeping genes in kidney cancer samples using Evrogen Reverse transcription polymerase and Evrogen Taq polymerase kit with SYBR Green for the PCR product detection. PCR mix composition included (25 µl total volume)
Buffer (HS-qPCRmix-HS SYBR; Evrogen, Moscow, Russia)—5 μl;
Primers 1 µl (0.4 µM each);
RNA solution—1–3 µl (2–6 ng total RNA per mix);
MMLV-RT (Evrogen)—2 µl;
Water—13–15 µl.
The oligonucleotide sequences for PCR primers are listed in Table 4. Following reverse transcription reaction, the PCR mix was melted at 95°C for 5 min, and then the following cycling conditions were applied using CFX Touch Real-Time PCR Detection System (BioRad):
95°C—30 s.
60°C—30 s.
72°C—30 s.
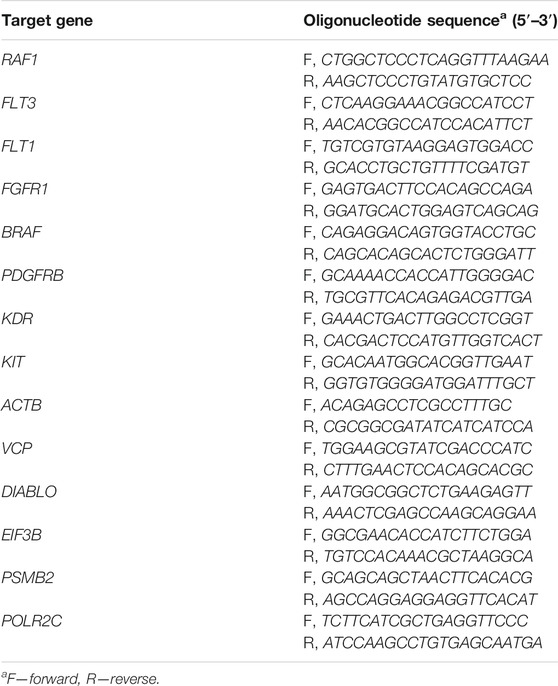
TABLE 4. Sequences of qRT-PCR primers used in this study
Each experiment was carried out in quadruplicate.
Processing of Gene Expression Data
Illumina HumanHT-12 WG-DASL V4.0 R2 Gene Expression Array
Probe IDs were mapped to HGNC gene symbols (Yates et al., 2017) using the manufacturer’s annotation table. Gene expression values were normalized using quantile normalization protocol (Bolstad et al., 2003) prior to further processing. R package preprocessCore was used to perform quantile normalization.
Illumina HiSeq3000 RNAseq Profiles
RNA sequencing FASTQ files were processed with STAR aligner (Dobin et al., 2013) in “GeneCounts” mode with the Ensembl human transcriptome annotation (Build version GRCh38 and transcript annotation GRCh38.89). Ensembl gene IDs were converted to HGNC gene symbols using Complete HGNC dataset (https://www.genenames.org/, accessed on 2017 July 13). In total, expression levels were established for 36,596 annotated genes with the corresponding HGNC identifiers. Raw gene counts were normalized using R DESeq2 package (Love et al., 2014).
Quantitative Reverse Transcription PCR
For each sorafenib target gene from the RCC drug sensitivity gene signature (RAF1, BRAF, FLT1, FGFR1, KIT, PDGFRB, FLT3, FLT4, KDR), we performed normalization using expression of six housekeeping genes selected according to Chang et al. (2011) (ACTB, GAPDH, POLR2C, PSMB2, DIABLO, VCP). For each gene, we calculated ΔCt by subtracting the value of the threshold cycle of cDNA amplification of a target gene from the geometric mean value of the threshold cycle of cDNA amplification of the housekeeping genes. The gene signature score was calculated as sum of ΔCt values for all genes included in the signature.
Gene Expression Analysis and Visualization
Differential gene expression analysis was performed using Student t-test. The observed clinical responses were used for investigation of molecular signature using ROC-AUC analysis (Fawcett, 2006). Area under a receiver operating characteristic curve (ROC-AUC) values were calculated using ROCR package in R environment (Sing et al., 2005). Patient survival analysis and visualization were performed using R packages survival, survminer, and ggplot2.
Sorafenib In Vitro Efficiency Data
From Genomics of Drug Sensitivity in Cancer (GDSC) database (https://www.cancerrxgene.org/downloads/bulk_download, accessed on 2021 March 30), we downloaded log10-transformed IC50 values for sorafenib in 732 cancer cell lines corresponding to 13 different tumor types and 50 subtypes (Supplementary Table S1). For each cell line, we downloaded raw gene expression data from ArrayExpress database (https://www.ebi.ac.uk/arrayexpress/experiments/E-MTAB-3610/) in CEL format, experimentally profiled using Affymetrix Human Genome U219 Array. CEL files were normalized and background correction was applied using rma function of affy R package.
Mutation Analysis
For mutation analysis, we used gene expression and genetic features data from GDSC database (https://www.cancerrxgene.org). We used data for 802 solid and 167 blood cancer cell lines with available genetic mutational profiles. For each mutation, we compared IC50 values for sorafenib between mutant and wild-type cell lines using non-parametric Mann–Whitney U test. Then we applied false discovery rate (FDR) correction to adjust for comparing multiple genetic features. Genetic features with FDR-corrected p-values <0.1 and more than 2-fold IC50 differences were considered as significant. Mann–Whitney U tests and FDR correction were performed using scipy and statsmodels Python libraries implemented in GDSC web interface.
Results
Study Population
In total, 47 RCC patients were enrolled in this study (21 female and 26 male patients, age range 41–74, mean 58 y.o.). The biosamples were FFPE RCC tumor tissue blocks collected in the period from May 2015 until July 2020. Gene expression was profiled using three different methods: microarray hybridization using Illumina HT-12 bead array, Illumina RNA sequencing, and qRT-PCR. Each patient provided a written informed consent and agreed that his/her biosample is profiled with one of the aforementioned methods. In the microarray group, there were 22 patients including 11 women and 11 men, age range 45–74, mean 59 y.o.; in RNAseq group—13 patients including 5 women and 8 men, age range 41–68, mean 56 y.o.; in qRT-PCR group, there were 12 patients including 7 men and 5 women, age range 45–71, mean 58 y.o. (Tables 1–3). The patients whose response status on next-line sorafenib monotherapy treatment according to RECIST criteria was “Progressive disease” were considered as poor responders, and the patients with statuses “Partial response” and “Stable disease” were considered as the responders. No “Complete response” outcomes according to RECIST (disappearance of all target lesions) were detected. This is in line with a previous study by Escudier et al., where only 1 out of 451 RCC patients treated with sorafenib had a complete response (Escudier et al., 2007). In total, 25 patients were classified as the poor responders, and 22—as the responders (Tables 1–3).
Specifically, there were 10 non-responders and 12 responders in the microarray group, 10 non-responders and three responders in the RNAseq group, and five non-responders and seven responders in the qRT-PCR group.
Differential Gene Expression Analysis and Generation of Sorafenib Response Signature
In the samples profiled by Illumina microarrays, we screened differential gene expression between the responder and poor responder biosamples. We aimed to generate sorafenib response gene signature and focused on expression levels of sorafenib target genes to avoid over-training. Using prior knowledge such as biological function of the genes is a well-established technique for feature selection as reviewed in Hira and Gillies (2015). At the single gene level, we observed a significant difference between the responders and poor responders only for FLT1 and PDGFRB genes, which were both upregulated in the responders group (Table 5; Figure 1). Multiple logistic regression analysis did not provide significant coefficients for any of the sorafenib target genes.
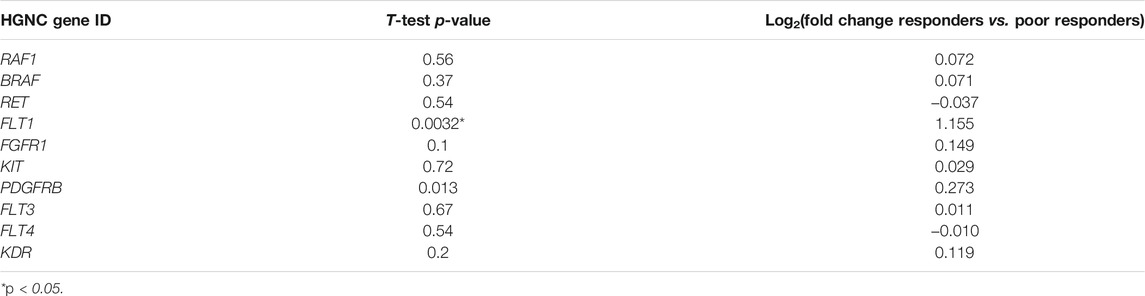
TABLE 5. Differential expression analysis of sorafenib responders (n = 12) and poor responders (n = 10) in microarray-profiled RCC samples
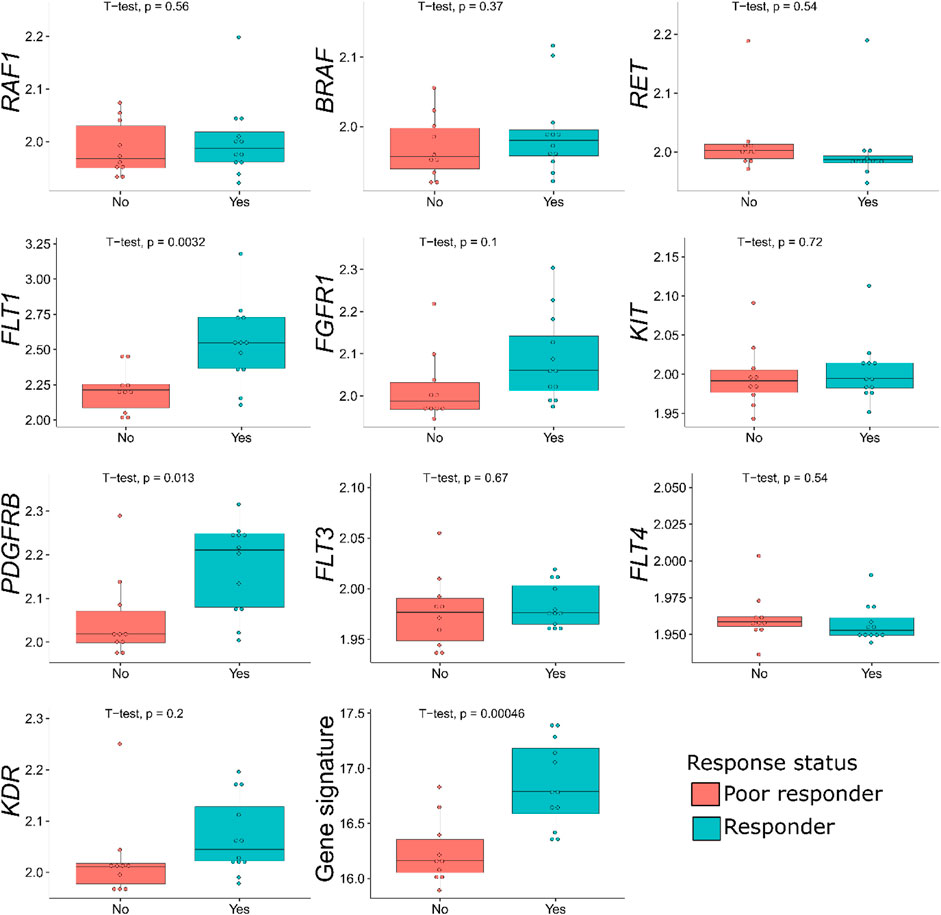
FIGURE 1. Distribution of sorafenib target gene expressions, and of the gene signature generated, among the sorafenib responder and poor responder groups of 22 RCC samples profiled by microarrays. For every gene, log10-transformed normalized expression is shown.
In the previous studies, drug response statuses could correlate with the drug target gene expression levels (Tkachev et al., 2020), and for generating sorafenib drug response signature, we selected sorafenib target genes whose expression levels were greater in the responders than in the poor responders. Except two genes that were downregulated in the responders (RET and FLT4), the remaining eight sorafenib target genes that were upregulated were used to construct the molecular signature. Complex models with relatively small number of samples are often overfitted; therefore, we calculated the signature score as sum of log10-transformed normalized gene expression values, thus reducing data dimensionality.
This signature was tested to predict sorafenib response status in the microarray-profiled dataset. To assess the signature biomarker quality, we used AUC value as the measure. AUC reflects biomarker robustness and depends on its sensitivity and specificity (Borisov et al., 2020). It varies between 0.5 and 1, and the typical discrimination threshold is 0.7, where greater values denote high-quality biomarkers, and vice versa (Boyd, 1997). AUC is often used for scoring different types of molecular biomarkers in oncology (Liu et al., 2018; Tanioka et al., 2018; Chen et al., 2019; Sorokin et al., 2020a).
For the gene signature biomarker capacity, we obtained AUC value 0.89 (Figure 2B), which evidences its high prediction robustness. Using an assumption of equal frequency of type I and type II errors, we obtained threshold gene signature score of 16.41. This threshold corresponded to sensitivity 0.83, specificity 0.8, and Matthew’s correlation coefficient (MCC) 0.63; error matrix is shown on Supplementary Table S2. Interestingly, t-test p-value of the gene signature for comparison between the good and poor sorafenib responders (p = 0.00046) was lower than the respective p-value for any of the single sorafenib target genes (Figure 1).
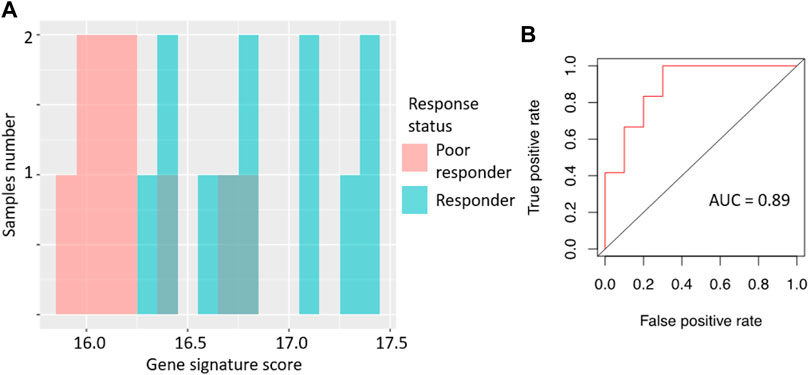
FIGURE 2. Performance of sorafenib response gene signature in microarray-profiled RCC set. (A) Distribution of gene signature score in 22 RCC samples profiled by expression microarrays. (B) ROC (receiver operating characteristic) curve for prediction of response status by gene signature score in 22 RCC samples profiled by expression microarrays. Validation of sorafenib response gene signature.
We then tested the ability of the sorafenib response gene signature to predict good/poor response status using two alternative experimental platforms (RNAseq and qRT-PCR) and different sets of annotated RCC biosamples (n = 13 and n = 12, respectively).
Specifically, the signature score for RNAseq data was calculated in the same way as for the microarray dataset: sum of the log-transformed expression values for the same eight sorafenib target genes. For the qRT-PCR dataset, we totalized ΔCt values for the selected sorafenib targets. For those two platforms, we obtained AUC scores of 0.97 and 0.83, respectively (Figures 3, 4; error matrices are shown on Supplementary Tables S3, S4, respectively).
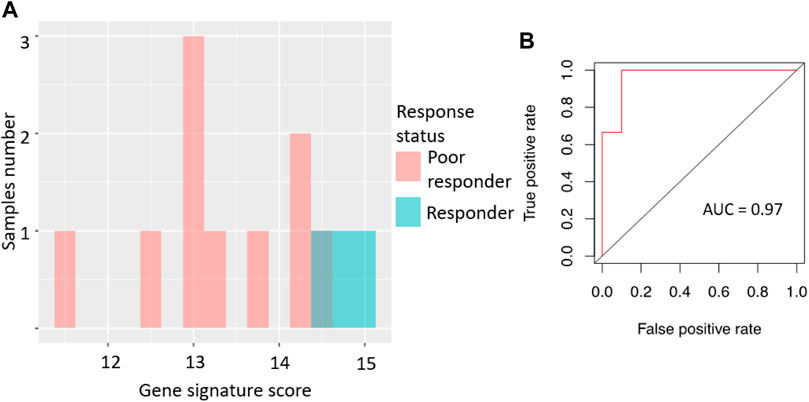
FIGURE 3. Performance of sorafenib response gene signature in RNAseq-profiled RCC set. (A) Distribution of gene signature score in 13 RCC samples profiled by RNA sequencing. (B) ROC (receiver operating characteristic) curve for prediction of response status by gene signature score in 13 RCC samples profiled by RNA sequencing.
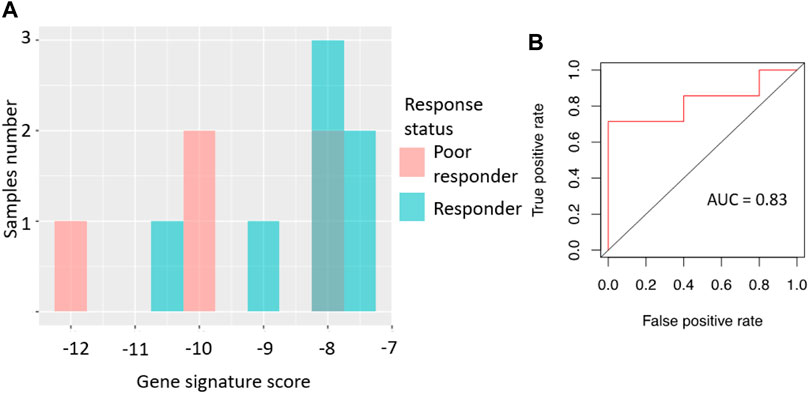
FIGURE 4. Performance of sorafenib response gene signature in microarray-profiled RCC set. (A) Distribution of gene signature score in 22 RCC samples profiled by expression microarrays. (B) ROC (receiver-operator characteristic) curve for prediction of response status by gene signature score in 22 RCC samples profiled by expression microarrays. In vitro validation of sorafenib response gene signature.
For the RNAseq dataset, we also used an assumption of equal frequency of type I and type II errors and obtained threshold gene signature score of 14.35, sensitivity 1.00, specificity 0.9, and MCC 0.82. Similarly, in the case of qRT-PCR dataset, a threshold of −8.03 was obtained, which corresponded to sensitivity 0.71, specificity 1.0, and MCC 0.71.
The high scores of AUC, MCC, sensitivity, and specificity values observed for all three cohorts suggest in favor of the proposed sorafenib response gene signature usefulness as the new combinatorial expression biomarker.
We further validated the sorafenib response gene signature using bioinformatics analysis of publicly available cell line gene expression data annotated with sorafenib sensitivity information. We calculated molecular signature scores for 735 samples of different cancer cell lines extracted through the GDSC database (Yang et al., 2013).
We then compared gene signature scores with the log10-transformed IC50 micromolar values of sorafenib. IC50 shows sorafenib concentration that reduces cell viability by 50%, and therefore IC50 is an inverse measure of drug efficiency (high IC50 suggests strong drug resistance, and low IC50 means high sensitivity to a drug). We observed a statistically significant negative correlation between sorafenib IC50 and gene signature score (Figure 5), Spearman correlation −0.195, p = 10−7.
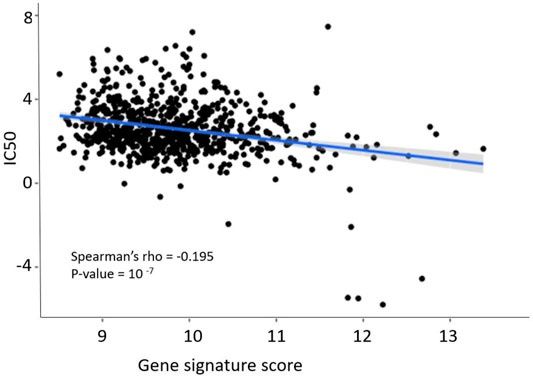
FIGURE 5. Dependence of sorafenib resistance gene signature score and sorafenib IC50 in GDSC pan-cancer dataset. Blue line and shadow around it show linear approximation and 5% confidence interval. Figure built using ggplot function in R.
We then modeled ability of the gene signature to predict sorafenib IC50 in the tumor cell lines. Using GDSC data, we selected top and bottom 5% cell lines by sorafenib IC50, and associated them with the sorafenib poor and good responders, respectively. In this test, AUC value for prediction of high or low sorafenib IC50 by gene signature score was 0.77 (Figure 6).
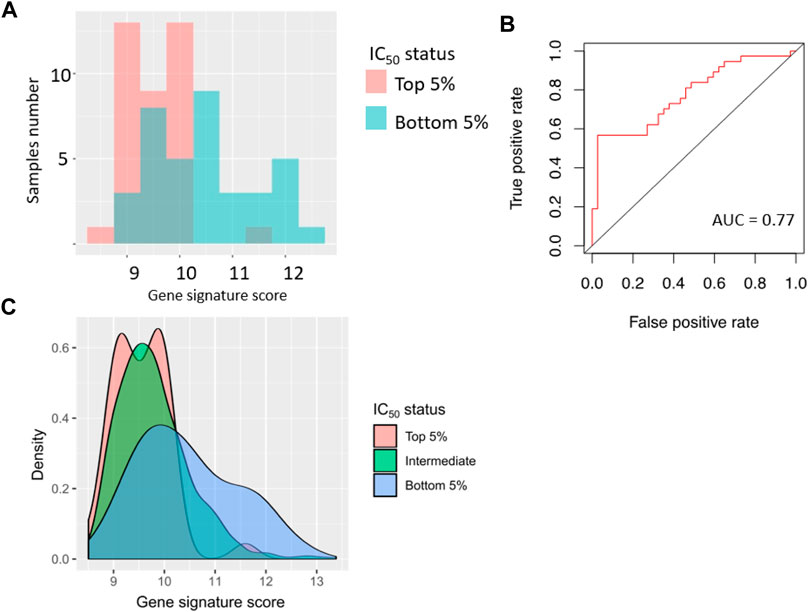
FIGURE 6. Performance of sorafenib response gene signature in 76 cancer cell lines (top 5% and bottom 5% cell lines from GDSC dataset, sorted by sorafenib IC50). (A) Distribution of gene signature score in 76 cancer cell lines. (B) ROC (receiver operating characteristic) curve for prediction of response status by gene signature score in 76 cancer cell lines. (C) Distribution of gene signature score in all cancer cell lines.
Based on the assumption of equal importance of type I and type II errors, in this setting we obtained gene signature score threshold of 9.8, MCC coefficient 0.32, sensitivity 0.63, and specificity 0.66; error matrix for this analysis is shown on Supplementary Table S5.
Mutations Associated With Sorafenib Activity In Vitro
Using the GDSC dataset, we further investigated the connection between sorafenib IC50 and annotated mutations in the GDSC cell lines. P-value cut-off was set according to GDSC default parameters (threshold FDR corrected p < 0.1 and fold change >2). With the internal GDCS analytic interface, we identified mutations in two genes that were statistically significantly linked with IC50 of sorafenib: FLT3 and SMARCA4 (Figure 7; Table 6). The observed genetic features contained different driver mutations in both genes. Noteworthy, FLT3 gene product is one of the molecular targets of sorafenib. Thus, strong linkage of driver mutations in this gene with the sensitivity to sorafenib directly confirms its implication in the mechanisms of cancer cells’ resistance to sorafenib. For the second gene (SMARCA4), we found no previous associations with sorafenib efficacy in the literature. However, molecular function of this gene product is ATP-dependent chromatin remodeling and overall transcriptional activation, and SMARCA4 mutations are linked with many cancers (Fountzilas et al., 2021; Nambirajan and Jain, 2021; Pastorczak et al., 2021).
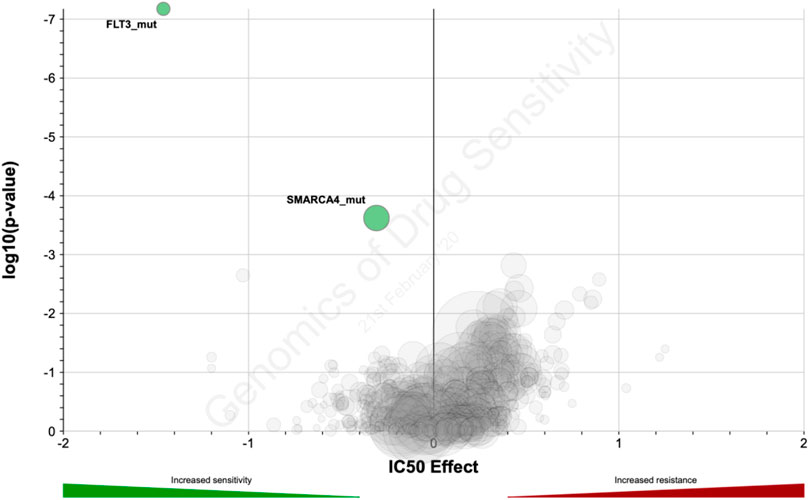
FIGURE 7. Distribution of log10-transformed p-value and IC50 difference between groups with and without gene-specific mutations and copy number alternations in GDSC database.

TABLE 6. Genes which mutations are statistically significantly associated with sorafenib IC50 in GDSC data collection
Discussion
Sorafenib is a targeted tyrosine kinase inhibitor (TKI) with multiple molecular specificities, which is widely used to treat kidney cancer due to relative clinical efficacy and affordability (Sheng et al., 2016; Cai et al., 2017). However, sorafenib response rate in RCC varies between 10 and 40% (Larkin and Eisen, 2006; Escudier et al., 2007; Guevremont et al., 2009), thus personalized approach is needed to select the patients who would more likely benefit from the treatment with this drug.
High-throughput gene expression profiling is becoming a powerful tool for finding new cancer biomarkers (Buzdin et al., 2019; Tsimberidou et al., 2020). Moreover, aggregating gene expression levels into functional groups like molecular pathways or gene signatures can increase efficiency of the biomarkers and even enhance stability of experimental data (Borisov et al., 2017; Buzdin et al., 2018). Previously we used this approach to establish biomarkers of trastuzumab response in metastatic/recurrent HER2-positive breast cancers (Sorokin et al., 2020a), ramucirumab response in gastric cancer (Sorokin et al., 2020d), and for building gene signature for ganglioside GD2 expression in cancer cells (Sorokin et al., 2020c).
In this study, we identified and validated an 8-gene expression signature that predicts sorafenib response in RCC patients. The signature was validated on the independent patient groups using three different methods of gene expression profiling: by Illumina HT-12 microarrays, by RNA sequencing, and by qRT-PCR. The sorafenib response signature includes eight sorafenib target genes: RAF1, BRAF, FLT1, FGFR1, KIT, PDGFRB, FLT3, and KDR. Among them, increased expressions of single genes FLT1 and PDGFRB were positively associated with the sorafenib response, whereas other genes showed similar trends, which were however not statistically significant. At the same time, the gene signature could show better efficacy than any of the separately taken enclosing genes, thus evidencing better efficacy of a cumulative complex expression biomarker. On the other hand, significant association of sorafenib target gene FLT3 was confirmed at the level of driver mutations in GDSC data, thus implying a peculiar role for this gene in the sorafenib activity mechanism.
Sorafenib has a strong overlap in the molecular specificities with regorafenib (Granito et al., 2021) and with several other TKI drugs (Shah et al., 2020; Das et al., 2021), and theoretically the same drug target–based gene signature approach can be translated on finding new response biomarkers for other TKIs as well, and for different cancer types. However, such an approach would require accumulating enough tumor gene expression data connected with the specific drug response statuses, which is frequently a difficult task to implement. For example, to the best of our knowledge, the high-throughput experimental expression profiles that were associated here with the sorafenib response are the first such RCC dataset published in the literature. Accumulation and publishing of more molecular profiles connected with the TKI response statuses in RCC and other tumors would clearly enhance development of next-generation drug response prediction biomarkers.
For the current sorafenib 8-gene expression signature, we developed a qRT-PCR–based diagnostic panel that enables cost-effective molecular profiling. The panel was validated on an independent cohort of RCC patients with AUC = 0.83, which opens an avenue for further molecular testing on bigger patient cohorts and, if successful, for the development of diagnostic tools supporting personalized sorafenib prescriptions. Such a study would also be needed to validate the exact threshold developed for qRT-PCR signature established herein.
Interestingly, the same 8-gene signature was also validated using GDSC project cell line gene expression data connected with the tested drug sensitivities (Yang et al., 2013): a modest (−0.195) yet highly statistically significant (p = 10−7) correlation was observed for the gene signature score and sorafenib IC50. The GDSC collection accumulated data for various cancer cell lines. Cell lines are heterogeneous and derived from tumors of various origin, not only kidney cancer. In addition, in vitro culturing may have an impact on gene expression. Despite all these factors, we still obtained statistically significant performance of the gene signature. Potentially, this may indicate that this gene signature is not specific to RCC but may be also predictive for the other cancer types. Thus, further clinical investigations are needed to assess its performance in cancers other than RCC.
Data Availability Statement
The datasets presented in this study can be found in online repositories. The names of the repository/repositories and accession number(s) can be found below: https://www.ncbi.nlm.nih.gov/bioproject/PRJNA749745/, https://www.ncbi.nlm.nih.gov/geo/, GSE180925.
Ethics Statement
The studies involving human participants were reviewed and approved by the Vitamed clinic ethical committee. The patients/participants provided their written informed consent to participate in this study. Written informed consent was obtained from the individual(s) for the publication of any potentially identifiable images or data included in this article.
Author Contributions
AGu, VS, KK, DS, MSe, and NG collected and interpreted patient data; NB, DN, and MSo performed bioinformatical analysis; AA and MSu performed molecular analyses; AGa, EK, and AB supervised the study; AB, MSo, and DN wrote the paper.
Funding
This study was financed by the Ministry of Science and Higher Education of the Russian Federation within the framework of state support for the creation and development of World-Class Research Centers “Digital biodesign and personalized healthcare” No. 075-15-2020-926.
Conflict of Interest
DN and AA were employed by the company Oncobox Ltd. AG, AB, and MS (14th author) were employed by the company OmicsWay Corp.
The reviewer (YLO) declared a shared affiliation, with no collaboration, with several of the authors (AGu, MS, MS, AAB, MS) to the handling editor at the time of the review.
Publisher’s Note
All claims expressed in this article are solely those of the authors and do not necessarily represent those of their affiliated organizations, or those of the publisher, the editors, and the reviewers. Any product that may be evaluated in this article, or claim that may be made by its manufacturer, is not guaranteed or endorsed by the publisher.
Supplementary Material
The Supplementary Material for this article can be found online at: https://www.frontiersin.org/articles/10.3389/fmolb.2022.753318/full#supplementary-material
References
Abrahao-Machado, L. F., and Scapulatempo-Neto, C. (2016). HER2 Testing in Gastric Cancer: An Update. Wjg 22, 4619–4625. doi:10.3748/WJG.V22.I19.4619
Adnane, L., Trail, P. A., Taylor, I., and Wilhelm, S. M. (2006). Sorafenib (BAY 43‐9006, Nexavar), a Dual‐Action Inhibitor that Targets RAF/MEK/ERK Pathway in Tumor Cells and Tyrosine Kinases VEGFR/PDGFR in Tumor Vasculature. Methods Enzymol. 407, 597–612. doi:10.1016/S0076-6879(05)07047-3
Aziz, S. A., Sznol, J. A., Albiges, L., Zito, C., Jilaveanu, L. B., Camp, R. L., et al. (2014). Microvessel Area as a Predictor of Sorafenib Response in Metastatic Renal Cell Carcinoma. Cancer Cel Int 14. doi:10.1186/1475-2867-14-4
Bao, Y., Yang, F., Liu, B., Zhao, T., Xu, Z., Xiong, Y., et al. (2018). Angiopoietin-like Protein 3 Blocks Nuclear Import of Fak and Contributes to Sorafenib Response. Br. J. Cancer 119, 450–461. doi:10.1038/s41416-018-0189-4
Bhatt, J. R., and Finelli, A. (2014). Landmarks in the Diagnosis and Treatment of Renal Cell Carcinoma. Nat. Rev. Urol. 11, 517–525. doi:10.1038/nrurol.2014.194
Bolstad, B. M., Irizarry, R. A., Åstrand, M., and Speed, T. P. (2003). A Comparison of Normalization Methods for High Density Oligonucleotide Array Data Based on Variance and Bias. Bioinformatics 19, 185–193. doi:10.1093/bioinformatics/19.2.185
Borisov, N., Sorokin, M., Tkachev, V., Garazha, A., and Buzdin, A. (2020). Cancer Gene Expression Profiles Associated with Clinical Outcomes to Chemotherapy Treatments. BMC Med. Genomics 13. doi:10.1186/s12920-020-00759-0
Borisov, N., Suntsova, M., Sorokin, M., Garazha, A., Kovalchuk, O., Aliper, A., et al. (2017). Data Aggregation at the Level of Molecular Pathways Improves Stability of Experimental Transcriptomic and Proteomic Data. Cell Cycle 16, 1810–1823. doi:10.1080/15384101.2017.1361068
Boyd, J. (1997). Mathematical Tools for Demonstrating the Clinical Usefulness of Biochemical Markers. Scli 57, 46–63. doi:10.1080/0036551970916830810.3109/00365519709168308
Buzdin, A., Sorokin, M., Garazha, A., Glusker, A., Aleshin, A., Poddubskaya, E., et al. (2020). RNA Sequencing for Research and Diagnostics in Clinical Oncology. Semin. Cancer Biol. 60, 311–323. doi:10.1016/j.semcancer.2019.07.010
Buzdin, A., Sorokin, M., Garazha, A., Sekacheva, M., Kim, E., Zhukov, N., et al. (2018). Molecular Pathway Activation - New Type of Biomarkers for Tumor Morphology and Personalized Selection of Target Drugs. Semin. Cancer Biol. 53, 110–124. doi:10.1016/j.semcancer.2018.06.003
Cai, W., Kong, W., Dong, B., Zhang, J., Chen, Y., Xue, W., et al. (2017). Comparison of Efficacy, Safety, and Quality of Life between Sorafenib and Sunitinib as First-Line Therapy for Chinese Patients with Metastatic Renal Cell Carcinoma. Chin. J. Cancer 36. doi:10.1186/S40880-017-0230-7
Chang, C.-W., Cheng, W.-C., Chen, C.-R., Shu, W.-Y., Tsai, M.-L., Huang, C.-L., et al. (2011). Identification of Human Housekeeping Genes and Tissue-Selective Genes by Microarray Meta-Analysis. PLoS One 6, e22859. doi:10.1371/journal.pone.0022859
Chen, L., Zhou, Y., Tang, X., Yang, C., Tian, Y., Xie, R., et al. (2019). EGFR Mutation Decreases FDG Uptake in Non-small Cell Lung Cancer via the NOX4/ROS/GLUT1 axis. Int. J. Oncol. 54, 370–380. doi:10.3892/ijo.2018.4626
Choueiri, T. K., and Kaelin, W. G. (2020). Targeting the HIF2-VEGF axis in Renal Cell Carcinoma. Nat. Med. 26, 1519–1530. doi:10.1038/s41591-020-1093-z
Choueiri, T. K., and Motzer, R. J. (2017). Systemic Therapy for Metastatic Renal-Cell Carcinoma. N. Engl. J. Med. 376, 354–366. doi:10.1056/NEJMra1601333
Das, A., Mahapatra, S., Bandyopadhyay, D., Samanta, S., Chakraborty, S., Philpotts, L. L., et al. (2021). Bleeding with Vascular Endothelial Growth Factor Tyrosine Kinase Inhibitor: A Network Meta-Analysis. Crit. Rev. Oncology/Hematology 157, 103186. doi:10.1016/j.critrevonc.2020.103186
Deng, H., Liu, W., He, T., Hong, Z., Yi, F., Wei, Y., et al. (2019). Comparative Efficacy, Safety, and Costs of Sorafenib vs. Sunitinib as First-Line Therapy for Metastatic Renal Cell Carcinoma: A Systematic Review and Meta-Analysis. Front. Oncol. 9. doi:10.3389/fonc.2019.00479
Dizman, N., Philip, E. J., and Pal, S. K. (2020). Genomic Profiling in Renal Cell Carcinoma. Nat. Rev. Nephrol. 16, 435–451. doi:10.1038/s41581-020-0301-x
Dobin, A., Davis, C. A., Schlesinger, F., Drenkow, J., Zaleski, C., Jha, S., et al. (2013). STAR: Ultrafast Universal RNA-Seq Aligner. Bioinformatics 29, 15–21. doi:10.1093/bioinformatics/bts635
Du, Z., Chen, W., Xia, Q., Shi, O., and Chen, Q. (2020). Trends and Projections of Kidney Cancer Incidence at the Global and National Levels, 1990-2030: a Bayesian Age-Period-Cohort Modeling Study. Biomark. Res. 8, 16. doi:10.1186/s40364-020-00195-3
Eisenhauer, E. A., Therasse, P., Bogaerts, J., Schwartz, L. H., Sargent, D., Ford, R., et al. (2009). New Response Evaluation Criteria in Solid Tumours: Revised RECIST Guideline (Version 1.1). Eur. J. Cancer 45, 228–247. doi:10.1016/J.EJCA.2008.10.026
Escudier, B., Eisen, T., Stadler, W. M., Szczylik, C., Oudard, S., Siebels, M., et al. (2007). Sorafenib in Advanced Clear-Cell Renal-Cell Carcinoma. N. Engl. J. Med. 356, 125–134. doi:10.1056/NEJMoa060655
Escudier, B., Worden, F., and Kudo, M. (2019). Sorafenib: Key Lessons from over 10 Years of Experience. Expert Rev. Anticancer Ther. 19, 177–189. doi:10.1080/14737140.2019.1559058
Fawcett, T. (2006). An Introduction to ROC Analysis. Pattern Recognition Lett. 27, 861–874. doi:10.1016/J.PATREC.2005.10.010
Fountzilas, E., Kurzrock, R., Vo, H. H., and Tsimberidou, A.-M. (2021). Wedding of Molecular Alterations and Immune Checkpoint Blockade: Genomics as a Matchmaker. J. Natl. Cancer Inst. 113, 1634–1647. doi:10.1093/jnci/djab067
Granito, A., Forgione, A., Marinelli, S., Renzulli, M., Ielasi, L., Sansone, V., et al. (2021). Experience with Regorafenib in the Treatment of Hepatocellular Carcinoma. Therap. Adv. Gastroenterol. 14, 175628482110169. doi:10.1177/17562848211016959
Guevremont, C., Jeldres, C., Perrotte, P., and Karakiewicz, P. I. (2009). Sorafenib in the Management of Metastatic Renal Cell Carcinoma. Curr. Oncol. 16 (Suppl. 1), 27–32. doi:10.3747/co.v16i0.430
He, Y., Luo, Y., Huang, L., Zhang, D., Wang, X., Ji, J., et al. (2021). New Frontiers against Sorafenib Resistance in Renal Cell Carcinoma: From Molecular Mechanisms to Predictive Biomarkers. Pharmacol. Res. 170, 105732. doi:10.1016/j.phrs.2021.105732
Hechtman, J. F., Benayed, R., Hyman, D. M., Drilon, A., Zehir, A., Frosina, D., et al. (2017). Pan-Trk Immunohistochemistry Is an Efficient and Reliable Screen for the Detection of NTRK Fusions. Am. J. Surg. Pathol. 41, 1547–1551. doi:10.1097/PAS.0000000000000911
Hira, Z. M., and Gillies, D. F. (2015). A Review of Feature Selection and Feature Extraction Methods Applied on Microarray Data. Adv. Bioinformatics 2015, 1–13. doi:10.1155/2015/198363
Ho, T. H., Liu, X.-D., Huang, Y., Warneke, C. L., Johnson, M. M., Hoang, A., et al. (2015). The Impact of FGFR1 and FRS2α Expression on Sorafenib Treatment in Metastatic Renal Cell Carcinoma. BMC Cancer 15. doi:10.1186/s12885-015-1302-1
Jonasch, E., Corn, P., Pagliaro, L. C., Warneke, C. L., Johnson, M. M., Tamboli, P., et al. (2009). Upfront, Randomized, Phase 2 Trial of Sorafenib versus Sorafenib and Low-Dose Interferon Alfa in Patients with Advanced Renal Cell Carcinoma. Cancer 116, NA. doi:10.1002/cncr.24685
Larkin, J. M., and Eisen, T. (2006). Renal Cell Carcinoma and the Use of Sorafenib. Ther. Clin. Risk Manag. 2, 87–98.
Lezhnina, K., Kovalchuk, O., Zhavoronkov, A. A., Korzinkin, M. B., Zabolotneva, A. A., Shegay, P. V., et al. (2014). Novel Robust Biomarkers for Human Bladder Cancer Based on Activation of Intracellular Signaling Pathways. Oncotarget 5, 9022–9032. doi:10.18632/oncotarget.2493
Li, X. L., Chen, X. Q., Zhang, M. N., Chen, N., Nie, L., Xu, M., et al. (2015). SOX9 Was Involved in TKIs Resistance in Renal Cell Carcinoma via Raf/MEK/ERK Signaling Pathway. Int. J. Clin. Exp. Pathol. 8, 3871–3881. Available at: https://pubmed.ncbi.nlm.nih.gov/26097571.
Liu, L., Pang, X., Shang, W., Xie, H., Feng, Y., and Feng, G. (2019). Long Non-coding RNA GAS5 Sensitizes Renal Cell Carcinoma to Sorafenib via miR-21/SOX5 Pathway. Cell Cycle 18, 257–263. doi:10.1080/15384101.2018.1475826
Liu, T., Cheng, G., Kang, X., Xi, Y., Zhu, Y., Wang, K., et al. (2018). Noninvasively Evaluating the Grading and IDH1 Mutation Status of Diffuse Gliomas by Three-Dimensional Pseudo-continuous Arterial Spin Labeling and Diffusion-Weighted Imaging. Neuroradiology 60, 693–702. doi:10.1007/s00234-018-2021-5
Love, M. I., Huber, W., and Anders, S. (2014). Moderated Estimation of Fold Change and Dispersion for RNA-Seq Data with DESeq2. Genome Biol. 15, 550. doi:10.1186/s13059-014-0550-8
Méndez-Blanco, C., Fondevila, F., García-Palomo, A., González-Gallego, J., and Mauriz, J. L. (2018). Sorafenib Resistance in Hepatocarcinoma: Role of Hypoxia-Inducible Factors. Exp. Mol. Med. 50, 1–9. doi:10.1038/s12276-018-0159-1
Nambirajan, A., and Jain, D. (2021). Recent Updates in Thoracic SMARCA4-Deficient Undifferentiated Tumor. Semin. Diagn. Pathol. 38, 83–89. doi:10.1053/j.semdp.2021.06.001
Nicolini, A., Ferrari, P., and Duffy, M. J. (2018). Prognostic and Predictive Biomarkers in Breast Cancer: Past, Present and Future. Semin. Cancer Biol. 52, 56–73. doi:10.1016/j.semcancer.2017.08.010
Pastorczak, A., Krajewska, K., Urbanska, Z., Szmyd, B., Salacinska-Los, E., Kobos, J., et al. (2021). Ovarian Carcinoma in Children with Constitutional Mutation of SMARCA4: Single-Family Report and Literature Review. Fam. Cancer 20, 355–362. doi:10.1007/s10689-021-00258-w
Sánchez-Gastaldo, A., Kempf, E., González del Alba, A., and Duran, I. (2017). Systemic Treatment of Renal Cell Cancer: A Comprehensive Review. Cancer Treat. Rev. 60, 77–89. doi:10.1016/j.ctrv.2017.08.010
Shah, A. A., Kamal, M. A., and Akhtar, S. (2021). Tumor Angiogenesis and VEGFR-2: Mechanism, Pathways and Current Biological Therapeutic Interventions. Cdm 22, 50–59. doi:10.2174/1389200221666201019143252
Sheng, X., Chi, Z., Cui, C., Si, L., Li, S., Tang, B., et al. (2016). Efficacy and Safety of Sorafenib versus Sunitinib as First-Line Treatment in Patients with Metastatic Renal Cell Carcinoma: Largest Single-center Retrospective Analysis. Oncotarget 7, 27044–27054. doi:10.18632/ONCOTARGET.7395
Sing, T., Sander, O., Beerenwinkel, N., and Lengauer, T. (2005). ROCR: Visualizing Classifier Performance in R. Bioinformatics 21, 3940–3941. doi:10.1093/bioinformatics/bti623
Sorokin, M., Ignatev, K., Barbara, V., Vladimirova, U., Muraveva, A., Suntsova, M., et al. (2020a). Molecular Pathway Activation Markers Are Associated with Efficacy of Trastuzumab Therapy in Metastatic HER2-Positive Breast Cancer Better Than Individual Gene Expression Levels. Biochem. Mosc. 85, 758–772. doi:10.1134/S0006297920070044
Sorokin, M., Ignatev, K., Poddubskaya, E., Vladimirova, U., Gaifullin, N., Lantsov, D., et al. (2020b). RNA Sequencing in Comparison to Immunohistochemistry for Measuring Cancer Biomarkers in Breast Cancer and Lung Cancer Specimens. Biomedicines 8, 114. doi:10.3390/BIOMEDICINES8050114
Sorokin, M., Kholodenko, I., Kalinovsky, D., Shamanskaya, T., Doronin, I., Konovalov, D., et al. (2020c). RNA Sequencing-Based Identification of Ganglioside GD2-Positive Cancer Phenotype. Biomedicines 8, 142. doi:10.3390/BIOMEDICINES8060142
Sorokin, M., Poddubskaya, E., Baranova, M., Glusker, A., Kogoniya, L., Markarova, E., et al. (2020d). RNA Sequencing Profiles and Diagnostic Signatures Linked with Response to Ramucirumab in Gastric Cancer. Cold Spring Harb. Mol. Case Stud. 6, a004945. doi:10.1101/mcs.a004945
Sung, H., Ferlay, J., Siegel, R. L., Laversanne, M., Soerjomataram, I., Jemal, A., et al. (2021). Global Cancer Statistics 2020: GLOBOCAN Estimates of Incidence and Mortality Worldwide for 36 Cancers in 185 Countries. CA A. Cancer J. Clin. 71, 209–249. doi:10.3322/caac.21660
Suntsova, M., Gaifullin, N., Allina, D., Reshetun, A., Li, X., Mendeleeva, L., et al. (2019). Atlas of RNA Sequencing Profiles for normal Human Tissues. Sci. Data 6, 36. doi:10.1038/s41597-019-0043-4
Tanioka, M., Fan, C., Parker, J. S., Hoadley, K. A., Hu, Z., Li, Y., et al. (2018). Integrated Analysis of RNA and DNA from the Phase III Trial CALGB 40601 Identifies Predictors of Response to Trastuzumab-Based Neoadjuvant Chemotherapy in HER2-Positive Breast Cancer. Clin. Cancer Res. 24, 5292–5304. doi:10.1158/1078-0432.CCR-17-3431
Tkachev, V., Sorokin, M., Garazha, A., Borisov, N., Buzdin, A., Tkachev, V., et al. (2020). Oncobox Method for Scoring Efficiencies of Anticancer Drugs Based on Gene Expression Data. Methods Mol. Biol. 2063, 235–255. doi:10.1007/978-1-0716-0138-9_17
Tsimberidou, A. M., Fountzilas, E., Bleris, L., and Kurzrock, R. (2020). Transcriptomics and Solid Tumors: The Next Frontier in Precision Cancer Medicine. Semin. Cancer Biol. doi:10.1016/j.semcancer.2020.09.007
Wilhelm, S., Carter, C., Lynch, M., Lowinger, T., Dumas, J., Smith, R. A., et al. (2006). Discovery and Development of Sorafenib: A Multikinase Inhibitor for Treating Cancer. Nat. Rev. Drug Discov. 5, 835–844. doi:10.1038/nrd2130
Wilhelm, S. M., Carter, C., Tang, L., Wilkie, D., McNabola, A., Rong, H., et al. (2004). BAY 43-9006 Exhibits Broad Spectrum Oral Antitumor Activity and Targets the RAF/MEK/ERK Pathway and Receptor Tyrosine Kinases Involved in Tumor Progression and Angiogenesis. Cancer Res. 64, 7099–7109. doi:10.1158/0008-5472.CAN-04-1443
Xu, Z., Yang, F., Wei, D., Liu, B., Chen, C., Bao, Y., et al. (2017). Long Noncoding RNA-SRLR Elicits Intrinsic Sorafenib Resistance via Evoking IL-6/STAT3 axis in Renal Cell Carcinoma. Oncogene 36, 1965–1977. doi:10.1038/onc.2016.356
Yang, W., Soares, J., Greninger, P., Edelman, E. J., Lightfoot, H., Forbes, S., et al. (2013). Genomics of Drug Sensitivity in Cancer (GDSC): a Resource for Therapeutic Biomarker Discovery in Cancer Cells. Nucleic Acids Res. 41, D955–D961. doi:10.1093/nar/gks1111
Yates, B., Braschi, B., Gray, K. A., Seal, R. L., Tweedie, S., and Bruford, E. A. (2017). Genenames.org: The HGNC and VGNC Resources in 2017. Nucleic Acids Res. 45, D619–D625. doi:10.1093/nar/gkw1033
Keywords: renal cell carcinoma, kidney cancer, gene signature, mRNA expression, RNA sequencing, microarray profiling, sorafenib response, tyrosine kinase inhibitor
Citation: Gudkov A, Shirokorad V, Kashintsev K, Sokov D, Nikitin D, Anisenko A, Borisov N, Sekacheva M, Gaifullin N, Garazha A, Suntsova M, Koroleva E, Buzdin A and Sorokin M (2022) Gene Expression-Based Signature Can Predict Sorafenib Response in Kidney Cancer. Front. Mol. Biosci. 9:753318. doi: 10.3389/fmolb.2022.753318
Received: 04 August 2021; Accepted: 28 January 2022;
Published: 14 March 2022.
Edited by:
William C. Cho, QEH, Hong Kong SAR, ChinaReviewed by:
Byeong Hwa Yun, United States Food and Drug Administration, United StatesMahendra K. Singh, University of Miami, United States
Yuriy L. Orlov, I. M. Sechenov First Moscow State Medical University, Russia
Copyright © 2022 Gudkov, Shirokorad, Kashintsev, Sokov, Nikitin, Anisenko, Borisov, Sekacheva, Gaifullin, Garazha, Suntsova, Koroleva, Buzdin and Sorokin. This is an open-access article distributed under the terms of the Creative Commons Attribution License (CC BY). The use, distribution or reproduction in other forums is permitted, provided the original author(s) and the copyright owner(s) are credited and that the original publication in this journal is cited, in accordance with accepted academic practice. No use, distribution or reproduction is permitted which does not comply with these terms.
*Correspondence: Maksim Sorokin, c29yb2tpbkBvbmNvYm94LmNvbQ==