
94% of researchers rate our articles as excellent or good
Learn more about the work of our research integrity team to safeguard the quality of each article we publish.
Find out more
MINI REVIEW article
Front. Mol. Biosci., 17 January 2023
Sec. Metabolomics
Volume 9 - 2022 | https://doi.org/10.3389/fmolb.2022.1070394
 Maria Mgella Zinga1,2
 Ebtesam Abdel-Shafy1,3Tadele Melak4,5
 Alessia Vignoli6,7
 Silvano Piazza4
 Luiz Fernando Zerbini8
 Leonardo Tenori6,7
 Stefano Cacciatore1,9*
KODAMA is a valuable tool in metabolomics research to perform exploratory analysis. The advanced analytical technologies commonly used for metabolic phenotyping, mass spectrometry, and nuclear magnetic resonance spectroscopy push out a bunch of high-dimensional data. These complex datasets necessitate tailored statistical analysis able to highlight potentially interesting patterns from a noisy background. Hence, the visualization of metabolomics data for exploratory analysis revolves around dimensionality reduction. KODAMA excels at revealing local structures in high-dimensional data, such as metabolomics data. KODAMA has a high capacity to detect different underlying relationships in experimental datasets and correlate extracted features with accompanying metadata. Here, we describe the main application of KODAMA exploratory analysis in metabolomics research.
Metabolomics is the discipline that involves systematic profiling and analysis of metabolites and their fluctuations (Vignoli et al., 2021). Metabolomics has been applied to many fields of research, including studies in non-communicable and infectious diseases. (Cacciatore and Loda, 2015; Vignoli et al., 2020; Bataineh et al., 2022), molecular biology (Semreen et al., 2020; AL Bataineh et al., 2021), and food research (Maccaferri et al., 2012; Ojo-Okunola et al., 2020). In the medical field, it has played a key role in enhancing research in personalized medicine (Cacciatore et al., 2018). Nuclear magnetic resonance (NMR) spectroscopy and mass spectrometry (MS) are the major platforms used to provide structural and quantitative information on metabolites in biological samples (Lenz and Wilson, 2007; Lindon et al., 2011; McCartney et al., 2019; Takis et al., 2019; Vignoli et al., 2019). A variety of metabolomics databases are created to store structural and quantitative information from these platforms. The Human Metabolome Database (HMDB) (Wishart et al., 2018) and the LIPID MAPS Structure Database (LMSD) (Sud et al., 2007) are among the commonest metabolomics databases.
Powerful analysis techniques and software tools are needed to address the large amount and variety of data generated by these platforms (Camacho et al., 2018). Advances in artificial intelligence, including machine learning (ML), have contributed to breakthroughs in different scientific disciplines through discovery and innovations in clinical and biological research (Rajkomar et al., 2019).
ML methods are employed in metabolomics (Figure 1) in the process of building predictive models (supervised learning) or identifying informative groupings within data (unsupervised learning) (Greener et al., 2022). Supervised learning algorithms predict the class (classification) or value (regression) of unlabeled datasets using a model based on a predefined set of data points and associated information (i.e., class or value) (Berry et al., 2019). Among the supervised learning algorithm, k-nearest neighbors (kNN) (Romano et al., 2018; Romano et al., 2019; Di Donato et al., 2021), partial least squares (PLS) (Bertini et al., 2012; Vignoli et al., 2022) and its variant orthogonal PLS (O-PLS) (Cacciatore et al., 2017b), support vector machine (SVM) (Cacciatore et al., 2013; Paglia et al., 2016), and random forest (RF) (Tenori et al., 2015; McCartney et al., 2019) are the most used techniques in metabolomics research. One of the performance metrics used to assess the quality of prediction is cross-validated accuracy. Briefly, a dataset is separated into training and test sets, where a predictor is built on the training set to predict the class or the values of the samples in the test set. This process is repeated multiple times with different combinations of training and test sets to calculate an average of model performances (cross-validated accuracy).
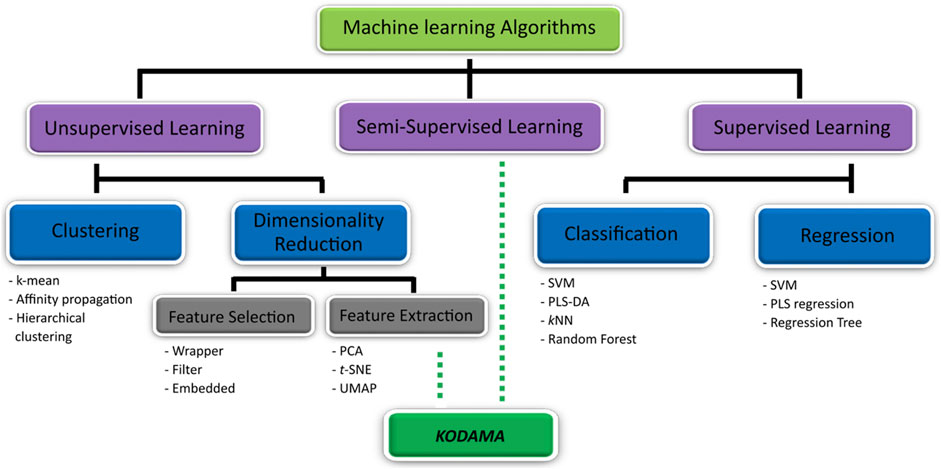
FIGURE 1. KODAMA on machine learning algorithm’s map. The machine learning algorithm can be categorized in unsupervised (i.e., clustering and dimensionality reduction method) and supervised learning. KODAMA is one of unsupervised learning methods used for dimensionality reduction. Optionally, if supervised information is used to lead the process of discovery of new patterns, KODAMA can be classified as semi-supervised.
On the other hand, unsupervised learning aims to identify unknown data patterns without prior existing knowledge of groupings within a dataset. Methods belonging to this category include clustering algorithms (e.g., k-means and hierarchical clustering) and dimensionality reduction methods (Berry et al., 2019). Clustering refers to the identification of groups within the dataset using algorithms to determine similarities which allow data points to be grouped into subsections and patterns within the dataset (Ren et al., 2015). Dimensionality reduction methods transform data with high dimensionality (many variables) into data of lesser dimensions while minimizing the loss of information. These methods can be distinct in feature selection or feature extraction. However, feature selection methods, such as univariate filter, wrapper, and embedded methods, aim to select a subset of the features that best explains the original dataset; feature extraction methods extract new features on the basis of combinations of the original features (Hira and Gillies, 2015).
Principal component analysis (PCA) is the most used feature extraction method in metabolomics (Blekherman et al., 2011; Hendriks et al., 2011; Saccenti et al., 2014). It reduces the dimensionality of the dataset while preserving variability by finding new variables that are linear functions of the ones in the original dataset, thereby maximizing variance (Pearson, 1901; Sewell, 2007). Despite the wide integration in various analyses, PCA shows inefficient performance for dimensionality reduction on large datasets (Yang et al., 2021). It failed to extract features from non-linear data and does not maintain the local structure of the data when the size of the dimension increases. In many cases, the complexity of the datasets requires the use of more flexible solutions to highlight interesting patterns in the data. Methods, such as t-distributed stochastic neighbor embedding (t-SNE) (Van der Maaten and Hinton, 2008) and uniform manifold approximation and projection (UMAP) (McInnes et al., 2018), which have seen their popularity grow in the analysis of a large dataset through single-cell RNA sequencing, have been recently applied to the analysis of a large metabolomic dataset (Buergel et al., 2022). They have the advantages of maintaining neighbor information and visualizing the local structure (Becht et al., 2019; Yang et al., 2021). Although the debate is focused on the advantages and disadvantages of using t-SNE or UMAP in terms of the global structure of the data, little attention is dedicated to their sensitivity to the noise, typical in biological datasets.
In this review, we will focus on KODAMA, an unsupervised machine-learning algorithm for feature extraction from noisy and high-dimensional data (Cacciatore et al., 2014). Unlike other methods, KODAMA results are driven by an integrated procedure of cross-validation of the results (Figures 2A–D). Golub et al. (1999) showed that a predictor based on clustering can be refined, removing samples not correctly predicted in cross-validation. We introduced the novel idea that a clustering itself can be improved by editing the class labels of samples not correctly predicted in cross-validation. In the core step of KODAMA, an initial clustering is refined through an iterative procedure, aiming to maximize the cross-validated accuracy by swapping the class labels of not correctly predicted samples with their predicted class value. The initial clustering can either be the result of any clustering methods or simply a vector where each sample belongs to a different class. In the current version, the cross-validated accuracy can be calculated by using kNN or PLS. The iterative procedure used in KODAMA leads to suboptimal solutions and is repeated to average the effects, owing to randomness. After each run of the procedure, a classification vector with high cross-validated accuracy is obtained. KODAMA subsequently collects and processes these results by constructing a dissimilarity matrix to provide a holistic view of the data while maintaining their intrinsic structure. The KODAMA dissimilarity matrix can be visualized in a low-dimensional space (generally in two dimensions) using methods, such as multidimensional scaling (MDS), where the pair-wise dissimilarity and similarity between samples are preserved (Figure 2E). The final output could be visualized as a set of points in a Cartesian space with a low number of dimensions (KODAMA dimensions).
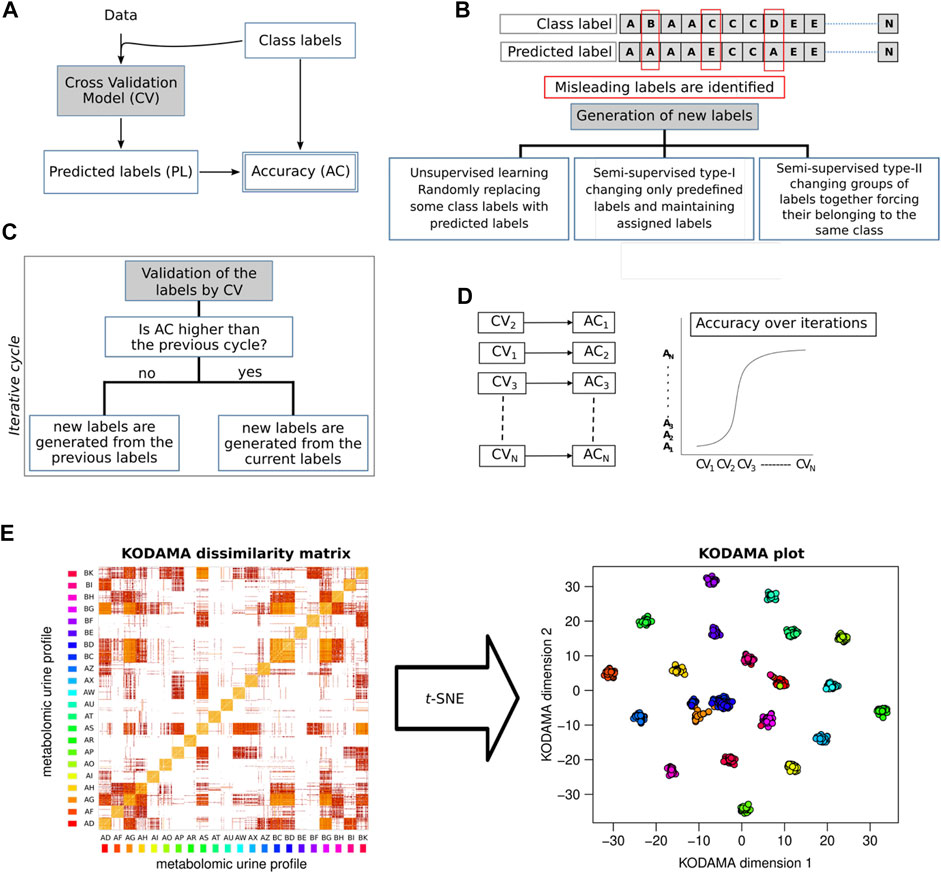
FIGURE 2. KODAMA accuracy maximization by iterative cross-validations. (A) Cross-validation model (CV) generates predicted labels (PLs) that are used to calculate the accuracy value (AC). (B) Generation of new labels to conduct the process of accuracy maximization can be i) an unsupervised method, randomly swapping some class labels of misleading samples with predicted labels; ii) semi-supervised type-I, changing only predefined labels and maintaining assigned class labels; or iii) semi-supervised type-II, changing groups of labels together forcing their belonging to the same class. (C) Generation of new labels is an iterative process aimed to identify the labels with the highest cross-validated accuracy. (D) Accuracy values increase with the number of iterations. (E) KODAMA dissimilarity matrix generated as output can be transformed with MDS, or t-SNE, in a low-dimensional space.
The algorithm is freely available from the R archive CRAN (http://cran.r-project.org) and included as a function in the homonym package (Cacciatore et al., 2017a). Since version 2.0 of the KODAMA package, t-SNE can be used to transform the dissimilarity matrix in low-dimensional space instead MDS.
This versatile method has been successfully applied to other disciplines including genomics (Meucci et al., 2019). Here, we will introduce the KODAMA application in metabolomics research.
Clustering methods are common techniques used in exploratory data analysis to group together observations in different subsets, where observations in one subset are more similar to each other than observations in different subsets. Results can depend on the chosen method’s assumptions and starting parameter values. There is a wide array of clustering approaches, each with its strengths and weaknesses. Hierarchical clustering and partition clustering are the two classes of clustering algorithms mostly used in biological research.
The ability of KODAMA in highlighting local structures facilitates the identification of clusters. The benefit of using clustering on the KODAMA dimensions was shown using simulated and experimental datasets and comparing the results of different clustering methods with KODAMA that showed a clear separation of classes (Cacciatore et al., 2014). Both partitional and hierarchical clustering can be applied to the KODAMA dimensions, as shown in different metabolomic studies described in the following paragraphs.
Partitional clustering methods, such as partition around medoids (PAM) clustering, were applied to the KODAMA dimensions to identify different phenotypes in a dataset of urine metabolome of women with lower urinary tract symptoms (Bray et al., 2017) and in a dataset of lipoprotein profiles of patients with pancreatic ductal adenocarcinoma (Elebo et al., 2021). Hierarchical clustering algorithms are largely used for the visualization of metabolic data through heatmap plots. Hierarchical clustering was also successfully applied to the output of KODAMA to identify metabolic phenotypes in the plasma of patients with prostate cancer (Cacciatore et al., 2021) and visualize metabolic data for MYC- and AKT-driven prostate cancer (Priolo et al., 2014).
In general, determining the number of clusters that fit a certain dataset is required to apply a partitional clustering or to perform a “tree cutting” of the hierarchical clustering’s dendrogram. The silhouette algorithm is one of the methods used to determine the optimal number of clusters. It computes the coefficients of each point from the measure of how much that point is similar to its own cluster compared to other clusters. The silhouette algorithm has been used to determine the optimal number of clusters both in PAM (Elebo et al., 2021) and hierarchical clustering (Cacciatore et al., 2021) on the KODAMA score. Identification of the number of clusters has shown their benefit when applied to the analysis of KODAMA scores (Cacciatore et al., 2017a).
Feature extraction facilitates the classification, visualization, and communication of high-dimensional data such as the those generated by omics sciences, including metabolomics (Hinton and Salakhutdinov, 2006). Unsupervised approaches are particularly useful to exploratively identify clustering patterns in the data and in metabolomic research. Previous studies harnessed the KODAMA algorithm to identify the metabolic phenotype in various disciplines: psychiatric, oncologic, and pregnancy research.
The identification of early biomarkers of psychotic experiences (PEs) is pivotal to timely diagnosis and effective treatment of patients at risk of future disorders, improving clinical outcomes and life quality, particularly in children and adolescents (Larsen et al., 2011). Madrid-Gambin et al. (2019) performed an integrated plasma lipidomic and proteomic study on a population of 115 children (48 cases and 67 controls) aimed at identifying early metabolic biomarkers of PEs. All patients were prospectively enrolled and evaluated, and plasma samples were collected at 12 years of age and re-evaluated at 18 years of age to identify those with definite PEs. The univariate analysis enabled the identification of a panel of 16 lipids, and one protein significantly dysregulated in children with PEs, as compared to controls. The KODAMA algorithm was used to identify potential underlying metabolic phenotypes in the study population: according to the highest silhouette median values, four clusters emerged. PE occurrence was significantly different among the four clusters. Particularly, as compared with all the others, the cluster named D, characterized by increased levels of small LDL particles, represents a metabolic phenotype with a high probability of developing PEs (occurrence 71%). The results of this study suggest early vulnerability to the development of PEs could have a metabolic basis in which the lipidome plays a key role.
The KODAMA algorithm has found its way into oncological metabolomic research. Prostate cancer (PC) is the second most frequently diagnosed cancer in men and the Black population, as compared to the other ethnicities, and has a higher risk of developing particularly aggressive PCs. Cacciatore et al. (2021) analyzed via NMR plasma samples of 41 South African men diagnosed with PC. Glycoproteins (GlycA and GlycB), well-known metabolic markers of systemic inflammation, were found to be significantly higher in patients with highly aggressive and high-stage (metastatic) diseases. Moreover, GlycA and GlycB showed significant correlations with the prostate-specific antigen. Interestingly, KODAMA enabled the identification of four metabolic clusters associated with PC aggressiveness. The metabotype IV, characterized by high levels of GlycA and GlycB, is the one associated with the worst oncological condition (and outcome), and it can be discriminated from all the others with high accuracy (PLS model accuracy: 91.2%). If further validated, the metabotype IV represents a well-defined high-risk metabolomic profile that, in future, could be used to predict patients who will be more likely to benefit from combination therapy that associates androgen deprivation with drugs that are able to reduce the level of systemic inflammation.
Elebo et al. (2021) conducted a pilot serum NMR-based metabolomic and lipoproteomic study on 34 patients diagnosed with pancreatic ductal adenocarcinoma (PDAC), 6 patients with chronic pancreatitis, and 6 healthy participants. In this study, KODAMA highlighted three distinct clusters: all healthy controls and patients with chronic pancreatitis were allocated in the cluster named N, whereas PDAC patients of clusters A and B were characterized by higher free cholesterol and cholesterol ester ratio (ratio >.45). Moreover, patients clustered in A and B, as compared to those in the cluster N, displayed a significant dysregulation of liver function parameters. The A–B profiles could represent the patient’s phenotype of patients at a high risk of obstructive jaundice that may require urgent treatment.
The KODAMA algorithm was also applied to study the metabolic phenotyping of women with lower urinary tract symptoms (LUTS) (Bray et al., 2017). Urine samples of 176 women attending tertiary urogynecology clinics and 36 healthy control women attending general gynecology clinics were analyzed through NMR spectroscopy. Despite the high urine metabolic variability, KODAMA identified four distinct urinary metabotypes associated with the variations of six clinical parameters (i.e., BMI, parity, frequency, straining, storage score, and OAB status). In particular, the metabotypes 1 and 4 showed to be the most discriminated: Metabotype 1 was enriched in patients with increased BMI and decreased frequency, whereas the opposite trends were observed in metabotype 4 patients. Interestingly, hippurate and isoleucine were crucial in this discrimination and, thus, probably play a role in LUTS. The depiction of these sub-phenotypes in such heterogeneous disease like LUTS could pave the way for more tailored pharmacological treatments, improving patient outcomes.
Semi-supervised learning is an approach that falls between supervised and unsupervised learning. It can be defined as a machine learning approach where the learning procedure is led by external supervised information. The procedure of maximization of cross-validated accuracy can be led by supervised information making KODAMA, optionally, a semi-supervised method.
There are two different ways to lead the feature extraction algorithm of KODAMA with external information (Figure 2B). In the first approach (type-I), external information can be provided as belonging to a particular sample classification (e.g., healthy status). This information is provided partially for only some samples, and it is used to lead the maximization of the cross-validated accuracy without changing the class of these samples. This led to improved model reliability, especially with limited access to curated labeled data.
In the second approach (type-II), the learning procedure considers the samples, as organized in groups. For example, if the dataset encompasses replicates, constraints can be imposed, linking some samples in such a way that if one of them is changed, the linked ones must change in the same way; they are forced to belong to the same class. This will produce a solution where linked samples are forced to have a close distance in the KODAMA scores.
KODAMA was applied as a semi-supervised type-II in a dataset containing metabolomic data on urine samples from a cohort of 22 healthy donors, where each provided about 40 urine samples over the time course of approximately 2 months, for a total of 873 samples (Cacciatore et al., 2014). The information relative to the donors of the urine samples was provided to the KODAMA algorithm. If the unsupervised KODAMA clearly separated the urine of each donor, providing this additional information, KODAMA was able to highlight the separation based on sex, which was not previously provided.
Initially, KODAMA was designed as an unsupervised method to facilitate the identification of patterns representing underlying groups on all samples in a dataset. Recently, KODAMA has been introduced as a method for investigating the chemical similarity between metabolites. In the procedure implemented in the R package MetChem, KODAMA uses the molecular structure of metabolites represented by the simplified molecular-input line-entry system (SMILES) (Weininger, 1988) to visualize the chemical similarity across metabolites in two-dimensional space. SMILES are converted into molecular fingerprints, encoding their structural characteristics as a vector (Bender and Brown, 2018). The distance between two metabolites is calculated using a distance method, such as the Tanimoto distance method (Chen and Reynolds, 2002), to produce a dissimilarity matrix. This dissimilarity matrix is then converted into a multi-dimensional space by MDS prior to being processed by KODAMA. In this way, KODAMA can offer the possibility to identify the class of metabolites structurally that may be representative of specific functions and interactions in a biological context.
KODAMA is an innovative approach that can be used for unsupervised and semi-supervised exploratory analyses of high-dimensional data for feature extraction and clustering of data points into groups based on underlying features. The application of this method has shown its benefit in the stratification of several medical conditions. Recently, a new application aimed at the identification of structural similarities among metabolites has been shown.
All authors listed have made a substantial, direct, and intellectual contribution to the work and approved it for publication.
This work was supported by the International Centre for Genetic Engineering and Biotechnology (LZ, SC, and SP); the EMPOWER Fellowship Programme (MZ); the ICGEB Arturo Falaschi fellowship (EA-S and TM); and the South African National Research Foundation (NRF) Competitive Support for Unrated Researchers: 138113 (SC).
The authors declare that the research was conducted in the absence of any commercial or financial relationships that could be construed as a potential conflict of interest.
All claims expressed in this article are solely those of the authors and do not necessarily represent those of their affiliated organizations, or those of the publisher, the editors, and the reviewers. Any product that may be evaluated in this article, or claim that may be made by its manufacturer, is not guaranteed or endorsed by the publisher.
Al Bataineh, M. T., Soares, N. C., Semreen, M. H., Cacciatore, S., Dash, N. R., Hamad, M., et al. (2021). Candida albicans PPG1, a serine/threonine phosphatase, plays a vital role in central carbon metabolisms under filament-inducing conditions: A multi-omics approach. Plos one 16 (12), e0259588. doi:10.1371/journal.pone.0259588
Bataineh, M. T. A., Cacciatore, S., Semreen, M. H., Soares, N. C., Zhu, X., Dash, N. R., et al. (2022). Exploring the effect of estrogen on Candida albicans hyphal cell wall glycans and ergosterol synthesis. Front. Cell. Infect. Microbiol. 12, 977157. doi:10.3389/fcimb.2022.977157
Becht, E., McInnes, L., Healy, J., Dutertre, C.-A., Kwok, I. W., Ng, L. G., et al. (2019). Dimensionality reduction for visualizing single-cell data using UMAP. Nat. Biotechnol. 37 (1), 38–44. doi:10.1038/nbt.4314
Berry, M. W., Mohamed, A., and Yap, B. W. (2019). Supervised and unsupervised learning for data science. Springer.
Bertini, I., Cacciatore, S., Jensen, B. V., Schou, J. V., Johansen, J. S., Kruhøffer, M., et al. (2012). Metabolomic NMR fingerprinting to identify and predict survival of patients with metastatic colorectal cancer. Cancer Res. 72 (1), 356–364. doi:10.1158/0008-5472.CAN-11-1543
Blekherman, G., Laubenbacher, R., Cortes, D. F., Mendes, P., Torti, F. M., Akman, S., et al. (2011). Bioinformatics tools for cancer metabolomics. Metabolomics 7 (3), 329–343. doi:10.1007/s11306-010-0270-3
Bray, R., Cacciatore, S., Jiménez, B., Cartwright, R., Digesu, A., Fernando, R., et al. (2017). Urinary metabolic phenotyping of women with lower urinary tract symptoms. J. Proteome Res. 16 (11), 4208–4216. doi:10.1021/acs.jproteome.7b00568
Buergel, T., Steinfeldt, J., Ruyoga, G., Pietzner, M., Bizzarri, D., Vojinovic, D., et al. (2022). Metabolomic profiles predict individual multidisease outcomes. Nat. Med. 28, 2309–2320. doi:10.1038/s41591-022-01980-3
Cacciatore, S., Hu, X., Viertler, C., Kap, M., Bernhardt, G. A., Mischinger, H.-J. r., et al. (2013). Effects of intra-and post-operative ischemia on the metabolic profile of clinical liver tissue specimens monitored by NMR. J. proteome Res. 12 (12), 5723–5729. doi:10.1021/pr400702d
Cacciatore, S., and Loda, M. (2015). Innovation in metabolomics to improve personalized healthcare. Ann. N. Y. Acad. Sci. 1346 (1), 57–62. doi:10.1111/nyas.12775
Cacciatore, S., Luchinat, C., and Tenori, L. (2014). Knowledge discovery by accuracy maximization. Proc. Natl. Acad. Sci. 111 (14), 5117–5122. doi:10.1073/pnas.1220873111
Cacciatore, S., Tenori, L., Luchinat, C., Bennett, P. R., and MacIntyre, D. A. (2017a). Kodama: an R package for knowledge discovery and data mining. Bioinformatics 33 (4), 621–623. doi:10.1093/bioinformatics/btw705
Cacciatore, S., Wium, M., Licari, C., Ajayi-Smith, A., Masieri, L., Anderson, C., et al. (2021). Inflammatory metabolic profile of South African patients with prostate cancer. Cancer & metabolism 9 (1), 29–14. doi:10.1186/s40170-021-00265-6
Cacciatore, S., Zadra, G., Bango, C., Penney, K. L., Tyekucheva, S., Yanes, O., et al. (2017b). Metabolic profiling in formalin-fixed and paraffin-embedded prostate cancer tissues. Mol. Cancer Res. 15 (4), 439–447. doi:10.1158/1541-7786.MCR-16-0262
Cacciatore, S., Zadra, G., and Loda, M. (2018). “Metabolomic-based stratification in prostate cancer,” in Precision molecular pathology of prostate cancer (Springer), 237–258.
Camacho, D. M., Collins, K. M., Powers, R. K., Costello, J. C., and Collins, J. J. (2018). Next-generation machine learning for biological networks. Cell 173 (7), 1581–1592. doi:10.1016/j.cell.2018.05.015
Chen, X., and Reynolds, C. H. (2002). Performance of similarity measures in 2D fragment-based similarity searching: Comparison of structural descriptors and similarity coefficients. J. Chem. Inf. Comput. Sci. 42 (6), 1407–1414. doi:10.1021/ci025531g
Di Donato, S., Vignoli, A., Biagioni, C., Malorni, L., Mori, E., Tenori, L., et al. (2021). A serum metabolomics classifier derived from elderly patients with metastatic colorectal cancer predicts relapse in the adjuvant setting. Cancers 13 (11), 2762. doi:10.3390/cancers13112762
Elebo, N., Omoshoro-Jones, J., Fru, P. N., Devar, J., De Wet van Zyl, C., Vorster, B. C., et al. (2021). Serum metabolomic and lipoprotein profiling of pancreatic ductal adenocarcinoma patients of african ancestry. Metabolites 11 (10), 663. doi:10.3390/metabo11100663
Golub, T. R., Slonim, D. K., Tamayo, P., Huard, C., Gaasenbeek, M., Mesirov, J. P., et al. (1999). Molecular classification of cancer: Class discovery and class prediction by gene expression monitoring. science 286 (5439), 531–537. doi:10.1126/science.286.5439.531
Greener, J. G., Kandathil, S. M., Moffat, L., and Jones, D. T. (2022). A guide to machine learning for biologists. Nat. Rev. Mol. Cell Biol. 23 (1), 40–55. doi:10.1038/s41580-021-00407-0
Hendriks, M. M., van Eeuwijk, F. A., Jellema, R. H., Westerhuis, J. A., Reijmers, T. H., Hoefsloot, H. C., et al. (2011). Data-processing strategies for metabolomics studies. TrAC Trends Anal. Chem. 30 (10), 1685–1698. doi:10.1016/j.trac.2011.04.019
Hinton, G. E., and Salakhutdinov, R. R. (2006). Reducing the dimensionality of data with neural networks. science 313 (5786), 504–507. doi:10.1126/science.1127647
Hira, Z. M., and Gillies, D. F. (2015). A review of feature selection and feature extraction methods applied on microarray data. Adv. Bioinforma. 2015, 198363. doi:10.1155/2015/198363
Larsen, T. K., Melle, I., Auestad, B., Haahr, U., Joa, I., Johannessen, J. O., et al. (2011). Early detection of psychosis: Positive effects on 5-year outcome. Psychol. Med. 41 (7), 1461–1469. doi:10.1017/S0033291710002023
Lenz, E. M., and Wilson, I. D. (2007). Analytical strategies in metabonomics. J. proteome Res. 6 (2), 443–458. doi:10.1021/pr0605217
Lindon, J. C., Nicholson, J. K., and Holmes, E. (2011). The handbook of metabonomics and metabolomics. Elsevier.
Maccaferri, S., Klinder, A., Cacciatore, S., Chitarrari, R., Honda, H., Luchinat, C., et al. (2012). In vitro fermentation of potential prebiotic flours from natural sources: Impact on the human colonic microbiota and metabolome. Mol. Nutr. food Res. 56 (8), 1342–1352. doi:10.1002/mnfr.201200046
Madrid-Gambin, F., Föcking, M., Sabherwal, S., Heurich, M., English, J. A., O’Gorman, A., et al. (2019). Integrated lipidomics and proteomics point to early blood-based changes in childhood preceding later development of psychotic experiences: Evidence from the avon longitudinal study of parents and children. Biol. psychiatry 86 (1), 25–34. doi:10.1016/j.biopsych.2019.01.018
McCartney, A., Vignoli, A., Tenori, L., Fornier, M., Rossi, L., Risi, E., et al. (2019). Metabolomic analysis of serum may refine 21-gene expression assay risk recurrence stratification. NPJ Breast Cancer 5, 26. doi:10.1038/s41523-019-0123-9
McInnes, L., Healy, J., and Melville, J. (2018). Umap: Uniform manifold approximation and projection for dimension reduction. arXiv preprint arXiv:1802.03426.
Meucci, S., Keilholz, U., Heim, D., Klauschen, F., and Cacciatore, S. (2019). Somatic genome alterations in relation to age in lung adenocarcinoma. Int. J. Cancer 145 (8), 2091–2099. doi:10.1002/ijc.32265
Ojo-Okunola, A., Cacciatore, S., Nicol, M. P., and du Toit, E. (2020). The determinants of the human milk metabolome and its role in infant health. Metabolites 10 (2), 77. doi:10.3390/metabo10020077
Paglia, G., Stocchero, M., Cacciatore, S., Lai, S., Angel, P., Alam, M. T., et al. (2016). Unbiased metabolomic investigation of Alzheimer’s disease brain points to dysregulation of mitochondrial aspartate metabolism. J. Proteome Res. 15 (2), 608–618. doi:10.1021/acs.jproteome.5b01020
Pearson, K. (1901). LIII. On lines and planes of closest fit to systems of points in space. Lond. Edinb. Dublin Philosophical Mag. J. Sci. 6 (2), 559–572. doi:10.1080/14786440109462720
Priolo, C., Pyne, S., Rose, J., Regan, E. R., Zadra, G., Photopoulos, C., et al. (2014). AKT1 and MYC induce distinctive metabolic fingerprints in human prostate cancer. Cancer Res. 74 (24), 7198–7204. doi:10.1158/0008-5472.CAN-14-1490
Rajkomar, A., Dean, J., and Kohane, I. (2019). Machine learning in medicine. N. Engl. J. Med. 380 (14), 1347–1358. doi:10.1056/NEJMra1814259
Ren, S., Hinzman, A. A., Kang, E. L., Szczesniak, R. D., and Lu, L. J. (2015). Computational and statistical analysis of metabolomics data. Metabolomics 11 (6), 1492–1513. doi:10.1007/s11306-015-0823-6
Romano, F., Meoni, G., Manavella, V., Baima, G., Mariani, G. M., Cacciatore, S., et al. (2019). Effect of non-surgical periodontal therapy on salivary metabolic fingerprint of generalized chronic periodontitis using nuclear magnetic resonance spectroscopy. Archives Oral Biol. 97, 208–214. doi:10.1016/j.archoralbio.2018.10.023
Romano, F., Meoni, G., Manavella, V., Baima, G., Tenori, L., Cacciatore, S., et al. (2018). Analysis of salivary phenotypes of generalized aggressive and chronic periodontitis through nuclear magnetic resonance-based metabolomics. J. periodontology 89 (12), 1452–1460. doi:10.1002/JPER.18-0097
Saccenti, E., Hoefsloot, H. C., Smilde, A. K., Westerhuis, J. A., and Hendriks, M. M. (2014). Reflections on univariate and multivariate analysis of metabolomics data. Metabolomics 10 (3), 361–374. doi:10.1007/s11306-013-0598-6
Semreen, M. H., Alniss, H., Cacciatore, S., El-Awady, R., Mousa, M., Almehdi, A. M., et al. (2020). GC–MS based comparative metabolomic analysis of MCF-7 and MDA-MB-231 cancer cells treated with Tamoxifen and/or Paclitaxel. J. proteomics 225. doi:10.1016/j.jprot.2020.103875
Sud, M., Fahy, E., Cotter, D., Brown, A., Dennis, E. A., Glass, C. K., et al. (2007). Lmsd: Lipid maps structure database. Nucleic acids Res. 35 (1), D527–D532. doi:10.1093/nar/gkl838
Takis, P. G., Ghini, V., Tenori, L., Turano, P., and Luchinat, C. (2019). Uniqueness of the NMR approach to metabolomics. TrAC Trends Anal. Chem. 120. doi:10.1016/j.trac.2018.10.036
Tenori, L., Oakman, C., Morris, P. G., Gralka, E., Turner, N., Cappadona, S., et al. (2015). Serum metabolomic profiles evaluated after surgery may identify patients with oestrogen receptor negative early breast cancer at increased risk of disease recurrence. Results from a retrospective study. Mol. Oncol. 9 (1), 128–139. doi:10.1016/j.molonc.2014.07.012
Van der Maaten, L., and Hinton, G. (2008). Visualizing non-metric similarities in multiple maps. J. Mach. Learn. Res. 9 (11), 33–55. doi:10.1007/s10994-011-5273-4
Vignoli, A., Fornaro, A., Tenori, L., Castelli, G., Cecconi, E., Olivotto, I., et al. (2022). Metabolomics fingerprint predicts risk of death in dilated cardiomyopathy and heart failure. Front. Cardiovasc. Med. 9, 851905. doi:10.3389/fcvm.2022.851905
Vignoli, A., Ghini, V., Meoni, G., Licari, C., Takis, P. G., Tenori, L., et al. (2019). High-throughput metabolomics by 1D NMR. Angew. Chem. Int. Ed. 58 (4), 968–994. doi:10.1002/anie.201804736
Vignoli, A., Muraro, E., Miolo, G., Tenori, L., Turano, P., Di Gregorio, E., et al. (2020). Effect of estrogen receptor status on circulatory immune and metabolomics profiles of HER2-positive breast cancer patients enrolled for neoadjuvant targeted chemotherapy. Cancers 12 (2), 314. doi:10.3390/cancers12020314
Vignoli, A., Risi, E., McCartney, A., Migliaccio, I., Moretti, E., Malorni, L., et al. (2021). Precision oncology via NMR-based metabolomics: A review on breast cancer. Int. J. Mol. Sci. 22 (9), 4687. doi:10.3390/ijms22094687
Weininger, D. (1988). SMILES, a chemical language and information system. 1. Introduction to methodology and encoding rules. J. Chem. Inf. Comput. Sci. 28 (1), 31–36. doi:10.1021/ci00057a005
Wishart, D. S., Feunang, Y. D., Marcu, A., Guo, A. C., Liang, K., Vázquez-Fresno, R., et al. (2018). Hmdb 4.0: The human metabolome database for 2018. Nucleic acids Res. 46 (D1), D608–D617. doi:10.1093/nar/gkx1089
Keywords: KODAMA, unsupervised, semi-supervised, metabolomics, clustering
Citation: Zinga MM, Abdel-Shafy E, Melak T, Vignoli A, Piazza S, Zerbini LF, Tenori L and Cacciatore S (2023) KODAMA exploratory analysis in metabolic phenotyping. Front. Mol. Biosci. 9:1070394. doi: 10.3389/fmolb.2022.1070394
Received: 14 October 2022; Accepted: 28 December 2022;
Published: 17 January 2023.
Edited by:
Oscar Yanes, University of Rovira i Virgili, SpainReviewed by:
Pietro Franceschi, Fondazione Edmund Mach, ItalyCopyright © 2023 Zinga, Abdel-Shafy, Melak, Vignoli, Piazza, Zerbini, Tenori and Cacciatore. This is an open-access article distributed under the terms of the Creative Commons Attribution License (CC BY). The use, distribution or reproduction in other forums is permitted, provided the original author(s) and the copyright owner(s) are credited and that the original publication in this journal is cited, in accordance with accepted academic practice. No use, distribution or reproduction is permitted which does not comply with these terms.
*Correspondence: Stefano Cacciatore, c3RlZmFuby5jYWNjaWF0b3JlQGljZ2ViLm9yZw==
Disclaimer: All claims expressed in this article are solely those of the authors and do not necessarily represent those of their affiliated organizations, or those of the publisher, the editors and the reviewers. Any product that may be evaluated in this article or claim that may be made by its manufacturer is not guaranteed or endorsed by the publisher.
Research integrity at Frontiers
Learn more about the work of our research integrity team to safeguard the quality of each article we publish.