 Pegah Bagheri
 Khang Hoang
 Anthony A. Fung
 Sahran Hussain
 Lingyan Shi
95% of researchers rate our articles as excellent or good
Learn more about the work of our research integrity team to safeguard the quality of each article we publish.
Find out more
ORIGINAL RESEARCH article
Front. Mol. Biosci. , 15 December 2021
Sec. Structural Biology
Volume 8 - 2021 | https://doi.org/10.3389/fmolb.2021.779702
This article is part of the Research Topic Aromatic Amino Acid Metabolism – Volume II View all 6 articles
Oxidative imbalance plays an essential role in the progression of many diseases that include cancer and neurodegenerative diseases. Aromatic amino acids (AAA) such as phenylalanine and tryptophan have the capability of escalating oxidative stress because of their involvement in the production of Reactive Oxygen Species (ROS). Here, we use D2O (heavy water) probed stimulated Raman scattering microscopy (DO-SRS) and two Photon Excitation Fluorescence (2PEF) microscopy as a multimodal imaging approach to visualize metabolic changes in HeLa cells under excess AAA such as phenylalanine or trytophan in culture media. The cellular spatial distribution of de novo lipogenesis, new protein synthesis, NADH, Flavin, unsaturated lipids, and saturated lipids were all imaged and quantified in this experiment. Our studies reveal ∼10% increase in de novo lipogenesis and the ratio of NADH to flavin, and ∼50% increase of the ratio of unsaturated lipids to saturated lipid in cells treated with excess phenylalanine or trytophan. In contrast, these cells exhibited a decrease in the protein synthesis rate by ∼10% under these AAA treatments. The cellular metabolic activities of these biomolecules are indicators of elevated oxidative stress and mitochondrial dysfunction. Furthermore, 3D reconstruction images of lipid droplets were acquired and quantified to observe their spatial distribution around cells’ nuceli under different AAA culture media. We observed a higher number of lipid droplets in excess AAA conditions. Our study showcases that DO-SRS imaging can be used to quantitatively study how excess AAA regulates metabolic activities of cells with subcellular resolution in situ.
The aromatic amino acids (AAA), L-phenylalanine and L-tryptophan, are essential for protein synthesis (Parthasarathy et al., 2018), and serve as functional components in the regulation of many metabolic pathways (Wu, 2013) with implications in diseases such as cancer (Kimura and Watanable, 2016; Cheng et al., 2019; Ma et al., 2021). AAAs can be critical intermediates that connect nucleotide, glucose, and lipid metabolism (Wei et al., 2020), but may also serve as energy sources for proliferating cancer cells. Oxidative imbalance and stress also play essential roles in the progression of cancer (Moneim, 2015; Saha et al., 2017). For instance, increased oxidative stress is a hallmark of the aging process, and continued oxidative stress can induce chronic inflammation that leads to cancer (Reuter et al., 2010). Therefore, the regulation of AAAs has the potential to amplify oxidative stress during the onset and progression of diseases. This is because excess AAA, such as phenylalanine and tryptophan, can induce the production of Reactive Oxygen Species (ROS) by activating the mammalian target of rapamycin (mTOR) and promoting oxygen consumption and mitochondrial metabolism (Wang et al., 2015; Saxton and Sabatini, 2017a; Mossmann et al., 2018). In addition, mechanistic target of rapamycin complex 1 (mTORC1) becomes specifically activated with excess AAA while the AMP-activated protein kinase (AMPK) is inhibited (Chiacchiera and Simone, 2009; Thiem et al., 2013; Vadlakonda et al., 2013; Zhao et al., 2017). Cell growth and metabolism rely on mTORC1 as a critical regulator through the modulation of lipid and protein synthesis, autophagy, and biogenesis (Takahara et al., 2020). Dysregulation of mTORC1 and related enzymes such as AMPK is associated with diseases such as cancer and neurodegenerative disorders (Blommaart et al., 1995; Sengupta et al., 2010; Saxton and Sabatini, 2017b; Takahara et al., 2020). AMPK maintains the production and consumption of ATP in eukaryotic cells (Rossi et al., 2018) and is critical for the activity of transcription factors TFEB and TFE3 (Hardie, 2007). Its inhibition blocks the targeting gene associated with autophagy-lysosome and accounts for the accumulation of lipid species (Figure 1). With the failure of autophagy and lipophagy initiation, an accumulation of lipid droplets (LDs) and increase in ROS within cells can perhaps be observed and quantified. Ultimately, these altered metabolic activities can contribute to mitochondrial dysfunctions that lead to the production of malignant precursors from healthy cells (Porporato et al., 2018). Furthermore, LDs can reflect cellular stress as oxidative stress can lead to LD accumulation (Khatchadourian et al., 2012; Younce and Kolattukudy, 2012; Lee et al., 2013). Dysfunctional mitochondria are indicative of cancer progression (de la Cruz López et al., 2019), and the upregulation of mTORC1 is implicated in the lipid metabolism of mitochondria. Due to the lack of non-invasive, label-free imaging methods, the role of AAA, specfically phenylalanine and trytophan, in cellular metabolism such as lipid synthesis and protein synthesis is unclear.
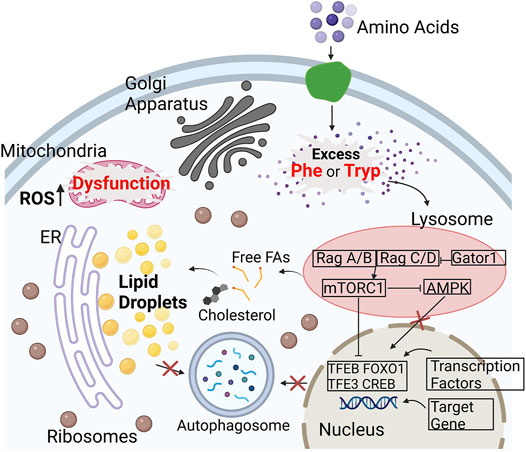
FIGURE 1. Illustration of how excess amino acids upregulate the mTORC1 pathway in cells. mTOR is a key regulator of lipid metabolism. With higher available nutrients, such as Phe (Phenylalanine) and Tryp (Tryptophan), mTORC1 is active and AMPK becomes inactive. mTOR inhibits the transcription factors, that include TFEB and TFE3, to block the targeting of transcriptional genes associated with the autophagy-lysosome (Chiacchiera and Simone, 2009; Thiem et al., 2013; Vadlakonda et al., 2013; Zhao et al., 2017). This ultimately results in lack of autophagy and start of lipophagy leading to an increase in lipid droplet accumulation and ROS. The increase in oxidative stress results in the dysfunction of the mitochondria and ER stress (Zhang et al., 2018; Paquette et al., 2021; Ralhan et al., 2021). Abbreviations: (AMPK), mechanistic target of Rapamycin complex 1 (mTORC1), (TFEB), (TFE3).
AAA studies usually rely on gas chromatography (GC) and/or mass spectroscopy (MS)-based imaging techniques to study lipids (Li et al., 2021). Electrospray ionization (ESI)-MS has also been used to study how fatty acids quantitively change with AAA supplementation (Ma et al., 2021); however, these imaging technologies lack the ability to show the lipids’ spatial distribution in cells. Other methods, such fluorescence microscopy or magnetic resonance imaging (MRI), require fluorescent dyes or simply have limited spatial resolution. Moreover, the required dyes for some of these techniques can potentially interfere with molecular activities happening within the cells (Gialleonardo et al., 2016). On the other hand, matrix-assisted laser desorption/ionization (MALDI) has been made used to study how biomarkers can regulate fatty acid metabolism in cancer cells without affecting native distributions (Pirman et al., 2013), but suffers from relatively shallow imaging depths, and poorer spatial resolution despite the additional sample preparation (Murphy et al., 2009; Bowman et al., 2020). Atomic force microscopy is another powerful technique that can be used to observe lipid formation; however, it is difficult to study the miscibility of multiple lipids (Wang et al., 2012).
Raman spectroscopy and microscopy are relatively new optical techniques that are rapidly outpacing other molecule-specific imaging methods, and excel in high resolution and chemical specificity outputs in biological samples (Ghita et al., 2012; Daudon, 2016; Ember et al., 2017). This study makes use of Deuteriun-Oxide Stimulated Raman Scattering (DO-SRS) for the subcellular analysis of the AAAs regulated metabolic dynamics for molecular signatures including newly synthesized proteins and lipids non-invasively with minimal sample preparations. Heavy water was added to the cell culture media because the deuterium could be enzymatically included into proteins and lipids through de novo biosynthesis. Therefore, metabolic activities can be closely observed using this technique coupled with DO-SRS microscopy (Figure 2A). Figure 2B displays a typical Raman spectrum that can be obtained by our Raman spectroscopy using D2O media. Thousands of variables and their multiplexed patterns can be analyzed using a spectral resolution of 1.2 cm−1 and a range from 400 cm−1 to 3200 cm−1. The Raman peaks that display the strongest patterns, in terms of different intensities and positions, are then selected to be imaged with the DO-SRS microscopy to visualize the spatial distributions of these molecules within the cell. The output of these techniques is a hyperspectral image (HSI), where an optical focus plane is captured at different Raman shifts. The slice for the HSI displays the areas in which the specific molecular bonds exist, and pixel intensities are directly proportional to these molecular bonds’ concentrations (Shi et al., 2018a). Furthermore, Two Photon Excited Fluorescence (2PEF) microscopy is coupled with DO-SRS to provide additional information of flavin and nicotinamide adenine dinucleotide (NADH) pools in the same region of interest. Flavin and NADH autofluorescence have been associated with redox homeostasis in cells and can imply lipid peroxidation status as well (Mayevsky and Barbiro-Michaely, 2009; Surre et al., 2018). Thus, using both DO-SRS and 2PEF methods will allow us to visualize the metabolic dynamics of cells when AAAs are being regulated.
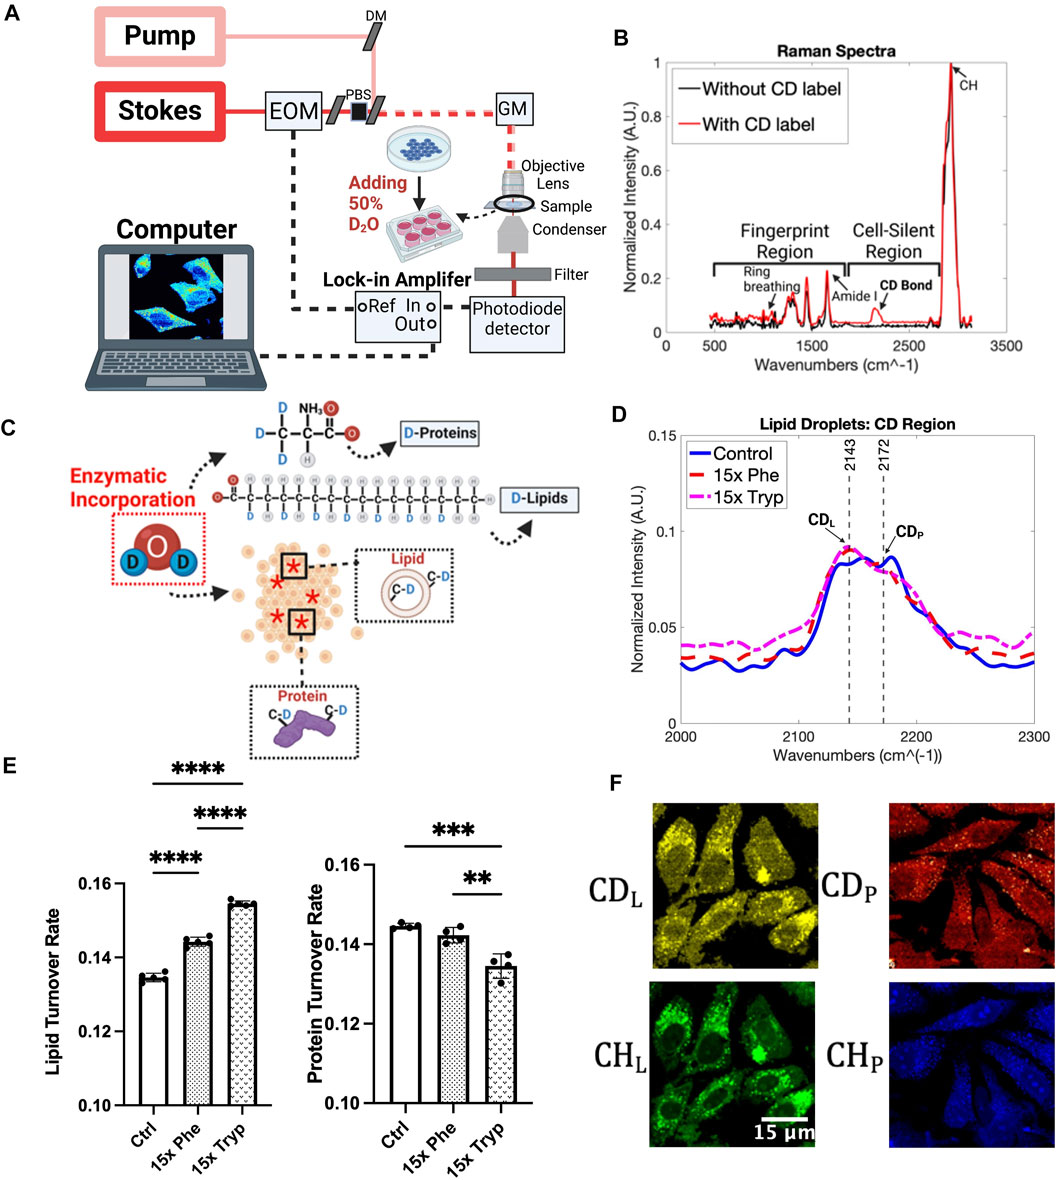
FIGURE 2. DO-SRS microscopy and Spontaneous Raman spectra. (A) Schematic diagram of the experimental setup SRS system workflow (Li et al., 2017). Abbreviations: DM (dichroic mirror), EOM (electro-optical modulator), PBS (polarizing beam splitter), GM (galvometer mirror). (B) Spontaneous Raman spectra without D2O incorporation (black) and 50% of D2O addition (red). (C) Magnification of how HeLa cells were treated with D2O and excess aromatic amino acids, Phenylalanine (Phe) and Tryptophan (Tryp). Red asterisks represent the effect of D2O to the cells. (D) Results from processed Spontaneous Raman spectrums for the control (Ctrl) group (blue), 15x Phenylalanine-treated (15x Phe) group (red), and 15x Tryptophan-treated (15x Tryp) group (magenta) from HeLa cells. Spectrums were taken with the laser focused on structures that resembled lipid droplet organelles under the brightfield imaging system. Each Raman spectrum had a background spectrum from the PBS removed before being normalized, averaged, and baseline corrected. Peaks labeled correspond to Deuterium-labelled lipid (CDL) and Deuterium-labelled protein (CDP) (Yamakoshi et al., 2011; Shi et al., 2018a; Shi et al., 2018b; Zhang et al., 2019; Zhao et al., 2020), which were observed more specifically to understand how 50% D2O cell media with the excess aromatic amino acids affected the lipid metabolic activity. (E) Quantification of the mean Raman results from CDL and CDP peaks for HeLa under control and experimental conditions. ****p < 0.0001, ***p < 0.001, **p < 0.01 from 2 way ANOVA test. (F) DO-SRS images of HeLa cells in C-D lipid (2145 cm−1) and C-D protein (2175 cm−1) on the top row. Bottom row shows SRS images of cells in the protein and lipid channels from 2940 cm−1 and 2845 cm−1.
In this study, we utilized DO-SRS microscopy coupled with 2PEF microscopy to observe the metabolic activities of lipids and proteins in cancer cells and investigate the effects of AAA on LD metabolism in HeLa cells. Quantitative lipid synthesis rates of different experimental conditions help illuminate how lipid metabolism can be affected with the regulation of phenylalanine and tryptophan. The outcomes support AAAs as targets for the accumulation of LDs and ROS.
Metabolic precursors can be tagged with deuterium before getting integrated into newly synthesized lipids and proteins (Miyagi and Kasumov, 2016), as shown in Figure 2C. DO-SRS enables one to visualize the subcellular spatial distribution of newly synthesized macromolecules with C-D bonds which have a distinguishable Raman peak in the cell silent region at 2150 cm−1 (Yamakoshi et al., 2011; Shi et al., 2018a; Shi et al., 2018b; Zhang et al., 2019; Zhao et al., 2020). 50% D2O in cell culture media produced distinct C-D Raman bands (Supplementary Figures S1A, S2B). Adding excess essential amino acids to our cell culture media at a 15x concentration introduced differences in the C-D band (Figure 2D). Indeed, with LDs being specifically observed, we noticed that both 15x phenylalanine and 15x tryptophan show higher intensities of biomolecules compared to the control group at the 2143 cm−1 peak. The lipid turnover rate was visualized with DO-SRS imaging and confirmed with spontaneous Raman spectra by showing that both aromatic amino acids have significant differences between each other and between the control group (Supplementary Figure S2B). Quantitative analysis can aid in understanding the subcellular resolution of LDs by calculating the ratios of the C-D lipid and protein peaks to their respective lipid (2850 cm−1) and protein (2930 cm−1) channels. Ten spectra were measured using Spontaneous Raman spectroscopy. The data was processed using MATLAB to subtract the background and conduct baseline correction. Resulting spectra were then vector normalized and averaged for each group. We observed a significant 7% and 15% increase in the lipid turnover rate between the control and 15x phenylalanine and 15x tryptophan case, respectively. This indicates that excess AAA has the potential to increase LD production. Interestingly, the protein in the C-D region, showed very minimal differences between the control and two experimental conditions (Figure 2D). The protein turnover rate, on the other hand, demonstrated an opposite trend to the lipid turnover rate. Specifically, there is a 1.38% decrease in the protein turnover rate between the control and 15x phenylalanine group, and a 6.6% decrease between the control and 15x tryptophan case (Figure 2E). However, the C-D protein (2185 cm−1), the protein channel (2930 cm−1), the C-D lipid (2150 cm−1) and the lipid channel (2850 cm−1) are just parts of the Spontaneous Raman spectra. Principal component analysis (PCA) shows that 19 principal components (PCs) account for 98% of the variance in the experimental groups of this study. A t-SNE diagram is used to visualize the top 15 principal components as shown in Supplementary Figure S1B. At least one dimension that distinguishes the effects of AAA on Raman spectra of HeLa cells under different treatments can be observed. This can show that even at 15x increase in concentration, we can still observe some profound differences compared to the control group. Although this verifies that phenylalanine and tryptophan do have a notable effect on lipid metabolism in cancer cells, PCA and t-SNE plots have limited ability to isolate specific peaks that contribute to major variances on Raman spectra in this study.
As various fluctuations of C-D protein and lipid signals were observed from Spontaneous Raman spectra of HeLa LDs, DO-SRS microscopy was used to visualize spatial distribution of C-D signals to a greater depth. A workflow of DO-SRS is displayed in Figure 2A. DO-SRS affords the convenience of visualizing lipid and protein metabolism simultaneously (Shi et al., 2018a). Both the C-D lipid and C-D protein channel were utilized, and the signals were clearly different between the control and the AAA conditions (Figure 2F). Image analysis highlights the spatial distribution of the lipids and proteins, and the de novo synthesis of these compounds emphasizes how much the LDs were affected by the excess phenylalanine and tryptophan.
DO-SRS imaging of experimental and control groups show differences between LD signals. Using ImageJ, the same amount of cell units from three samples are manually segmented and measured, as indicated by dotted-white borders in Figure 3A. With only the control case, there is some signal in the C-D lipid and protein channel; however, the 15x phenylalanine (15x Phe) and 15x tryptophan (15x Tryp) display even stronger signals (Figure 3A). The 15x Tryp case shows a profound signal for lipid droplets in the C-D lipid channel but a weaker signal in the C-D protein channel. A similar trend occurs for the 15x Phe as compared to the control case for both lipid and protein channels. Quantitative analysis shows the accumulation of synthesized lipid and protein (Figure 3B). Although the statistical analysis did not show significance, the ratiometric results demonstrate that the AAA conditions have greater lipid synthesis by 10–17% but reduced protein synthesis by approximately 10%. Protein synthesis is critical in the study of metabolic dynamics, and although D-labeled amino acids can be used to tack protein synthesis (Li et al., 2017), D2O has proven to be more efficient and consistent (Shi et al., 2018a). From our results, an increase in AAA can have the potential to increase lipid synthesis but decrease protein synthesis using 50% v/v D2O in the cell culture media. This evidence infers the possibility of a lack of autophagy taking place in the cells that causes an increase in LDs and promotes the generation of ROS as well as mitochondrial dysfunction (Chiacchiera and Simone, 2009; Younce and Kolattukudy, 2012; Nguyen et al., 2017; Zhang et al., 2018). DO-SRS has proven to be very effective and accurate to track the lipid and protein synthesis of HeLa cells and observing how AAA can show critical changes of the cells’ signal.
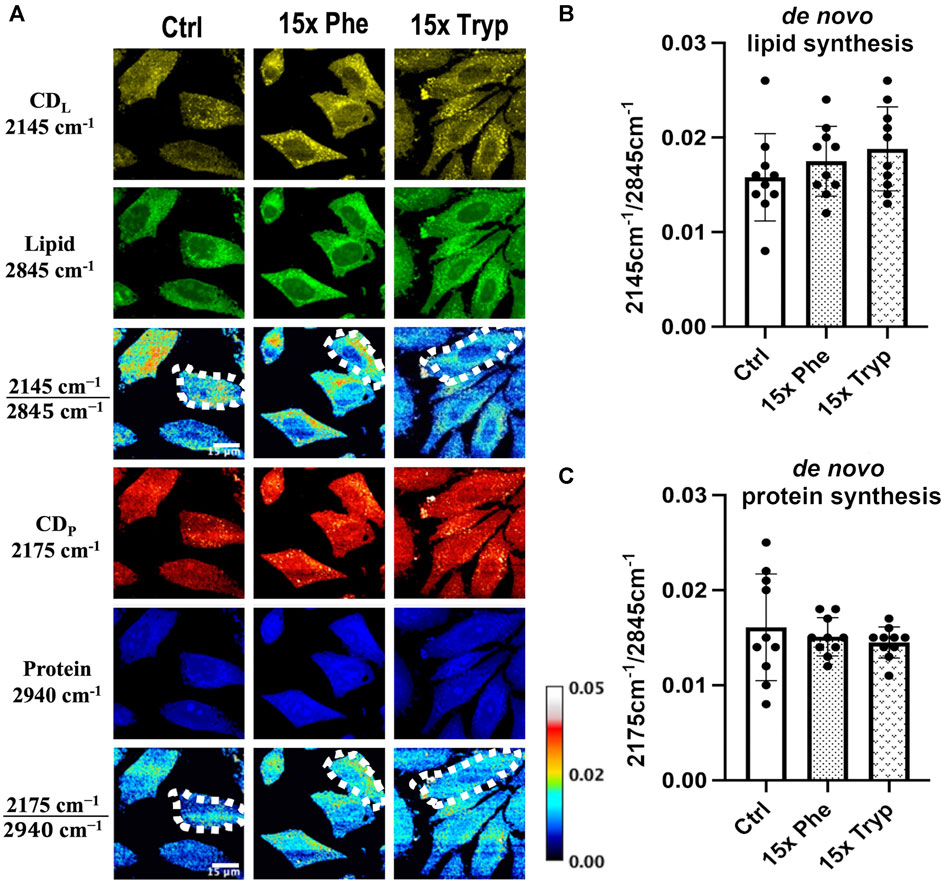
FIGURE 3. DO-SRS microscopy visualizes in vitro protein and lipid metabolism simultaneously in HeLa cells. (A) DO-SRS microscopy visualizes Deuterium-labelled lipid (CDL; 2145 cm−1), lipid (CH2; 2845 cm−1), Deuterium-labelled protein (CDP; 2175 cm−1) and protein (CH3; 2940 cm−1) channels in in HeLa cells for control (ctrl), 15x phenylalanine (15x phe), and 15x tryptophan (15x tryp).
Using SRS and 2PEF microscopy, multimodality imaging of unsaturated lipid (∼3011 cm−1), saturated lipid (∼2880 cm−1) and flavin, NADH signals were acquired (Figure 4A). Similarly, the same amount of cell units from three samples are manually segmented and measured using ImageJ as indicated by the dotted-white borders in Figure 4A. Oxygen is a critical metabolite that accepts electrons from reduced NADH and flavin at the end of the electron transport chain (ETC) (van Manen et al., 2008). However, electrons can escape NADH and flavin before reaching the end of the ETC in mitochondria to produce ROS. In some cancer cells, the accumulation of ROS induces the oxidation of polyunsaturated fatty acids, promotion of saturated lipid production, and depletion of NADH levels (Watmough et al., 1990; Wang et al., 2019; Zhang and Boppart, 2021) in response to the oxidative stress. However, HeLa cells have been shown to increase polyunsaturated lipid levels in response to elevated ROS (Cruz et al., 2020). Raman shifts have been used to describe the magnitude of unsaturated and saturated lipids at 3011 cm−1 and 2880 cm−1 (Supplementary Figure S2A), respectively (Da Silva et al., 2009; Jamieson et al., 2018).
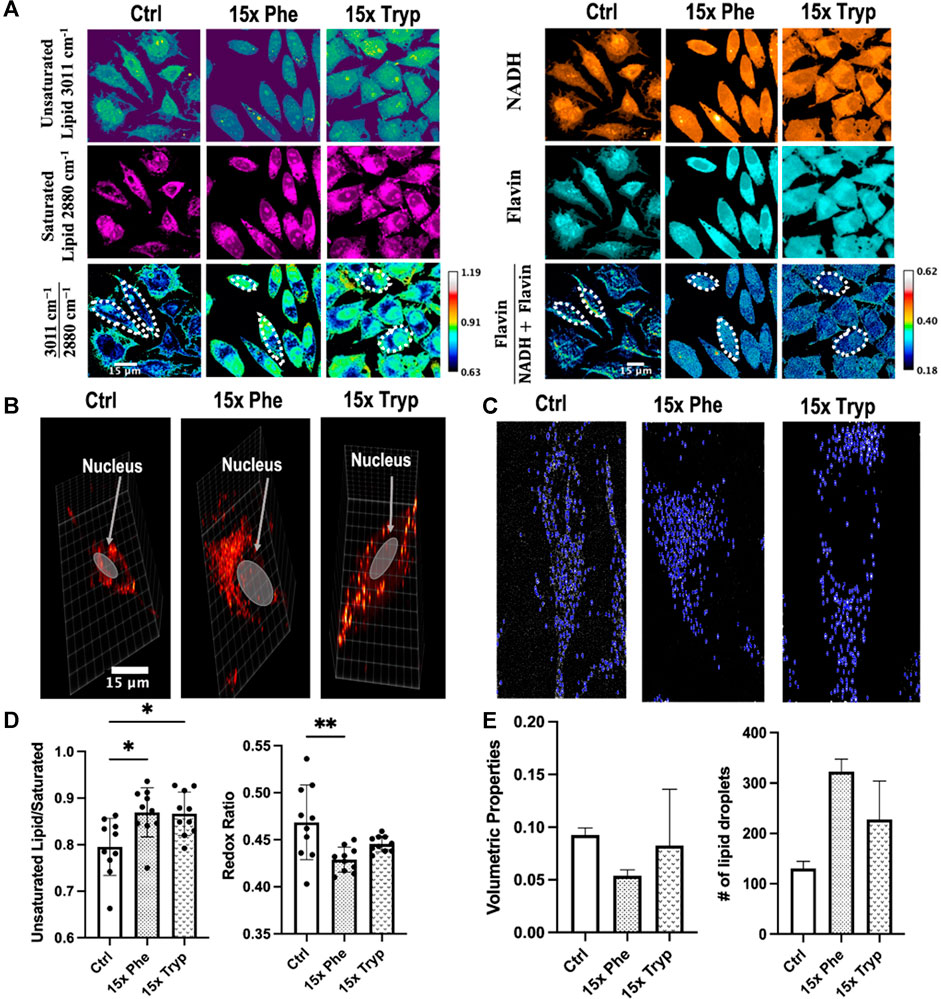
FIGURE 4. Images obtained using label-free SRS and analyzed from the unsaturated fatty acids, saturated fatty acids, NADH, and Flavin channel to observe the autofluorescence between each experimental condition. (A) SRS microscope visualizes in vitro unsaturated fatty acid
Ratiometric SRS images demonstrate that excess AAA-treated cells have an elevated ratio of unsaturated lipid/saturated lipid by 10% as compared to the control HeLa cells. However, neither the lipid saturation nor the optical redox ratio were significantly different between the two excess AAA-treated cells (Figure 4B). Quantitative analysis further showed statistical significance between the control group and the experimental groups for both the unsaturated lipid to saturated lipid and optical redox ratio, defined as Flavin/(Flavin + NADH) autofluorescence intensity. Moreover, the optical redox ratio demonstrated higher statistical importance between the two experimental groups with a 50% increase in the ratio (Figure 4D). The enrichment of NADH and flavin demonstrates an increase in the accumulation of LDs as β-oxidation is hampered (Watmough et al., 1990; Wang et al., 2019). Unsaturated lipid images were weaker than the saturated lipid channel which displayed a higher signal to noise ratio. With the manipulation of AAAs and the consequential changes in lipid content, LD structure, number, and distribution may be affected as well.
In addition to multimodal imaging, SRS has the capability to perform 3-D image reconstruction of LDs in control and AAA-treated HeLa samples. In short, the microscopy produces a set of cross-sectional images throughout the entire depth of a selected region of interest. In this study, we tune the stimulated Raman loss (SRL) to 2845 cm−1 and scan a region of interest from the top layer to the bottom layer with a step size of 1 micron (Figures 4B,C). Quantitative analyses of LD count and size were performed for each condition (Figure 4E). Both excess AAA-treated cells exhibited greater counts of LD but reduced volumetric properties compared to the control cell (Figure 4C). Qualitatively, the presence of excess Phe causes clusters of LD on one side of the cell’s nucleus, whereas the presence of excess Tryp leads to a uniform distribution of LDs around the cell’s nucleus (Figure 4B). During the span of this study, we were only able to investigate LD volume and counts of three single cell units per condition. Therefore, the results were not statistically significant, and require further research.
The abnormal accumulation or depletion of LDs are hallmarks and perhaps causes of various human pathologies (Thiam and Beller, 2017). LD-coating proteins greatly influence LD’s size and counts, ultimately affecting LD accumulation or depletion. For instance, Perilipins are a group of LD-coating with amphipathic helices (AHs) binding domains that target LD surfaces (Thiam and Dugail, 2019). Depending on the Perilipin species and their phosphorylated states, the binding of the proteins onto LD surfaces can initiate lipolysis or lipogenesis (Sztalryd and Brasaemle, 2017). Previous studies have shown that an increased number of bulky hydrophobic amino acid residues such as Tryp and Phe on the hydrophobic face of AH in these proteins can impair their binding affinity to LDs (Thiam and Dugail, 2019). It has been reported that with the failure of lipolysis from impaired Perilipins, there is an accumulation of numerous small LDs (Schott et al., 2019). Our 3D volumetric analyses of LDs concur with these previous findings by demonstrating that LDs increase in counts but decrease in volume in the excess AAA groups compared to the control group. Therefore, the presence of excess AAA might impair perilipin function and inhibit lipolysis, which can be visualized in situ with high resolution SRS.
In this study, we applied DO-SRS and 2PEF microscopies to investigate aromatic amino acids and their effects on redox homeostasis in HeLa cells. Lipid droplets were selected because they can provide critical metabolic insights for diseases such as cancer (Cruz et al., 2020) and heavy water was used to track newly synthesized lipid and protein. These carbon-deuterium bonds display distinct signals in the cell silent region on a Raman spectrum, allowing us to quantify and visualize these newly synthesized bonds in situ. In addition, 2PEF was used to provide spatial distribution of flavin and NADH at subcellular resolution. Therefore, by using DO-SRS and 2PEF in this study, we can understand metabolic changes of HeLa cells under different excess AAA treatments and advance current diagnostic methods for these diseases with our findings (Moneim, 2015; Parthasarathy et al., 2018).
Lipid, protein, flavin and other biomolecules have been proven to be indicators or metrics to measure progression of diseases (Heikal, 2010). With DO-SRS, we were able to visualize and quantify newly synthesized lipids and proteins. We observed increased de novo lipogenesis and a slight decrease in de novo protein synthesis in excess AAA treated groups compared to the control group (Figures 3B,C). These changes were supported by our Raman spectra collected by Spontaneous Raman Spectroscopy (Supplementary Figure S1). Hyperspectral images of unsaturated and saturated lipids were visualized at their respective wavenumbers to understand the effects of oxidative imbalance caused by excess AAA in HeLa cells. The ratios of unsaturated lipid/saturated lipid were calculated and compared across three conditions. The excess AAA-treated groups exhibited increased unsaturated lipid/saturated lipid compared to the control group. 2PEF was used to excite NADH and flavin in HeLa cells. The redox ratios of NADH/Flavin were calculated, compared, and related to the ratios of unsaturated lipid/saturated lipid. Both excess AAA-treated groups exhibited increased redox ratios compared to the control group. Previous studies have showcased that lower optical redox ratios correlated with increased ROS during cancer progression (Alhallak et al., 2016). In response to oxidative imbalance, HeLa cells display decreased levels of mono- and di-unsaturated, but increased levels of polyunsaturated lipids (Rysman et al., 2010; Munir et al., 2019). However, this effect varies across different cancer types (Lisec et al., 2019). In our study, both AAA-treated groups had elevated ROS by displaying lower optical redox ratios compared to the control. Because of the elevated ROS, both AAA-treated cells in our study supported previous findings by showcasing increased levels of unsaturated lipids and decreased levels of saturated lipids, ultimately leading to higher unsaturated lipids to saturated lipids ratios in AAA-treated cells compared to the control group.
In addition, 3D reconstruction images of LD were collected by our SRS system to study quantitative features such as counts and volume of LDs. Previous studies have demonstrated that LD-coating protein exhibit reduced binding affinity for LDs in the presence of excess AAA (Thiam and Dugail, 2019). Consequently, the failure of LD-coating protein binding can interfere with lipolysis and result in an accumulation of numerous small LDs (Schott et al., 2019). Our results support these studies by highlighting that both excess AAA groups exhibited lower volumetric properties, but higher counts of LDs compared to the control group. This outcome may infer the failure of binding of LD-coating protein onto LD surfaces and higher ROS synthesis rate (Moneim, 2015; Saha et al., 2017). However, further research to investigate is needed to confirm this finding using optical techniques.
In our study, excess AAA decreased the volume of LDs but increased their counts. Perhaps, this was done by affecting the binding affinity of LD-coating proteins onto LD surfaces and decreasing lipolysis. However, further investigation of lipid-protein interactions is needed to confirm DO-SRS data. Furthermore, lower optical redox ratios were observed in excess AAA-treated cells, which corrolated to elevated ROS and increased unsaturated lipids to saturated lipids ratios. To guard against oxidative stress and apoptosis induced by ROS, HeLa cells produce more unsaturated lipids than saturated lipids during their progression (Rysman et al., 2010; Munir et al., 2019). Therefore, our study provides a better understanding of imbalanced oxidative stress effects onto HeLa cells under excess AAA treatments and showcases DO-SRS coupled with 2PEF as non-invasive, high-resolution imaging systems to study metabolic activities in situ.
In summary, this study showcases the effects of excess AAAs on cellular metabolic activities of cervical cancer cell lines and how lipid droplet phenotypes can be used as potential indicators in developments of future diagnostic methods for cancer and other closely related diseases. Without the need of labeling dyes that can interfere with normal physiological environments in a cellular sample, the state-of-the-art, non-invasive DO-SRS microscopy and 2PEF microscopy can visualize and quantify metabolic changes of various biomolecules including protein, lipid, flavin, NADH. In addition, Deuterium Oxide (D2O) allows us to locate these molecules in situ using C-D signals in the cell silent region with DO-SRS. In addition to phenylalanine and tryptophan, a water-insoluble tyrosine aromatic amino acid is not included in this study (Bowden et al., 2018). However, we intend to investigate the effects of tyrosine to obtain a holistic understanding of AAA on cellular metabolic activities in cancer and other closely related diseases. A non-linear optical second-harmonic generation (SHG) can also be applied to our SRS system to study collagen and their structure under the influence of AAA in HeLa xenograft models. Overall, our study demonstrates the useful applications of optical techniques such as DO-SRS and 2PEF in visualizing metabolic changes in situ with high resolution. Eventually, these methods can be translated to clinical settings to improve current diagnostic tools for diseases such as cancer and neurodegeneration.
HeLa cells were cultured in Dulbecco’s modified Eagles’ medium (DMEM), supplemented with 10% fetal bovine serum (FBS) and 1% penicillin/streptomycin (Fisher Scientific, Waltham, MA), and incubated with 5% CO2 at 37°C. After passaging at 80% confluence, cells were seeded at a concentration of
For the excess aromatic amino acids condition, phenylalanine and tryptophan were increased as two separate test conditions at a 15x concentration. L-phenylalanine powder (SLCF3873, Sigma Aldrich) and L-tryptophan powder (SLCF2559, Sigma Aldrich) were added to DMEM for the excess groups. Cells were then incubated for 36 h and fixed on microscope slides afterwards. Next, the cells were gently rinsed with 1x PBS with Calcium and Magnesium ions at 37°C (Fisher Scientific, 14040216), and fixed in 4% methanol-free PFA solution (VWR, 15713-S) for 15 min. The cover glass was finally mounted on the cleaned 1mm thick glass microscope slides with 120 µm spacers filled with 1x PBS for imaging and spectroscopy. These samples are stored at 4°C when not in use.
A confocal Raman microscope (XploRA PLUS, Horiba) was used to obtain spontaneous Raman spectra. The microscope is equipped with a 532 nm diode laser source and 1800 lines/mm grating. The excitation power is approximately 40mW after passing through a 100x objective lens (MPLN100x, Olympus). The spectrometer collects the intensity values in each region for a range of excitation wavenumbers from 400 cm−1 to 3150 cm−1. The acquisition time used for these samples are 90 s with a binning of 4, and accumulation of 3 for minimal noise and greater accuracy for the resulting spectra (Supplementary Figure S1A) Each spectrum is taken by targeting the desired subcellular region and an additional spectrum is taken of the background with PBS in the same focal plane. Immediately after, the background spectrum is then subtracted from each subcellular target spectrum.
An upright laser-scanning microscope (DIY multiphoton, Olympus) with a 25x water object (XLPLN, WMP2, 1.05 NA, Olympus) was used for near-IR throughput. Stokes with a wavelength at 1031 nm, 6 ps pulse width, and 80MHz repetition rate and synchronized pulsed pump beam with a tunable 720–990 nm wavelength, 5-6 ps pulse width, and 80 MHz repetition rate were supplied by the picoEmerald system (Applied Physics & Electronics) and coupled into the microscope. A high NA oil condenser (1.4 NA) was used for the collection of the Stokes and pump beams where the sample is mounted. For the water-immersion objective lens, a larger water droplet is placed on the glass cover slip of the sealed sample slide. The Stokes beam is blocked by a high O.D. shortpass filter (950 nm, Thorlabs) and transmits the pump beam onto a Si photodiode to detect the stimulated Raman loss signal. A lock-in amplifier at 20 MHz is utilized to terminate, filter, and demodulate the output current from the photodiode where the demodulated signal forms the image during the laser scanning as it is processed into the FV3000 software module FV-OSR (Olympus) as shown in Figure 2A. The images were collected at 512 × 512 pixels using a dwell time of 80 µs/pixel The images are saved as an OIR graphic file through the acquisition software by the Olympus microscope.
The background image was taken at 1900 cm−1 and subtracted from all the SRS images using ImageJ software. For multichannel SRS imaging, the pump wavelength
Label-free autofluorescence of flavins was excited at 800 nm and autofluorescence of NADH was excited at 780nm using the same tunable picosecond laser described in Stimulated Raman Scattering microscopy. Optical-parametric oscillators and amplifiers (OPO and OPA) sources provide tunable infra-red illumination. This takes place over a broad range of wavelength to allow for simultaneous multi-color imaging (Mahou et al., 2012). Back scattered emission of flavin and NADH autofluorescence was collected using a 460 nm/515nm filter cube (OCT-ET460/50M32, Olympus). These images were also 512 × 512 pixels and were acquired with an 8 µs/pixel dwell time using a 150mW power at the laser shutter.
The mathematical modeling operations were conducted using MATLAB. Scripts and functions used for processing the Raman spectra were self-written using built-in functions provided by MATLAB. Origin software was used to display original spectra as shown in Supplementary Figure S1.
The spectral pre-processing consists of several steps that include background removal, baseline correction, and vector normalization. MATLAB software was used to import the raw spectra data. Background was subtracted, and the files were converted into an array where the spectra has been interpolated at every cm−1. The raw data was then graphed for verification, and the baseline correction was performed. The resulting spectra were vector normalized and averaged for each group to reduce the amount of noise on the graph of the biomolecular signals. Each spectral peak is assigned to the vibrations of a particular chemical bond or function group.
Images were processed using MATLAB and ImageJ. To reduce horizontal noise artifacts caused by laser beam scanning, 3D image stacks of lipid droplets underwent bandpass filters and smoothing. Each lipid droplet received a spherical score by calculating the distance between its center of mass and surface. Subsequently, every spherical score of different lipid droplets were compared with a spherical score of a perfect sphere on the same Euclidean plan. Those lipid droplets with low sphericity scores were discarded. Using ImageJ, ten cell units from three different regions of interest per condition were manually segmented and measured. These cell units were relative in sizes, shapes and randomly selected for analysis.
Statistical significance was verified by analysis of variance, checking the mean of more than two groups that are significantly different from each other. The mean and standard deviations were calculated for all the investigated conditions. The data were analyzed using GraphPad Prism for Mac. Significant differences between the controls and treatment groups were compared using the two-way analysis of variance (ANOVA). The data that had p-values lower than 0.05 were identified as statistically significant. MATLAB software was used to process the data for multivariate analysis. Additional statistical analysis was performed on Orange3 Data Mining Tool for greater visualization of the high-dimensional data such as primary component analysis (PCA) for more accurate representation of how the spectrums are compared from the control group to the excess aromatic amino acid groups.
The raw data supporting the conclusion of this article will be made available by the authors, without undue reservation.
LS and PB conceived and designed the project. PB and KH conducted the experiments and analyzed data with the input from AF, LS, and SH. PB, KH, and LS wrote and revised the manuscript with the input from all other authors.
The authors declare that the research was conducted in the absence of any commercial or financial relationships that could be construed as a potential conflict of interest.
All claims expressed in this article are solely those of the authors and do not necessarily represent those of their affiliated organizations, or those of the publisher, the editors and the reviewers. Any product that may be evaluated in this article, or claim that may be made by its manufacturer, is not guaranteed or endorsed by the publisher.
We thank Dr. Yajuan Li for technical support. Thanks to Fraley lab for the cell line. Figures 1, 2A,C created with BioRender.com. LS acknowledge the start-up funds from UCSD, NIH U54 pilot grant 2U54CA132378-11A1, and Hellman Fellow Award.
The Supplementary Material for this article can be found online at: https://www.frontiersin.org/articles/10.3389/fmolb.2021.779702/full#supplementary-material
Supplementary Figure S1 | Spectra obtained from Spontaneous Raman spectroscopy using 90 second acquisition time and accumulation of 3. Analysis of Spontaneous Raman spectroscopy results from HeLa cells. (A) Results obtained from control and experimental conditions: 15x Phenylalanine and 15x Tryptophan. (B) t-SNE distributions between control treated samples and excess AAA treated samples.
Supplementary Figure S2 | Multiplexed imaging of HeLa cells between control (ctrl), 15x Phenylalanine (15x Phe), and 15x Tryptophan (15x Tryp) using label-free SRS and DO-SRS imaging systems. (A) Multiplexed images of ctrl, 15x Phe, and 15x Tryp of protein (CH3; 2940 cm−1), lipid (CH2; 2845 cm−1), unsaturated lipid (3011 cm−1), saturated lipid (2880 cm−1) and 1740 cm−1 channels. Hematoxylin and Eosin staining images are produced by combining the protein and lipid channels using FIJI. (B) DO-SRS images of Deuterium-labelled lipid (CDL; 2145 cm−1), lipid (CH2; 2845 cm−1), Deuterium-labelled protein (CDP; 2175 cm−1) and protein (CH3; 2940 cm−1) channels of HeLa cells in different groups.
Alhallak, K., Rebello, L. G., Muldoon, T. J., Quinn, K. P., and Rajaram, N. (2016). Optical Redox Ratio Identifies Metastatic Potential-dependent Changes in Breast Cancer Cell Metabolism. Biomed. Opt. Express 7 (11), 4364–4374. doi:10.1364/boe.7.004364
Blommaart, E. F. C., Luiken, J. J. F. P., Blommaart, P. J. E., van Woerkom, G. M., and Meijer, A. J. (1995). Phosphorylation of Ribosomal Protein S6 Is Inhibitory for Autophagy in Isolated Rat Hepatocytes. J. Biol. Chem. 270 (5), 2320–2326. doi:10.1074/jbc.270.5.2320
Bowden, N. A., Sanders, J. P. M., and Bruins, M. E. (2018). Solubility of the Proteinogenic α-Amino Acids in Water, Ethanol, and Ethanol-Water Mixtures. J. Chem. Eng. Data 63 (3), 488–497. doi:10.1021/acs.jced.7b00486
Bowman, A. P., Bogie, J. F. J., Hendriks, J. J. A., Haidar, M., Belov, M., Heeren, R. M. A., et al. (2020). Evaluation of Lipid Coverage and High Spatial Resolution MALDI-Imaging Capabilities of Oversampling Combined with Laser post-ionisation. Anal. Bioanal. Chem. 412 (10), 2277–2289. doi:10.1007/s00216-019-02290-3
Cheng, C., Zhuo, S., Zhang, B., Zhao, X., Liu, Y., Liao, C., et al. (2019). Treatment Implications of Natural Compounds Targeting Lipid Metabolism in Nonalcoholic Fatty Liver Disease, Obesity and Cancer. Int. J. Biol. Sci. 15 (8), 1654–1663. doi:10.7150/ijbs.33837
Chiacchiera, F., and Simone, C. (2009). Inhibition of P38α Unveils an AMPK-FoxO3A axis Linking Autophagy to Cancer-specific Metabolism. Autophagy 5 (7), 1030–1033. doi:10.4161/auto.5.7.9252
Cruz, A. L. S., Barreto, E. d. A., Fazolini, N. P. B., Viola, J. P. B., and Bozza, P. T. (2020). Lipid Droplets: Platforms with Multiple Functions in Cancer Hallmarks. Cell Death Dis 11 (2), 105. doi:10.1038/s41419-020-2297-3
Da Silva, E., Bresson, S., and Rousseau, D. (2009). Characterization of the Three Major Polymorphic Forms and Liquid State of Tristearin by Raman Spectroscopy. Chem. Phys. Lipids 157 (2), 113–119. doi:10.1016/j.chemphyslip.2008.11.002
Daudon, M. B., D. (2016). Vibrational Spectroscopies to Investigate Concretions and Ectopic Calcifications for Medical Diagnosis. Comptes Rendus Chim. 19 (11-12), 1416–1423. doi:10.1016/j.crci.2016.05.011
de la Cruz López, K. G., Toledo Guzmán, M. E., Sánchez, E. O., and García Carrancá, A. (2019). mTORC1 as a Regulator of Mitochondrial Functions and a Therapeutic Target in Cancer. Front. Oncol. 9, 1373. doi:10.3389/fonc.2019.01373
Ember, K. J. I., Hoeve, M. A., McAughtrie, S. L., Bergholt, M. S., Dwyer, B. J., Stevens, M. M., et al. (2017). Raman Spectroscopy and Regenerative Medicine: a Review. NPJ Regen. Med. 2, 12. doi:10.1038/s41536-017-0014-3
Ghita, A., Pascut, F. C., Mather, M., Sottile, V., and Notingher, I. (2012). Cytoplasmic RNA in Undifferentiated Neural Stem Cells: a Potential Label-free Raman Spectral Marker for Assessing the Undifferentiated Status. Anal. Chem. 84 (7), 3155–3162. doi:10.1021/ac202994e
Gialleonardo, V. D., Wilson, D. M., and Keshari, K. R. (2016). The Potential of Metabolic Imaging. Semin. Nucl. Med. 46 (1), 28–39. doi:10.1053/j.semnuclmed.2015.09.004
Hardie, D. G. (2007). AMP-activated/SNF1 Protein Kinases: Conserved Guardians of Cellular Energy. Nat. Rev. Mol. Cel Biol 8 (10), 774–785. doi:10.1038/nrm2249
Heikal, A. A. (2010). Intracellular Coenzymes as Natural Biomarkers for Metabolic Activities and Mitochondrial Anomalies. Biomarkers Med. 4 (2), 241–263. doi:10.2217/bmm.10.1
Jamieson, L. E., Li, A., Faulds, K., and Graham, D. (2018). Ratiometric Analysis Using Raman Spectroscopy as a Powerful Predictor of Structural Properties of Fatty Acids. R. Soc. Open Sci. 5 (12), 181483. doi:10.1098/rsos.181483
Khatchadourian, A., Bourque, S. D., Richard, V. R., Titorenko, V. I., and Maysinger, D. (2012). Dynamics and Regulation of Lipid Droplet Formation in Lipopolysaccharide (LPS)-stimulated Microglia. Biochim. Biophys. Acta (Bba) - Mol. Cel Biol. Lipids 1821 (4), 607–617. doi:10.1016/j.bbalip.2012.01.007
Kimura, T., and Watanabe, Y. (2016). Tryptophan Protects Hepatocytes against Reactive Oxygen Species-dependent Cell Death via Multiple Pathways Including Nrf2-dependent Gene Induction. Amino Acids 48 (5), 1263–1274. doi:10.1007/s00726-016-2175-6
Lee, S. J., Zhang, J., Choi, A. M., and Kim, H. P. (2013). Mitochondrial Dysfunction Induces Formation of Lipid Droplets as a Generalized Response to Stress. Oxid Med. Cel Longev 2013, 327167. doi:10.1155/2013/327167
Li, X., Jiang, M., Lam, J. W. Y., Tang, B. Z., and Qu, J. Y. (2017). Mitochondrial Imaging with Combined Fluorescence and Stimulated Raman Scattering Microscopy Using a Probe of the Aggregation-Induced Emission Characteristic. J. Am. Chem. Soc. 139 (47), 17022–17030. doi:10.1021/jacs.7b06273
Li, Z., Cheng, S., Lin, Q., Cao, W., Yang, J., Zhang, M., et al. (2021). Single-cell Lipidomics with High Structural Specificity by Mass Spectrometry. Nat. Commun. 12 (1), 2869. doi:10.1038/s41467-021-23161-5
Lisec, J., Jaeger, C., Rashid, R., Munir, R., and Zaidi, N. (2019). Cancer Cell Lipid Class Homeostasis Is Altered under Nutrient-Deprivation but Stable under Hypoxia. BMC Cancer 19 (1), 501. doi:10.1186/s12885-019-5733-y
Ma, Q., Chen, J., Zhou, X., Hu, L., Sun, Y., Wang, Z., et al. (2021). Dietary Supplementation with Aromatic Amino Acids Decreased Triglycerides and Alleviated Hepatic Steatosis by Stimulating Bile Acid Synthesis in Mice. Food Funct. 12 (1), 267–277. doi:10.1039/d0fo02364g
Mahou, P., Zimmerley, M., Loulier, K., Matho, K. S., Labroille, G., Morin, X., et al. (2012). Multicolor Two-Photon Tissue Imaging by Wavelength Mixing. Nat. Methods 9 (8), 815–818. doi:10.1038/nmeth.2098
Mayevsky, A., and Barbiro-Michaely, E. (2009). Use of NADH Fluorescence to Determine Mitochondrial Function In Vivo. Int. J. Biochem. Cel Biol. 41 (10), 1977–1988. doi:10.1016/j.biocel.2009.03.012
Miyagi, M., and Kasumov, T. (2016). Monitoring the Synthesis of Biomolecules Using Mass Spectrometry. Philos. Trans. A. Math. Phys. Eng. Sci. 374, 20150378. doi:10.1098/rsta.2015.0378
Moneim, A. (2015). Oxidant/Antioxidant Imbalance and the Risk of Alzheimer's Disease. Car 12 (4), 335–349. doi:10.2174/1567205012666150325182702
Mossmann, D., Park, S., and Hall, M. N. (2018). mTOR Signalling and Cellular Metabolism Are Mutual Determinants in Cancer. Nat. Rev. Cancer 18 (12), 744–757. doi:10.1038/s41568-018-0074-8
Munir, R., Lisec, J., Swinnen, J. V., and Zaidi, N. (2019). Lipid Metabolism in Cancer Cells under Metabolic Stress. Br. J. Cancer 120 (12), 1090–1098. doi:10.1038/s41416-019-0451-4
Murphy, R. C., Hankin, J. A., and Barkley, R. M. (2009). Imaging of Lipid Species by MALDI Mass Spectrometry. J. Lipid Res. 50, S317–S322. doi:10.1194/jlr.r800051-jlr200
Nguyen, T. B., Louie, S. M., Daniele, J. R., Tran, Q., Dillin, A., Zoncu, R., et al. (2017). DGAT1-Dependent Lipid Droplet Biogenesis Protects Mitochondrial Function during Starvation-Induced Autophagy. Dev. Cel 42 (1), 9–21. doi:10.1016/j.devcel.2017.06.003
Paquette, M., El-Houjeiri, L., C. Zirden, L., Puustinen, P., Blanchette, P., Jeong, H., et al. (2021). AMPK-dependent Phosphorylation Is Required for Transcriptional Activation of TFEB and TFE3. Autophagy 17, 1–19. doi:10.1080/15548627.2021.1898748
Parthasarathy, A., Cross, P. J., Dobson, R. C. J., Adams, L. E., Savka, M. A., and Hudson, A. O. (2018). A Three-Ring Circus: Metabolism of the Three Proteogenic Aromatic Amino Acids and Their Role in the Health of Plants and Animals. Front. Mol. Biosci. 5, 29. doi:10.3389/fmolb.2018.00029
Pirman, D. A., Efuet, E., Ding, X.-P., Pan, Y., Tan, L., Fischer, S. M., et al. (2013). Changes in Cancer Cell Metabolism Revealed by Direct Sample Analysis with MALDI Mass Spectrometry. PLoS One 8 (4), e61379. doi:10.1371/journal.pone.0061379
Porporato, P. E., Filigheddu, N., Pedro, J. M. B.-S., Kroemer, G., and Galluzzi, L. (2018). Mitochondrial Metabolism and Cancer. Cell Res 28 (3), 265–280. doi:10.1038/cr.2017.155
Ralhan, I., Chang, C. L., Lippincott-Schwartz, J., and Ioannou, M. S. (2021). Lipid Droplets in the Nervous System. J. Cel Biol 220 (7), e202102136. doi:10.1083/jcb.202102136
Reuter, S., Gupta, S. C., Chaturvedi, M. M., and Aggarwal, B. B. (2010). Oxidative Stress, Inflammation, and Cancer: How Are They Linked? Free Radic. Biol. Med. 49 (11), 1603–1616. doi:10.1016/j.freeradbiomed.2010.09.006
Rossi, G., Redaelli, V., Contiero, P., Fabiano, S., Tagliabue, G., Perego, P., et al. (2018). Tau Mutations Serve as a Novel Risk Factor for Cancer. Cancer Res. 78 (13), 3731–3739. doi:10.1158/0008-5472.CAN-17-3175
Rysman, E., Brusselmans, K., Scheys, K., Timmermans, L., Derua, R., Munck, S., et al. (2010). De Novo lipogenesis Protects Cancer Cells from Free Radicals and Chemotherapeutics by Promoting Membrane Lipid Saturation. Cancer Res. 70 (20), 8117–8126. doi:10.1158/0008-5472.can-09-3871
Saha, S. K., Lee, S. B., Won, J., Choi, H. Y., Kim, K., Yang, G. M., et al. (2017). Correlation between Oxidative Stress, Nutrition, and Cancer Initiation. Int. J. Mol. Sci. 18 (7). doi:10.3390/ijms18071544
Saxton, R. A., and Sabatini, D. M. (2017). mTOR Signaling in Growth, Metabolism, and Disease. Cell 168 (6), 960–976. doi:10.1016/j.cell.2017.02.004
Saxton, R. A., and Sabatini, D. M. (2017). mTOR Signaling in Growth, Metabolism, and Disease. Cell 169 (2), 361–371. doi:10.1016/j.cell.2017.03.035
Schott, M. B., Weller, S. G., Schulze, R. J., Krueger, E. W., Drizyte-Miller, K., Casey, C. A., et al. (2019). Lipid Droplet Size Directs Lipolysis and Lipophagy Catabolism in Hepatocytes. J. Cel Biol 218 (10), 3320–3335. doi:10.1083/jcb.201803153
Sengupta, S., Peterson, T. R., and Sabatini, D. M. (2010). Regulation of the mTOR Complex 1 Pathway by Nutrients, Growth Factors, and Stress. Mol. Cel 40 (2), 310–322. doi:10.1016/j.molcel.2010.09.026
Shi, L., Shen, Y., and Min, W. (2018). Invited Article: Visualizing Protein Synthesis in Mice within Vivolabeling of Deuterated Amino Acids Using Vibrational Imaging. APL Photon. 3 (9), 092401. doi:10.1063/1.5028134
Shi, L., Zheng, C., Shen, Y., Chen, Z., Silveira, E. S., Zhang, L., et al. (2018). Optical Imaging of Metabolic Dynamics in Animals. Nat. Commun. 9 (1), 2995. doi:10.1038/s41467-018-05401-3
Surre, J., Saint-Ruf, C., Collin, V., Orenga, S., Ramjeet, M., and Matic, I. (2018). Strong Increase in the Autofluorescence of Cells Signals Struggle for Survival. Sci. Rep. 8 (1), 12088. doi:10.1038/s41598-018-30623-2
Sztalryd, C., and Brasaemle, D. L. (2017). The Perilipin Family of Lipid Droplet Proteins: Gatekeepers of Intracellular Lipolysis. Biochim. Biophys. Acta Mol. Cel Biol Lipids 1862 (10 Pt B), 1221–1232. doi:10.1016/j.bbalip.2017.07.009
Takahara, T., Amemiya, Y., Sugiyama, R., Maki, M., and Shibata, H. (2020). Amino Acid-dependent Control of mTORC1 Signaling: a Variety of Regulatory Modes. J. Biomed. Sci. 27 (1), 87. doi:10.1186/s12929-020-00679-2
Thiam, A. R., and Beller, M. (2017). The Why, when and How of Lipid Droplet Diversity. J. Cel Sci 130 (2), 315–324. doi:10.1242/jcs.192021
Thiam, A. R., and Dugail, I. (2019). Lipid Droplet-Membrane Contact Sites - from Protein Binding to Function. J. Cel Sci 132 (12), jcs230169. doi:10.1242/jcs.230169
Thiem, S., Pierce, T. P., Palmieri, M., Putoczki, T. L., Buchert, M., Preaudet, A., et al. (2013). mTORC1 Inhibition Restricts Inflammation-Associated Gastrointestinal Tumorigenesis in Mice. J. Clin. Invest. 123 (2), 767–781. doi:10.1172/JCI65086
Vadlakonda, L., Dash, A., Pasupuleti, M., Anil Kumar, K., and Reddanna, P. (2013). The Paradox of Akt-mTOR Interactions. Front. Oncol. 3, 165. doi:10.3389/fonc.2013.00165
van Manen, H.-J., Lenferink, A., and Otto, C. (2008). Noninvasive Imaging of Protein Metabolic Labeling in Single Human Cells Using Stable Isotopes and Raman Microscopy. Anal. Chem. 80 (24), 9576–9582. doi:10.1021/ac801841y
Wang, H., Ji, Y., Wu, G., Sun, K., Sun, Y., Li, W., et al. (2015). l-Tryptophan Activates Mammalian Target of Rapamycin and Enhances Expression of Tight Junction Proteins in Intestinal Porcine Epithelial Cells. J. Nutr. 145 (6), 1156–1162. doi:10.3945/jn.114.209817
Wang, T., Shogomori, H., Hara, M., Yamada, T., and Kobayashi, T. (2012). Nanomechanical Recognition of Sphingomyelin-Rich Membrane Domains by Atomic Force Microscopy. Biochemistry 51 (1), 74–82. doi:10.1021/bi2011652
Wang, Y., Palmfeldt, J., Gregersen, N., Makhov, A. M., Conway, J. F., Wang, M., et al. (2019). Mitochondrial Fatty Acid Oxidation and the Electron Transport Chain Comprise a Multifunctional Mitochondrial Protein Complex. J. Biol. Chem. 294 (33), 12380–12391. doi:10.1074/jbc.ra119.008680
Watmough, N. J., Bindoff, L. A., Birch-Machin, M. A., Jackson, S., Bartlett, K., Ragan, C. I., et al. (1990). Impaired Mitochondrial Beta-Oxidation in a Patient with an Abnormality of the Respiratory Chain. Studies in Skeletal Muscle Mitochondria. J. Clin. Invest. 85 (1), 177–184. doi:10.1172/jci114409
Wei, Z., Liu, X., Cheng, C., Yu, W., and Yi, P. (2020). Metabolism of Amino Acids in Cancer. Front Cel Dev Biol 8, 603837. doi:10.3389/fcell.2020.603837
Wu, G. (2013). Functional Amino Acids in Nutrition and Health. Amino Acids 45 (3), 407–411. doi:10.1007/s00726-013-1500-6
Yamakoshi, H., Dodo, K., Okada, M., Ando, J., Palonpon, A., Fujita, K., et al. (2011). Imaging of EdU, an Alkyne-Tagged Cell Proliferation Probe, by Raman Microscopy. J. Am. Chem. Soc. 133 (16), 6102–6105. doi:10.1021/ja108404p
Younce, C., and Kolattukudy, P. (2012). MCP-1 Induced Protein Promotes Adipogenesis via Oxidative Stress, Endoplasmic Reticulum Stress and Autophagy. Cell Physiol Biochem 30 (2), 307–320. doi:10.1159/000339066
Zhang, C., and Boppart, S. A. (2021). Tracking the Formation and Degradation of Fatty-Acid-Accumulated Mitochondria Using Label-free Chemical Imaging. Sci. Rep. 11 (1), 6671. doi:10.1038/s41598-021-85795-1
Zhang, L., Shi, L., Shen, Y., Miao, Y., Wei, M., Qian, N., et al. (2019). Spectral Tracing of Deuterium for Imaging Glucose Metabolism. Nat. Biomed. Eng. 3 (5), 402–413. doi:10.1038/s41551-019-0393-4
Zhang, X., Evans, T. D., Jeong, S.-J., and Razani, B. (2018). Classical and Alternative Roles for Autophagy in Lipid Metabolism. Curr. Opin. Lipidol. 29 (3), 203–211. doi:10.1097/mol.0000000000000509
Zhao, Y., Hu, X., Liu, Y., Dong, S., Wen, Z., He, W., et al. (2017). ROS Signaling under Metabolic Stress: Cross-Talk between AMPK and AKT Pathway. Mol. Cancer 16 (1), 79. doi:10.1186/s12943-017-0648-1
Keywords: SRS, aromatic amino acids, metabolism, metabolic dynamics, phenylalanin, tryptophan, DO-SRS, lipid metabolism
Citation: Bagheri P, Hoang K, Fung AA, Hussain S and Shi L (2021) Visualizing Cancer Cell Metabolic Dynamics Regulated With Aromatic Amino Acids Using DO-SRS and 2PEF Microscopy. Front. Mol. Biosci. 8:779702. doi: 10.3389/fmolb.2021.779702
Received: 19 September 2021; Accepted: 22 November 2021;
Published: 15 December 2021.
Edited by:
Qian Han, Hainan University, ChinaReviewed by:
Vipender Singh, Novartis Institutes for BioMedical Research, United StatesCopyright © 2021 Bagheri, Hoang, Fung, Hussain and Shi. This is an open-access article distributed under the terms of the Creative Commons Attribution License (CC BY). The use, distribution or reproduction in other forums is permitted, provided the original author(s) and the copyright owner(s) are credited and that the original publication in this journal is cited, in accordance with accepted academic practice. No use, distribution or reproduction is permitted which does not comply with these terms.
*Correspondence: Lingyan Shi, TGluZ3lhbnNoaUB1Y3NkLmVkdQ==
†These authors have contributed equally to this work
Disclaimer: All claims expressed in this article are solely those of the authors and do not necessarily represent those of their affiliated organizations, or those of the publisher, the editors and the reviewers. Any product that may be evaluated in this article or claim that may be made by its manufacturer is not guaranteed or endorsed by the publisher.
Research integrity at Frontiers
Learn more about the work of our research integrity team to safeguard the quality of each article we publish.