 Zhouying Wu1
 Min Wang1
 Feng Li1
 Feng Wang2
 Jianchao Jia1
 Zongqi Feng1
 Xue Huo1
 Jie Yang1
 Wen Jin1
 Rina Sa1
 Wenming Gao3
 Lan Yu1,4*
- 1Clinical Medical Research Center/Inner Mongolia Key Laboratory of Gene Regulation of the Metabolic Diseases, Inner Mongolia People’s Hospital, Hohhot, China
- 2Department of Pathology, Inner Mongolia People’s Hospital, Hohhot, China
- 3Departments of Cardiology, Hohhot First Hospital, Hohhot, China
- 4Department of Endocrine and Metabolic Diseases, Inner Mongolia People’s Hospital, Hohhot, China
The inhibitor of CDK4/6 has been clinically used for treating certain types of cancer which are characterized by G0/G1 acceleration induced by the CDK4/6-RB1 pathway. On the contrary, the cell cycle–related molecules are abnormal in over 50% of the patients with gastric cancer (GC), but the efficiency of inhibiting CDK4/6 does not work well as it is expected. In our study, we found HMGA2 promotes GC through accelerating the S–G2/M phase transition, instead of G0/G1. We also found CDK13 is the direct target gene of HMGA2. Importantly, we analyzed 200 pairs of GC and the adjacent tissue and proved the positive relation between HMGA2 and CDK13; moreover, high expression of both genes predicts a poorer prognosis than the expression of single gene does. We explored the effect of the novel CDK12/13 inhibiting agent, SR-4835, on high HMGA2 expression GC and found inhibition of both genes jointly could reach a satisfied result. Therefore, we suggest that inhibition of CDK13 and HMGA2 simultaneously could be an effective strategy for high HMGA2 expression GC. To detect the expression of both genes simultaneously and individually could be of benefit to predict prognosis for GC.
Introduction
Precisely regulated cell cycle maintains the normal cellular life, while uncontrolled cell cycle is one of the main features of all types of cancer. A series of complicated regulators, including cyclin-dependent kinases (CDKs), are involved in every detail of the cell phase transition of the cell cycle (Otto and Sicinski, 2017). Such CDKs as CDK4/6 are clearly researched (Harbour et al., 1999; Lazarov et al., 2002; Malumbres et al., 2004; Zhang et al., 2018a). Proved by the United States Food and Drug Administration, the CDK4/6 inhibitors have been commercially available and widely applied in some types of metastatic breast cancer, bringing the new landscape of treatment (Hortobagyi et al., 2016; Sledge et al., 2017; Slamon et al., 2018; Tripathy et al., 2018; Spring et al., 2020). Subsequently, the researchers have shed more light on not only the CDK4/6 inhibitor in many other types of cancer but also other members of CDKs (Min et al., 2018; Ding et al., 2020; Álvarez-Fernández and Malumbres, 2020).
CDK13, a transcription-associated CDK, was identified in 2001 and is known as the cholinesterase-related cell division controller as well as the regulator of the gene expression (Lapidot-Lifson et al., 1992; Marqués et al., 2000; Ko et al., 2001). CDK13 had been paid close attention in the children with certain types of congenital heart defects, and the heterozygous missense mutations of CDK13 would impair magnesium ion binding to ATP in these pediatric sufferers, yet no further studies were performed (Bostwick et al., 2017; Uehara et al., 2018; Hamilton and Suri, 2019; Novakova et al., 2019). The role of CDK13 in cancers, such as ovarian cancer and hepatocellular carcinoma, has been focused on since 2018; however, no underlining mechanism has been reported (Dong et al., 2018; Zeng et al., 2018; Wang et al., 2019). TCGA database showed that CDK13 is amplified in different categories of cancer, indicating it could contribute to the tumorigenesis and development of cancer in humans. In 2019, it was reported that the triple-negative breast cancer might get benefit from the inhibitor of CDK12/CDK13, and the mechanisms were considered to be related to the enhancement of cell apoptosis by suppression of DNA damage response proteins and the cell cycle arrest induced by dysregulation of cell cycle checkpoint control proteins based on the RNA-seq data (Hopkins and Zou, 2019; Quereda et al., 2019; Tadesse et al., 2021). Although how the cell cycle checkpoint was regulated by these potential proteins has remained unclear, one point should be noticed: the inhibitor of CDK12/CDK13 might be a promising option for some types of cancer.
Gastric cancer (GC) has been in the lightening spot for years because of the high morbidity and low survival rate (Smyth et al., 2020). The uncontrolled cell proliferation of GC is mainly driven by the inordinate cell cycle progression. It was reported that the expression of the cell cycle–related molecules was abnormal in over 50% of the patients with GC (Min et al., 2018). Frustratingly, the inhibitor of CDK4/6, as a promising inhibitor to suppress the G0/G1 phase of the cell cycle, has not proved its efficiency as it is expected (Min et al., 2018). We suspect that there must be certain specific features as far as the GC cell cycle is concerned. Whether other types of CDK inhibitors could fight well against this specific cell cycle disorder of GC has not been explored, let alone the inhibitor of CDK12/CDK13.
High mobility group A2 (HMGA2) is a kind of non-histone chromosomal protein encoded by HMGA2. Its role is to modulate transcription by influencing the chromatin architecture through broadly binding to the chromatin and forming the multiprotein complex (Cleynen and Van de Ven, 2008). In the physiological condition, the expression of HMGA2 is high during embryogenesis, but in most adult and differentiated tissues, the expression is almost undetectable (Zhou et al., 1996; Hammond and Sharpless, 2008; Nishino et al., 2008). Nevertheless, HMGA2 is re-expressed in many types of cancer (Mansoori et al., 2021), and it could manipulate tumorigenesis, metastasis, and relapse via participating in cell cycle, apoptosis, angiogenesis, epithelial–mesenchymal transition, and chemoresistance (Zhao et al., 2018; Wu et al., 2019; Li et al., 2020a; Mansoori et al., 2020). HMGA2 could be considered a novel target gene for the precision therapy due to its vital role in cancer and the specific expression characteristics in different developmental stages (Zhu et al., 2017; Huang et al., 2018). As for its role in GC, HMGA2 is considered to be closely involved in the process of metastasis and the resistance to the medication (Wei et al., 2013; Hombach-Klonisch et al., 2014; Dong et al., 2017; Li et al., 2017; Sun et al., 2017). However, there has been rare attention to the relationship between the GC cell cycle and the expression of HMGA2.
In our study, we firstly found the GC tissues with high HMGA2 expression account for over 80% of GC. HMGA2 was then overexpressed based on the parental human GC cell lines, MKN-45 and MGC-803, and the proliferation of the cells accelerated. We found such acceleration was due to the shortened cell cycle phase transition. We further speculated that CDK13 might be the wirepuller when we analyzed our data from ChIP-seq and luciferase assay. This speculation was also reflected when we investigated the relationship between HMGA2 and CDK13 in 200 pairs of GC together with the adjacent tissue.
Furthermore, high expression of both genes predicts a poorer prognosis than the expression of single genes does. We explore the effect of the novel CDK12/13 inhibiting agent, SR-4835, on the high HMGA2 expression GC cells and consider the inhibition of both genes jointly could reach a satisfied result in high HMGA2 expression GC.
Materials and Methods
Cell Lines and Cell Culture
Human gastric cancer cell lines MKN-45 and MGC-803 were purchased from the National Infrastructure of Cell Line Resource. Cell line identities were confirmed by STR profiling. The cells were cultured in RPMI medium 1640 (Gibco, 11875-093) and DMEM (Gibco, 11965-092) supplemented with 10% fetal bovine serum (FBS) (Gibco, 10091-148) and 1% penicillin–streptomycin (Gibco, 15140-122) and were maintained at 37°C with 5% CO2.
Establishment of the Stable Cell Lines
The sequence of sgRNA used in the study are listed in Table 1. Two single-guide (sg) RNAs targeting exon 1 (within the functional AT-hook domain) of HMGA2 were designed. The pX330 vector (Addgene, 42230) was used to produce pX330-HMGA2-gRNA1 and pX330-HMGA2-gRNA2 plasmids. Lipofectamine LTX and Plus Reagent (Invitrogen, 2135022) were used in transfection. The single cells were sorted via flow cytometry (BECKMAN COULTER, MoFlo Astrios EQs, United States). The DNA and RNA were extracted, and PCR and Sanger sequencing were performed. The expression level of HMGA2 was verified via RT-PCR and western blot assay.
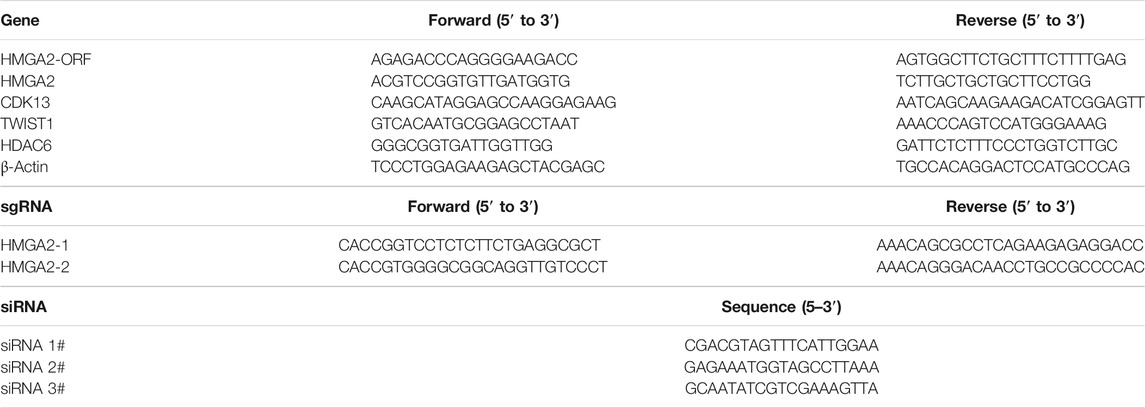
TABLE 1. Sequences of primers, sgRNA, and siRNA used in the study.
HMGA2-overexpressed cells were established using pCMV6-Entry-HMGA2 (OriGene Technologies, RC210804, China).
Inhibition of CDK13
First, CDK13 siRNA (si-h-CDK13, siB0804150912271, RIB BIO) or negative control siRNA (siR NC, siN000001-1-5, RIB BIO) was transfected into MKN-45 and MGC-803 using Lipofectamine® RNAiMAX Reagent (Invitrogen, 13778-150), respectively. Second, SR-4835 (TargetMol®, T8325/2387704-62-1) was used as the CDK13 inhibitor and added into the cell culture at 60 nM. The siRNA of CDK13 are listed in Table 1.
RT-PCR and Western Blot
Total RNA from the cells was extracted using Trizol™ Reagent (Invitrogen, 15596018). Reverse transcription was performed using PrimeScript™ RT reagent Kit with gDNA Eraser (TaKaRa, RR047A). RT-PCR was performed using TB Green® Premix Ex Taq™ II (Tli RNaseH Plus, Takara, RR820A) on the CFX96™ Real-Time System (BIO-RAD). "The primer sequence used in the study are listed in Table 1.
The cells were lysed in RIPA (Solarbio, #R0020) containing a protease inhibitor cocktail (Millipore, 539136). The protein concentration was determined using the Pierce™ BCA Protein Assay Kit (Thermo Scientific, 23227). Specific antibody–protein complexes were detected with the ECL-PLUS Kit (Thermo, M3121/1859022), and the images were captured via a gel imaging system (GE Healthcare Life Scientific, Amersham Imager 600). The primary antibodies are as follows: anti-HMGA2 (CST, #5269S), anti-CDK13 (Invitrogen, VB2774502), and anti-GAPDH (Santa Cruz Biotechnology, sc-32233).
Cell Proliferation In Vitro and In Vivo
The cell proliferation was recorded via an IncuCyte live-cell imaging system (Essen Bioscience, IncuCyte S3 2018B) for seven consecutive days. Meanwhile, cell viability was also determined via CellTiter 96 Non-Radioactive Cell Proliferation Assay Kit (Promega, G4001).
The animal experiments were approved by the animal ethics committee. Female NOD/SCID mice (7–8 weeks old, No. SCXK (Jing) 2016-0006) were purchased from Beijing Vitonlihua Experimental Animal Technology Co., Ltd. (Beijing, China), and were raised abiding by the principles of animal welfare. The processed cells were injected into the right subcutaneous axilla of the mice. The volume of the xenografts had been measured and calculated every week till the mice were sacrificed. The xenografts isolated from each group were measured and recorded.
Cell Cycle and Apoptosis Assay
For detecting the cell cycle, the cells were treated with 2 mM thymidine (Sigma T1895), synchronized to the G1/S boundary, and stained using Click-iT™ EdU Alexa Flour™ 488 Flow Cytometry Assay Kit (Invitrogen, C10425). For detecting apoptosis, the cells were stained by FITC Annexin ⅤApoptosis Detection Kit Ⅰ (BD Biosciences, 556547) at the indicated days after seeding. The stained cells were detected by flow cytometry (BECKMAN COULTER, Navios, United States), and the data were analyzed using Kaluza Analysis Software (version 2.1).
Chromatin Immunoprecipitation Following Sequencing Assay
According to the operating instructions, the ChIP procedure was conducted on HMGA2-overexpressed MKN-45 cells using HMGA2 Rabbit mAb (CST, #5269S). Histone H3 (D2B12) XP® Rabbit mAb (CST, #4620) acted as the positive control, and Normal Rabbit IgG (CST, #2729) acted as the negative control correspondingly. The results were verified by PCR. The primer we used was SimpleChIP® Human RPL30 Exon 3 Primers 1 (CST, #7014). IP efficiency was calculated with the percent input method. SimpleChIP® Plus Enzymatic Chromatin IP Kit (Magnetic Beads, CST, #9005) was used in the experiments.
The DNA was evaluated through a NanoPhotometer® spectrophotometer (IMPLEN, CA, United States) and Qubit® DNA Assay Kit in the Qubit® 2.0 Fluorometer (Life Technologies, CA, United States). The cDNA library was prepared and sequenced on Illumina’s NovaSeq platform to generate 150 base pair-end reads. The raw data were processed and mapped to the human reference genome (version hg19) using Bowtie (version 2.2.5). Peaks were identified by MACS (version 2.1.1.20160309) with p < 0.001. We calculated the read counts of genomic 500 bp regions for the treated sample and input sample. The UCSC RefSeq Genes database was used for peak annotation.
Construction of Luciferase Vectors and Dual Luciferase Assay
GAPDH-PG04 and pEZX-PG04 vectors were purchased from GeneCopoeia. The recombined luciferase vectors were conducted and named pEZX-PG04-CDK13-P, pEZX-PG04-CDK13-D, and pEZX-PG04-CDK13-P/D, respectively. pCMV6-Entry-HMGA2 was used as the HMGA2 expression vector. The Gluc/SEAP dual-reporter vectors, together with HMGA2 expression vectors, were transfected into HMGA2-knocked-out MKN-45 cells. The activities of Gluc and SEAP were measured using Secrete-Pair™ Luminescence Assay Kit (GeneCopoeia TM), and Gaussia luciferase activities were normalized to SEAP levels.
Human Tissue Specimens and Immunohistochemistry
The procedures of human tissue sampling were approved by the Medical Ethics Committee of Inner Mongolia People’s Hospital. The enrolled patients signed the informed consent form beforehand. Surgical-resected tissues from the hospitalized GC patients were sectioned into slices of 5 μm thick, and 200 pairs of the tumor and the adjacent tissue were collected. All sections were stained with the primary antibodies of anti-HMGA2 (1:100, CST, 5269S) and anti-CDK13 (1:100, Invitrogen, VB2774502) using the IHC kit (for rabbit primary antibody, Bioss Antibodies, Cat: IHC001). The immunoreactivity of HMGA2 and CDK13 was evaluated based on the Quick Score System (Detre et al., 1995).
Results
The Proliferation and Tumorigenicity Were Different Among HMGA2-OE, HMGA2-P, and HMGA2-KO Cells
HMGA2 cells in parental MKN-45 and MGC-803 cells were knocked out in a biallelic manner via a CRISPER-Cas9-sgRNA gene editing system individually and named HMGA2-KO MKN-45 and HMGA2-KO MGC-803. Simultaneously, HMGA2 cells were overexpressed based on the parental MKN-45 and MGC-803 cells. They were called HMGA2-OE MKN-45 and HMGA2-OE MGC-803, correspondingly. Sanger sequencing was conducted to investigate the gene knockout results, which showed 20-base pairs (bp) and 22-bp in HMGA2-KO MKN-45 and HMGA2-KO MGC-803 were deleted, respectively, implying the frame shift (Figures 1A,B,F,G). Subsequently, the expression of HMGA2 in HMGA2-KO MKN-45, HMGA2-KO MGC-803, HMGA2-OE MKN-45, and HMGA2-OE MGC-803 cells was detected using RT-PCR and western blot. The mRNA expression of HMGA2 in HMGA2-OE MKN-45 cells was 30 times higher than the one in the parental cells. HMGA2 in HMGA2-OE MGC-803 was 20 times higher than that in the parental MGC-803; on the contrary, the mRNA expression of HMGA2 in HMGA2-KO MKN-45 cells was five times lower than that in the parental MKN-45. HMGA2 in HMGA2-KO MGC-803 cells was two times lower than that in the parental MGC-803 (Figures 1C,H). As far as the protein expression of HMGA2 was concerned, the protein expression of HMGA2 in HMGA2-OE MKN-45 cells was seven times higher than that in the parental cells and the one in HMGA2-OE MGC-803 was five times higher than that in the parental MGC-803; on the contrary, the one was almost undetectable in both HMGA2-KO MKN-45 and HMGA2-KO MGC-803 cells (Figures 1D,E,I,J).
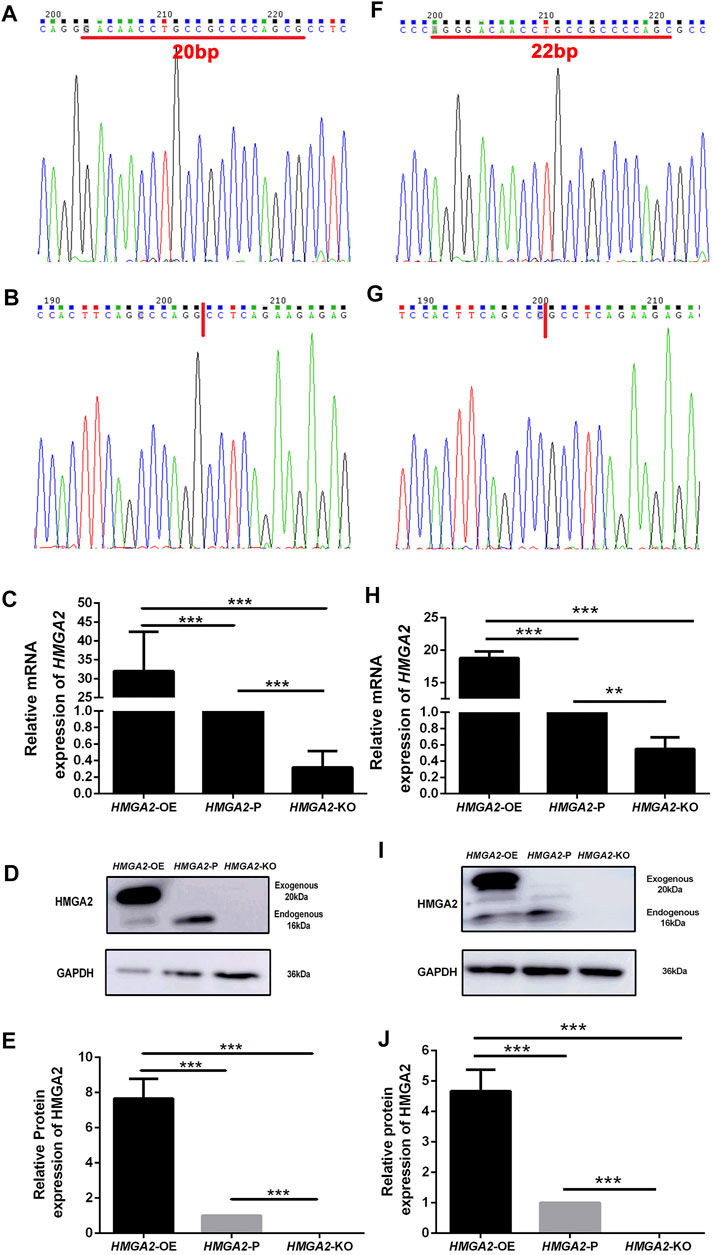
FIGURE 1. HMGA2 was knocked out in a biallelic manner and overexpressed successfully in two human gastric cancer cell lines. Sanger sequencing results of HMGA2 in HMGA2-P MKN-45 (A), HMGA2-KO MKN-45 (B), HMGA2-P MGC-803 (F), and HMGA2-KO MGC-803 (G). Red lines in (A) and (F) indicate the deleted bases of HMGA2 in HMGA2-KO MKN-45/MGC-803, respectively. The expressions of HMGA2 in the mRNA level in HMGA2-edited MKN-45 cells (C) and MGC-803 cells (H) were detected. The expressions of HMGA2 in the protein level in HMGA2-edited MKN-45 cells (D,E) and MGC-803 cells (I,J) are shown. ***p < 0.001, Student’s t-test. The error bars represent SD.
The proliferation ability of gene-edited cells and the parental cells was observed via IncuCyte S3 and MTT assay, respectively. As is shown in Figures 2A,B, no difference was found on day 0 because the number of planted cells was equal. On day 2, the descending order of proliferating speed was HMGA2-OE MKN-45, HMGA2-P MKN-45, and HMGA2-KO MKN-45, but without statistical significance. The growing speed of HMGA2-OE MKN-45 cells leapfrogged the parental cells and the HMGA2-KO MKN-45 cells from day 3 to day 8, and the parental cells transcended the HMGA2-KO MKN-45 cells from day 5 to day 8 with statistical significance, respectively (Figures 2A,B). The same trend was also proved via the MTT assay: such order began to show a statistical difference from day 3 to day 7 when the observation period was over (Figure 2C), suggesting that HMGA2 promotes the proliferation of the GC cells in vitro. Another GC cell line (MGC-803) also obtained the cell proliferating observation, presenting the same results as those in MKN-45 (Figures 2D–F).
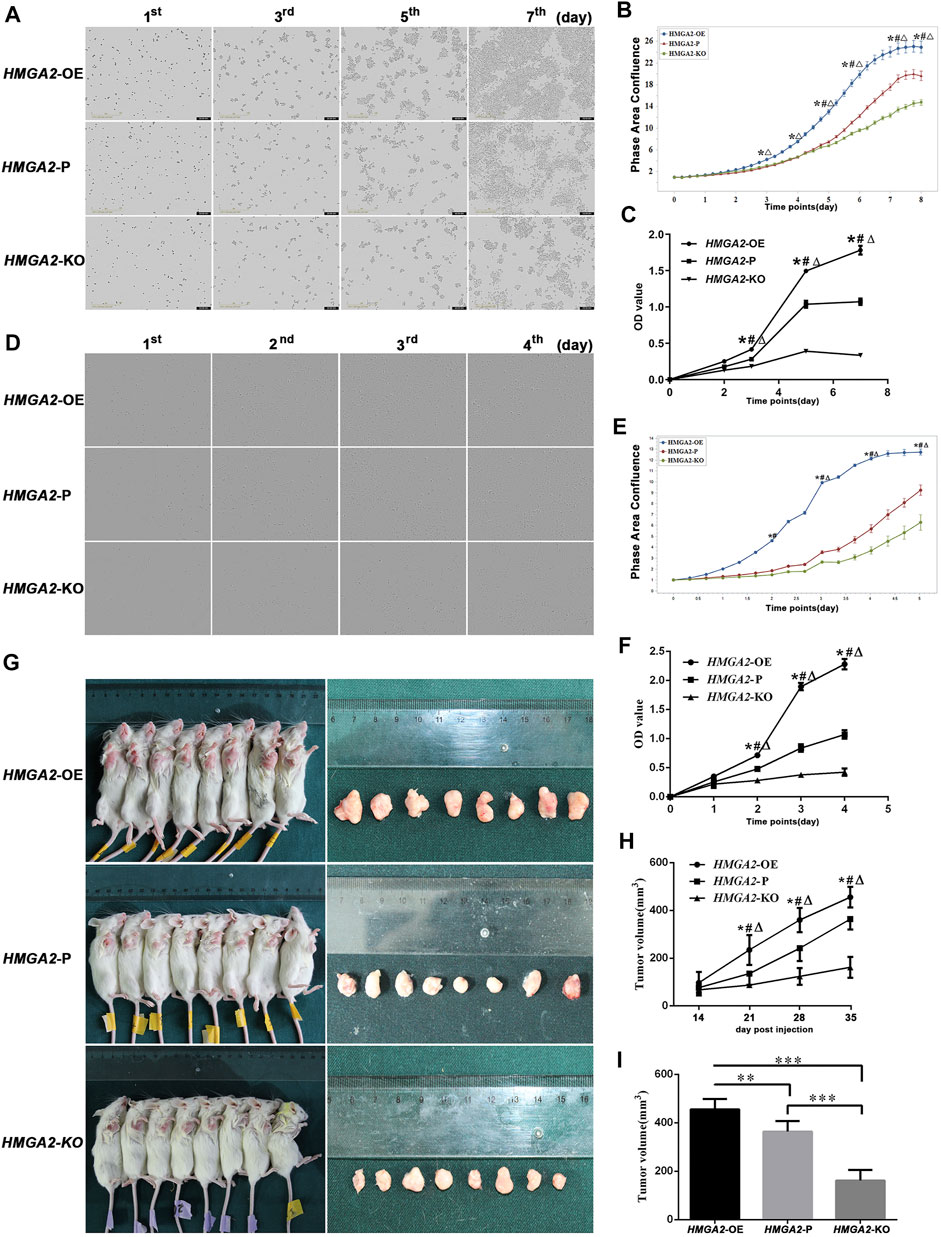
FIGURE 2. HMGA2 promotes the proliferation of the GC cells in vitro and in vivo. (A) Growth comparison of HMGA2-edited MKN-45 cells. The images in the vertical lines are the cell proliferation at different time (first, third, fifth, and seventh days). The pictures in the horizontal lines mean different groups: upper, HMGA2-OE cells; middle, HMGA2-P cells; bottom, HMGA2-KO cells. (B) Continuous proliferation records of HMGA2-edited MKN-45 cells via IncuCyte S3. Abscissa: consecutive days; ordinate: phase area confluence. The phase area confluences of the initial seeded cells in different groups were set as 1, respectively. Blue curve: HMGA2-OE cells; red one: HMGA2-P cells; green one: HMGA2-KO cells. (C) MTT assay to detect the growth of HMGA2-edited MKN-45 cells. X-axis: different days of cell viability; Y-axis: OD value. (D) Growth comparison of HMGA2-edited MGC-803 cells. Vertical lines: different time (first, second, third, and fourth days); horizontal lines: upper, HMGA2-OE cells; middle, HMGA2-P cells; bottom, HMGA2-KO cells. (E) Continuous proliferation records of HMGA2-edited MGC-803 cells via IncuCyte S3. Abscissa: consecutive days; ordinate: phase area confluence. The phase area confluences of the initial seeded cells in different groups were set as 1, respectively. Blue curve: HMGA2-OE cells; red one: HMGA2-P cells; green one: HMGA2-KO cells. (F) Growth of HMGA2-edited MGC-803 cells measured by the MTT assay. X-axis: different days of cell viability; Y-axis: OD value. (G) Tumor-bearing mice and the isolated xenografts. The NOD/SCID mice were inoculated subcutaneously under the right axilla with HMGA2-edited MKN-45 cells at the number of 2 × 10⁶ cells suspended in 100 µL PBS. The vertical lines are the sacrificed mice with xenografts and the isolated tumor correspondingly. Upper line: mice inoculated with HMGA2-OE MKN-45 cells; middle line:HMGA2-P MKN-45 cells; bottom line:HMGA2-KO MKN-45 cells. (H) Dynamic recording of the tumor volumes. The volumes of xenografts were measured each week on living mice. X-axis: different days; Y-axis: tumor volume (mm3). (I) Isolated tumor volumes of the NOD/SCID mice inoculated with different cells. X-axis: mice groups of HMGA2-OE, HMGA2-P, and HMGA2-KO cell inoculation, respectively; Y-axis: tumor volume (mm3). Symbols for (B), (C), (E), (F), and (H): *, comparison of HMGA2-OE cells with HMGA2-P cells; △, comparison of HMGA2-OE cells with HMGA2-KO cells; #, comparison of HMGA2-P cells with HMGA2-KO cells; *,△,#p < 0.05. For (I), **p < 0.01; ***p < 0.001, Student’s t-test. Error bars represent SD.
To reassure the tumorigenic ability of the newly built cell lines, the HMGA2-edited MKN-45 cells were inoculated into the NOD/SCID mice. The xenografts were measurable at the 14th day in each group, and the tumorigenesis rate was 100%. The size of xenografts was too small to be compared among groups at the beginning until that of each group had the statistical difference at the 21st day. The descending order of xenograft size was HMGA2-OE, HMGA2-P, and HMGA2-KO MKN-45. When the time went by, such difference was increasingly statistically obvious (Figures 2G–I).
In a word, both the cellular phenotype and the xenograft animal experiment proved the success and stability of the newly gene-edited cell lines. The results confirmed that HMGA2 significantly increased cell proliferation capacity in a HMGA2-dependent manner both in vivo and in vitro.
HMGA2 Shortened the S–G2/M Phase Transition and Influenced Little on Apoptosis
The cell cycle was compared among HMGA2-edited MKN-45/MGC-803 cells via flow cytometry, respectively. Taking MKN-45, for example, most of the HMGA2-OE cells spent 6 h to progress from the S phase to G2/M; when time increased to 8 and 10 h, more cells at the G2/M phase entered the G1 phase of the next cell cycle. In detail, as time went by, the number of HMGA2-OE cells at the S phase gradually dropped and reached the valley bottom at 6 h, while the ones at the G2/M phase increased and arrived at the peak at the same time point (6 h); on the contrary, the G1 cell number rose with the S and G2/M phase progression (Figure 3A upper, Figure 3C left side).
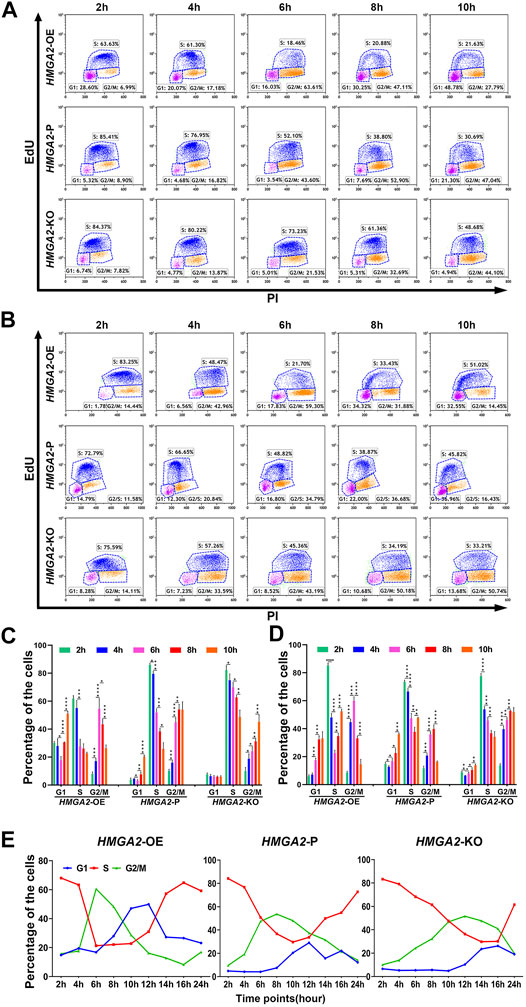
FIGURE 3. HMGA2 shortens S–G2/M phase transition of the cell cycle in two GC cell lines. (A, B) Cell cycle analysis at indicated time points via flow cytometry. Results from the (A) MKN-45 cells and (B) MGC-803 cells. Horizontal lines: upper, HMGA2-OE cells; middle, HMGA2-P cells; bottom, HMGA2-KO cells. Vertical lines: different time points after synchronizing the cells to the G1/S boundary. The time points are 2, 4, 6, 8, and 10 h. EdU negative and PI negative indicate the cells in the G0/G1 phase; EdU positive: cells in the S phase; PI positive: cells in the G2/M phase of the cell cycle. (C,D) Statistical histogram of the cellular percentage in each cell cycle phase at indicated time points. (C) MKN-45 cells and (D) MGC-803 cells. X-axis: different cell cycle phases of the different HMGA2-edited cells. Y-axis: percentage of the cells. Left flock:HMGA2-OE cells; middle flock:HMGA2-P cells; right flock:HMGA2-KO cells. *p < 0.05, **p < 0.01, ***p < 0.001, ****p < 0.0001, Student’s t-test. Error bars represent SD. (E) Dynamic percentage of the cells in each cell cycle phase recorded at continuous time. The cell cycle of MKN-45 cells was detected for a sequence of 24 h via flow cytometry after synchronized to the G1/S boundary, and the detection was conducted every 2 h. Left:HMGA2-OE MKN-45 cells; middle:HMGA2-P MKN-45 cells; right:HMGA2-KO MKN-45 cells. The red, blue, and green lines represent the proportion of cells in S, G1, and G2/M phases, respectively.
Interestingly, the number of S-phase HMGA2-P cells did not decrease to the bottom while the observing time period was about to complete. The decreasing trend, no platform, was observed as for the S-phase proportion while the G2/M-cell proportion was increasing adversely, but the dropping trend began to appear at 10 h, showing the G2/M cells began to progress into the next G1 phase (Figure 3A middle, Figure 3C middle). Such phenomenon was also observed in the HMGA2-KO groups; however, the proportion of the S-phase cells was 48.68% at 10 h, suggesting it still needs even longer time for most of the HMGA2-KO cells to progress into the next cycle (Figure 3A bottom, Figure 3C right side). The dynamic changes of the cell cycle observed among HMGA2-edited MGC-803 cells are consistent with what we observed in MKN-45 (Figures 3B,D).
To find out the exact time point when the number of S-phase cells in the HMGA2-OE, HMGA2-P, and HMGA2-KO groups was the least one, cell cycles were detected every 2 h for a sequence of 24 h (Figure 3E). Taking the percentage of S-phase cells in each group, for example, the ration of the cells in the S phase in the HMGA2-OE group began to decrease down to the valley bottom at the sixth hour, and after a flat for the next 4 h, the trend rose to the next peak, meaning the next cell cycle begins. However, such valley bottom was not the same as that in the other two groups, located at the 10th hour for HMGA2-P cells and the 14th hour for the HMGA2-KO cells, respectively. Thus, the portrait of how the expression level of HMGA2 influences the cell cycle was clearly presented. In brief, the lower the expression of HMGA2 in GC cells, the more the arrest of the cell cycle progression; furthermore, the arrest occurred in the S phase.
We investigated the apoptosis in HMGA2-edited MKN-45/MGC-803 cells, respectively. It turned out that there was no statistical significance among the groups (Supplementary Figure 1).
CDK13 Was the Direct Target of HMGA2 in Gastric Cancer
To further elucidate the underlining mechanism by which HMGA2 induced the change of phenotype in GC cells, we performed ChIP-seq analysis of HMGA2-OE MKN-45 cells with anti-HMGA2 antibody. The results shown in Figures 4A–C confirmed the trustworthy findings of ChIP-seq. The Gene Ontology analysis of HMGA2-target genes showed that CDK13 was involved in the regulation of cell population proliferation (GO: 0042127). The enrichment of CDK13 was also proved; as is shown in Figure 4D, compared with those in the input group, the peaks of the genes pulled down through HMGA2 are much higher in the district of CDK13 intron 3, which was confirmed via ChIP-qPCR, and the results presented that the abundance of HDAC6 and TWIST1 which are the well-known target genes of HMGA2 and used as the positive control was much less than the abundance of CDK13; this can be explained as follows: HMGA2 bound efficaciously to a certain DNA area of CDK13 (Figure 4E).
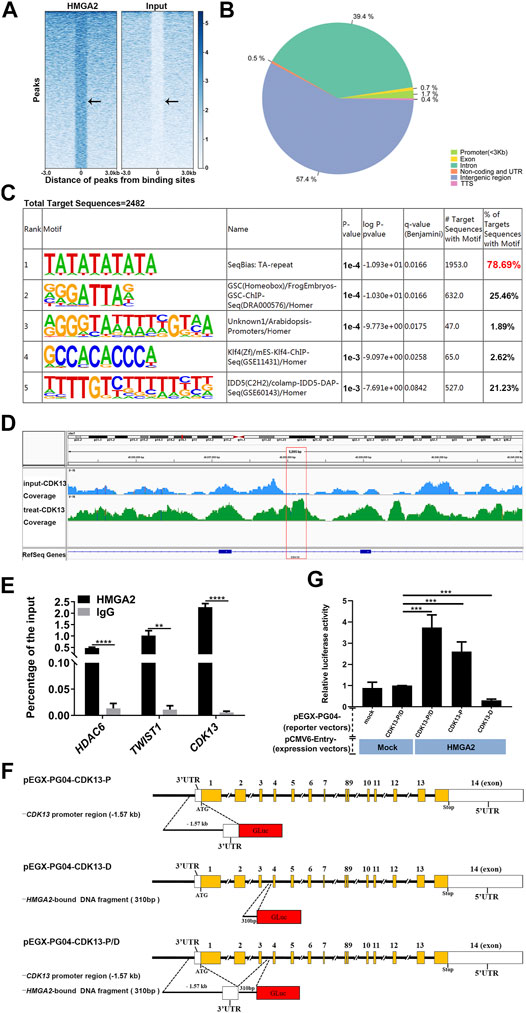
FIGURE 4. CDK13 is the direct target of HMGA2. (A) Heat map of ChIP-seq peaks. Left part: treated sample; right part: input control. The black arrow points to the HMGA2 binding sites. (B) Pie chart of the genomic distribution of HMGA2 binding sites. Blue part: intergenic region; dark green part: intron; light green part: promoter; yellow part: exon; remaining ones: TSS, non-coding and UTR. (C) Known motif enrichment results of the total target sequences immune-precipitated by HMGA2. (D) Enrichment analysis of the HMGA2 binding peaks at intron 3 of CDK13. The red box represents the specific binding site of HMGA2 in intron 3 of CDK13. The track signal is calculated by the average read count of a 500bp window. (E) Confirmation of the quantity of pull-downed CDK13 via ChIP-qPCR. HDAC6 and TWIST1 act as the positive controls. Abscissa: different genes; ordinate: percentage of the input. Black columns: DNA pulled down by HMGA2; gray one: DNA pulled down by IgG. (F) Schematic diagrams of recombinant Gluc/SEAP dual-reporter vectors. pEGX-PG04-CDK13-P (the upper line): the insert fragment cloned into pEZX-PG04 is the promoter region of CDK13, that is, the 1.57 kb upstream region from the first ATG codon on exon 1 of the CDK13 gene; pEGX-PG04-CDK13-D (the middle line): DNA fragment immune-precipitated by HMGA2, that is, the 310bp fragment on intron 3 of the CDK13 gene; pEGX-PG04-CDK13-P/D (the bottom line): promoter region of CDK13 plus the DNA fragment immune-precipitated by HMGA2. (G) Relative luciferase activity of the reporter vectors with or without HMGA2. HMGA2-KO MKN-45, in which endogenous HMGA2 does not express, was transfected with the HMGA2 expression vector together with luciferase vectors in the following order: pEZX-PG04-Mock vs pCMV6-Entry-Mock; pEZX-PG04-CDK13-P/D vs pCMV6-Entry-Mock; pEZX-PG04-CDK13-P/D vs pCMV6-Entry-HMGA2; pEZX-PG04-CDK13-P vs pCMV6-Entry-HMGA2; and pEZX-PG04-CDK13-D vs pCMV6-Entry-HMGA2. Luciferase activities were normalized to SEAP levels, and the value of the pEZX-PG04-Mock vs pCMV6-Entry-Mock group was set as 1. **p < 0.01, ***p < 0.001, ****p < 0.0001, Student’s t-test. Error bars: SD.
The Gluc/SEAP dual-reporter assays were performed to verify whether CDK13 expression is directly regulated by HMGA2 in the live cells. Comparing the HMGA2-KO cells co-transfected with pEZX-PG04-CDK13-P/D and pCMV6-Entry-Mock to the cells co-transfected with pEZX-PG04-CDK13-P/D and pCMV6-Entry-HMGA2, the stronger luciferase activity in the latter one proved that HMGA2 directly upregulated the expression of CDK13 (p < 0.001). Comparing the cells co-transfected with pEZX-PG04-CDK13-P and pCMV6-Entry-HMGA2 to the cells co-transfected with pEZX-PG04-CDK13-P/D and pCMV6-Entry-HMGA2, the luciferase activity was much stronger in the latter one, suggesting the DNA fragment found by ChIP is probably the enhancer of CDK13 (Figures 4F,G).
HMGA2 and CDK13 Were Highly Expressed in Gastric Cancer and Related With Poorer Prognosis
The expression of both HMGA2 and CDK13 in the stomach adenocarcinoma (STAD) was much higher than those in the normal mucosae based on TCGA database (Supplementary Figure 2). To confirm such trends, cancer tissues as well as the adjacent tissues from 200 STAD patients were processed and the expression level of HMGA2 and CDK13 was explored via the immunohistochemical method, and the results are consistent with those from TCGA database (Figures 5A,B). The percentage of HMGA2 and CDK13 positive was approximately 80% in GC vs 25% in the adjacent tissue and 60% in GC vs 15% in the adjacent tissue, respectively (Table 2). The correlation of HMGA2 and CDK13 was statistically analyzed, and R = 0.44, p = 5.5e-11041 (Figure 5C). What we found in the GC patients was consistent with the results from analyzing TCGA database (Figure 5D).
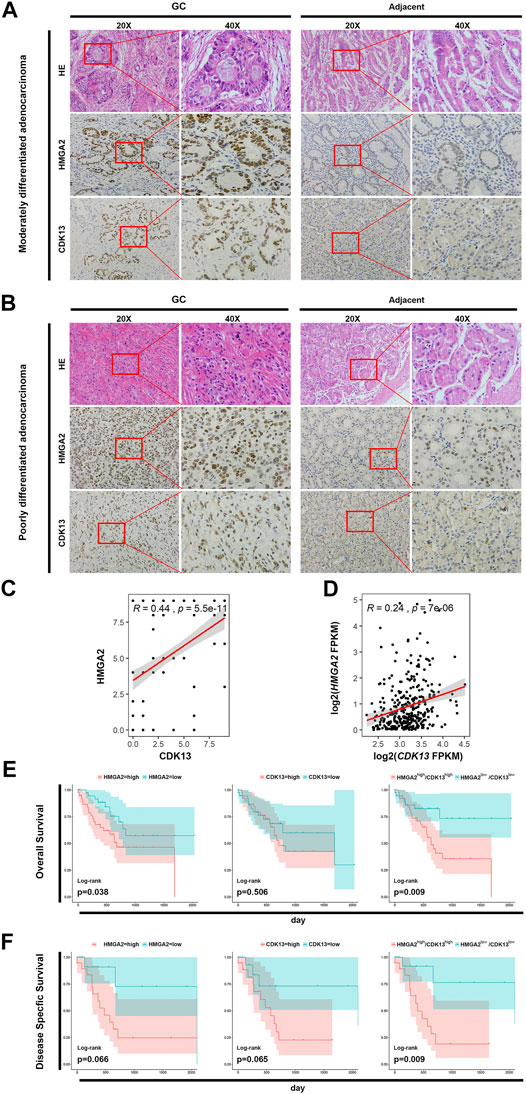
FIGURE 5. HMGA2 and CDK13 are associated with tumorigenesis of GC. (A) Expression of HMGA2 and CDK13 in the tissues of the patients with moderately differentiated STAD. The left two columns are the HE staining and immunohistochemical results of the GC tissue. The right two columns are those from the adjacent tissue. For both GC and the adjacent group, respectively: the first column, ×20; the second one, images magnified from the red frames of the left side, ×40. Compared with the corresponding location of the adjacent tissue, the morphological disorder of cell arrangement is obvious in the GC tissue although the glands exists, which is consistent with the characteristics of this type of GC. The brown colored nuclei in the images of the second and the third horizontal line suggest HMGA2 positive and CDK13 positive, respectively. Therefore, the expressions of HMGA2 and CDK13 in GC are much higher than those in the adjacent tissue. (B) Expression of HMGA2 and CDK13 in the tissues of the patients with poorly differentiated STAD. The arrangement of images is the same as that of A. The HE staining and immunohistochemical assay were also performed on the poorly differentiated GC. The cells are more disorderly growing, losing the normal glandular morphology, and the sizes of the cells are more varied compared with those in the moderately differentiated GC, suggesting the high grade of malignancy. Positive HMGA2 or CDK13 immunohistochemical staining (in brown) localizes mainly in the nucleus of the cells. Strong positive staining in GC tissues and weak positive staining in corresponding adjacent tissues are shown. (C) Pearson’s correlation between the expression of HMGA2 and CDK13 from the immunohistochemistry results of the 200 GC tissues was calculated. X-axis: expression of CDK13; Y-axis: expression of HMGA2; R = 0.44, p = 5.5e-11. (D) Pearson’s correlation between HMGA2 and CDK13 based on the RNA-seq results of the 416 STAD patients in TCGA database was calculated. R = 0.24, P = 7e-06. (E) Kaplan–Meier survival analysis for overall survival (OS). The expression of HMGA2 and CDK13 of 76 patients with tubular STAD was stratified to OS, respectively and simultaneously. (F) Kaplan–Meier survival analysis for disease-specific survival (DSS). The expression of HMGA2 and CDK13 of 44 patients with stage IV STAD was stratified to DSS, respectively and simultaneously. For (E) and (F): left, expression of HMGA2; middle, expression of CDK13; right, expression of HMGA2 and CDK13 simultaneously. Pink color: high expression; blue: low expression.

TABLE 2. Expression difference of HMGA2 and CDK13 between GC and the adjacent tissue.
How do HMGA2 and CDK13 affect the overall survival (OS)? Survival curves relating to the expression level of HMGA2 and CDK13 were analyzed based on TCGA database, respectively and jointly. In the patients with tubular STAD, the OS of the patients with either low HMGA2 expression or low CDK13 expression has more optimistic prognosis than the cases with high expression. The OS of the patients with both high HMGA2 expression and high CDK13 expression simultaneously was much poorer than those with low expression. Furthermore, the statistical significance of the OS difference between the simultaneous high expression of both genes and low expression was more obvious than the OS difference between the patients with high and low expressions of the single gene (Figure 5E). Such characteristic can also be seen in the disease-specific survival (DSS) analysis of the patients with stage IV of diffuse type STAD (Figure 5F). It could be inferred that the patients with high HMGA2 and CDK13 expression GC have poorer prognosis. Targeting HMGA2 and CDK13 associatively would be the possible promising new therapy to enhance the five-year survival rate of GC.
Synergic Inhibition of HMGA2 and CDK13 Had the Most Suppressing Efficacy on the Growth of the Gastric Cancer Cells
The HMGA2-KO MKN-45/MGC-803 cells together with their parental version were used to verify the anti-cancer efficacy of inhibiting HMGA2 and CDK13 associatively. They are as follows: CDK13 knocked down only (CDK13-KD + HMGA2-P), HMGA2 knocked out only (CDK13-P + HMGA2-KO), CDK13-KD together with HMGA2-KO (CDK13-KD + HMGA2-KO), parental (CDK13-P + HMGA2-P) MKN-45 and MGC-803. The efficiency of knocking down CDK13 via siRNA was confirmed by RT-PCR and western blot, and the efficiency was about 60% (Figure 6A). As expected, the growth of CDK13-KD + HMGA2-KO cells was suppressed the most; the ascending order of cell proliferation was CDK13-P + HMGA2-KO, CDK13-KD + HMGA2-P, and CDK13-P + HMGA2-P MKN-45/MGC-803 (Figures 6B–D). Subsequently, SR-4835 was used to inhibit CDK13 as an alternative method except siRNA. It turned out that no matter how CDK13 was inhibited, whether by SR-4835 or siRNA, the speed of the cell growth in different groups has maintained the same order (Figures 6E–G).
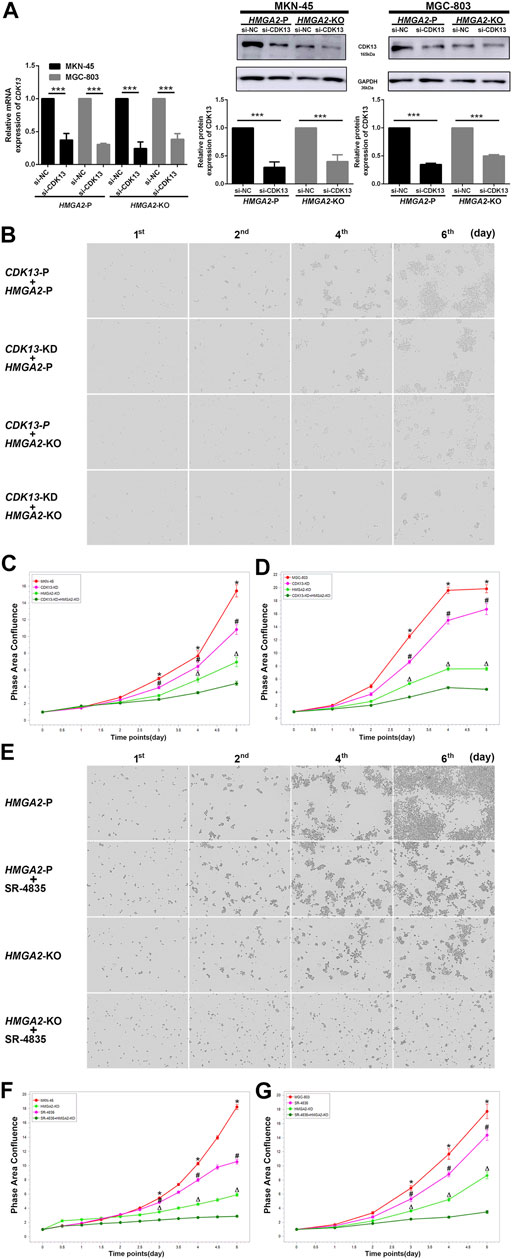
FIGURE 6. Inhibiting CDK13 and HMGA2 simultaneously suppresses the GC cells most. (A) Efficiency of knocking down CDK13 in two GC cell lines. Left: the efficiency was verified by RT-PCR. CDK13 was knocked down based on HMGA2-P and HMGA2-KO MKN-45/MGC-803, respectively. X-axis: different cell groups. Y-axis: expression of CDK13. Middle and right: western blot results of the expression of CDK13 in HMGA2-P and HMGA2-KO MKN-45 and MGC-803, respectively. ***p < 0.001. (B) Proliferation of the MKN-45 cells in different groups. The images in the vertical lines are the cell proliferation at different time (first, second, fourth, and sixth days). The pictures in the horizontal lines mean different groups: upper, CDK13-P plus HMGA2-P cells; second, CDK13-KD plus HMGA2-P cells; third, CDK13-P plus HMGA2-KO cells; bottom, CDK13-KD plus HMGA2-KO cells. KD: knockdown; KO: knockout; P: parental. (C) Continuous records of the proliferation of the different gene-edited MKN-45 cells. (D) Continuous records of the proliferation of the different gene-edited MGC-803. For (C) and (D): abscissa, consecutive days; ordinate, phase area confluence shown via IncuCyte S3. Red curve: CDK13-P plus HMGA2-P cells; pink one: CDK13-KD plus HMGA2-P cells; light green one: CDK13-P plus HMGA2-KO cells; dark green one: CDK13-KD plus HMGA2-KO cells. The phase area confluences of the initial seeded cells in different groups were set as 1, respectively. *: comparison of CDK13-P plus HMGA2-P cells with CDK13-KD plus HMGA2-KO cells; #: comparison of CDK13-KD plus HMGA2-P cells with CDK13-KD plus HMGA2-KO cells; △: comparison of CDK13-P plus HMGA2-KO cells with CDK13-KD plus HMGA2-KO cells; *,△,#p < 0.05. (E) Proliferation of the different treated MKN-45 cells. The images in the vertical lines are the cell proliferation at different time (first, second, fourth, and sixth days). The pictures in the horizontal lines mean different groups: upper, HMGA2-P cells; the second line, HMGA2-P plus SR-4835 treated cells; the third line, HMGA2-KO cells; bottom, HMGA2-KO plus SR-4835 treated cells. (F) Continuous proliferation records of the different types of MKN-45 cells. (G) Continuous proliferation records of the different types of MGC-803. Abscissa: consecutive days; ordinate: phase area confluence shown via IncuCyte S3. Red curve: HMGA2-P cells; pink one: HMGA2-P plus SR-4835 treated cells; light green one: HMGA2-KO cells; dark green one: HMGA2-KO plus SR-4835 treated cells. The phase area confluences of the initial seeded cells in the different groups were set as 1, respectively. *: comparison of HMGA2-P cells with HMGA2-KO plus SR-4835 cells; #: comparison of HMGA2-P plus SR-4835 cells with HMGA2-KO plus SR-4835 cells; △: comparison of HMGA2-KO cells with HMGA2-KO plus SR-4835 cells; *,△,#p < 0.05.
Discussion
GC has been in the lightening spot for years because of the high morbidity and low survival rate (Smyth et al., 2020). HMGA2 has been reported as a GC-promoting gene, but how HMGA2 regulates the cell cycle in GC cells has not been illustrated clearly. Some researchers have proved that HMGA2 could promote the G1/S and G2/M phase transitions, respectively, in the ovarian cancer and leukemia (Malek et al., 2008; Zhang et al., 2018b). In our study, the overexpression of HMGA2 accelerated the S–G2/M transition in the GC cells, instead of the G0/G1 phase, which was consistent with the findings in leukemia (Tan et al., 2016). On the contrary, some inhibitors of the cell cycle are coming into clinical practice. For instance, CDK4/6 inhibitors are providing survival benefit to the certain types of breast cancer characterized by G0/G1 acceleration induced by the CDK4/6-RB1 pathway (Goel and Tolaney, 2019; Zhang et al., 2019). We explored the anti-proliferation effect of a CDK4/6 inhibitor, palbociclib, on HMGA2-edited GC cells and found the cells were insensitive to palbociclib (the data are not shown). This phenomenon was also confirmed by Ahrum Min et al. (2018) who reported that out of 10 human GC cell lines, only four were sensitive to CDK4/6 inhibitors and the other six were less sensitive or even insensitive (Min et al., 2018). Thus, we deduced that CDK4/6 inhibitors could not work well in some types of GC. We then carried out transcriptome sequencing, ChIP-seq, and luciferase assay to reveal the specific cell cycle–related regulator of S–G2/M phase transition in high HMGA2 expression GC and found HMGA2 bound to intron 3 of the CDK13 gene directly. This is the first study that elucidated the relationship between HMGA2 and CDK13. Accordingly, we suspect CDK13 might involve in the S–G2/M transition. Quereda et al. (2019) reported CDK12/CDK13 can significantly upregulate the S–G2/M–progressing genes (Quereda et al., 2019). Interestingly, the high expression of both HMGA2 and CDK13 jointly predicts a poorer prognosis in our research; therefore, choosing the right cell cycle inhibitors and jointly inhibiting CDK13 and HMGA2 might be an effective strategy for the high HMGA2 expression GC.
CDK13 has been found to have the increasingly important role in cancer biomarkers and therapeutic targets in recent years (Dong et al., 2018; Zeng et al., 2018; Quereda et al., 2019; Wang et al., 2019), while it has detailed function and the underlying mechanism has not been clearly investigated. The amino acid identity between CDK13 and CDK12 is approximately 50%; furthermore, 92% of their main functional structures are the same (Greifenberg et al., 2016). Because CDK12 and CDK13 have the identical conserved kinase domains and activating partner (cyclin K), CDK13 has been studied as the companionship of CDK12 from the beginning, and the most light has been shed on CDK12, veiling the real face of CDK13 (Greifenberg et al., 2016; Fan et al., 2020; Tadesse et al., 2021). Thus, the function and the mechanism of CDK12 have been comparatively clear; moreover, the inhibitor of CDK12 was invented and has already entered the clinical trials (Blazek et al., 2011; Dubbury et al., 2018; Liang et al., 2020). However, there is no specific inhibitor for CDK13 until THZ531, a selective CDK12/13 inhibitor, was found in 2016 (Zhang et al., 2016). Unfortunately, THZ531 was not suitable for clinical use due to the problem of bioavailability and toxic off-target (Hopkins and Zou, 2019). The recently discovered SR-4835 (a selective dual inhibitor of CDK12/CDK13) exhibits excellent anti-cancer therapeutic effects, especially when combined with PARP inhibitors (DNA-damaging chemotherapy) or anti-PD-1 (checkpoint inhibition) (Quereda et al., 2019; Li et al., 2020b). Moreover, it is reported that the IC50 of SR-4835 for CDK12 and CDK13 is different (98 nM for CDK12 vs 4.9 nM for CDK13). Perhaps, the IC50 difference between them could be utilized for the independent study of CDK13. In our study, we also investigated the anti-cancer effect of SR-4835 at low concentration on high HMGA2 expression GC, and the results showed the excellent anti-cancer effect, especially when combined with HMGA2 knockout. Therefore, our findings might provide the proof for selecting the type of cell cycle inhibitor in treating GC and the basic data for molecular classification of GC.
Accumulating evidence has reported the functional difference between CDK12 and CDK13 (Quereda et al., 2019; Tadesse et al., 2021). CDK12 was not pulled down in the ChIP experiment in our study, enlightening the thought that CDK13 indeed shares some molecular function with CDK12, but CDK13 might have its own specific role and its unique mechanism, and CDK13 could be studied unbinding to CDK12. More research studies are needed to map the independent role of CDK13, which is the main task in our next study.
Data Availability Statement
The datasets presented in this study can be found in online repositories. The names of the repository/repositories and accession number(s) can be found below: GSE174442.
Ethics Statement
The animal study was reviewed and approved by the Ethics Committee of Inner Mongolia People’s Hospital.
Author Contributions
LY and ZW conceived and designed the study and drafted the manuscript. MW, FL, and WG performed cell and animal experiments. FW, ZF, JY, and RS performed the clinical sample collection and pathology experiments. JJ, XH, and WJ performed the statistical analysis. All authors read and critically revised the manuscript for intellectual content and approved the final manuscript.
Funding
This work was supported by the Science and Technology Planning Project of Inner Mongolia Science and Technology Department (Grant No. 201802153), Natural Science Foundation of Inner Mongolia (CN) (Grant Nos. 2018MS08060 and 2020MS08157), and National Natural Science Foundation of China (Grant No. 81960449). This work was also supported by the Talent Training Plan for the Key Laboratory of Inner Mongolia Science and Technology Department.
Conflict of Interest
The authors declare that the research was conducted in the absence of any commercial or financial relationships that could be construed as a potential conflict of interest.
Publisher’s Note
All claims expressed in this article are solely those of the authors and do not necessarily represent those of their affiliated organizations, or those of the publisher, the editors, and the reviewers. Any product that may be evaluated in this article, or claim that may be made by its manufacturer, is not guaranteed or endorsed by the publisher.
Supplementary Material
The Supplementary Material for this article can be found online at: https://www.frontiersin.org/articles/10.3389/fmolb.2021.707295/full#supplementary-material
References
Álvarez-Fernández, M., and Malumbres, M. (2020). Mechanisms of Sensitivity and Resistance to CDK4/6 Inhibition. Cancer cell 37 (4), 514–529. doi:10.1016/j.ccell.2020.03.010
Blazek, D., Kohoutek, J., Bartholomeeusen, K., Johansen, E., Hulinkova, P., Luo, Z., et al. (2011). The Cyclin K/Cdk12 Complex Maintains Genomic Stability via Regulation of Expression of DNA Damage Response Genes. Genes Develop. 25 (20), 2158–2172. doi:10.1101/gad.16962311
Bostwick, B. L., McLean, S., McLean, S., Posey, J. E., Streff, H. E., Gripp, K. W., et al. (2017). Phenotypic and Molecular Characterisation of CDK13-Related Congenital Heart Defects, Dysmorphic Facial Features and Intellectual Developmental Disorders. Genome Med. 9 (1), 73. doi:10.1186/s13073-017-0463-8
Cleynen, I., and Van de Ven, W. J. (2008). The HMGA Proteins: a Myriad of Functions (Review). Int. J. Oncol. 32 (2), 289–305. doi:10.3892/ijo.32.2.289
Detre, S., Saclani Jotti, G., and Dowsett, M. (1995). A "quickscore" Method for Immunohistochemical Semiquantitation: Validation for Oestrogen Receptor in Breast Carcinomas. J. Clin. Pathol. 48 (9), 876–878. doi:10.1136/jcp.48.9.876
Ding, L., Cao, J., Lin, W., Chen, H., Xiong, X., Ao, H., et al. (2020). The Roles of Cyclin-dependent Kinases in Cell-Cycle Progression and Therapeutic Strategies in Human Breast Cancer. Ijms 21 (6), 1960. doi:10.3390/ijms21061960
Dong, J., Wang, R., Ren, G., Li, X., Wang, J., Sun, Y., et al. (2017). HMGA2-FOXL2 Axis Regulates Metastases and Epithelial-To-Mesenchymal Transition of Chemoresistant Gastric Cancer. Clin. Cancer Res. 23 (13), 3461–3473. doi:10.1158/1078-0432.CCR-16-2180
Dong, X., Chen, G., Cai, Z., Li, Z., Qiu, L., Xu, H., et al. (2018). CDK13 RNA Over-editing Mediated by ADAR1 Associates with Poor Prognosis of Hepatocellular Carcinoma Patients. Cell Physiol Biochem 47 (6), 2602–2612. doi:10.1159/000491656
Dubbury, S. J., Boutz, P. L., and Sharp, P. A. (2018). CDK12 Regulates DNA Repair Genes by Suppressing Intronic Polyadenylation. Nature 564 (7734), 141–145. doi:10.1038/s41586-018-0758-y
Fan, Z., Devlin, J. R., Hogg, S. J., Doyle, M. A., Harrison, P. F., Todorovski, I., et al. (2020). CDK13 Cooperates with CDK12 to Control Global RNA Polymerase II Processivity. Sci. Adv. 6 (18), eaaz5041. doi:10.1126/sciadv.aaz5041
Goel, S., and Tolaney, S. M. (2019). CDK4/6 Inhibitors in Breast Cancer: a Role in Triple-Negative Disease? Lancet Oncol. 20 (11), 1479–1481. doi:10.1016/s1470-2045(19)30627-8
Greifenberg, A. K., Hönig, D., Pilarova, K., Düster, R., Bartholomeeusen, K., Bösken, C. A., et al. (2016). Structural and Functional Analysis of the Cdk13/Cyclin K Complex. Cell Rep. 14 (2), 320–331. doi:10.1016/j.celrep.2015.12.025
Hamilton, M. J., and Suri, M. (2019). CDK13-related Disorder. Adv. Genet. 103, 163–182. doi:10.1016/bs.adgen.2018.11.001
Hammond, S. M., and Sharpless, N. E. (2008). HMGA2, microRNAs, and Stem Cell Aging. Cell 135 (6), 1013–1016. doi:10.1016/j.cell.2008.11.026
Harbour, J. W., Luo, R. X., Santi, A. D., Postigo, A. A., and Dean, D. C. (1999). Cdk Phosphorylation Triggers Sequential Intramolecular Interactions that Progressively Block Rb Functions as Cells Move through G1. Cell 98 (6), 859–869. doi:10.1016/s0092-8674(00)81519-6
Hombach-Klonisch, S., Natarajan, S., Thanasupawat, T., Medapati, M., Pathak, A., Ghavami, S., et al. (2014). Mechanisms of Therapeutic Resistance in Cancer (Stem) Cells with Emphasis on Thyroid Cancer Cells. Front. Endocrinol. 5, 37. doi:10.3389/fendo.2014.00037
Hopkins, J. L., and Zou, L. (2019). Induction of BRCAness in Triple-Negative Breast Cancer by a CDK12/13 Inhibitor Improves Chemotherapy. Cancer cell 36 (5), 461–463. doi:10.1016/j.ccell.2019.10.012
Hortobagyi, G. N., Stemmer, S. M., Burris, H. A., Yap, Y. S., Sonke, G. S., Paluch-Shimon, S., et al. (2016). Ribociclib as First-Line Therapy for HR-Positive, Advanced Breast Cancer. N. Engl. J. Med. 375 (18), 1738–1748. doi:10.1056/NEJMoa1609709
Huang, B., Yang, J., Cheng, Q., Xu, P., Wang, J., Zhang, Z., et al. (2018). Prognostic Value of HMGA2 in Human Cancers: A Meta-Analysis Based on Literatures and TCGA Datasets. Front. Physiol. 9, 776. doi:10.3389/fphys.2018.00776
Ko, T. K., Kelly, E., and Pines, J. (2001). CrkRS. J. Cell Sci. 114 (14), 2591–2603. doi:10.1242/jcs.114.14.2591
Lapidot-Lifson, Y., Patinkin, D., Prody, C. A., Ehrlich, G., Seidman, S., Ben-Aziz, R., et al. (1992). Cloning and Antisense Oligodeoxynucleotide Inhibition of a Human Homolog of Cdc2 Required in Hematopoiesis. Proc. Natl. Acad. Sci. 89 (2), 579–583. doi:10.1073/pnas.89.2.579
Lazarov, M., Kubo, Y., Cai, T., Dajee, M., Tarutani, M., Lin, Q., et al. (2002). CDK4 Coexpression with Ras Generates Malignant Human Epidermal Tumorigenesis. Nat. Med. 8 (10), 1105–1114. doi:10.1038/nm779
Li, W., Wang, Z., Zha, L., Kong, D., Liao, G., and Li, H. (2017). HMGA2 Regulates Epithelial-Mesenchymal Transition and the Acquisition of Tumor Stem Cell Properties through TWIST1 in Gastric Cancer. Oncol. Rep. 37 (1), 185–192. doi:10.3892/or.2016.5255
Li, Y., Qiang, W., Griffin, B. B., Gao, T., Chakravarti, D., Bulun, S., et al. (2020). HMGA2-mediated Tumorigenesis through Angiogenesis in Leiomyoma. Fertil. sterility 114 (5), 1085–1096. doi:10.1016/j.fertnstert.2020.05.036
Li, Y., Zhang, H., Li, Q., Zou, P., Huang, X., Wu, C., et al. (2020). CDK12/13 Inhibition Induces Immunogenic Cell Death and Enhances Anti-PD-1 Anticancer Activity in Breast Cancer. Cancer Lett. 495, 12–21. doi:10.1016/j.canlet.2020.09.011
Liang, S., Hu, L., Wu, Z., Chen, Z., Liu, S., Xu, X., et al. (2020). CDK12: A Potent Target and Biomarker for Human Cancer Therapy. Cells 9 (6), 9. doi:10.3390/cells9061483
Malek, A., Bakhidze, E., Noske, A., Sers, C., Aigner, A., Schäfer, R., et al. (2008). HMGA2 Gene Is a Promising Target for Ovarian Cancer Silencing Therapy. Int. J. Cancer 123 (2), 348–356. doi:10.1002/ijc.23491
Malumbres, M., Sotillo, R., Santamarı́a, D., Galán, J., Cerezo, A., Ortega, S., et al. (2004). Mammalian Cells Cycle without the D-type Cyclin-dependent Kinases Cdk4 and Cdk6. Cell 118 (4), 493–504. doi:10.1016/j.cell.2004.08.002
Mansoori, B., Mohammadi, A., Ditzel, H. J., Duijf, P. H. G., Khaze, V., Gjerstorff, M. F., et al. (2021). HMGA2 as a Critical Regulator in Cancer Development. Genes 12 (2), 269. doi:10.3390/genes12020269
Mansoori, B., Mohammadi, A., Naghizadeh, S., Gjerstorff, M., Shanehbandi, D., Shirjang, S., et al. (2020). miR‐330 Suppresses EMT and Induces Apoptosis by Downregulating HMGA2 in Human Colorectal Cancer. J. Cell Physiol 235 (2), 920–931. doi:10.1002/jcp.29007
Marqués, F., Moreau, J.-L., Peaucellier, G., Lozano, J.-C., Schatt, P., Picard, A., et al. (2000). A New Subfamily of High Molecular Mass CDC2-Related Kinases with PITAI/VRE Motifs. Biochem. Biophysical Res. Commun. 279 (3), 832–837. doi:10.1006/bbrc.2000.4042
Min, A., Kim, J. E., Kim, Y.-J., Lim, J. M., Kim, S., Kim, J. W., et al. (2018). Cyclin E Overexpression Confers Resistance to the CDK4/6 Specific Inhibitor Palbociclib in Gastric Cancer Cells. Cancer Lett. 430, 123–132. doi:10.1016/j.canlet.2018.04.037
Nishino, J., Kim, I., Chada, K., and Morrison, S. J. (2008). Hmga2 Promotes Neural Stem Cell Self-Renewal in Young but Not Old Mice by Reducing p16Ink4a and p19Arf Expression. Cell 135 (2), 227–239. doi:10.1016/j.cell.2008.09.017
Novakova, M., Hampl, M., Vrabel, D., Prochazka, J., Petrezselyova, S., Prochazkova, M., et al. (2019). Mouse Model of Congenital Heart Defects, Dysmorphic Facial Features and Intellectual Developmental Disorders as a Result of Non-functional CDK13. Front. Cel. Dev. Biol. 7, 155. doi:10.3389/fcell.2019.00155
Otto, T., and Sicinski, P. (2017). Cell Cycle Proteins as Promising Targets in Cancer Therapy. Nat. Rev. Cancer 17 (2), 93–115. doi:10.1038/nrc.2016.138
Quereda, V., Bayle, S., Vena, F., Frydman, S. M., Monastyrskyi, A., Roush, W. R., et al. (2019). Therapeutic Targeting of CDK12/CDK13 in Triple-Negative Breast Cancer. Cancer cell 36 (5), 545–558. e7. doi:10.1016/j.ccell.2019.09.004
Slamon, D. J., Neven, P., Chia, S., Fasching, P. A., De Laurentiis, M., Im, S.-A., et al. (2018). Phase III Randomized Study of Ribociclib and Fulvestrant in Hormone Receptor-Positive, Human Epidermal Growth Factor Receptor 2-Negative Advanced Breast Cancer: MONALEESA-3. Jco 36 (24), 2465–2472. doi:10.1200/JCO.2018.78.9909
Sledge, G. W., Toi, M., Neven, P., Sohn, J., Inoue, K., Pivot, X., et al. (2017). MONARCH 2: Abemaciclib in Combination with Fulvestrant in Women with HR+/HER2− Advanced Breast Cancer Who Had Progressed while Receiving Endocrine Therapy. Jco 35 (25), 2875–2884. doi:10.1200/JCO.2017.73.7585
Smyth, E. C., Nilsson, M., Grabsch, H. I., van Grieken, N. C., and Lordick, F. (2020). Gastric Cancer. The Lancet 396 (10251), 635–648. doi:10.1016/S0140-6736(20)31288-5
Spring, L. M., Wander, S. A., Andre, F., Moy, B., Turner, N. C., and Bardia, A. (2020). Cyclin-dependent Kinase 4 and 6 Inhibitors for Hormone Receptor-Positive Breast Cancer: Past, Present, and Future. The Lancet 395 (10226), 817–827. doi:10.1016/S0140-6736(20)30165-3
Sun, J., Sun, B., Sun, R., Zhu, D., Zhao, X., Zhang, Y., et al. (2017). HMGA2 Promotes Vasculogenic Mimicry and Tumor Aggressiveness by Upregulating Twist1 in Gastric Carcinoma. Scientific Rep. 7 (1), 2229. doi:10.1038/s41598-017-02494-6
Tadesse, S., Duckett, D. R., and Monastyrskyi, A. (2021). The Promise and Current Status of CDK12/13 Inhibition for the Treatment of Cancer. Future Med. Chem. 13 (2), 117–141. doi:10.4155/fmc-2020-0240
Tan, L., Wei, X., Zheng, L., Zeng, J., Liu, H., Yang, S., et al. (2016). Amplified HMGA2 Promotes Cell Growth by Regulating Akt Pathway in AML. J. Cancer Res. Clin. Oncol. 142 (2), 389–399. doi:10.1007/s00432-015-2036-9
Tripathy, D., Im, S.-A., Colleoni, M., Franke, F., Bardia, A., Harbeck, N., et al. (2018). Ribociclib Plus Endocrine Therapy for Premenopausal Women with Hormone-Receptor-Positive, Advanced Breast Cancer (MONALEESA-7): a Randomised Phase 3 Trial. Lancet Oncol. 19 (7), 904–915. doi:10.1016/S1470-2045(18)30292-4
Uehara, T., Takenouchi, T., Kosaki, R., Kurosawa, K., Mizuno, S., and Kosaki, K. (2018). Redefining the Phenotypic Spectrum of De Novo Heterozygous CDK13 Variants: Three Patients without Cardiac Defects. Eur. J. Med. Genet. 61 (5), 243–247. doi:10.1016/j.ejmg.2017.12.004
Wang, J., Zhang, Y., Lu, L., Lu, Y., Tang, Q., and Pu, J. (2019). Insight into the Molecular Mechanism of LINC00152/miR‐215/CDK13 axis in Hepatocellular Carcinoma Progression. J. Cell Biochem 120 (11), 18816–18825. doi:10.1002/jcb.29197
Wei, C.-H., Wei, L. X., Lai, M. Y., Chen, J. Z., and Mo, X. J. (2013). Effect of Silencing of High Mobility Group A2 Gene on Gastric Cancer MKN-45 Cells. Wjg 19 (8), 1239–1246. doi:10.3748/wjg.v19.i8.1239
Wu, H., Zou, Q., He, H., Liang, Y., Lei, M., Zhou, Q., et al. (2019). Long Non‐coding RNA PCAT6 Targets miR‐204 to Modulate the Chemoresistance of Colorectal Cancer Cells to 5‐fluorouracil‐based Treatment through HMGA2 Signaling. Cancer Med. 8 (5), 2484–2495. doi:10.1002/cam4.1809
Zeng, M., Kwiatkowski, N. P., Zhang, T., Nabet, B., Xu, M., Liang, Y., et al. (2018). Targeting MYC Dependency in Ovarian Cancer through Inhibition of CDK7 and CDK12/13. eLife 7, 7. doi:10.7554/eLife.39030
Zhang, J., Bu, X., Wang, H., Zhu, Y., Geng, Y., Nihira, N. T., et al. (2018). Cyclin D-CDK4 Kinase Destabilizes PD-L1 via Cullin 3-SPOP to Control Cancer Immune Surveillance. Nature 553 (7686), 91–95. doi:10.1038/nature25015
Zhang, K., Hong, R., Kaping, L., Xu, F., Xia, W., Qin, G., et al. (2019). CDK4/6 Inhibitor Palbociclib Enhances the Effect of Pyrotinib in HER2-Positive Breast Cancer. Cancer Lett. 447, 130–140. doi:10.1016/j.canlet.2019.01.005
Zhang, T., Kwiatkowski, N., Olson, C. M., Dixon-Clarke, S. E., Abraham, B. J., Greifenberg, A. K., et al. (2016). Covalent Targeting of Remote Cysteine Residues to Develop CDK12 and CDK13 Inhibitors. Nat. Chem. Biol. 12 (10), 876–884. doi:10.1038/nchembio.2166
Zhang, Z. C., Wang, G. P., Yin, L. M., Li, M., and Wu, L. L. (2018). Increasing miR-150 and Lowering HMGA2 Inhibit Proliferation and Cycle Progression of colon Cancer in SW480 Cells. Eur. Rev. Med. Pharmacol. Sci. 22 (20), 6793–6800. doi:10.26355/eurrev_201810_16147
Zhao, W., Geng, D., Li, S., Chen, Z., and Sun, M. (2018). LncRNA HOTAIR Influences Cell Growth, Migration, Invasion, and Apoptosis via the miR-20a-5p/HMGA2axis in Breast Cancer. Cancer Med. 7 (3), 842–855. doi:10.1002/cam4.1353
Zhou, X., Benson, K. F., Przybysz, K., Liu, J., Hou, Y., Cherath, L., et al. (1996). Genomic Structure and Expression of the Murine Hmgi-C Gene. Nucleic Acids Res. 24 (20), 4071–4077. doi:10.1093/nar/24.20.4071
Keywords: gastric cancer, cell cycle, CDK13, SR-4835, HMGA2
Citation: Wu Z, Wang M, Li F, Wang F, Jia J, Feng Z, Huo X, Yang J, Jin W, Sa R, Gao W and Yu L (2021) CDK13-Mediated Cell Cycle Disorder Promotes Tumorigenesis of High HMGA2 Expression Gastric Cancer. Front. Mol. Biosci. 8:707295. doi: 10.3389/fmolb.2021.707295
Received: 07 June 2021; Accepted: 26 July 2021;
Published: 26 August 2021.
Edited by:
William C Cho, Queen Elizabeth Hospital, ChinaReviewed by:
Sudip Banerjee, Morehouse School of Medicine, United StatesRishi Kumar Jaiswal, Loyola University Chicago, United States
Copyright © 2021 Wu, Wang, Li, Wang, Jia, Feng, Huo, Yang, Jin, Sa, Gao and Yu. This is an open-access article distributed under the terms of the Creative Commons Attribution License (CC BY). The use, distribution or reproduction in other forums is permitted, provided the original author(s) and the copyright owner(s) are credited and that the original publication in this journal is cited, in accordance with accepted academic practice. No use, distribution or reproduction is permitted which does not comply with these terms.
*Correspondence: Lan Yu, bGN5eHlqengxM0AxNjMuY29t