
94% of researchers rate our articles as excellent or good
Learn more about the work of our research integrity team to safeguard the quality of each article we publish.
Find out more
ORIGINAL RESEARCH article
Front. Mol. Biosci., 10 May 2021
Sec. Nanobiotechnology
Volume 8 - 2021 | https://doi.org/10.3389/fmolb.2021.678444
This article is part of the Research TopicNanoparticles for the Delivery of RNA-Based TherapeuticsView all 4 articles
 Bolin Wu1,2,3Haitao Shang1Jiayin Liu3,4Xitian Liang1Yanchi Yuan1,3Yichi Chen1,3Chunyue Wang1,3Hui Jing1
 Wen Cheng1,2*
Hepatocellular carcinoma (HCC) poses a severe threat to human health. The NET-1 protein has been proved to be strongly associated with HCC proliferation and metastasis in our previous study. Here, we established and validated the NET-1 siRNA nanoparticles system to conduct targeted gene therapy of HCC xenograft in vivo with the aid of sonodynamic therapy. Then, we conducted a label-free proteome mass spectrometry workflow to analyze formalin-fixed and paraffin-embedded HCC xenograft samples collected in this study. The result showed that 78 proteins were differentially expressed after NET-1 protein inhibited. Among them, the expression of 17 proteins upregulated and the expression of 61 proteins were significantly downregulated. Of the protein abundance, the vast majority of Gene Ontology enrichment terms belong to the biological process. The KEGG pathway enrichment analysis showed that the 78 differentially expressed proteins significantly enriched in 45 pathways. We concluded that the function of the NET-1 gene is not only to regulate HCC but also to participate in a variety of biochemical metabolic pathways in the human body. Furthermore, the protein–protein interaction analysis indicated that the interactions of differentially expressed proteins are incredibly sophisticated. All the protein–protein interactions happened after the NET-1 gene has been silenced. Finally, our study also provides a useful proposal for targeted therapy based on tetraspanin proteins to treat HCC, and further mechanism investigations are needed to reveal a more detailed mechanism of action for NET-1 protein regulation of HCC.
Worldwide, liver cancer is the fourth most common cause of cancer-related death and ranks sixth in terms of incident cases (Villanueva, 2019). With a 5-year survival of 18%, liver cancer is the second most lethal tumor after pancreatic cancer. Hepatocellular carcinoma is a major type of primary liver cancer. Changes in protein expression accompany HCC progress; thus, some proteins can be used as potential biomarkers for diagnosis and treatment (Ferrin et al., 2015).
In 1989, Prof. Yumita first reported sonodynamic therapy (SDT) (Yumita et al., 1989), which is based on the photodynamic therapy (PDT). This noninvasive treatment technology has already been known as a new anticancer strategy which uses nonthermal ultrasound energy in combination with sonosensitizer agents (Brown et al., 2004; Castano et al., 2004; Rosenthal et al., 2004; McHale et al., 2016). Normally, low-intensity focused ultrasound (LIFU, 1–3 MHz) frequency is used for this treatment technology to enhance the cavitation effect (Tachibana et al., 2008; Shibaguchi et al., 2011). The sonosensitizer agents together with ultrasound irradiation generate reactive oxygen species (ROS) that could induce cancer cell death under aerobic conditions (Yumita et al., 2010; Yumita et al., 2012).
Several reports have revealed that LIFU is able to enhance the anticancer effect of some chemotherapeutic drugs and improve cell membrane permeability. Our previous research studies have proved that the combination of LIFU irradiation and nanobubble system is regarded as an efficient and safe method for gene transfection (Wu et al., 2020; Wu et al., 2019). Besides, LIFU-combined NET-1 siRNA conjugated nanobubble system could effectively inhibit tumor growth and prolong the life of experimental animals (Shang et al., 2019).
Neuroepithelial transforming gene 1 (NET-1) is located at chromosome 10p15 and encodes a 54 kDa oncoprotein (Chan et al., 1996). It is a guanine nucleotide exchange factor involved in cytoskeletal regulation and cancer cell invasion (Murray et al., 2008). All NET genes have initially been identified as EST clones with sequences homologous to tetraspan, a superfamily which is distinguished by the presence of four transmembrane domains and has been implicated in signal transduction, cell adhesion, migration, proliferation, and differentiation (Serru et al., 2000; Kanetaka et al., 2001). NET-1 protein was known to be a member of the tetraspanin family (Ye et al., 2010). NET-1 protein has been identified in HCC, where it is a mediator of invasion and metastasis (Chen et al., 2007; Shen et al., 2008; Wu et al., 2013). Our previous research proved that the NET-1 protein had an impactful role in the proliferation and stiffness of HCC (Shang et al., 2019; Wu et al., 2019). Besides, the low expression of NET-1 protein also reduced the migration and invasive ability of HCC (Wu et al., 2016). However, the potential carcinogenic mechanism of NET-1 protein is still unclear.
Proteomics is an efficient research tool to reveal the mechanism and pathogeny of diseases on the proteinic level. Because of proteomics, analysis could analyze quite a lot of expressed proteins in tissues or cells; this revolutionary technology has been applied to identify HCC-related proteins in many studies (Chaerkady et al., 2008; Yang et al., 2017; Gao et al., 2019). However, altered expression of proteins quantified with conventional label-free proteomic methods was limited by the fresh or rapidly frozen tissue samples. Most human tumor samples archived in hospitals for pathologic diagnosis are formalin-fixed paraffin-embedded (FFPE), which have been widely used in the long-term preservation of tissues and organs (Bass et al., 2014). Besides, multifarious prescient technologies have been invented for transcriptomic (Li et al., 2014), genomic (Martelotto et al., 2017; Van Allen et al., 2014), proteomic, and protein (Mantsiou et al., 2019; Iglesias-Gato et al., 2016) from FFPE samples. In 1991, FFPE tissues have been analyzed for protein using antibodies as the invention of the heat-induced antigen retrieval (HIAR) technique for immunohistochemistry (IHC) (Shi et al., 1991). Afterward, kinds of different technologies have been applied to extract proteins from FFPE samples, which have extended the research of proteins to a proteomic level (Fowler et al., 2014; Wakabayashi et al., 2014; Broeckx et al., 2016). These studies have initially confirmed that FFPE samples can be used in mass spectrometry–based proteomic analysis.
Here, we established and validated the NET-1 siRNA nanoparticles system, which was then utilized for targeted gene delivery of HCC xenograft in vivo with the aid of SDT. Then, proteomic analyses of FFPE HCC xenograft samples were conducted to characterize the global quantitative protein expression profile and identify the differential protein expressions after gene therapy. Furthermore, we aimed to shed light on the functions of tetraspanin protein involved in HCC development and reveal the HCC-related proteins valuable for targeted therapy.
The NET-1 siRNA duplex and the negative control duplex (NC-siRNA) were designed according to our previous research (Wu et al., 2019). The nanoparticles were prepared with DSPG, DSPC, and DSPE-PEG2000, and the weight ratio was 7:2:1. All the phospholipids were purchased from Avanti Polar Lipids (Avanti Polar Lipids, Alabaster, AL, United States). 20 mg of phospholipids were dissolved in a mixed solution of chloroform and methyl alcohol. The mixed solution was subsequently purged by vacuum rotary evaporation to form phospholipid thin film. Then, the thin film was hydrated at 40°C with 5 ml of DEPC-treated H2O. This was followed by dissolving the appropriate amounts of NET-1 siRNA duplex in the lipid film solution. The NET-1 siRNA nanoparticles and NC-siRNA duplex nanoparticles were obtained using an extrusion technology by mini-extruders (Avanti Polar Lipids, Alabaster, AL, United States) through a 400 nm membrane for 11 times. The obtained NET-1 siRNA nanoparticles and NC-siRNA duplex nanoparticles were then transferred into a sealed vial and stored at 4°C for further experiments.
The structure of NET-1 siRNA nanoparticles was detected under transmission electron microscope (TEM, Hitachi TEM system, Japan). The size and zeta potential were investigated by dynamic light scattering (DLS) via the Malvern Zetasizer Nanoseries (Zeta PALS BI-90 Plus, Brookhaven Instruments).
The human HCC cell line HepG2 cells were a generous gift from the Institute of Cancer Research affiliated with Harbin Medical University (Harbin, China). Cells were cultured in DMEM medium supplemented with 10% fetal bovine serum and 1% penicillin/streptomycin in a humidified atmosphere containing 5% CO2/95% air at 37°C.
BALB/c nude female mice (6–8 weeks, 10–25 g) were purchased from Beijing Vital River Laboratory Animal Technology (Beijing, China). All the animals were housed in an environment with a temperature of 22 ± 1°C, a relative humidity of 50 ± 1%, and a light/dark cycle of 12:12 h. All animal studies (including the mice euthanasia procedure) were done in compliance with the regulations and guidelines of Harbin Medical University institutional animal care and conducted according to the Association for Assessment and Accreditation of Laboratory Animal Care and the Institutional Animal Care and Use Committee guidelines. Mice were anesthetized with 3% isoflurane inhalation and 1 L/min 100% oxygen. A total of 5 × 10⁶ HepG2 cells were suspended in 50 ml PBS and 50 ml Matrigel (BD Biosciences, San Jose, CA, United States). Tumor cell–Matrigel mixture (100 µl) was subcutaneously injected in the right back position of the mice.
Once the tumor diameter reached 0.5 cm, the mice bearing tumors were randomly divided into five groups (six mice/group): group A, blank (PBS); group B, NET-1 siRNA nanoparticles without LIFU irradiation; group C, NET-1 siRNA nanoparticles with LIFU irradiation; group D, NC-siRNA duplex nanoparticles with LIFU irradiation; and group E, blank nanoparticles with LIFU irradiation. All the treatment nanoparticles were intravenously administered via the tail vein at a dose of 5 ml/kg body weight.
At 30 min postinjection, all groups were irradiated with LIFU using a CGZZ low-frequency ultrasound treatment instrument (Institute of Ultrasound Imaging, Second Affiliated Hospital of Chongqing Medical University, Chongqing, China). LIFU parameters were as follows: frequency of 1 MHz, pulse repetition frequency of 1 kHz, duty cycle yield of 50%, intensity of 1.0 W/cm2, and duration of irradiation of 5 min per mouse. The nude mice were treated twice a week for a total of 60 days. The survival end point was a tumor diameter of 20 mm in any direction (according to the guidelines for Tumor Induction in Mice and Rats, American Association for Laboratory Animal Science, Memphis, TN, United States); the maximum tumor diameter was measured twice every week using Aixplorer United States system with high-frequency probe (Super Linear TM SL15-4, Super Sonic Imagine, Aix-en-Provence, France). The HCC xenograft samples were harvested after euthanasia and formalin-fixed and paraffin-embedded for long-stem storage and further analyses.
Half of the FFPE tumor samples were sectioned 4.5 μm thick and incubated 10 min with 0.3% H2O2 to block endogenous peroxidase. The sections were incubated overnight at 4°C with primary mouse antihuman NET-1 antibody (1:100, Abcam, Cambridge, United Kingdom) and then with secondary antibody at 37°C for 30 min. The sections were then stained with 3,3′-diaminobenzidine and were counterstained with hematoxylin, dehydrated in alcohol, and mounted. Quantitative analysis of total image staining was carried out by ImageJ software (v.1.80; National Institutes of Health, Bethesda, MD, United States).
The rest of FFPE HCC xenograft samples in group A and group C were selected for proteomic analysis. The FFPE samples were dewaxed with octane and then hydrated with graded ethanol. After hydration, the sample was washed twice with PBS. After removing the PBS solution, an appropriate amount of protein lysate (4% SDS, 100 mM Tris, pH = 8.5) was added and incubated at 95°C for 10 min at room temperature, mixed by shaking and sonicated in an ice-water bath for 5 min. The samples were de-crosslinked with a refractive index at 95°C for 60 min and then reduced by adding an appropriate amount of TCEP and carboxyamidomethylated in CAA at 95°C for 5 min. The samples were sequentially centrifuged at 12,000g at 4°C for 15 min. Collecting the supernatant and adding four times the volume of precooling acetone at −20°C and precipitated it at −20°C for at least 4 h. Centrifuging at 12,000g for 15 min at 4°C. Collect the precipitate and air drying. An appropriate amount of protein solution (6 M urea, 100 mM TEAB, pH = 8.5) was added to dissolve the protein pellet.
The protein solution was added to flat membrane ultrafiltration (cut off molecular is 10 kDa) tube and was centrifuged at 14,000g at room temperature for 20 min, and the flow-through was discarded. 100 μl of 50 mM TEAB was added, and the sample was centrifuged at 14,000g at room temperature for 20 min. The washing procedure was repeated four times. 100 μl of 50 mM TEAB and an amount of 1:50 mass ratio of trypsin was added to the protein and incubated at 37°C overnight. After being centrifuged at 14,000g for 20 min, an equal volume of 2% formic acid was added. After mixing, the solution was centrifuged at 14,000g for 20 min at room temperature. The supernatant of flow-through was slowly passed through a C18 desalting column, and then, 1 ml washing solution (0.1% formic acid and 4% acetonitrile) was added to wash three times in succession, then 0.4 ml of eluent (0.1% formic acid and 75% acetonitrile) was added to elute twice in sequence, and the eluent samples were combined and freeze-dried.
Mobile phase A (100% water and 0.1% formic acid) and B solution (80% acetonitrile and 0.1% formic acid) were prepared. The lyophilized powder was dissolved in 10 μl of solution A, centrifuged at 15,000 rpm for 20 min at 4°C, and 1 μg of the supernatant was injected into a homemade C18 Nano-Trap column (2 cm × 75 μm, 3 μm). Peptides were separated in a homemade analytical column (15 cm × 150 μm, 1.9 μm) using linear gradient elution, as listed in Supplementary Table S1. The isolated peptides were analyzed by the Q Exactive series mass spectrometer (Thermo Fisher), with ion source of Nanospray Flex™ (ESI), spray voltage of 2.3 kV, and ion transport capillary temperature of 320°C. Full scan ranges from m/z 350 to 1,500 with resolution of 60,000 (at m/z 200), an automatic gain control (AGC) target value was 3 × 10 6, and a maximum ion injection time was 20 ms. The top 20 (Huang et al., 2009) precursors of the highest abundant in the full scan were selected and fragmented by higher-energy collisional dissociation (HCD) and analyzed in MS/MS, where resolution was 15,000 (at m/z 200), the automatic gain control (AGC) target value was 5 × 10⁴, the maximum ion injection time was 45 ms, a normalized collision energy was set as 27%, and intensity threshold was 2.2 × 10⁴. The dynamic exclusion parameter was 20 s. The raw data of M.S. detection were named as “raw.”
The resulting spectra from each fraction were searched separately against the Homo sapiens UniProt database by the search engines: Proteome Discoverer 2.2 (PD 2.2, Thermo). The search parameters are set as follows: mass tolerance for precursor ion was ten ppm and mass tolerance for production was 0.02 Da. Carbamidomethyl was specified in PD 2.2 as fixed modifications. Oxidation of methionine (M) and acetylation of the N-terminus was specified in PD 2.2 as variable modifications. A maximum of 2 missed cleavage sites was allowed.
The identified protein contains at least one unique peptide with FDR no more than 1.0%. Proteins containing similar peptides that could not be distinguished by MS/MS analysis were identified as the same protein group. Precursor ion was quantified by a label-free quantification method based on intensity. Mann–Whitney Test statistically analyzed the protein quantitation results for proteins whose quantitation significantly different between experimental and control groups were defined as differentially expressed proteins (DEP).
Gene Ontology (GO) and InterPro (IPR) analysis were conducted using the InterProScan-5 program against the nonredundant protein database (including Pfam, PRINTS, ProDom, SMART, ProSiteProfiles, and PANTHER) (Jones et al., 2014); the databases of Clusters of Orthologous Groups (COG) and Kyoto Encyclopedia of Genes and Genomes (KEGG) were used to analyze the protein family and pathway. The probable protein–protein interactions (PPI) were predicted using the STRING-db server (Franceschini et al., 2013) (http://string.embl.de/). The enrichment pipeline was used for enrichment analysis of G.O, IPR, and KEGG (Huang et al., 2009).
All data are presented as mean ± standard error of the mean (SEM). Statistical analysis was performed by unpaired, two-tailed Students t-test using the GraphPad Prism 8.0 software (GraphPad Software) if not denoted otherwise. Differences were considered statistically significant at p-value < 0.05. The Mann–Whitney test statistically analyzed the protein quantitation results. Because >two groups were compared in this survival study, the log-rank test with Bonferroni correction was used to compare two specific groups when the overall values were p < 0.05. Proteins were supposed to be significantly differentially expressed when the p-value < 0.05, fold change (FC) ≤ 0.05 or p-value < 0.05, FC ≥ 2.0.
The obtained NET-1 siRNA nanoparticles were well dispersed in aqueous solution and appeared as quasi-spheres with nanosize by transmission electron microscopy observation (Figure 1A). The mean particle size of NET-1 siRNA nanoparticles was 675.1 ± 33.3 nm, with a 0.341 mean polydispersity index (Figure 1B). Meanwhile, the zeta potential value of the complexes was –38.58 ± 0.27 mV (Figure 1C).
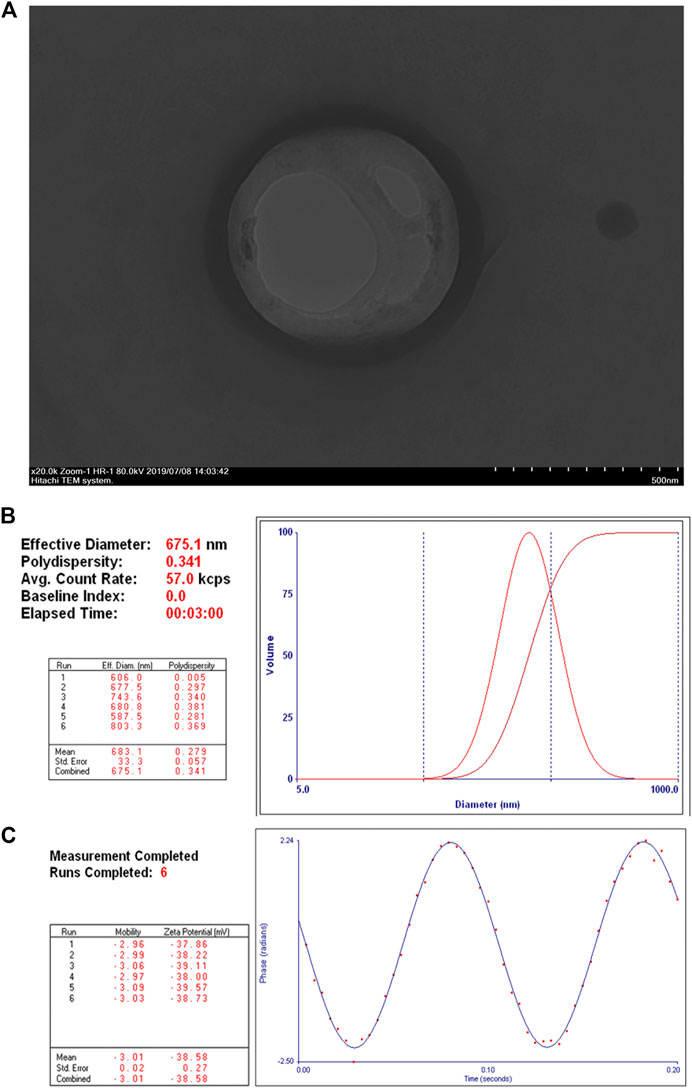
FIGURE 1. Structure and characterization of NET-1 siRNA nanoparticles. (A) Transmission electron microscopy image showed a quasi-spherical morphology of NET-1 siRNA nanoparticles with a diameter of about 600 nm. Original magnification, ×20,000. Scale bar, 500 nm; (B) the DLS results showed a mean particle size of NET-1 siRNA nanoparticles to be 675.1 ± 33.3 nm with a 0.341 polydispersity value; (C) the Zeta PALS BI-90 Plus analyzer indicated a surface zeta potential of NET-1 siRNA nanoparticles to be –38.58 ± 0.27 mV.
A decrease in tumor growth was observed in group C compared with other groups (p = 0.0461, Figure 2A). During the 60 days follow-up, all mice with a tumor larger than 2 cm were euthanized (according to the guidelines for Tumor Induction in Mice and Rats).
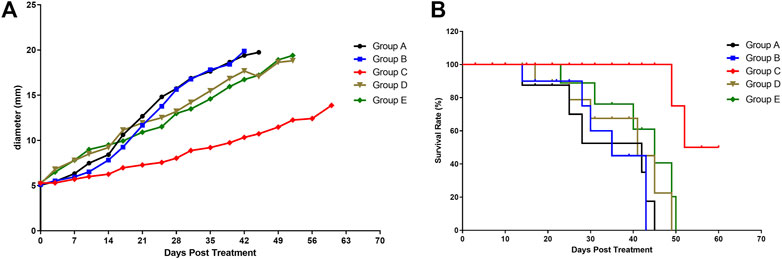
FIGURE 2. Tumor growth and mice survival in different mice groups. (A) Effect of the various treatments on tumor growth. (B) Effect of the various treatments on follow-up survival of mice (n = 6/group). Group A, blank control (black curve), group B, NET-1 siRNA nanoparticles without LIFU irradiation (blue curve); group C, NET-1 siRNA nanoparticles with LIFU irradiation (red curve); group D, NC-siRNA duplex nanoparticles with LIFU irradiation (brown curve); and group E, blank nanoparticles with LIFU irradiation (green curve).
Briefly, of group A, three mice died a natural death and three mice were euthanized within 45 days, the median survival was 28 days (Figure 2B, black). Of group B, 4 mice died a natural death within 35 days (Figure 2B, blue), and the other 2 mice were euthanized owing to the tumor size (Figure 2A, blue). Of group D, all mice died within 49 days (Figure 2B, brown). Of group E, all mice died within 50 days (Figure 2B, green).
Conversely, the group C showed the best survival result. 4 mice in group C survived until the end of follow-up (Figure 2B, red), and none of the tumors on any of the mice exceeded 20 mm in any direction during the follow-up period (Figure 2A, red). The log-rank (Mantel–Cox) test showed that the survival curves were significantly different (p = 0.0043).
Massive positive immunostaining for NET-1 protein was observed in group A, group B, group D, and group E tissues (Figures 3A–E). However, the NET-1 protein expression was significantly downregulated in groups C compared with the other groups (Figure 3C).
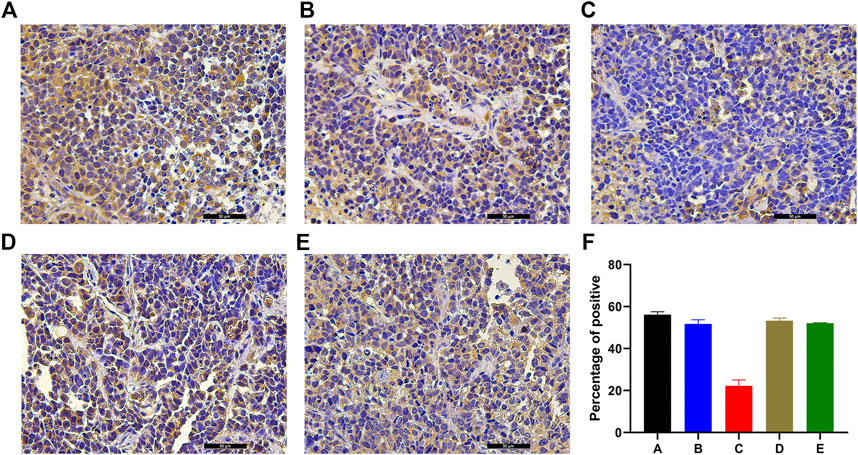
FIGURE 3. Example of the variability of IHC staining within tumor samples. (A) Group A showed strong staining, indicating the HCC cells surrounded by NET-1 protein (brown). (B) There was also an amount of NET-1 proteins around the tumor cells in group B. (C) There was little brown staining around the tumor, which indicated the NET-1 protein was significantly inhibited in group C. (D, E) There were also a large number of NET-1 proteins around tumor cells in group D and group E. (F) Quantitative IHC analysis of all groups, original magnification, ×400, Scale bar, 50 µm.
The percentage of positive cells was quantified by ImageJ. Quantitative IHC analysis indicated that the NET-1 protein staining was 56.11 ± 1.37 (group A), 51.69 ± 2.01 (group B), 22.24 ± 2.81 (group C), 53.29 ± 1.23 (group D), and 52.07 ± 0.24 (group E) compared with the whole picture in each group (Figure 3F, p < 0.01, one-way ANOVA).
Inspired by the IHC results, we carried out a label-free proteome analysis using FFPE HCC xenograft samples. In total, 3,389 proteins were quantified from the label-free analysis. Compared to Group A, a total of 78 proteins were differentially expressed (p-value ≤ 0.05, Figure 4A). Among them, the expression of 17 proteins were significantly upregulated (FC ≥ 2.0, p-value ≤ 0.05) and the manifestation of 61 proteins were significantly downregulated (FC ≤ 0.05, p-value ≤ 0.05). Cluster analysis of protein abundance was shown by a heat map (Figure 4B). Red indicates high expression proteins and blue indicates low expression proteins.
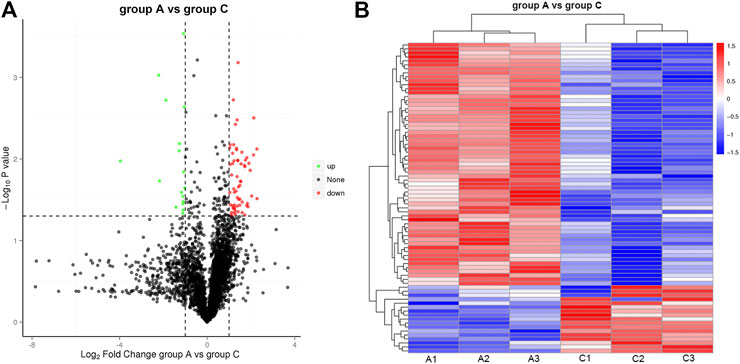
FIGURE 4. Illustration of DEP quantified from the label-free analysis (A) Volcano plots of protein abundance between group A and group C. Green dots represent downregulated protein (FC ≤ 0.05, p-value≤0.05), and red dots represent upregulated protein (FC ≥ 2.0, p-value≤0.05). (B) Heat map of hierarchical clustering of DEP. Red indicates high expression protein, and blue indicates low expression protein.
Based on the G.O. enrichment analysis, we can explore the main biological functions of DEP. The representative five enriched G.O. details of DEP were shown in Table 1. The top 20 G.O. enrichment terms of DEP were illustrated in Figure 5. The vast majority of G.O. enrichment terms belong to the biological process (B.P.). The enriched G.O. terms of the biological process were exhibited in detail in directed acyclic graph (DAG), as shown in Supplementary Figure S1A. Besides, the enriched G.O. terms of molecular function (M.F.) and cellular component (CC) were shown in Supplementary Figure S1B,C, respectively. The complete result of G.O. enrichment analysis was shown in Supplementary Table S2. The top 10 G.O. enrichment terms were presented graphically by DAG (Supplementary Figure S1).
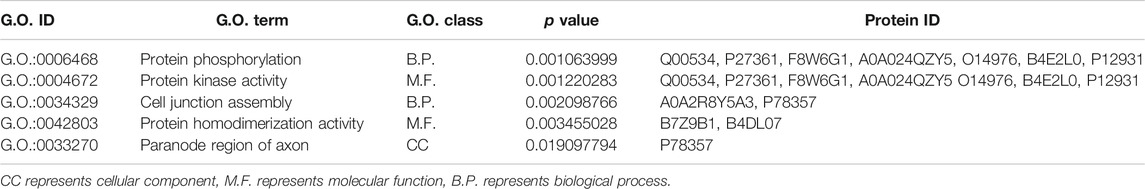
TABLE 1. Representative five enriched G.O. terms.
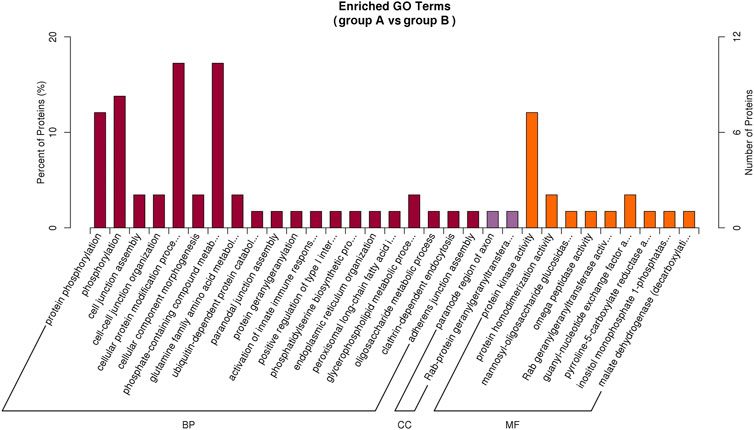
FIGURE 5. Illustration of the top 20 G.O. enrichment terms of all DEP. There are three categories of G..O. enrichment terms, biological process (B.P.), molecular function (M.F.), and cellular component (CC). The most DEP enriched in biological process (dark red), and only two CC terms had DEP enriched (purple). There were nine terms of MF (orange) were enriched by DEP.
The dominant biochemical metabolic pathways and signal transduction pathways, which were regulated by DEP, could be identified by KEGG pathway enrichment analysis. The representative five enriched KEGG pathways of DEP were “glutamatergic synapse,” “endocrine resistance,” “GABAergic synapse,” “gap junction,” and “melanogenesis” (Table 2). The top 20 enriched KEGG pathway terms were presented by a scatter plot (Figure 6). The details of all KEGG pathway enrichment analysis were shown in Supplementary Table S3.
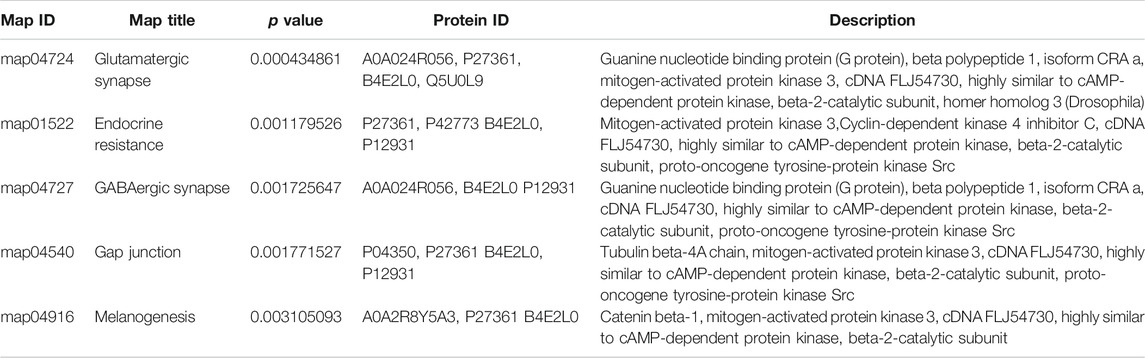
TABLE 2. Representative five enriched KEGG pathway terms of DEP.
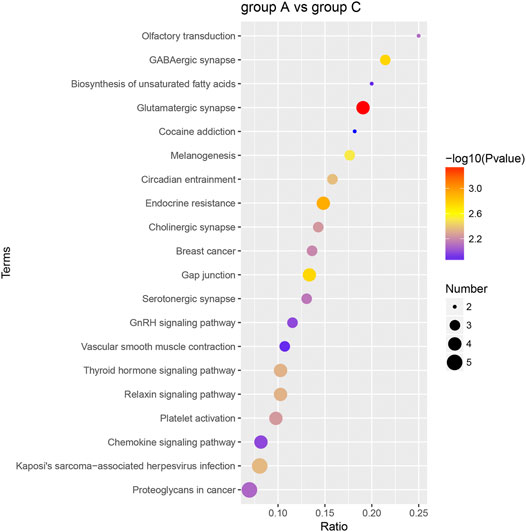
FIGURE 6. KEGG pathway enrichment analysis of DEP. The top 20 KEGG enrichment terms of all DEP between group A and group C were shown in the scatter plot. The color of the dot represents the −log10 (p-value), and the size of the dot represents the number of DEP.
In this study, we identified 47 IPR terms with differential enrichment (Supplementary Table S4). The representative five enriched IPR IDs and titles of DEP were shown in Table 3. The top 20 enriched IPR terms were explained in Figure 7. The details of all IPR enrichment terms were explained in Supplementary Table S4.
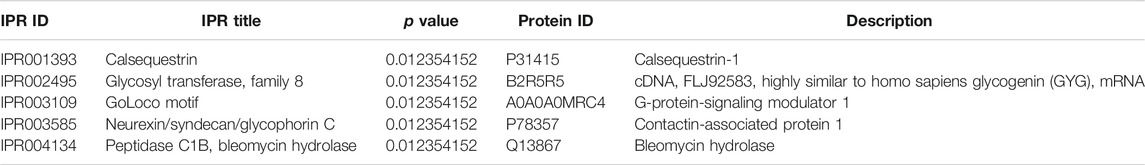
TABLE 3. Representative five enriched IPR terms of DEP.
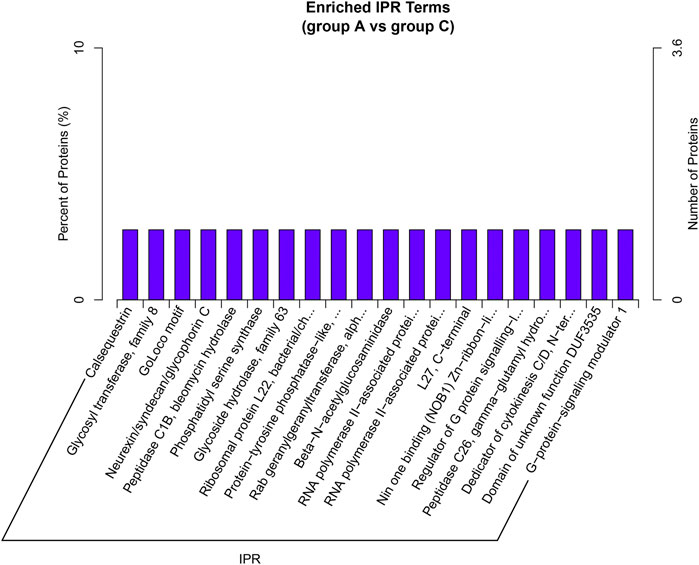
FIGURE 7. IPR enrichment analysis. A total of 47 IPR terms were identified between group A and group C. The top 20 IPR enrichment terms of all DEP were shown in the bar plot. Each IPR terms has only one DEP enriched.
PPI analysis indicated that the significantly upregulated proteins P12931, A0A2R8Y5A3, Q00534, and P27361 and the significant downregulated proteins P31415, A0A024QZY5, B7Z9B1, B4DL07, and A8K335 were interrelated and interacted with each other (Figure 8).
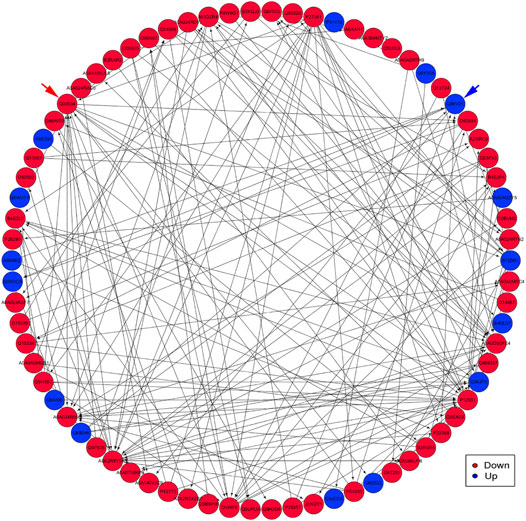
FIGURE 8. An interaction network of PPI analysis. The network revealed the direct and potential regulatory relationships between DEP. The downregulated proteins are represented by red nodes. The upregulated proteins are represented by blue nodes. Blue arrow indicates the Q86V21 (AACS) protein. Red arrow indicates the Q00534 (cyclin-dependent kinase 6) protein.
In our previous study, the NET-1 protein functions of HCC were investigated in vivo (Wu et al., 2019). The expression of NET-1 protein in HCC xenograft was merely detected by IHC staining. In the present study, we hypothesized that the combination of NET-1 siRNA nanoparticles system and SDT could effectively inhibit the expression of NET-1 protein and regulate multiple proteins. Compared with preexisting combined anticancer strategies, this established strategy of nanoparticles system integrated with SDT offers distinct advantages, such as high penetration, noninvasive, and flexible choice of tumor site. The obtained nanoparticles could be employed as gene vehicle and cavitation nuclei for acoustic cavitation effect with SDT, which could dig holes of approximately 300 nm on the tumor cell membranes (Meng et al., 2019). The acoustic cavitation effect has minimal harmful influences on adjacent tissues or organs and is depicted to be a potential strategy for gene delivery (Miansari et al., 2019). Also, as evidenced by IHC staining, the expression of NET-1 protein in group C was significantly depressed (Figure 3).
Label-free proteome analysis was conducted to identify the protein abundance. Surprisingly, a total of 78 DEP were sifted from 3,389 quantified proteins (p-value≤0.05). Moreover, 17 proteins were significantly upregulated (green dots in Figure 4A, FC ≥ 2.0, p-value ≤ 0.05), such as Q86V21, which was described as acetoacetyl-CoA synthetase (AACS). AACS is highly expressed in the brain. It is a ketone body-utilizing enzyme for the synthesis of cholesterol and fatty acids, which are essential, abundant components of neuronal tissue. It has been proved that AACS is regulated by SREBP-2 and involves in the normal development of neurons (Hasegawa et al., 2012). In contrast, 61 proteins were significantly downregulated (red dots in Figure 4A, FC ≤ 0.05, p-value ≤ 0.05), such as Q00534, which was described as cyclin-dependent kinase 6 (CDK6). Amplification of CDK6 and overexpression of cyclin D protein are also frequent in human cancers (Beroukhim et al., 2010). The expression of CDK6 can be downregulated as a result of NET-1 protein depression, which provides a therapeutic potential for targeting CDK6 in the treatment of cancer. Our hypothesis was confirmed preliminarily. Encouraged by the proof-of-concept results, we analyzed the potential functions of DEP based on the mass spectra proteome analysis results.
First, G.O. enrichment analysis for biological process, cell component, and molecular function was performed. A total of 78 G.O. enrichment terms belong to the biological process, which would indicate that most of the DEP was involved in regulating the biological process of HCC. On the other hand, NET-1 protein was a member of the tetraspanin family, which was is a crucial point of HCC biological processes such as proliferation, differentiation, migration, and invasion (Mazzocca et al., 2008; Mazzocca et al., 2014). Consequently, silencing the NET-1 gene could regulate many HCC biological processes by depressing the NET-1 protein expression. Second, KEGG pathway enrichment analysis was performed to explore the pathways, which may be regulated by the NET-1 gene. A total of 45 significantly enriched pathways were identified (p-value ≤ 0.05), as shown in Supplementary Table S3. In organisms, different proteins coordinate their biological behaviors, and the pathway-based analysis helps to understand their biological functions further. Interestingly, the DEP enriched in multifarious pathways, not only cancer-related pathways but also many other pathways, such as “olfactory transduction” (map04740), “cocaine addiction” (map05030), “morphine addiction” (map05032), “Kaposi’s sarcoma-associated herpesvirus infection” (map05167), and “human papillomavirus infection” (map05165). We concluded that the function of the NET-1 gene is not only to regulate HCC but also to participate in a variety of biochemical metabolic pathways in the human body. Third, proteins are composed of IPR that are units of protein structure, function, and evolution. The study of the IPR of proteins is essential for understanding the biological role of proteins and their development. In this study, 47 IPR enrichment terms were found, as shown in Supplementary Table S4 (p-value ≤ 0.05). Each IPR had a specific protein corresponding to it. It could be proved that IPR can form new proteins by copying and combining. The combination distribution between different IPR does not conform to the random model but shows that some IPR has a powerful combination ability, some of which are rarely combined with other domains. Finally, PPI analysis revealed the direct and potential regulatory relationships between DEP. As shown in Figure 8, all DEP formed a big circle and each node represented a DEP. The upregulated proteins are represented by blue nodes and the downregulated proteins are represented by red nodes. The interactions of DEP are incredibly sophisticated. All the protein–protein interactions happened after the NET-1 gene has been silenced. For instance, the Q86V21 (AACS) protein (blue arrow in Figure 8) could regulate the A0A024R5F7 protein, which was described as 7-dehydrocholesterol reductase isoform 1. It also indirectly proves that NET-1 protein could regulate the synthesis of cholesterol by modulating AACS and 7-dehydrocholesterol reductase isoform 1. The Q00534 (cyclin-dependent kinase 6) protein (red arrow in Figure 8) could regulate the other 11 proteins, such as O60884 (DNAJA2), O14976 (GAK) and so on. GAK is a cellular serine/threonine kinase that plays a major role in clathrin-mediated membrane trafficking (Wouters et al., 2019). It has been proved that osteosarcoma cell proliferation and survival are dependent on GAK (Susa et al., 2010). Thus, the NET-1 protein may be a potential therapeutic target of osteosarcoma.
In summary, for the first time, our present study provides valuable insight into the regulation of NET-1 siRNA nanoparticles system and SDT on other proteins in HCC on a proteomics level. It proved that the NET-1 protein, one of the tetraspanin proteins, participated in regulating many critical signaling pathways in HCC development. Our results also provide a potential proposal for targeted therapy based on tetraspanin proteins to treat HCC, and further mechanism investigations are needed to reveal a more detailed mechanism of action for NET-1 protein regulation of HCC.
The mass spectrometry proteomics data have been deposited to the ProteomeXchange Consortium via the PRIDE partner repository with the dataset identifier PXD020763.
The animal study was reviewed and approved by Harbin Medical University.
Conceptualization, WC and BW; Methodology, BW and HS; Data curation, XL and JL; Formal analysis, XL, YY, and HJ; Resources, BW and YC; Writing–original draft, CW; Visualization, HJ and XL; Funding acquisition, WC, HS, XL, and BW; Supervision, WC and BW. All the authors contributed to the discussion during the whole project.
This research was supported by the National Natural Science Foundation of China (grant number 81873900), Natural Science Foundation of Heilongjiang Province (grant number YQ2020H037), Project of Health Commission of Heilongjiang Province (grant number 2019053), and HAI YAN Science Foundation of Harbin Medical University Cancer Hospital (grant number JJQN 2021-14 and JJMS 2021-30).
The authors declare that the research was conducted in the absence of any commercial or financial relationships that could be construed as a potential conflict of interest.
We thank Prof. Weiwei An and Prof. Yue Yang (Institute of Cancer Prevention and Treatment, Heilongjiang Academy of Medical Science) for supplying the altruistic guidance on the proteomic analyses.
The Supplementary Material for this article can be found online at: https://www.frontiersin.org/articles/10.3389/fmolb.2021.678444/full#supplementary-material.
Bass, B. P., Engel, K. B., Greytak, S. R., and Moore, H. M. (2014). A Review of Preanalytical Factors Affecting Molecular, Protein, and Morphological Analysis of Formalin-Fixed, Paraffin-Embedded (FFPE) Tissue: How Well Do You Know Your FFPE Specimen? Arch. Pathol. Lab. Med. 138 (11), 1520–1530. Epub 2014/10/31. PubMed PMID: 25357115. doi:10.5858/arpa.2013-0691-RA
Beroukhim, R., Mermel, C. H., Porter, D., Wei, G., Raychaudhuri, S., Donovan, J., et al. (2010). The Landscape of Somatic Copy-Number Alteration across Human Cancers. Nature 463 (7283), 899–905. Epub 2010/02/19. PubMed PMID: 20164920; PubMed Central PMCID: PMCPMC2826709. doi:10.1038/nature08822
Broeckx, V., Boonen, K., Pringels, L., Sagaert, X., Prenen, H., Landuyt, B., et al. (2016). Comparison of Multiple Protein Extraction Buffers for GeLC-MS/MS Proteomic Analysis of Liver and Colon Formalin-Fixed, Paraffin-Embedded Tissues. Mol. Biosyst. 12 (2), 553–565. Epub 2015/12/18. PubMed PMID: 26676081. doi:10.1039/c5mb00670h
Brown, S. B., Brown, E. A., and Walker, I. (2004). The Present and Future Role of Photodynamic Therapy in Cancer Treatment. Lancet Oncol. 5 (8), 497–508. Epub 2004/08/04. PubMed PMID: 15288239. doi:10.1016/s1470-2045(04)01529-3
Castano, A. P., Demidova, T. N., and Hamblin, M. R. (2004). Mechanisms in Photodynamic Therapy: Part One-Photosensitizers, Photochemistry and Cellular Localization. Photodiagnosis photodynamic Ther. 1 (4), 279–293. Epub 2004/12/01. PubMed PMID: 25048432; PubMed Central PMCID: PMCPMC4108220. doi:10.1016/s1572-1000(05)00007-4
Chaerkady, R., Harsha, H. C., Nalli, A., Gucek, M., Vivekanandan, P., Akhtar, J., et al. (2008). A Quantitative Proteomic Approach for Identification of Potential Biomarkers in Hepatocellular Carcinoma. J. Proteome Res. 7 (10), 4289–4298. Epub 2008/08/22. PubMed PMID: 18715028; PubMed Central PMCID: PMCPMC3769105. doi:10.1021/pr800197z
Chan, A. M., Takai, S., Yamada, K., and Miki, T. (1996). Isolation of a Novel Oncogene, NET1, from Neuroepithelioma Cells by Expression cDNA Cloning. Oncogene 12 (6), 1259–1266. Epub 1996/03/21. PubMed PMID: 8649828
Chen, L., Wang, Z., Zhan, X., Li, D. C., Zhu, Y. Y., and Zhu, J. (2007). Association of NET-1 Gene Expression with Human Hepatocellular Carcinoma. Int. J. Surg. Pathol. 15 (4), 346–353. Epub 2007/10/05. PubMed PMID: 17913940. doi:10.1177/1066896907306083
Ferrin, G., de la Mata, M., Montero-Álvarez, J. L., Aguilar-Melero, P., and Rodríguez-Perálvarez, M. (2015). Biomarkers for Hepatocellular Carcinoma: Diagnostic and Therapeutic Utility. Hmer 7, 1–10. Epub 2015/05/01. PubMed PMID: 25926760; PubMed Central PMCID: PMCPMC4403743. doi:10.2147/hmer.S50161
Fowler, C. B., O'Leary, T. J., and Mason, J. T. (2014). Improving the Proteomic Analysis of Archival Tissue by Using Pressure-Assisted Protein Extraction: A Mechanistic Approach. J. Proteomics Bioinform 7 (6), 151–157. Epub 2014/07/23. PubMed PMID: 25049470; PubMed Central PMCID: PMCPMC4103194. doi:10.4172/jpb.1000315
Franceschini, A., Szklarczyk, D., Frankild, S., Kuhn, M., Simonovic, M., Roth, A., et al. (2013). STRING v9.1: Protein-Protein Interaction Networks, with Increased Coverage and Integration. Nucleic Acids Res. 41 (Database issue), D808–D815. Epub 2012/12/04. PubMed PMID: 23203871; PubMed Central PMCID: PMCPMC3531103. doi:10.1093/nar/gks1094
Gao, Q., Zhu, H., Dong, L., Shi, W., Chen, R., Song, Z., et al. (2019). Integrated Proteogenomic Characterization of HBV-Related Hepatocellular Carcinoma. Cell 179 (2), 561–577. e22. Epub 2019/10/05. PubMed PMID: 31585088. doi:10.1016/j.cell.2019.08.052
Hasegawa, S., Kume, H., Iinuma, S., Yamasaki, M., Takahashi, N., and Fukui, T. (2012). Acetoacetyl-CoA Synthetase Is Essential for Normal Neuronal Development. Biochem. biophysical Res. Commun. 427 (2), 398–403. Epub 2012/09/25. PubMed PMID: 23000407. doi:10.1016/j.bbrc.2012.09.076
Huang, D. W., Sherman, B. T., and Lempicki, R. A. (2009). Bioinformatics Enrichment Tools: Paths toward the Comprehensive Functional Analysis of Large Gene Lists. Nucleic Acids Res. 37 (1), 1–13. Epub 2008/11/27. PubMed PMID: 19033363; PubMed Central PMCID: PMCPMC2615629. doi:10.1093/nar/gkn923
Iglesias-Gato, D., Wikström, P., Tyanova, S., Lavallee, C., Thysell, E., Carlsson, J., et al. (2016). The Proteome of Primary Prostate Cancer. Eur. Urol. 69 (5), 942–952. Epub 2015/12/15. PubMed PMID: 26651926. doi:10.1016/j.eururo.2015.10.053
Jones, P., Binns, D., Chang, H.-Y., Fraser, M., Li, W., McAnulla, C., et al. (2014). InterProScan 5: Genome-Scale Protein Function Classification. Bioinformatics 30 (9), 1236–1240. Epub 2014/01/24. PubMed PMID: 24451626; PubMed Central PMCID: PMCPMC3998142. doi:10.1093/bioinformatics/btu031
Kanetaka, K., Sakamoto, M., Yamamoto, Y., Yamasaki, S., Lanza, F., Kanematsu, T., et al. (2001). Overexpression of Tetraspanin CO-029 in Hepatocellular Carcinoma. J. Hepatol. 35 (5), 637–642. Epub 2001/11/03. PubMed PMID: 11690710. doi:10.1016/s0168-8278(01)00183-0
Li, P., Conley, A., Zhang, H., and Kim, H. L. (2014). Whole-Transcriptome Profiling of Formalin-Fixed, Paraffin-Embedded Renal Cell Carcinoma by RNA-Seq. BMC genomics 15, 1087. Epub 2014/12/17. PubMed PMID: 25495041; PubMed Central PMCID: PMCPMC4298956. doi:10.1186/1471-2164-15-1087
Mantsiou, A., Makridakis, M., Fasoulakis, K., Katafigiotis, I., Constantinides, C. A., Zoidakis, J., et al. (2019). Proteomics Analysis of Formalin Fixed Paraffin Embedded Tissues in the Investigation of Prostate Cancer. J. Proteome Res. 19, 2631–2642. Epub 2019/11/05. PubMed PMID: 31682457. doi:10.1021/acs.jproteome.9b00587
Martelotto, L. G., Baslan, T., Kendall, J., Geyer, F. C., Burke, K. A., Spraggon, L., et al. (2017). Whole-genome Single-Cell Copy Number Profiling from Formalin-Fixed Paraffin-Embedded Samples. Nat. Med. 23 (3), 376–385. Epub 2017/02/07. PubMed PMID: 28165479; PubMed Central PMCID: PMCPMC5608257. doi:10.1038/nm.4279
Mazzocca, A., Liotta, F., and Carloni, V. (2008). Tetraspanin CD81-Regulated Cell Motility Plays a Critical Role in Intrahepatic Metastasis of Hepatocellular Carcinoma. Gastroenterology 135 (1), 244–256. e1. Epub 2008/05/10. PubMed PMID: 18466772. doi:10.1053/j.gastro.2008.03.024
Mazzocca, A., Tahmasebi Birgani, M., Sabbà, C., and Carloni, V. (2014). Tetraspanin-enriched Microdomains and Hepatocellular Carcinoma Progression. Cancer Lett. 351 (1), 23–29. Epub 2014/05/27. PubMed PMID: 24858024. doi:10.1016/j.canlet.2014.05.016
McHale, A. P., Callan, J. F., Nomikou, N., Fowley, C., and Callan, B. (2016). Sonodynamic Therapy: Concept, Mechanism and Application to Cancer Treatment. Adv. Exp. Med. Biol. 880, 429–450. Epub 2015/10/22. PubMed PMID: 26486350. doi:10.1007/978-3-319-22536-4_22
Meng, L., Liu, X., Wang, Y., Zhang, W., Zhou, W., Cai, F., et al. (2019). Sonoporation of Cells by a Parallel Stable Cavitation Microbubble Array. Adv. Sci. 6 (17), 1900557. Epub 2019/09/12. PubMed PMID: 31508275; PubMed Central PMCID: PMCPMC6724477. doi:10.1002/advs.201900557
Miansari, M., Mehta, M. D., Schilling, J. M., Kurashina, Y., Patel, H. H., and Friend, J. (2019). Inducing Mild Traumatic Brain Injury in C. elegans via Cavitation-free Surface Acoustic Wave-Driven Ultrasonic Irradiation. Sci. Rep. 9 (1), 12775. Epub 2019/09/06. PubMed PMID: 31485018; PubMed Central PMCID: PMCPMC6726767. doi:10.1038/s41598-019-47295-1
Murray, D., Horgan, G., Macmathuna, P., and Doran, P. (2008). NET1-mediated RhoA Activation Facilitates Lysophosphatidic Acid-Induced Cell Migration and Invasion in Gastric Cancer. Br. J. Cancer 99 (8), 1322–1329. Epub 2008/10/02. PubMed PMID: 18827818; PubMed Central PMCID: PMCPMC2570507. doi:10.1038/sj.bjc.6604688
Rosenthal, I., Sostaric, J. Z., and Riesz, P. (2004). Sonodynamic Therapy-Aa Review of the Synergistic Effects of Drugs and Ultrasound. Ultrason. Sonochem. 11 (6), 349–363. Epub 2004/08/11. PubMed PMID: 15302020. doi:10.1016/j.ultsonch.2004.03.004
Serru, V., Dessen, P., Boucheix, C., and Rubinstein, E. (2000). Sequence and Expression of Seven New Tetraspans. Biochim. Biophys. Acta (Bba) - Protein Struct. Mol. Enzymol. 1478 (1), 159–163. Epub 2000/03/17. PubMed PMID: 10719184. doi:10.1016/s0167-4838(00)00022-4
Shang, H., Wu, B., Liang, X., Sun, Y., Han, X., Zhang, L., et al. (2019). Evaluation of Therapeutic Effect of Targeting Nanobubbles Conjugated with NET-1 siRNA by Shear Wave Elastography: an In Vivo Study of Hepatocellular Carcinoma Bearing Mice Model. Drug Deliv. 26 (1), 944–951. Epub 2019/09/24. PubMed PMID: 31544556. doi:10.1080/10717544.2019.1667450
Shen, S.-Q., Li, K., Zhu, N., and Nakao, A. (2008). Expression and Clinical Significance of NET-1 and PCNA in Hepatocellular Carcinoma. Med. Oncol. 25 (3), 341–345. Epub 2008/01/25. PubMed PMID: 18214716. doi:10.1007/s12032-008-9042-6
Shi, S. R., Key, M. E., and Kalra, K. L. (1991). Antigen Retrieval in Formalin-Fixed, Paraffin-Embedded Tissues: an Enhancement Method for Immunohistochemical Staining Based on Microwave Oven Heating of Tissue Sections. J. Histochem. Cytochem. 39 (6), 741–748. Epub 1991/06/01. PubMed PMID: 1709656. doi:10.1177/39.6.1709656
Shibaguchi, H., Tsuru, H., Kuroki, M., and Kuroki, M. (2011). Sonodynamic Cancer Therapy: a Non-invasive and Repeatable Approach Using Low-Intensity Ultrasound with a Sonosensitizer. Anticancer Res. 31 (7), 2425–2429. Epub 2011/08/30. PubMed PMID: 21873154
Susa, M., Choy, E., Liu, X., Schwab, J., Hornicek, F. J., Mankin, H., et al. (2010). Cyclin G-Associated Kinase Is Necessary for Osteosarcoma Cell Proliferation and Receptor Trafficking. Mol. Cancer Ther. 9 (12), 3342–3350. Epub 2010/10/01. PubMed PMID: 20881269. doi:10.1158/1535-7163.Mct-10-0637
Tachibana, K., Feril, L. B., and Ikeda-Dantsuji, Y. (2008). Sonodynamic Therapy. Ultrasonics 48 (4), 253–259. Epub 2008/04/25. PubMed PMID: 18433819. doi:10.1016/j.ultras.2008.02.003
Van Allen, E. M., Wagle, N., Stojanov, P., Perrin, D. L., Cibulskis, K., Marlow, S., et al. (2014). Whole-exome Sequencing and Clinical Interpretation of Formalin-Fixed, Paraffin-Embedded Tumor Samples to Guide Precision Cancer Medicine. Nat. Med. 20 (6), 682–688. Epub 2014/05/20. PubMed PMID: 24836576; PubMed Central PMCID: PMCPMC4048335. doi:10.1038/nm.3559
Villanueva, A. (2019). Hepatocellular Carcinoma. N. Engl. J. Med. 380 (15), 1450–1462. PubMed PMID: 30970190. doi:10.1056/NEJMra1713263
Wakabayashi, M., Yoshihara, H., Masuda, T., Tsukahara, M., Sugiyama, N., and Ishihama, Y. (2014). Phosphoproteome Analysis of Formalin-Fixed and Paraffin-Embedded Tissue Sections Mounted on Microscope Slides. J. Proteome Res. 13 (2), 915–924. Epub 2013/12/18. PubMed PMID: 24328109. doi:10.1021/pr400960r
Wouters, R., Pu, S.-Y., Froeyen, M., Lescrinier, E., Einav, S., Herdewijn, P., et al. (2019). Cyclin G-Associated Kinase (GAK) Affinity and Antiviral Activity Studies of a Series of 3-C-Substituted Isothiazolo[4,3-B]pyridines. Eur. J. Med. Chem. 163, 256–265. Epub 2018/12/12. PubMed PMID: 30529544. doi:10.1016/j.ejmech.2018.11.065
Wu, B., Qiao, Q., Han, X., Jing, H., Zhang, H., Liang, H., et al. (2016). Targeted Nanobubbles in Low-Frequency Ultrasound-Mediated Gene Transfection and Growth Inhibition of Hepatocellular Carcinoma Cells. Tumor Biol. 37 (9), 12113–12121. PubMed PMID: 27216880. doi:10.1007/s13277-016-5082-2
Wu, B., Shang, H., Liang, X., Sun, Y., Jing, H., Han, X., et al. (2019). Preparation of Novel Targeting Nanobubbles Conjugated with Small Interfering RNA for Concurrent Molecular Imaging and Gene Therapy In Vivo. FASEB J. 33, 14129–14136. Epub 2019/10/29. PubMed PMID: 31657628. doi:10.1096/fj.201900716RR
Wu, B., Yuan, Y., Han, X., Wang, Q., Shang, H., Liang, X., et al. (2020). Structure of LINC00511‐siRNA‐conjugated Nanobubbles and Improvement of Cisplatin Sensitivity on Triple Negative Breast Cancer. FASEB j. 34, 9713–9726. Epub 2020/06/05. PubMed PMID: 32497336. doi:10.1096/fj.202000481R
Wu, Y.-Y., Chen, L., Wang, G.-L., Zhang, Y.-X., Zhou, J.-M., He, S., et al. (2013). Inhibition of Hepatocellular Carcinoma Growth and Angiogenesis by Dual Silencing of NET-1 and VEGF. J. Mol. Hist. 44 (4), 433–445. Epub 2013/05/03. PubMed PMID: 23636606. doi:10.1007/s10735-012-9480-5
Yang, X., Xiong, Q., Wu, Y., Li, S., and Ge, F. (2017). Quantitative Proteomics Reveals the Regulatory Networks of Circular RNA CDR1as in Hepatocellular Carcinoma Cells. J. Proteome Res. 16 (10), 3891–3902. Epub 2017/09/12. PubMed PMID: 28892615. doi:10.1021/acs.jproteome.7b00519
Ye, K., Wang, Z., Zhang, G., and Liang, S. (2010). Prognostic Significance of Neuroepithelial Transforming Protein 1 in Hepatocellular Carcinoma. J. Invest. Surg. 23 (3), 163–169. Epub 2010/07/02. PubMed PMID: 20590388. doi:10.3109/08941939.2010.481010
Yumita, N., Iwase, Y., Nishi, K., Komatsu, H., Takeda, K., Onodera, K., et al. (2012). Involvement of Reactive Oxygen Species in Sonodynamically Induced Apoptosis Using a Novel Porphyrin Derivative. Theranostics 2 (9), 880–888. Epub 2012/10/20. PubMed PMID: 23082100; PubMed Central PMCID: PMCPMC3475214. doi:10.7150/thno.3899
Yumita, N., Nishigaki, R., Umemura, K., and Umemura, S. I. (1989). Hematoporphyrin as a Sensitizer of Cell-Damaging Effect of Ultrasound. Jpn. J. Cancer Res. : Gann 80 (3), 219–222. Epub 1989/03/01. PubMed PMID: 2470713; PubMed Central PMCID: PMCPMC5917717. doi:10.1111/j.1349-7006.1989.tb02295.x
Keywords: hepatocellular carcinoma, sonodynamic therapy, tetraspanin protein, mass spectrometry, proteomics, ultrasound
Citation: Wu B, Shang H, Liu J, Liang X, Yuan Y, Chen Y, Wang C, Jing H and Cheng W (2021) Quantitative Proteomics Analysis of FFPE Tumor Samples Reveals the Influences of NET-1 siRNA Nanoparticles and Sonodynamic Therapy on Tetraspanin Protein Involved in HCC. Front. Mol. Biosci. 8:678444. doi: 10.3389/fmolb.2021.678444
Received: 09 March 2021; Accepted: 26 April 2021;
Published: 10 May 2021.
Edited by:
Elisa Araldi, ETH Zürich, SwitzerlandReviewed by:
Marya Ahmed, University of Prince Edward Island, CanadaCopyright © 2021 Wu, Shang, Liu, Liang, Yuan, Chen, Wang, Jing and Cheng. This is an open-access article distributed under the terms of the Creative Commons Attribution License (CC BY). The use, distribution or reproduction in other forums is permitted, provided the original author(s) and the copyright owner(s) are credited and that the original publication in this journal is cited, in accordance with accepted academic practice. No use, distribution or reproduction is permitted which does not comply with these terms.
*Correspondence: Wen Cheng, Y2hlbmd3ZW5AaHJibXUuZWR1LmNu
Disclaimer: All claims expressed in this article are solely those of the authors and do not necessarily represent those of their affiliated organizations, or those of the publisher, the editors and the reviewers. Any product that may be evaluated in this article or claim that may be made by its manufacturer is not guaranteed or endorsed by the publisher.
Research integrity at Frontiers
Learn more about the work of our research integrity team to safeguard the quality of each article we publish.