 Rossana Lazcano
 Frank Rojas
 Caddie Laberiano
 Sharia Hernandez
 Edwin Roger Parra
94% of researchers rate our articles as excellent or good
Learn more about the work of our research integrity team to safeguard the quality of each article we publish.
Find out more
ORIGINAL RESEARCH article
Front. Mol. Biosci. , 30 July 2021
Sec. Molecular Diagnostics and Therapeutics
Volume 8 - 2021 | https://doi.org/10.3389/fmolb.2021.661222
This article is part of the Research Topic Multiplex Immunohistochemistry/Immunofluorescence Technique: The Potential and Promise for Clinical Application View all 10 articles
Immune profiling of formalin-fixed, paraffin-embedded tissues using multiplex immunofluorescence (mIF) staining and image analysis methodology allows for the study of several biomarkers on a single slide. The pathology quality control (PQC) for tumor tissue immune profiling using digital image analysis of core needle biopsies is an important step in any laboratory to avoid wasting time and materials. Although there are currently no established inclusion and exclusion criteria for samples used in this type of assay, a PQC is necessary to achieve accurate and reproducible data. We retrospectively reviewed PQC data from hematoxylin and eosin (H&E) slides and from mIF image analysis samples obtained during 2019. We reviewed a total of 931 reports from core needle biopsy samples; 123 (13.21%) were excluded during the mIF PQC. The most common causes of exclusion were the absence of malignant cells or fewer than 100 malignant cells in the entire section (n = 42, 34.15%), tissue size smaller than 4 × 1 mm (n = 16, 13.01%), fibrotic tissue without inflammatory cells (n = 12, 9.76%), and necrotic tissue (n = 11, 8.94%). Baseline excluded samples had more fibrosis (90 vs 10%) and less necrosis (5 vs 90%) compared with post-treatment excluded samples. The most common excluded organ site of the biopsy was the liver (n = 19, 15.45%), followed by soft tissue (n = 17, 13.82%) and the abdominal region (n = 15, 12.20%). We showed that the PQC is an important step for image analysis and that the absence of malignant cells is the most limiting sample characteristic for mIF image analysis. We also discuss other challenges that pathologists need to consider to report reliable and reproducible image analysis data.
Pathology quality control (PQC) consists of multiple technical steps that evaluate and measure the quality of a sampling process (Adyanthaya and Jose, 2013). PQC also provides consistent checks to identify and address errors and obtain accurate, precise, and reproducible data (Mangino, 2006; Greig, 2019). A retrospective analysis at the National Cancer Institute Developmental Therapeutics Clinic found that 74% of the core needle biopsies performed in pharmacodynamic studies that included fluorescence and mass spectrometry analyses passed their quality control criteria (Ferry-Galow et al., 2016; Parchment and Doroshow, 2016). The study used hematoxylin and eosin (H&E) slide-based analyses as the first PQC step and found that the lack of malignant cells (MCs) excluded the largest number of samples.
In the last 5 years, the immune profiling of formalin-fixed, paraffin-embedded (FFPE) tissues using multiplex immunofluorescence (mIF) staining and digital image analysis methodologies has arisen as a new technology to study several biomarkers on a single slide in longitudinal studies (Francisco-Cruz et al., 2020). However, an efficient PQC process developed by pathologists with experience in digital image analysis is needed. This type of PQC for image analysis and mIF is necessary to avoid expending unnecessary resources and laboratory personnel time (Parra et al., 2020) and to obtain high-quality and reproducible results.
The success of any research study that uses FFPE tissues depends on the quality of the samples. Therefore, it is important to establish minimum parameters for biopsy sample quality that should be met before the staining process begins (Ferry-Galow et al., 2018). Core needle biopsy samples are generally around 1.58 mm in diameter and 12.7 mm long, although their size can vary. The small size of these samples makes them the most challenging for digital image analysis because it is more likely for a significant proportion of the sample to be damaged during cutting, staining, and scanning, especially when sensitive staining methodologies such as mIF are used. Yet, these tissues are invaluable material for longitudinal studies, so efforts to obtain quality data, which is important for translational studies, should be maximized.
The goal of this manuscript is to maximize the workflow of the PQC for digital image analysis. Thus, we retrospectively studied this assessment to standardize the process, to minimize time and cost expenditures, and to guarantee high-quality and reproducible results using mIF and digital image analysis.
From 4,371 biopsies collected by the Adaptive patient-oriented longitudinal learning and optimization program from different research programs at The University of Texas MD Anderson Cancer Center from January through December of 2019, we retrospectively reviewed the PQC reports based on the H&E slides of 931 core needle biopsies from longitudinal studies. Biopsies from different time points were included in this study (608 baseline biopsies and 323 post-treatment biopsies), and all the samples had been processed for mIF and digital image analysis to study the tumor microenvironment, including the presence of cytokeratins, SOX10, and GFAP to characterize malignant cells in different organs; immune checkpoint markers (i.e., PD-L1, B7-H3, B7-H4, IDO-1, VISTA, LAG3, ICOS, TIM3, and OX40); tumor-infiltrating lymphocyte markers (i.e., CD3, CD8, CD45RO, granzyme B, PD-1, and FOXP3); and markers to characterize myeloid-derived suppressor cells (i.e., CD68, CD66b, CD14, CD33, Arg-1, and CD11b), and these samples were placed in panels similar to those previously published (Parra et al., 2021).
Five principal characteristics as annotated in the H&E PQC reports of the biopsies were analyzed: 1) tissue size (length and width), 2) percentage of tumor area with respect to the total size of the sample, 3) percentage of MCs in the tumor area of the sample, 4) percentage of necrotic area, and 5) percentage of fibrosis. In parallel, the PQC of the digital image analysis was retrieved from the final data reports of the mIF panels and reviewed. Similar characteristics were analyzed on the mIF slides. For the cases in which image analysis could not be performed, the comments containing the criterion of exclusion were retrieved instead. All the data from the H&E and digital image analysis PQCs were tabulated, and the results are shown below.
None of the 931 core needle biopsies evaluated were excluded during the H&E PQC, while 123 biopsies (13.21%) were excluded during the digital image analysis PQC at low magnification (10x) (Figures 1, 2). The range of excluded samples per project was 3.45–24.17%. Post-treatment samples were more frequently excluded (62 of 323, 19.20%) compared to the baseline samples (61 of 608, 10.03%). An important characteristic of the samples was their size. The median length was 12 mm (range, 1–24 mm), and the median width was around 1 mm (range, 0.8–1.2 mm). However, we observed that the median length of the samples excluded due to small size was 1.25 mm (range, 0.5–4 mm), and the median width was similar for included and excluded samples.
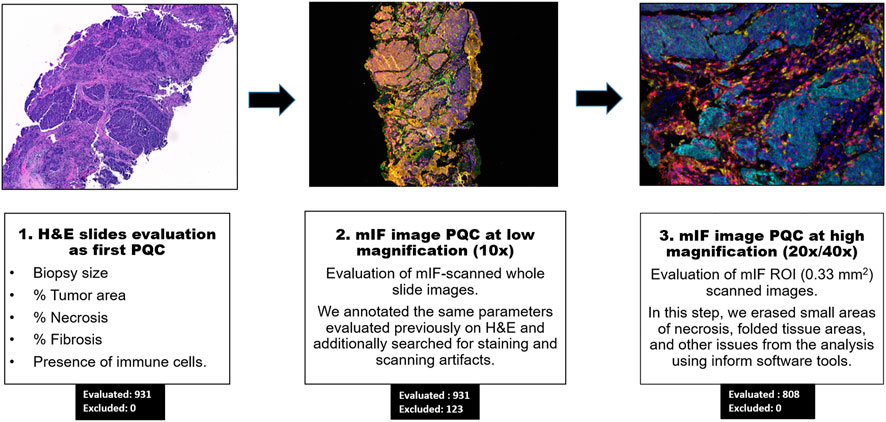
FIGURE 1. Workflow of pathology quality control (PQC) for core needle biopsy sample assessment for multiplex immunofluorescence and digital image analysis. Showing the overall three steps of PQC, including assessment of the hematoxylin and eosin (H&E) slides for PQC, image analysis PQC at 10x magnification, and image analysis PQC of region of interest (ROI) images at 20x/40x magnification. The numbers of cases evaluated and excluded at each step are indicated.
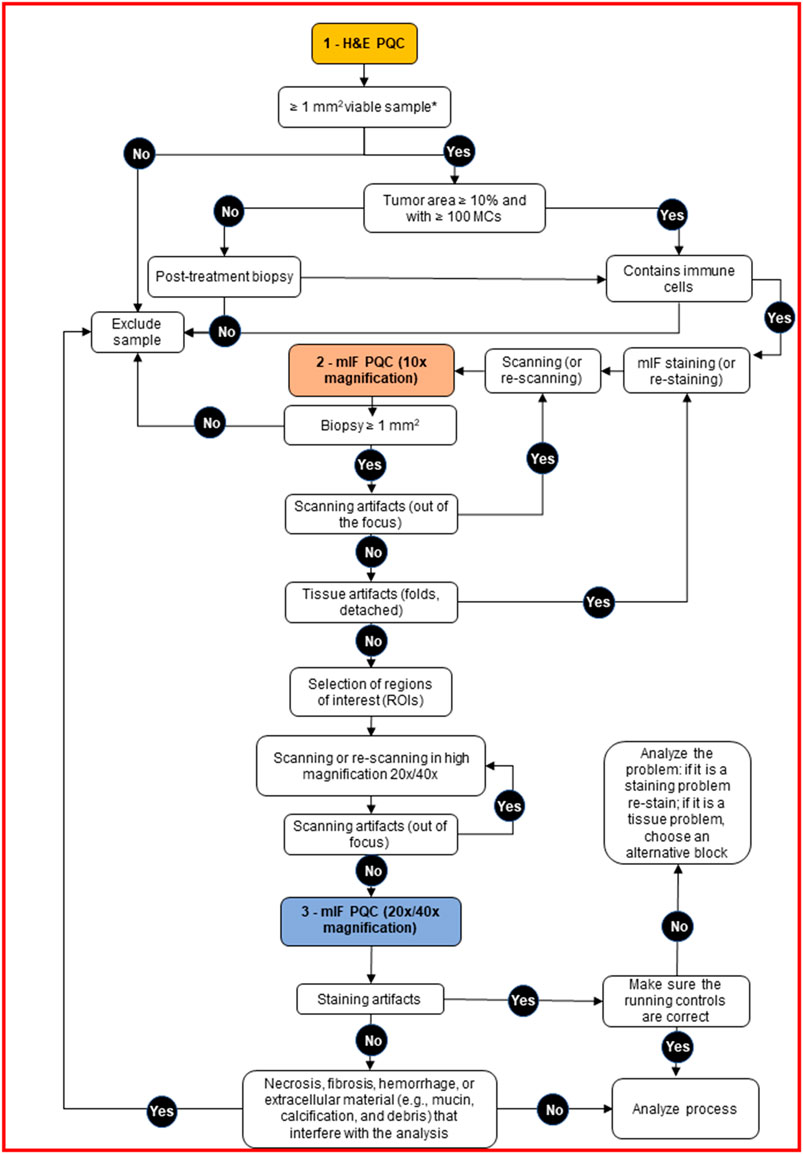
FIGURE 2. Decision tree for pathology quality control (PQC) of core needle biopsy sample assessment for multiplex immunofluorescence and digital image analysis. The tree shows the detailed protocol with corresponding decisions for the pathologist to make during the three PQC steps. H&E, hematoxylin and eosin; MCs, malignant cells; mIF, multiplex immunofluorescence.
After we retrieved the annotated characteristics of the samples from the H&E PQC reports, we compared the baseline and post-treatment characteristics of the excluded and included samples. (See examples on Figure 3). In the excluded baseline biopsies, the median percentages of tumor area and MCs in the tumor area were both 0% (range, 0–60%). For the included baseline biopsies, the median tumor content area was 95% (range, 30–100%), and the median percentage of MCs in the tumor area was 60% (range, 5–100%). Interestingly, we observed that the excluded baseline samples had tumor areas with a median of 90% fibrotic areas compared to only 20% fibrotic areas in the included baseline samples. The percentage of necrosis was similar in the excluded and included samples. Furthermore, in the excluded post-treatment biopsies, the median tumor area was 10% and the percentage of MCs in the tumor area was 5%. In the included post-treatment samples, the median tumor area was 20% and the percentage of MCs in the tumor area was 50%. We also found a higher percentage of necrotic area in the excluded samples than in the included samples (median, 90 versus 25%, respectively). However, the percentage of fibrotic area was lower in the excluded post-treatment biopsies as shown in (Table 1).
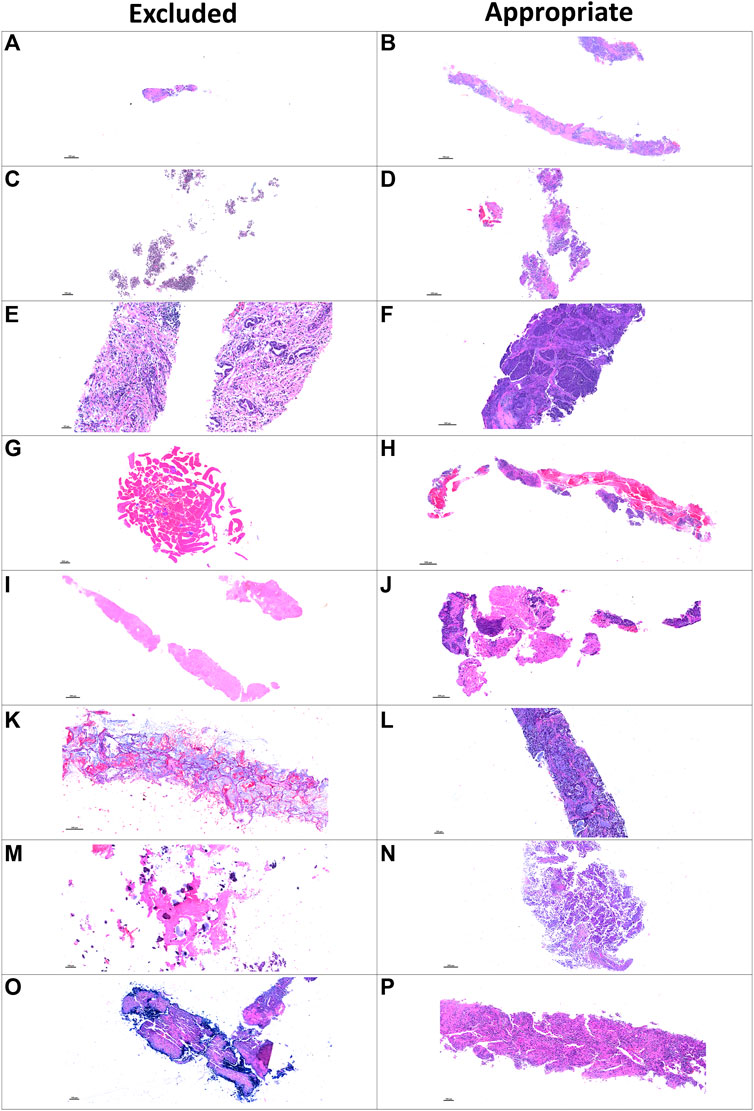
FIGURE 3. Microphotographs of representative examples of excluded and included core needle biopsies using hematoxylin and eosin slides for pathology quality control. Excluded examples (left column) compared with samples considered appropriate for image analysis (right column). Small sample size (A) compared with a large, adequate sample (B). Sample without malignant cells and only with normal tissue (C) compared with a sample with adequate amount of malignant cells (D). Sample with extensive fragmentation (E) compared with another fragmented sample that could be included in the analysis (F). Small sample with extensive hemorrhagic area (G) compared with another large sample with extensive hemorrhagic area but also with enough tumor content (H). Sample with extensive necrotic area (I) compared with another similarly sized sample with enough tumor content for analysis (J). Sample with mucinous and scattered malignant cells (K) compared with a sample considered appropriate for image analysis (L). Sample with predominant fibrosis and calcification (M) compared with an adequate tumor-containing sample (N). A biopsy with artifact of desiccation (O) compared with a well-preserved biopsy (P).
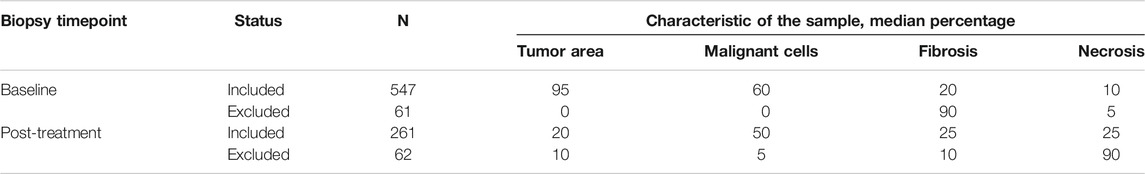
TABLE 1. General overview of pathology quality control characteristics in our cohort (N = 931) divided by baseline (N = 608) and post-treatment (N = 323) core needle biopsies.
When we reviewed the digital image analysis PQC reports for the excluded samples, the most common causes of exclusion were absence of MCs or fewer than 100 MCs (n = 42, 34.15%), small tissue sample size (n = 16, 13.01%), mostly fibrotic tissue without inflammatory cells (n = 12, 9.76%), and mostly necrotic tissue (n = 11, 8.94%). The less common reasons for exclusion were fragmentation conditions (n = 2, 1.63%); crushed cell artifact (n = 2, 1.63%); staining artifact, apparently for oxidation and desiccation of the sample (n = 2, 1.63%) and hemorrhagic tissue (n = 1, 0.81%); (Table 2 and Figure 4). Although most of the samples showed one of the previously mentioned predominant causes for exclusion, some samples showed more than one cause for exclusion. For these samples, the most frequent combinatory factors were few or no MCs and mostly fibrotic tissue without inflammatory cells (n = 7, 5.69%) as well as mostly necrotic and fibrotic tissue without inflammatory cells (n = 4, 3.25%) (Table 2).
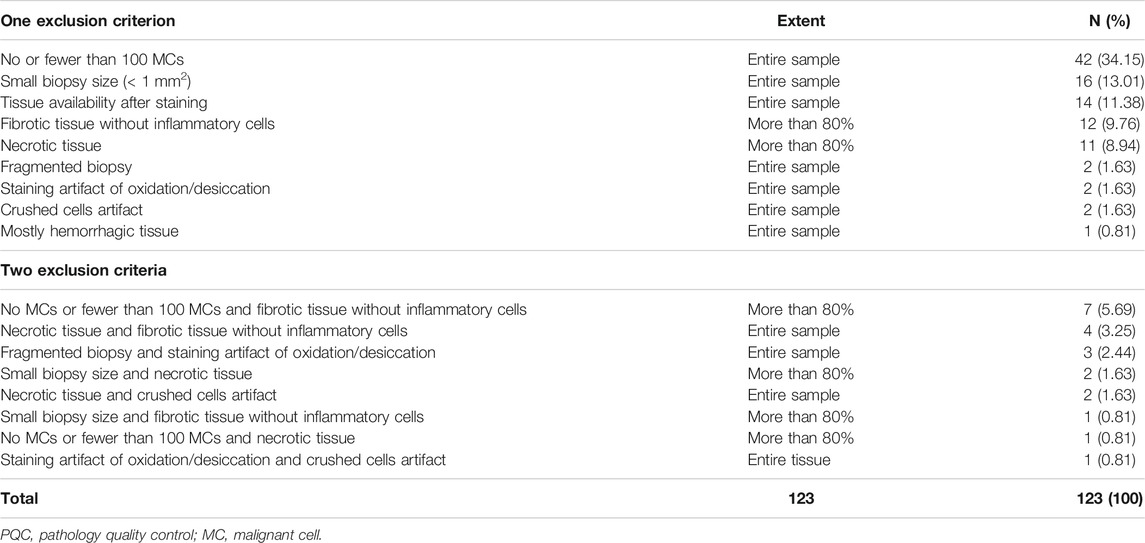
TABLE 2. Characteristics of exclusion criteria observed during digital image analysis PQC (N = 123).
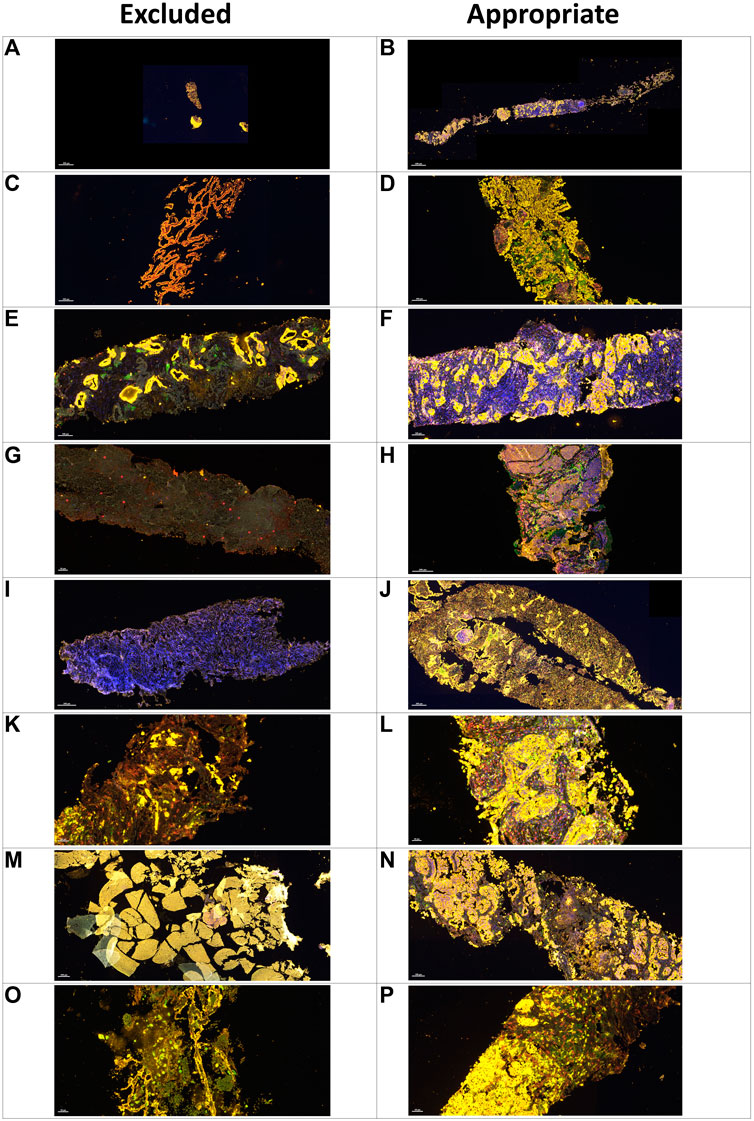
FIGURE 4. Microphotographs of representative examples of excluded and included core needle biopsies in multiplex immunofluorescence slides using digital image analysis assessment for pathology quality control. Excluded examples (Left column) compared with samples considered appropriate for image analysis (right column). A small sample (A) compared with a large sample with adequate amount of tumor content in yellow(B). Sample without malignant cells and with only normal tissue in yellow(C) compared with nets of malignant cells in yellow(D). Nets of malignant cells in yellow in the middle of extensive fibrotic areas with lack of inflammatory cells (E) compared with a sample with a large amount of inflammatory cells (F). Sample with extensive necrotic area in grayish green(G) compared with a sample without necrotic areas (H). Sample with staining artifact showing the lack of marker expression (I) compared with another sample with adequate staining (J). Sample with crushed cells artifact (K) compared with a sample with clear individualization of the different cells (L). A hemorrhagic sample (M) compared with a sample with adequate tumor tissue (N). A sample with mostly mucinous material and few tumor cells (O) compared with another sample with a regular amount of tumor cells (P).
With respect to the site of the biopsy, the liver had the most samples excluded (19 of 123, 15.45%), followed by soft tissues (17 of 123, 13.82%) and the abdominal region (15 of 123, 12.20%). The remaining excluded samples came from a wide range of anatomic locations, such as the breast, cervix, gastrointestinal tract, lung, and lymph node, and none of these sites alone accounted for more than 10% of the total excluded samples (Table 3). It was possible to identify differences in the causes of exclusion in the context of the biopsy location. For example, liver biopsies were excluded more frequently due to fibrotic areas without inflammation, whereas soft tissue samples were excluded more frequently for having few or no MCs (Figure 5).
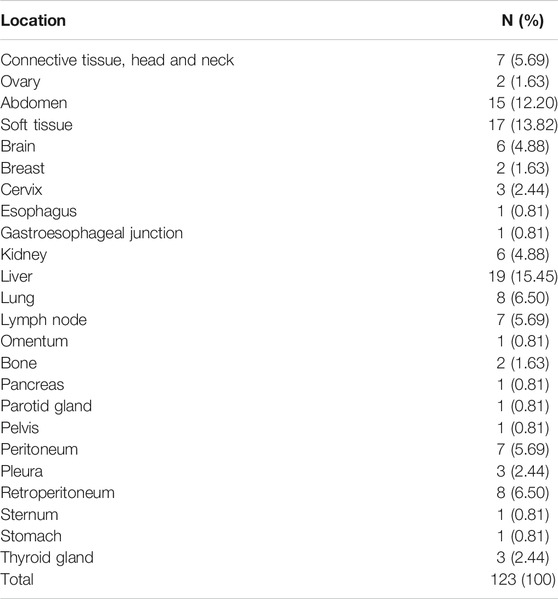
TABLE 3. Location of excluded core needle biopsies.
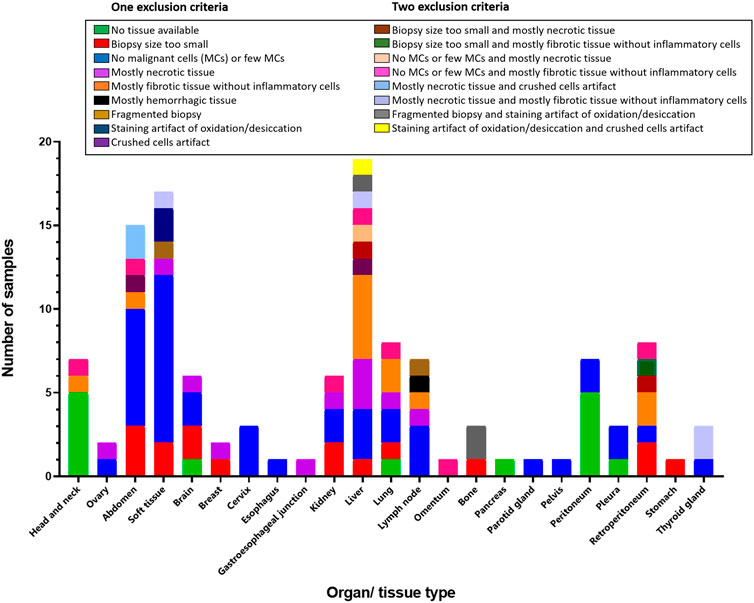
FIGURE 5. Bar graph showing localization and exclusion criteria of the samples. Inset box containing the exclusion criteria divided in one or two criteria.
This study shows that different characteristics of core needle biopsies can impede digital image analysis, and PQC specific to digital image analysis can help guarantee high-quality and reproducible data. In this study, we observed that sample size, tumor content, percentage of necrosis, and percentage of fibrosis are important in quality control of physical and scanned H&E slides as well as scanned mIF slides. We also showed that a systematic PQC assessment of core needle biopsies is important to maintain the quality of the biopsies for image analysis.
According to our study, tissue size and tumor content were the most challenging and important characteristics for determining which samples could undergo digital image analysis to study the phenotypes expressed by the tumor immune microenvironment and MCs. We showed that 34.15% of the samples were excluded owing to the absence of MCs or low tumor content, and 13.01% of the samples were excluded owing to small sample size. These excluded samples had a median size of 1.25 x 1 mm. Similar to a previous study in which the most important exclusion criteria was the absence of MCs, 44% of the biopsy specimens evaluated in this study contained less than 25% viable MCs (Pisano et al., 2001). As we expected, in these core needle biopsy samples the most important measure that differentiated excluded and included biopsies was sample length, given that sample widths were determined by the different needle diameters as well as the fixation process.
As previously published (Parra et al., 2020), we noted that a tumor content of at least 10% in a biopsy sample that is at least 2 × 1 mm is enough to perform image analysis; however, we can successfully stain samples as small as 0.5 mm2. The idea that these samples are representative of the entire tumor microenvironment is still controversial due to intratumoral heterogeneity in biomarker expression (Nicoś et al., 2020). Thus, we recommend an area of analysis at least 1 mm2 to obtain reliable data from this type of sample, but this minimum area will vary depending on the tumor content of the sample (Padmanabhan et al., 2017). For example, in the literature there are publications that considered samples 10 mm in length to be adequate for the diagnosis of prostate cancer (Cicione et al., 2012) and 15 mm in length adequate for the diagnosis of liver disease (Palmer et al., 2014). Another study using mIF on pre-treatment biopsies and post-treatment tumor resections of breast carcinoma found that adequate tissue sampling, with at least 15 regions of interest, was necessary to have a strong correlation between the tumor-infiltrating lymphocytes and PD-L1 markers included in an mIF panel and the H&E/PD-L1 clone SP142 clinical assays (Sanchez et al., 2021). However, there are not standardized image analysis PQC protocols to determine the minimum sample size needed for immunoprofiling, and more studies are warranted to address this need. We believe that each sample should be evaluated separately, according to its type (whole section or core needle biopsy) and the study aims.
When comparing baseline and post-treatment biopsies, the median tumor content was 90 vs 20%, respectively. While an adequate tumor presence is required in baseline biopsy samples, fewer MCs or an absence of tumor cells in cases with complete pathological response after treatment is appropriate in post-treatment biopsy samples. Regarding the minimum number of MCs needed to analyze specific marker clones that are expressed by MCs, such as PD-L1, at least 100 MCs are recommended to obtain consistent and reliable data (Tsao et al., 2018; Francisco-Cruz et al., 2020). However, there is not a consensus regarding the minimum number of MCs needed for image analysis of different markers expressed by MCs. According to our experience, we believe that a minimum of 100 MCs is needed to consider a sample as representative for digital image analysis. If the sample has fewer than 100 MCs, then we consider it to be inadequate to perform image analysis to study markers expressed by those cells. It is important to consider that when performing immune profiling for longitudinal studies, we work not only with baseline biopsies that need to contain enough MCs but also with post-treatment biopsies that many times lack enough MCs because of the effects of treatment. In these cases and when the study is not related to a specific marker expressed by MCs, exclusion of the sample shoud also be based on criteria other than the number of MCs, including the proportion of inflammatory cells, especially T-cells that play an important role in the tumor immune response, and other components such as fibrosis, edema, or necrosis (Hellmann et al., 2014).
The presence of inflammation in the tumor and stroma compartment is required when the aim of the study is to quantify the immune microenvironment (Parra et al., 2020). However, there is a lack of consensus on the areas that adequately show the inflammatory microenvironment. Thus, the pathologist must subjectively define an adequate area. After the mIF slides are scanned, the pathologist should always try to select the entire tumor area in the sample. However, they must capture at least 1 mm2 of the regions of interest (Parra et al., 2020) to obtain reliable data
In our daily routine, we always look for characteristics such as inflammatory cells forming aggregates, as tertiary lymphoid structures (Sautès-Fridman et al., 2019) or in a diffuse distribution, as these can direct the analysis toward a reliable minimum quantity of cell phenotypes to obtain comprehensive data to be correlated with the clinicopathologic component. However, there is not a universal minimum number of cell phenotypes considered to be an adequate representation of the sample, partly because this number depends on the biological characteristics of the tumor and because we are often limited by software, which requires a minimum of five cells expressing a marker per sample to start the image analysis process.
Fibrotic samples without inflammatory cells are another important cause of exclusion. In our cohort, we excluded 9.76% of our samples because of this criterion in both baseline and post-treatment samples. However, we found that our baseline and post-treatment samples had similar fibrotic content (20–25%). Curiously, we found that excluded baseline samples had more fibrotic content than excluded post-treatment samples (90 versus 10%, respectively). As expected, one of the important exclusion factors for post-treatment samples was necrosis, which was often a result of the treatments’ effects on tumors. Although this characteristic is often evaluated as a positive sign of treatment response, it is a limiting factor for digital image analysis (Parra et al., 2020).
Tissue artifact-related sample exclusion was less frequent (1.63%). When the H&E PQC is performed properly, these tissue artifacts could be related to the effects of surgical trauma, tissue ischemia, poor fixation, cutting procedures, or scanning problems (Flamminio et al., 2011). Even subtle artifacts can have large implications for the algorithms used to recognize positive biomarkers, resulting in inaccuracies. For this reason, there have been many attempts to create digital pathology tools for automated PQC (Ameisen et al., 2013; Senaras et al., 2018; Bengtsson and Ranefall, 2019). Software for automated PQC that employs image metrics and identifies H&E scanned slides with gross technical artifacts exists, but it is not suitable for use on mIF-stained slides (Janowczyk et al., 2019).
We also observed that some specific organ site characteristics can interfere with the image analysis and thus are extremely important in digital imaging analysis PQC. The most often excluded biopsy site was the liver, with extensive fibrosis as the most common exclusion criterion. Soft tissue samples were excluded the second most often, mainly for absence of or few MCs. Nevertheless, these high rates of exclusion could be related to the high numbers of liver and soft tissue projects included in our study. Each location or organ has its own technical specifications for obtaining an adequate sample. For example, for breast cancers, some authors have described that the use of the semi-automated needle yielded a 23% rate of inadequate results compared to 9% when using an automated needle to obtain breast samples (Sridharan et al., 2015). Different needle sizes are recommended depending on the organ and its vascularization status to avoid the risk of hemorrhage, especially in liver samples (Hall et al., 2017; Hoang et al., 2018). However, the use of different needle sizes did not to affect the quality of the biopsy of breast tissue (Huang et al., 2017). For these reasons, each specialist must analyze the risks and benefits of the selected biopsy technique and its effect on the quality of samples.
Finally, other tissue characteristics that should be avoided for the mIF analysis but were not found to be exclusion criteria in the current study are the presence of noncellular materials, e.g., glandular secretions; intra-alveolar material, which may contain inflammatory cells and debris; cartilage; bone tissue, in which decalcification may affect tissue staining; and adipose tissue, which can lead to tissue detachment during the staining process (Parra et al., 2021).
In conclusion, PQC for digital image analysis for mIF is extremely important to obtain reliable results. However, consensus and guidelines are necessary to produce reliable data in multi-institutional longitudinal studies. Evaluation of H&E slides at the beginning of any process as well as evaluation of mIF image slides for digital image analysis is fundamental and should consider the study design and material received, including the markers included in the mIF panels.
The raw data supporting the conclusion of this article will be made available by the authors, without undue reservation.
Ethical review and approval was not required for the study on human participants in accordance with the local legislation and institutional requirements. The patients/participants provided their written informed consent to participate in this study.
RL and EP conceived the idea and the theme of this manuscript and developed this manuscript. RL wrote most of this manuscript. FR, CL, and SH contributed to the writing of this manuscript with their expertise on pathology quality control and tissue immune profiling using digital image analysis. EP developed the technology in our laboratory and edited the manuscript according to his experience.
This study was supported in part by the scientific and financial support for the CIMAC-CIDC Network provided through the National Cancer Institute (NCI) Cooperative Agreement U24CA224285 of The University of Texas MD Anderson Cancer Center CIMAC and for the Translational Molecular Pathology Immunoprofiling Platform, as well as by National Institutes of Health/NCI through Cancer Center Support Grant P30CA016672 (Institutional Tissue Bank) and SPORE grant 5P50CA070907-18 from the Cancer Prevention and Research Institute of Texas through MIRA RP160668.
The authors declare that the research was conducted in the absence of any commercial or financial relationships that could be construed as a potential conflict of interest.
All claims expressed in this article are solely those of the authors and do not necessarily represent those of their affiliated organizations, or those of the publisher, the editors and the reviewers. Any product that may be evaluated in this article, or claim that may be made by its manufacturer, is not guaranteed or endorsed by the publisher.
The author acknowledges the Multiplex Immunoflourescence and Digital Pathology Laboratory at Department of Translational Molecular Pathology, The University of Texas MD Anderson Cancer Center who contribute daily to quality multiplex immunoflourescence and IHC processing. We also thank Dawn Chalaire, Associate Director, and Ashli Nguyen-Villarreal, Associate Scientific Editor, in the Research Medical Library at The University of Texas MD Anderson Cancer Center, for editing this article.
Adyanthaya, S., and Jose, M. (2013). Quality and Safety Aspects in Histopathology Laboratory. J. Oral Maxillofac. Pathol. 17 (3), 402–407. doi:10.4103/0973-029X.125207
Ameisen, D., Deroulers, C., Perrier, V., Yunès, J.-B., Bouhidel, F., Battistella, M., et al. (2013). Stack or Trash? Quality Assessment of Virtual Slides. Diagn. Pathol. 8 (Suppl. 1), S23. doi:10.1186/1746-1596-8-s1-s23
Bengtsson, E., and Ranefall, P. (2019). Image Analysis in Digital Pathology: Combining Automated Assessment of Ki67 Staining Quality with Calculation of Ki67 Cell Proliferation Index. Cytometry 95 (7), 714–716. doi:10.1002/cyto.a.23685
Cicione, A., Cantiello, F., De Nunzio, C., Tubaro, A., and Damiano, R. (2012). Prostate Biopsy Quality Is Independent of Needle Size: A Randomized Single-Center Prospective Study. Urol. Int. 89 (1), 57–60. doi:10.1159/000339250
Ferry-Galow, K. V., Datta, V., Makhlouf, H. R., Wright, J., Wood, B. J., Levy, E., et al. (2018). What Can Be Done to Improve Research Biopsy Quality in Oncology Clinical Trials?. J. Oncol. Pract. 14, JOP1800092. doi:10.1200/JOP.18.00092
Ferry-Galow, K. V., Makhlouf, H. R., Wilsker, D. F., Lawrence, S. M., Pfister, T. D., Marrero, A. M., et al. (2016). The Root Causes of Pharmacodynamic Assay Failure. Semin. Oncol. 43 (4), 484–491. doi:10.1053/j.seminoncol.2016.06.006
Flamminio, F., Tosi, A. L., and Fellegara, G. (2011). Crushing Artifacts Resulting in Small Blue Cellular Clusters that Simulate Small Cell Carcinoma. Int. J. Surg. Pathol. 19 (4), 487–491. doi:10.1177/1066896911411187
Francisco-Cruz, A., Parra, E. R., Tetzlaff, M. T., and Wistuba, (2020). Multiplex Immunofluorescence Assays. Methods Mol. Biol. 2055, 467–495. doi:10.1007/978-1-4939-9773-2_22
Greig, B. (2019). Quality Control of Immunophenotyping. Methods Mol. Biol. 2032, 227–279. doi:10.1007/978-1-4939-9650-6_14
Hall, T. C., Deakin, C., Atwal, G. S., and Singh, R. K. (2017). Adequacy of Percutaneous Non-Targeted Liver Biopsy Under Real-Time Ultrasound Guidance when Comparing the Biopince and Achieve Biopsy Needle. Br. J. Radiol. 90 (1080), 20170397. doi:10.1259/bjr.20170397
Hellmann, M. D., Chaft, J. E., William, W. N., Rusch, V., Pisters, K. M. W., Kalhor, N., et al. (2014). Pathological Response after Neoadjuvant Chemotherapy in Resectable Non-Small-Cell Lung Cancers: Proposal for the Use of Major Pathological Response as a Surrogate Endpoint. Lancet Oncol. 15 (1), e42–e50. doi:10.1016/s1470-2045(13)70334-6
Hoang, N. S., Ge, B. H., Pan, L. Y., Ozawa, M. G., Kong, C. S., Louie, J. D., et al. (2018). Determining the Optimal Number of Core Needle Biopsy Passes for Molecular Diagnostics. Cardiovasc. Intervent Radiol. 41 (3), 489–495. doi:10.1007/s00270-017-1861-4
Huang, M. L., Hess, K., Candelaria, R. P., Eghtedari, M., Adrada, B. E., Sneige, N., et al. (2017). Comparison of the Accuracy of US-Guided Biopsy of Breast Masses Performed with 14-gauge, 16-gauge and 18-gauge Automated Cutting Needle Biopsy Devices, and Review of the Literature. Eur. Radiol. 27 (7), 2928–2933. doi:10.1007/s00330-016-4651-5
Janowczyk, A., Zuo, R., Gilmore, H., Feldman, M., and Madabhushi, A. (2019). HistoQC: An Open-Source Quality Control Tool for Digital Pathology Slides. JCO Clin. Cancer Inform. 3, 1–7. doi:10.1200/cci.18.00157
Mangino, J. (2006). IPCC Good Practice Guidance and Uncertainty Management in National Greenhouse Gas Inventories. Simon Eggelston LB, Kyoko Miwa, Todd Ngara, Kiyoto Tanabe. Tokyo, Japan: Intergovernmental Panel on Climate Change (IPCC) by the Institute for Global Environmental Strategies.
Nicoś, M., Krawczyk, P., Crosetto, N., and Milanowski, J. (2020). The Role of Intratumor Heterogeneity in the Response of Metastatic Non-Small Cell Lung Cancer to Immune Checkpoint Inhibitors. Front. Oncol. 10, 569202. doi:10.3389/fonc.2020.569202
Padmanabhan, V., Steinmetz, H. B., Rizzo, E. J., Erskine, A. J., Fairbank, T. L., de Abreu, F. B., et al. (2017). Improving Adequacy of Small Biopsy and Fine-Needle Aspiration Specimens for Molecular Testing by Next-Generation Sequencing in Patients with Lung Cancer: A Quality Improvement Study at Dartmouth-Hitchcock Medical Center. Arch. Pathol. Lab. Med. 141 (3), 402–409. doi:10.5858/arpa.2016-0096-oa
Palmer, T., Georgiades, I., Treanor, D., Wright, A., Shah, M., Khosla, R., et al. (2014). Improved Tissue Sections for Medical Liver Biopsies: A Comparison of 16 vs 18 G Biopsy needles Using Digital Pathology. J. Clin. Pathol. 67 (5), 415–419. doi:10.1136/jclinpath-2013-201954
Parchment, R. E., and Doroshow, J. H. (2016). Theory and Practice of Clinical Pharmacodynamics in Oncology Drug Development. Semin. Oncol. 43 (4), 427–435. doi:10.1053/j.seminoncol.2016.07.001
Parra, E. R., Ferrufino-Schmidt, M. C., Tamegnon, A., Zhang, J., Solis, L., Jiang, M., et al. (2021). Immuno-profiling and Cellular Spatial Analysis Using Five Immune Oncology Multiplex Immunofluorescence Panels for Paraffin Tumor Tissue. Sci. Rep. 11 (1), 8511. doi:10.1038/s41598-021-88156-0
Parra, E. R., Jiang, M., Solis, L., Mino, B., Laberiano, C., Hernandez, S., et al. (2020). Procedural Requirements and Recommendations for Multiplex Immunofluorescence Tyramide Signal Amplification Assays to Support Translational Oncology Studies. Cancers (Basel). 12 (2), 255. doi:10.3390/cancers12020255
Pisano, E. D., Fajardo, L. L., Caudry, D. J., Sneige, N., Frable, W. J., Berg, W. A., et al. (2001). Fine-Needle Aspiration Biopsy of Nonpalpable Breast Lesions in a Multicenter Clinical Trial: Results from the Radiologic Diagnostic Oncology Group V. Radiology 219 (3), 785–792. doi:10.1148/radiology.219.3.r01jn28785
Sanchez, K., Kim, I., Chun, B., Pucilowska, J., Redmond, W. L., Urba, W. J., et al. (2021). Multiplex Immunofluorescence to Measure Dynamic Changes in Tumor-Infiltrating Lymphocytes and PD-L1 in Early-Stage Breast Cancer. Breast Cancer Res. 23 (1), 2. doi:10.1186/s13058-020-01378-4
Sautès-Fridman, C., Petitprez, F., Calderaro, J., and Fridman, W. H. (2019). Tertiary Lymphoid Structures in the Era of Cancer Immunotherapy. Nat. Rev. Cancer 19 (6), 307–325. doi:10.1038/s41568-019-0144-6
Senaras, C., Niazi, M. K. K., Lozanski, G., and Gurcan, M. N. (2018). DeepFocus: Detection of Out-Of-Focus Regions in Whole Slide Digital Images Using Deep Learning. PLoS One 13 (10), e0205387. doi:10.1371/journal.pone.0205387
Sridharan, R., Yunos, S. M., Aziz, S., Hussain, R. I., Alhabshi, S. M., Suria Hayati, M. P., et al. (2015). Comparison on the Use of Semi-Automated and Automated Core Biopsy Needle in Ultrasound Guided Breast Biopsy. Med. J. Malaysia 70, 326–333.
Keywords: digital image analysis, biopsy, quality control, pathology, multiplex immunofluorescence
Citation: Lazcano R, Rojas F, Laberiano C, Hernandez S and Parra ER (2021) Pathology Quality Control for Multiplex Immunofluorescence and Image Analysis Assessment in Longitudinal Studies. Front. Mol. Biosci. 8:661222. doi: 10.3389/fmolb.2021.661222
Received: 30 January 2021; Accepted: 19 July 2021;
Published: 30 July 2021.
Edited by:
Joe Yeong, Institute of Molecular and Cell Biology (A∗STAR), SingaporeReviewed by:
Lixue Cao, Guangdong Provincial People's Hospital, ChinaCopyright © 2021 Lazcano, Rojas, Laberiano, Hernandez and Parra. This is an open-access article distributed under the terms of the Creative Commons Attribution License (CC BY). The use, distribution or reproduction in other forums is permitted, provided the original author(s) and the copyright owner(s) are credited and that the original publication in this journal is cited, in accordance with accepted academic practice. No use, distribution or reproduction is permitted which does not comply with these terms.
*Correspondence: Edwin Roger Parra, ZXJwYXJyYUBtZGFuZGVyc29uLm9yZw==
Disclaimer: All claims expressed in this article are solely those of the authors and do not necessarily represent those of their affiliated organizations, or those of the publisher, the editors and the reviewers. Any product that may be evaluated in this article or claim that may be made by its manufacturer is not guaranteed or endorsed by the publisher.
Research integrity at Frontiers
Learn more about the work of our research integrity team to safeguard the quality of each article we publish.