
95% of researchers rate our articles as excellent or good
Learn more about the work of our research integrity team to safeguard the quality of each article we publish.
Find out more
ORIGINAL RESEARCH article
Front. Mol. Biosci. , 19 May 2021
Sec. Cellular Biochemistry
Volume 8 - 2021 | https://doi.org/10.3389/fmolb.2021.659058
This article is part of the Research Topic Crosstalk Between Membrane Lipid Metabolism and Bacterial Cell Envelope Homeostasis View all 10 articles
 Branden S. J. Gregorchuk1
 Shelby L. Reimer1Kari A. C. Green1Nicola H. Cartwright1
 Daniel R. Beniac2
 Shannon L. Hiebert2
 Timothy F. Booth1,2
 Patrick M. Chong2
 Garrett R. Westmacott2
 George G. Zhanel1
 Denice C. Bay1*
Chlorhexidine (CHX) is an essential medicine used as a topical antiseptic in skin and oral healthcare treatments. The widespread use of CHX has increased concerns regarding the development of antiseptic resistance in Enterobacteria and its potential impact on cross-resistance to other antimicrobials. Similar to other cationic antiseptics, resistance to CHX is believed to be driven by three membrane-based mechanisms: lipid synthesis/transport, altered porin expression, and increased efflux pump activity; however, specific gene and protein alterations associated with CHX resistance remain unclear. Here, we adapted Escherichia coli K-12 BW25113 to increasing concentrations of CHX to determine what phenotypic, morphological, genomic, transcriptomic, and proteomic changes occurred. We found that CHX-adapted E. coli isolates possessed no cross-resistance to any other antimicrobials we tested. Scanning electron microscopy imaging revealed that CHX adaptation significantly altered mean cell widths and lengths. Proteomic analyses identified changes in the abundance of porin OmpF, lipid synthesis/transporter MlaA, and efflux pump MdfA. Proteomic and transcriptomic analyses identified that CHX adaptation altered E. coli transcripts and proteins controlling acid resistance (gadE, cdaR) and antimicrobial stress-inducible pathways Mar-Sox-Rob, stringent response systems. Whole genome sequencing analyses revealed that all CHX-resistant isolates had single nucleotide variants in the retrograde lipid transporter gene mlaA as well as the yghQ gene associated with lipid A transport and synthesis. CHX resistant phenotypes were reversible only when complemented with a functional copy of the mlaA gene. Our results highlight the importance of retrograde phospholipid transport and stress response systems in CHX resistance and the consequences of prolonged CHX exposure.
Chlorhexidine (CHX) is a commonly used antiseptic and disinfectant in medical, dental, and veterinary practice and it is listed as an essential medicine by the World Health Organization (World Health Organization, 2019). CHX is the active antimicrobial ingredient used in a variety of clinical antiseptics (skin, oral, and eye washes) and daily use products (cosmetics and personal hygiene products), making CHX usage widespread. This antiseptic is a membrane-active bisbiguanide compound that consists of two cationic biguanidine moieties linked by a hexamethyl acyl-chain region (Nayyar, 2015). Similar to other hydrophobic cationic antiseptics, CHX kills and/or inhibits cell growth in a concentration dependent manner by disrupting cell membrane phospholipids by displacing divalent cations at the anionic cell membrane surface (Gilbert and Moore, 2005; Nayyar, 2015). Specifically, CHX acts by inserting itself in between phospholipid headgroup pairs gradually destabilizing cell membrane integrity by forming gaps in the phospholipid membrane bilayer that result in cell content leakage and death (Gilbert and Moore, 2005). Although bacterial resistance to CHX has not been convincingly shown at its working concentrations, Gram-negative bacterial resistance to CHX is becoming a growing concern. There are increasing reports of CHX-resistant Enterobacterales (Kampf, 2016, 2018; Cieplik et al., 2019), where CHX-resistant pathogens, Klebsiella spp. and Salmonella spp., have demonstrated cross-resistance to antibiotics, most notably the last-line polymyxin antibiotic colistin (Wand et al., 2017; Hashemi et al., 2019; Verspecht et al., 2019). Increasing resistance as well as possible antibiotic cross-resistance is very concerning given CHX’s clinical importance as a medical antiseptic and, in some cases, as a last-line debridement treatment (Brookes et al., 2020). This highlights an important knowledge gap to address regarding how intrinsic CHX mechanisms of resistance develop, especially among antimicrobial resistant species deemed to be critical priority pathogens. Unfortunately, there are no clinically defined CHX breakpoint concentrations to distinguish resistant from susceptible CHX concentrations according to the Clinical Laboratory Standards Institute (CLSI1) or European Committee on Antimicrobial Susceptibility Testing (EUCAST2). Despite the absence of defined CHX breakpoints, we will refer to reduced CHX susceptibility as “resistant” rather than “tolerant” herein based on minimum inhibitory concentration values defined for antiseptics and antibiotics (Cerf et al., 2010; Brauner et al., 2016).
Previous studies have attempted to identify CHX-resistance’s mechanisms of action using clinical isolates (Condell et al., 2012; Naparstek et al., 2012; Fernández-Cuenca et al., 2015; Vali et al., 2015) or laboratory adapted bacteria/isolates that were gradually exposed to increasing concentrations of CHX over numerous sub-cultures (Braoudaki and Hilton, 2004; Wand et al., 2017; Verspecht et al., 2019). These approaches have identified the involvement of intrinsically expressed or acquired efflux pumps, such as KpnEF (Abuzaid et al., 2012), CepA (Fang et al., 2002), SmvA (Wand et al., 2017), and AceI (Hassan et al., 2015) as CHX resistance mechanisms. However, based on the membrane disruptive mechanism of action by CHX and its frequent co-association with colistin resistance, there may be other overlapping membrane-specific mechanisms contributing to intrinsic CHX resistance such as lipopolysaccharide (LPS) transcriptional regulators PmrD and PhoPQ as previously identified (Wand et al., 2017). With respect to known colistin resistance mechanisms, many of these regulators are known contributors of LPS alterations that promote colistin resistance (Olaitan et al., 2014).
In this study, we performed an in-depth phenotypic and molecular analysis to identify intrinsic CHX resistance mechanisms using Escherichia coli K-12 BW25113 adapted to CHX. We selected this antimicrobial susceptible strain based on its well-established collection of single gene deletions known as the Keio collection (Baba et al., 2006) and gene clone ASKA library collection (Kitagawa et al., 2005). In our study, we gradually adapted E. coli BW25113 to CHX over 20 subcultures. We characterized these CHX-adapted E. coli isolates for their phenotypic alterations using antimicrobial susceptibility testing (AST) methods to determine antimicrobial cross-resistance, changes in fitness using optical growth curve experiments, scanning electron microscopy (SEM) to identify any cell morphology changes, and a recently published membrane integrity assay to detect membrane alterations. We also conducted in-depth multi-omics analyses of these isolates using whole genome sequencing (WGS), liquid chromatography tandem mass spectrometry (LC-MS/MS) proteomics techniques, and RNA-seq transcriptomic analyses. This combined “omics” approach identified single nucleotide variants (SNVs) in genes in CHX-adapted isolates as well as their associated proteomic and transcript alterations caused by prolonged CHX exposure. Genes with SNVs identified from this analysis potentially contributing to CHX resistance were also examined for their ability to phenotypically complement CHX-adapted and un-adapted isolates using ASKA plasmid library gene clones and in-frame single gene deletions in BW25113. This in-depth multi-omics study revealed the involvement of the outer membrane lipoprotein MlaA, which is a component of the retrograde phospholipid transport Mla system, that serves as an intrinsic CHX resistance contributor. We also identified alterations of other stress response pathways often involving acid regulation. Our analyses show that phospholipid removal is an important mechanism contributing to CHX resistance.
To initiate this study, we first performed a CHX-adaptation experiment of E. coli K-12 BW25113 using the gradual antiseptic adaptation approach described in a previous study (Bore et al., 2007). As described in this method, we repeatedly sub-cultured BW25113 (in biological triplicate) in Luria-Bertani (LB) broth containing gradually increasing concentrations of CHX-, starting at a sub-inhibitory CHX concentration 0.4 μg/mL, and the cultures that had most turbid growth were sub-cultured repeatedly into fresh media with increasing stepwise CHX concentrations (Supplementary Table 1). After 20 sub-cultures (20 days) with increasing CHX concentrations, we generated three gradually adapted CHX-resistant isolates (CHXR1-3) capable of growing in the presence of 2.4 μg/mL CHX, which was above the minimum inhibitory concentration (MIC) value for the susceptible un-adapted wild-type BW25113 control (WT; Table 1). Using the broth microdilution AST method, we determined the MIC values of each CHX-resistant isolate to CHX as well as its susceptibility to other representative antimicrobials (Table 2). AST results demonstrated that all three CHX-resistant isolates were only resistant to CHX at 2- to 4-fold higher concentrations when compared to the un-adapted WT (Table 2). Surprisingly, all three CHX-adapted isolates had no increase in resistance to the bisbiguanide antiseptic alexidine (ALX), indicating that our adaptation of E. coli to CHX was highly selective and did not confer cross-resistance to another commonly used bisbiguanide antiseptic. CHX-adapted isolates were susceptible to all quaternary ammonium compound (QAC) cationic antiseptics we tested based on their MIC values, as well as to all other antibiotics, including colistin (Table 2). It is notable that CHX-adapted isolates were more susceptible to QACs cetyldimethylethylammonium bromide (CDAB) and cetytrimethylammonium bromide (CTAB) and to the aminoglycoside antibiotic tobramycin when compared to the WT (Table 2). Together, our MIC data indicates that the CHX-adapted E. coli we generated had no significant antiseptic cross-resistance or antibiotic cross-resistance in this study. This AST result outcome permitted us to study these isolates in more depth to determine CHX-resistant phenotypes only.
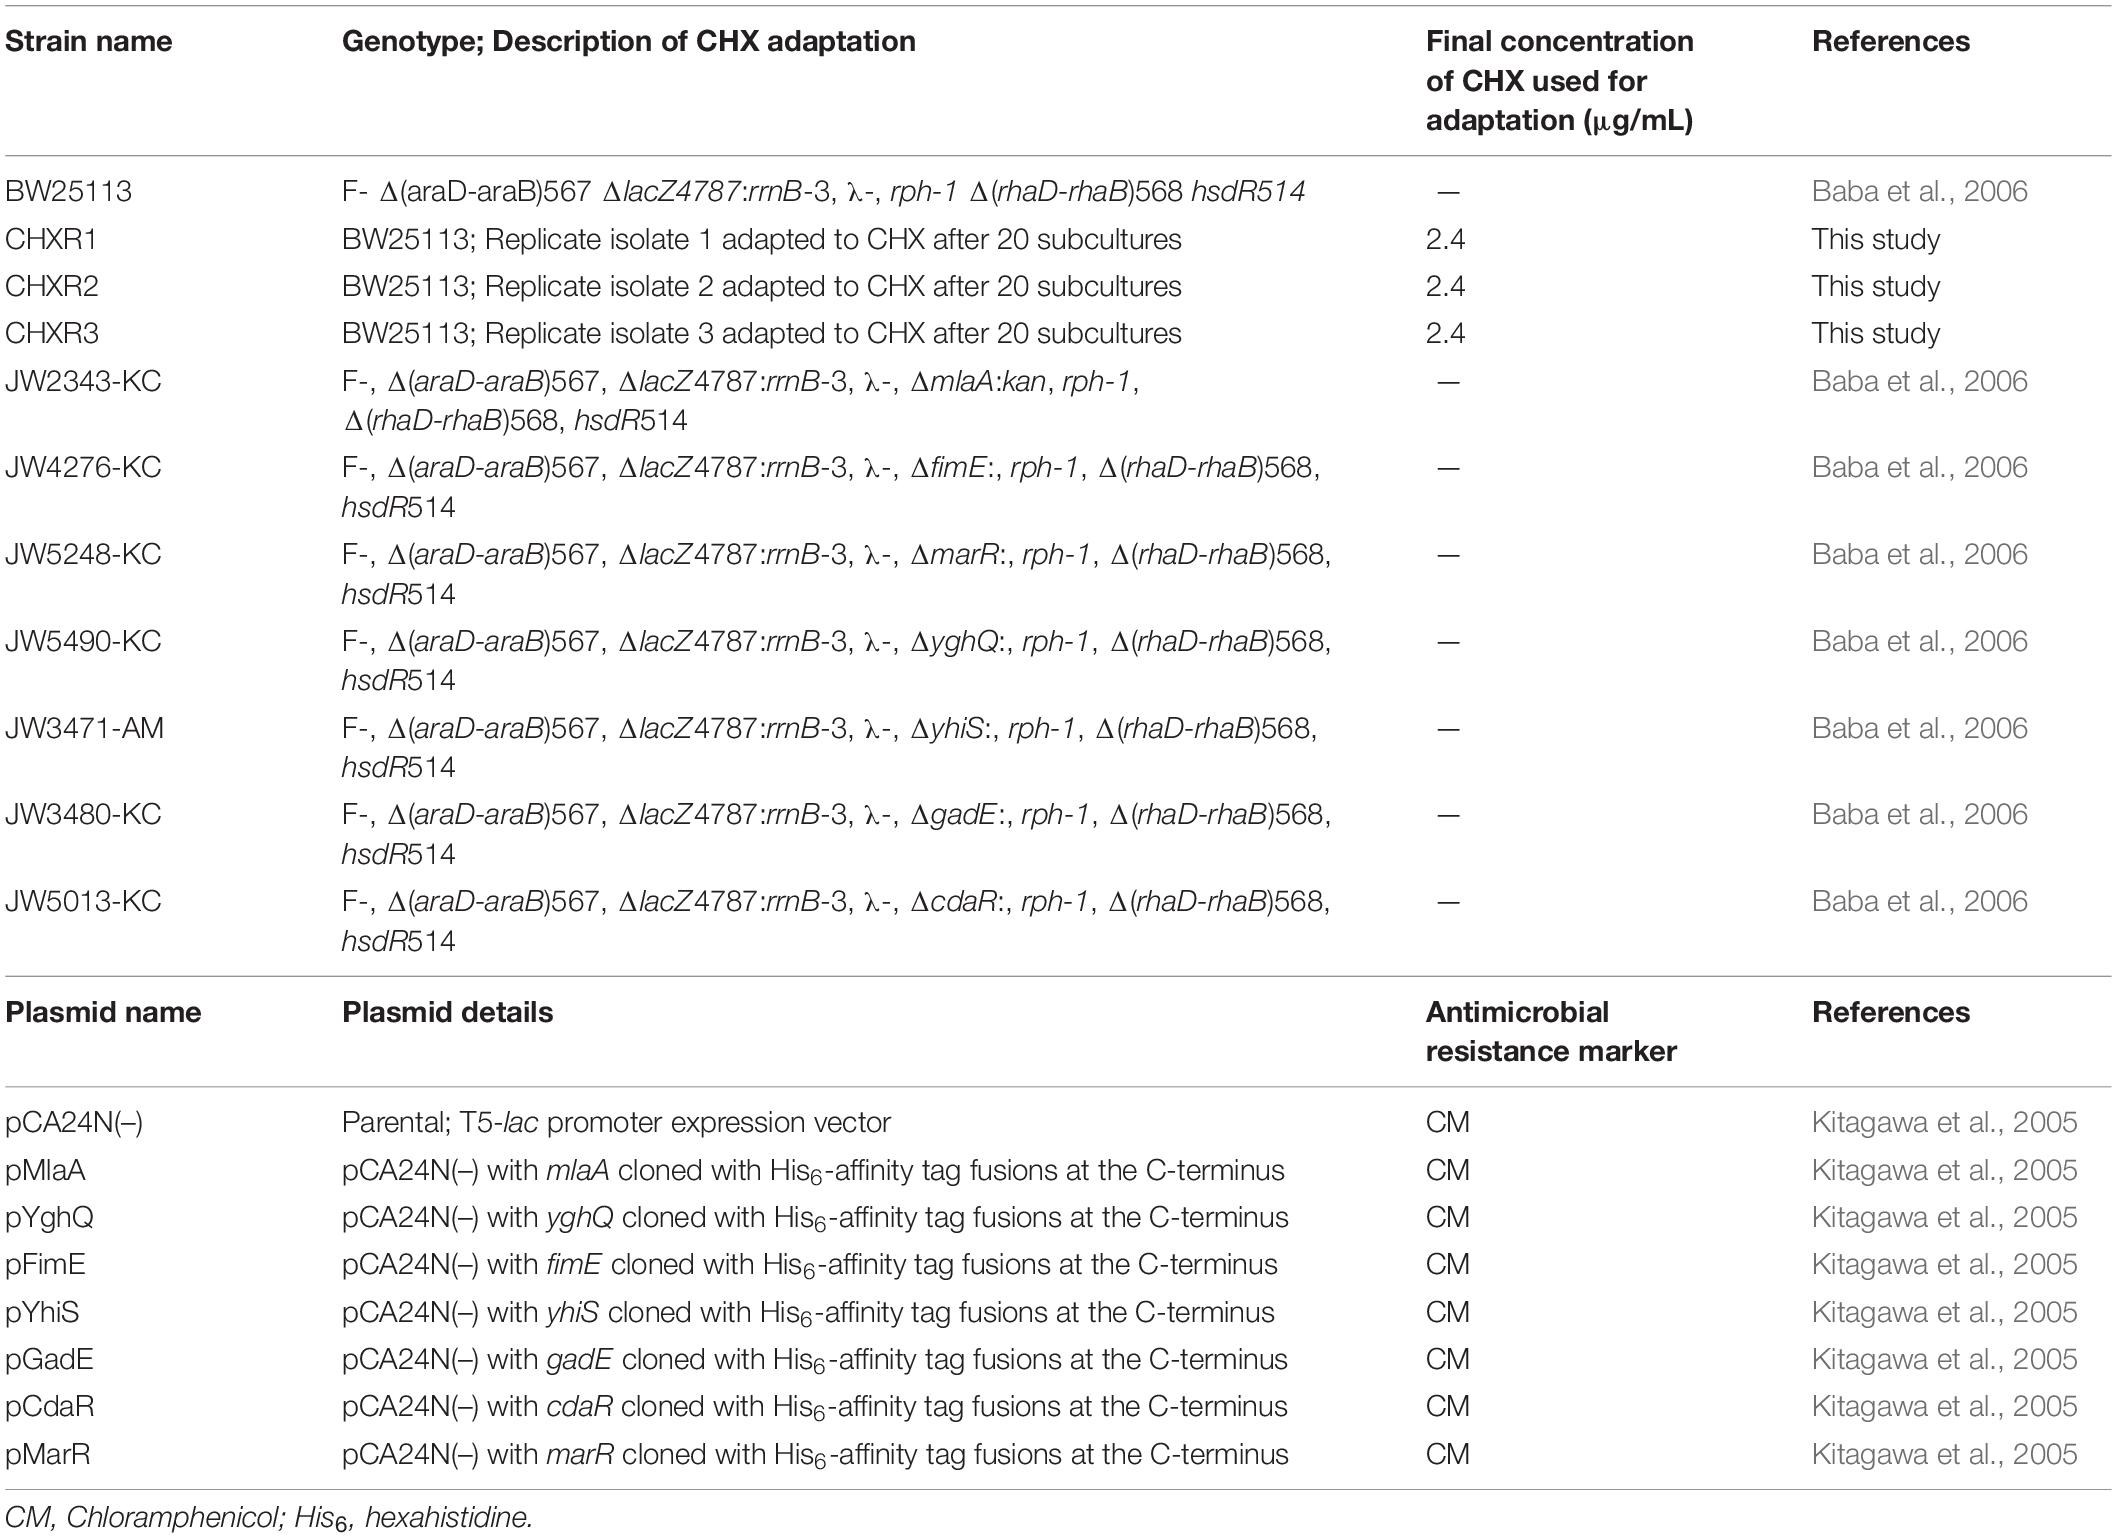
Table 1. Bacterial E. coli strains and plasmids used or generated in this study.
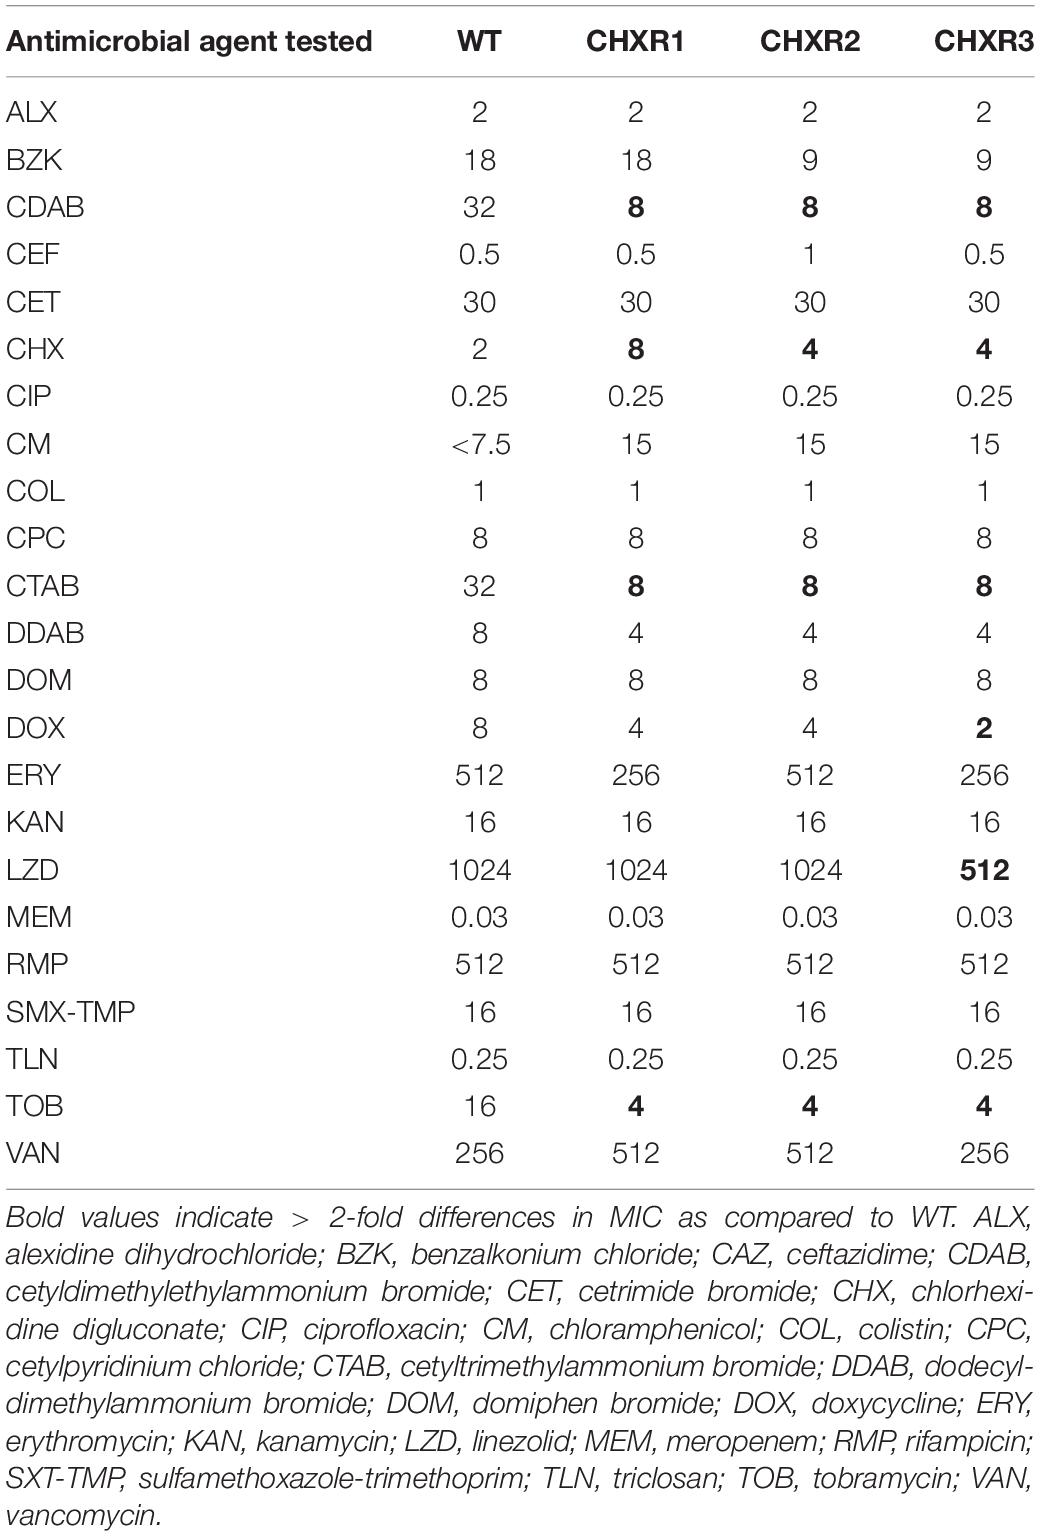
Table 2. A summary of AST MIC values using broth microdilution for each CHX-adapted E. coli isolate in this study.
We examined all three CHX-resistant isolates for their CHX phenotypic stability to determine how long these isolates maintained CHX resistance after repeated growth without CHX exposure. This experiment has been performed in previous gradual antiseptic laboratory-based adaptation studies (Gadea et al., 2016, 2017) and verified that CHX phenotypes are stable prior to our multi-omics analyses. To confirm that each CHX-adapted isolate had a stable CHX-resistant phenotype, we sub-cultured each isolate in LB broth without CHX over a 10-day experiment, where we performed CHX AST daily to determine any MIC value changes (Table 3). This CHX phenotype stability testing outcome indicated that there was no significant change in MIC values over the course of 9 days for all three CHXR isolates (Table 3). However, CHXR2 and CHXR3 did show a 2-fold reduction in MIC values on day 10 when compared to MIC values from Days 1–9 (Table 3), though these isolates were still 2-fold more resistant to CHX than the WT. CHXR1 showed the greatest CHX phenotypic stability without CHX selection over the 10-day period, where it occasionally showed higher resistance to CHX (Days 3, 4, and 9; Table 3), suggesting CHX resistance fluctuated within a 2-fold range. Based on this outcome, we selected CHXR1 isolates for further in-depth proteomic and transcriptomic analyses as discussed in further sections.
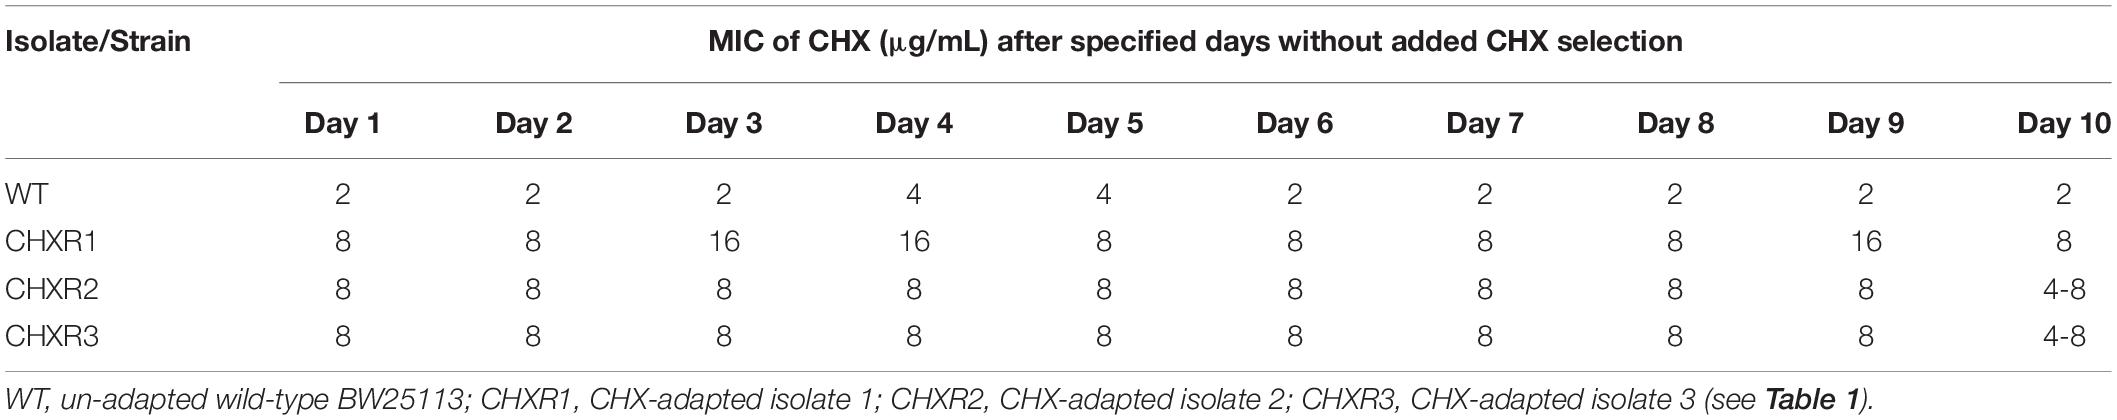
Table 3. A summary of MIC values determined for each CHX-adapted isolate after 1–10 days of growth without CHX selection in LB growth medium.
The growth phenotypes of each CHX-adapted isolate were also compared to the un-adapted WT using broth optical density (600 nm) growth curve experiments. We compared CHX-adapted isolate growth in various rich media, LB, LB + 0.4% w/v glucose (LB + Glc), Mueller Hinton broth (MHB), and tryptic soy broth (TSB) as well as minimal media, minimal 9 salts (M9), and Davis Glucose (DG). All growth experiments were performed with and without added CHX (at a final 0.4 μg/mL concentration) over a 24 h period at 37°C. Growth curve results helped assess if there were any significant growth delays or reductions for CHXR isolates in specific media and used to identify any changes in the overall fitness of the isolates from lag to stationary phase. To verify final OD values, final colony-forming units/mL (CFU/mL) were determined for diluted (10–6 and 10–7) 24 h cultures from plated LB agar colonies grown at 37°C. When CHX-adapted isolates were grown without CHX selection in various rich media their final OD600 nm values were significantly differed from the WT growth over 24 h in LB, MHB, and TSB (P-values of < 0.05) but not LB + Glc (Figures 1A–D, Supplementary Figure 1, and Supplementary Table 2) and grew similar to or slower than WT by 11.6–22.8% differences (Supplementary Table 3). In LB medium, independent of CHX, CHXR isolates reached significantly higher stationary phase OD600 nm values after 5 h, ranging from 1.21 OD600nm (±0.07 units error) to 1.37 OD600 nm (±0.12 units error) than the WT (1.09 ± 0.03 to 1.11 ± 0.09; P-values < 0.05) and corresponded to higher CHXR CFU/mL counts (Supplementary Table 3). CHXR isolate growth in all rich media with CHX selection identified significant changes in final OD600 nm values and CFU/mL cell counts when compared to WT under the same conditions in LB, LB + Glc, and MHB (P-values < 0.05) but not TSB (Figures 1A–D, Supplementary Figure 1, and Supplementary Table 2, 3). In rich media with CHX selection, CHXR isolates had similar or slower growth doubling times (6.5–24.1% differences) than the WT (Supplementary Table 3). As LB was the medium used to gradually adapt all E. coli isolates to CHX for this study, these growth differences may reflect the isolate’s adaptation not only to CHX but also the LB medium components specific to LB formulations.
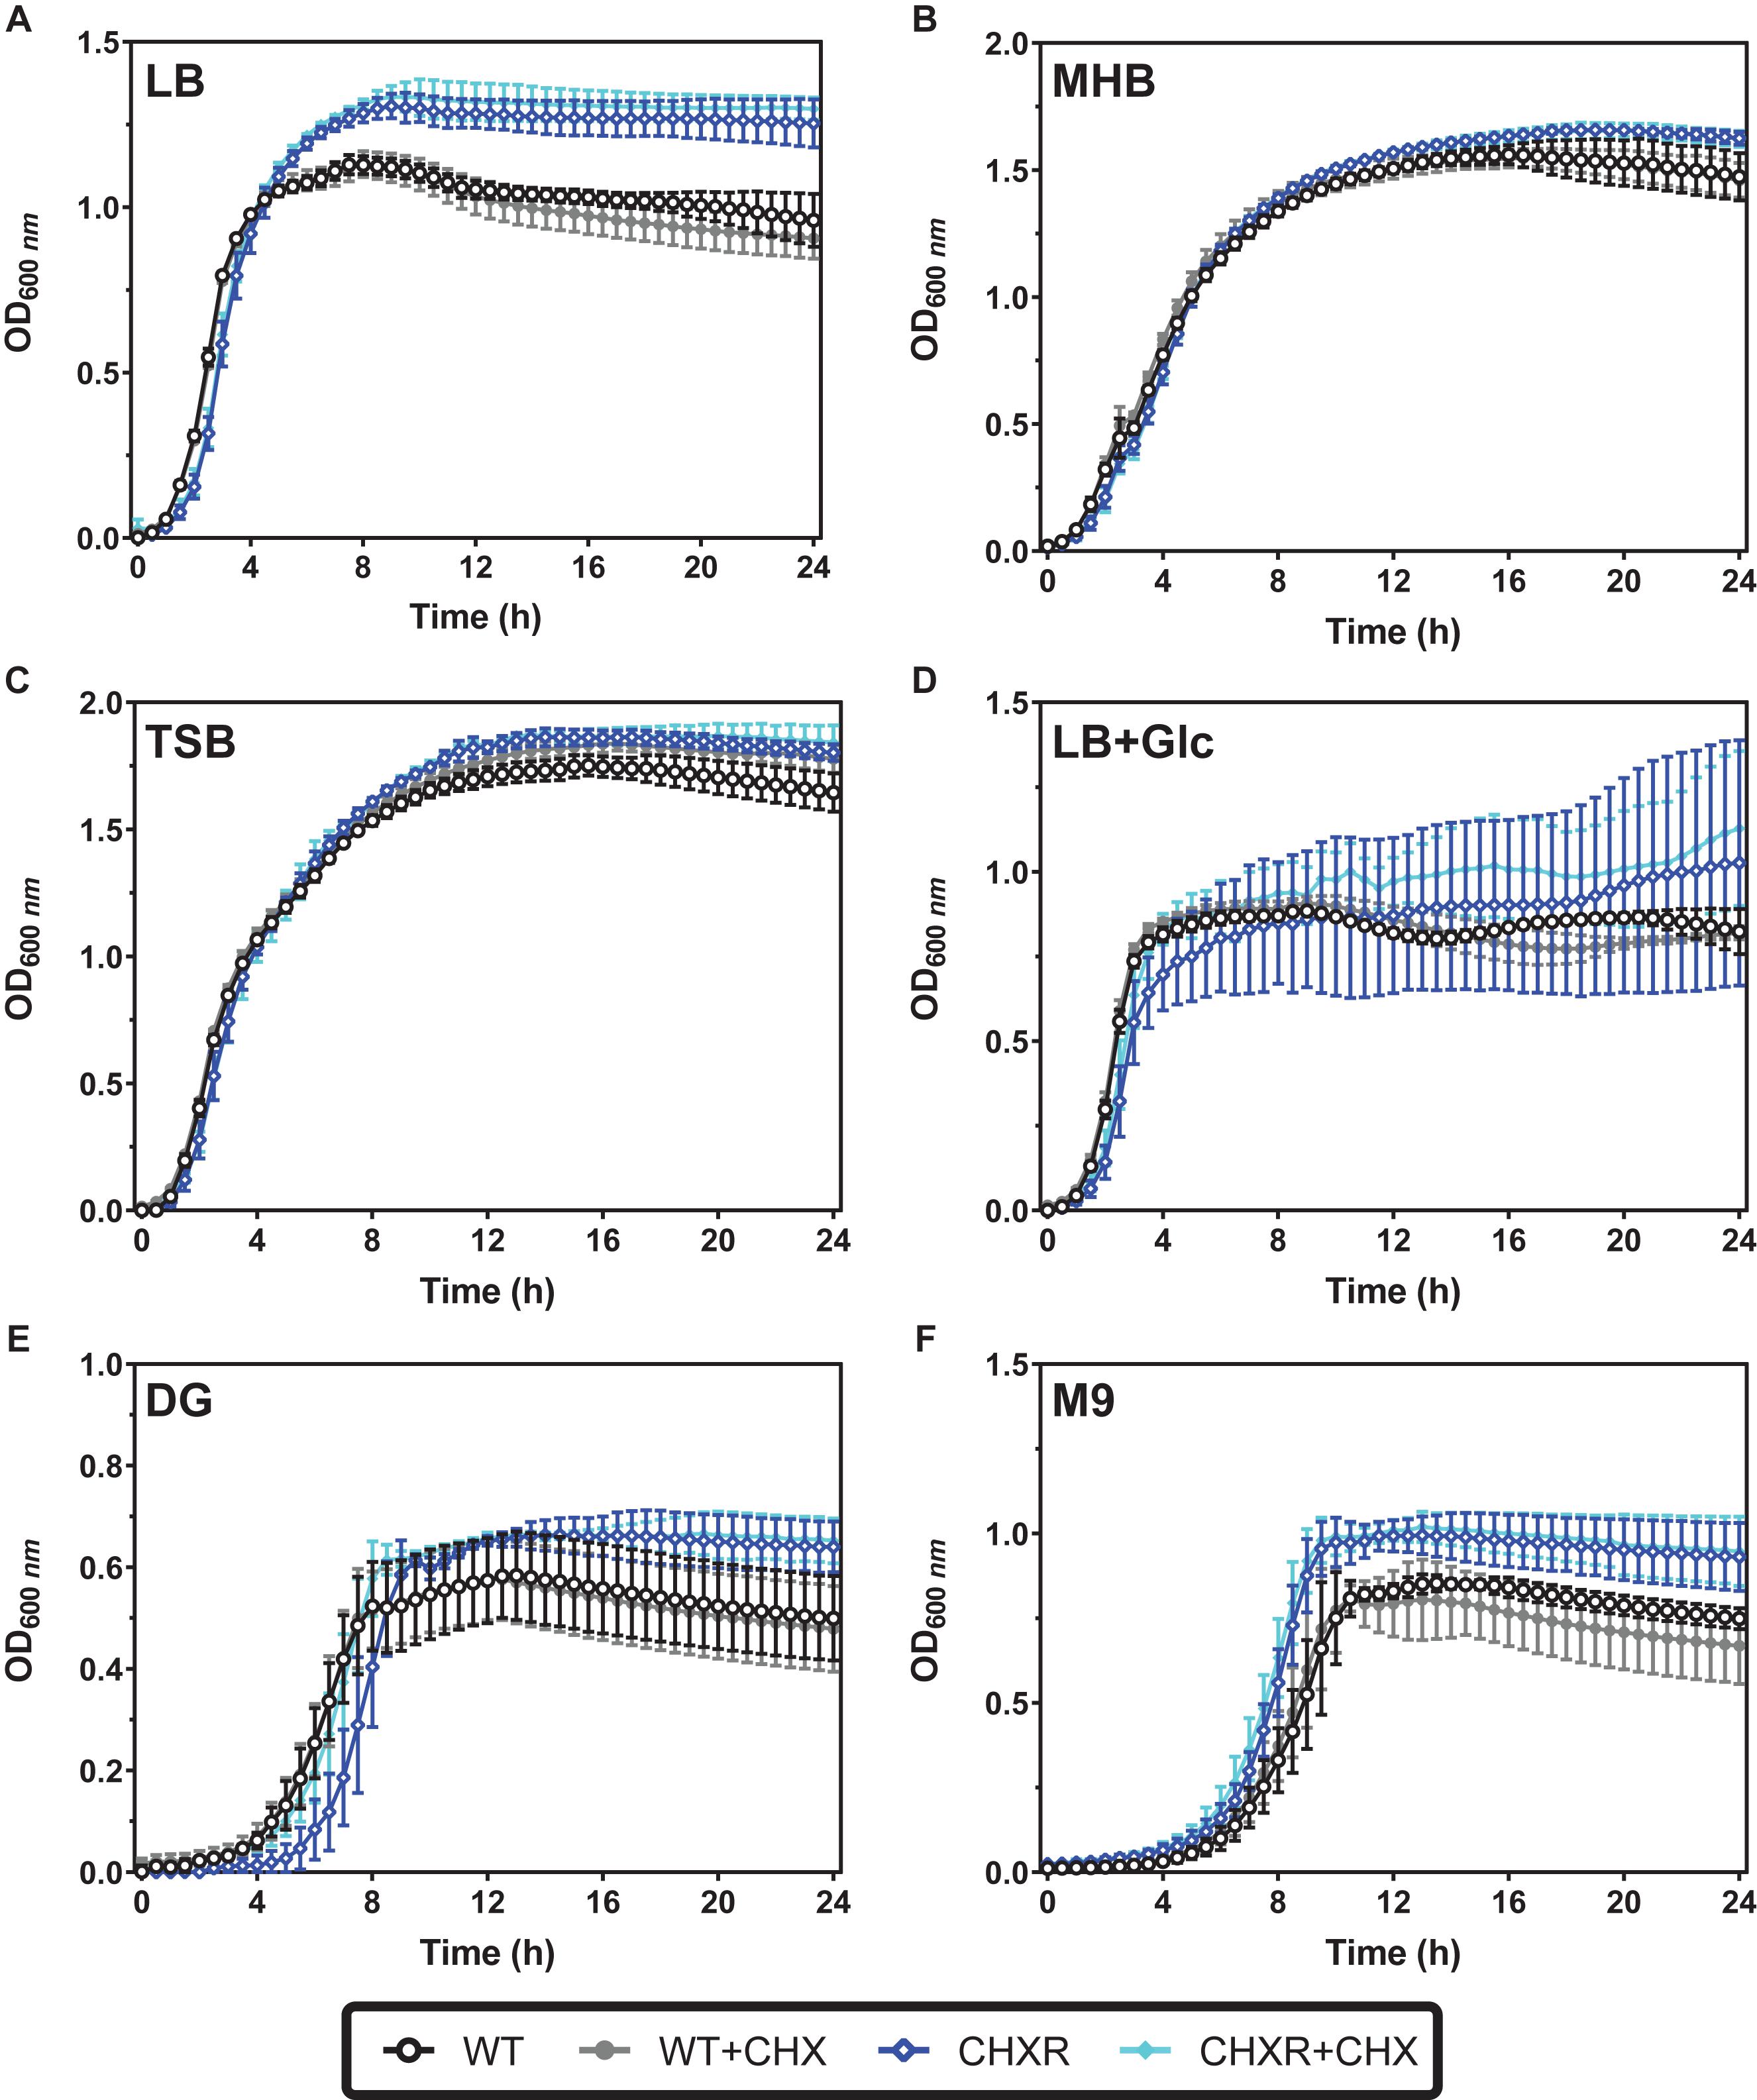
Figure 1. Growth curves of WT and CHXR isolates in rich and minimal media with and without CHX selection. In all panels, growth curves were measured from optical density values at 600 nm (OD600 nm) in 96-well microtiter plates incubated at 37°C with shaking over 24 h. Averaged values from CHXR1-3 isolates and WT measured in biological triplicate are plotted in each panel, and error bars highlight standard deviation of OD600 nm values at each timepoint. In all panels, CHXR isolates are plotted as blue shaded diamonds and WT as circles, where solid filled symbols indicate samples grown in the presence of 0.4 μm/mL CHX final concentration and unfilled symbols indicate media growth without CHX selection. Media with and without CHX addition used to measure the growth of each isolate/strain is shown in each panel: (A) LB, (B) MHB, (C) TSB, (D) LB + 0.4% w/v glucose (LB + Glc), (E) DG, and (F) M9.
Growth curves in either minimal media (DG and M9) we tested, showed lower maximum final OD600 nm values for all CHXR and WT isolates as compared to their growth in rich media after 12 h (CHXR; 0.61–0.75 OD600 nm, WT; 0.52–0.58 OD600 nm), indicating that growth in defined media for all CHXR isolates and WT was reduced (Figures 1E,F, Supplementary Figure 2, and Supplementary Table 3). In minimal media without CHX, final OD600 nm values and CFU/mL values for CHXR isolates compared to WT were only statistically different in M9 (P-value < 0.05) but not in DG medium (Figures 1E,F, Supplementary Figure 2, and Supplementary Tables 2, 3) suggesting these different defined media formulations influenced CHXR growth rates. In M9 without CHX, CHXR isolates had a mean doubling time that was 33.6% slower than WT but in the presence of CHX, CHXR isolates grew 17.0% faster than WT, indicating that CHX enhances CHXR growth rates (Supplementary Table 3). In DG without CHX addition, CHXR isolates grew faster than WT by 27.2% and in the presence of CHX, CHXR isolates had a mean doubling time that was 9.3% faster than WT (Supplementary Table 3). This shows that CHXR growth rates were faster in minimal media with CHX in contrast to the generally slower CHXR isolate growth rates in rich media. In minimal medium without CHX, CHXR isolates had a slightly longer lag phase of 1 h when compared to CHXR grown in the presence of CHX (Figure 1E and Supplementary Figure 2), however, when we compared final OD600 nm and CFU/mL values from CHXR growth curves with and without added CHX, neither was statistically different (Supplementary Tables 2, 3). These findings suggest that prolonged adaptation to CHX measurably alters their growth fitness, where CHXR isolates grew slower than the un-adapted WT in nearly all rich media with and without CHX, whereas when CHX is added to either minimal medium tested, CHXR isolate growth rate was faster than the WT (Figure 1, Supplementary Figures 1, 2, and Supplementary Tables 2, 3). Growth curve findings for specific media conditions (LB + Glc, DG, and M9) also demonstrated that CHXR isolates were capable of growing to higher final OD600 nm values and CFU/mL than WT, suggesting some growth conditions maintained or enhanced CHXR isolate fitness.
Our final phenotypic analysis of each CHX-adapted isolate sought to identify if there were any significant alterations in cell morphology with the use of SEM and a novel membrane integrity assay that we had previously published. With SEM imagery, we assessed CHX-adapted isolates grown to mid-log phase and compared them to mid-log WT cell preparations as shown in Figures 2A–D. Based on a visual assessment, all CHX-adapted isolate’s cell surface morphology appeared to be similar to the un-adapted WT, where all cells had the characteristic bacilliform shape (Figures 2A–D). A blinded cell image analysis with ImageJ (Abràmoff et al., 2007) was used determine the mean lengths and widths of 200 cells from two biological replicates of each CHXR and WT cell preparations (Figures 2E,F and Supplementary Figure 3). The analysis revealed that CHXR2 and CHXR3 isolates were significantly (P < 0.001) shorter in length than WT cells (WT; 1.82 ± 0.06 μm, CHXR2; 1.75 ± 0.35 μm, CHXR3; 1.42 ± 0.29 μm, Figure 2E and Supplementary Figure 3) and all three CHX-adapted isolates were significantly (P < 0.001) narrower in width (CHXR1; 0.68 ± 0.09 μm, CHXR2; 0.69 ± 0.09 μm, CHXR3; 0.71 ± 0.06 μm) than the WT (0.88 ± 0.08 μm) on average (Figure 2F and Supplementary Figure 3). These findings show that CHX adaptation alters cell morphology, by narrowing cell widths overall and in 2/3 isolates, reducing average cell length.
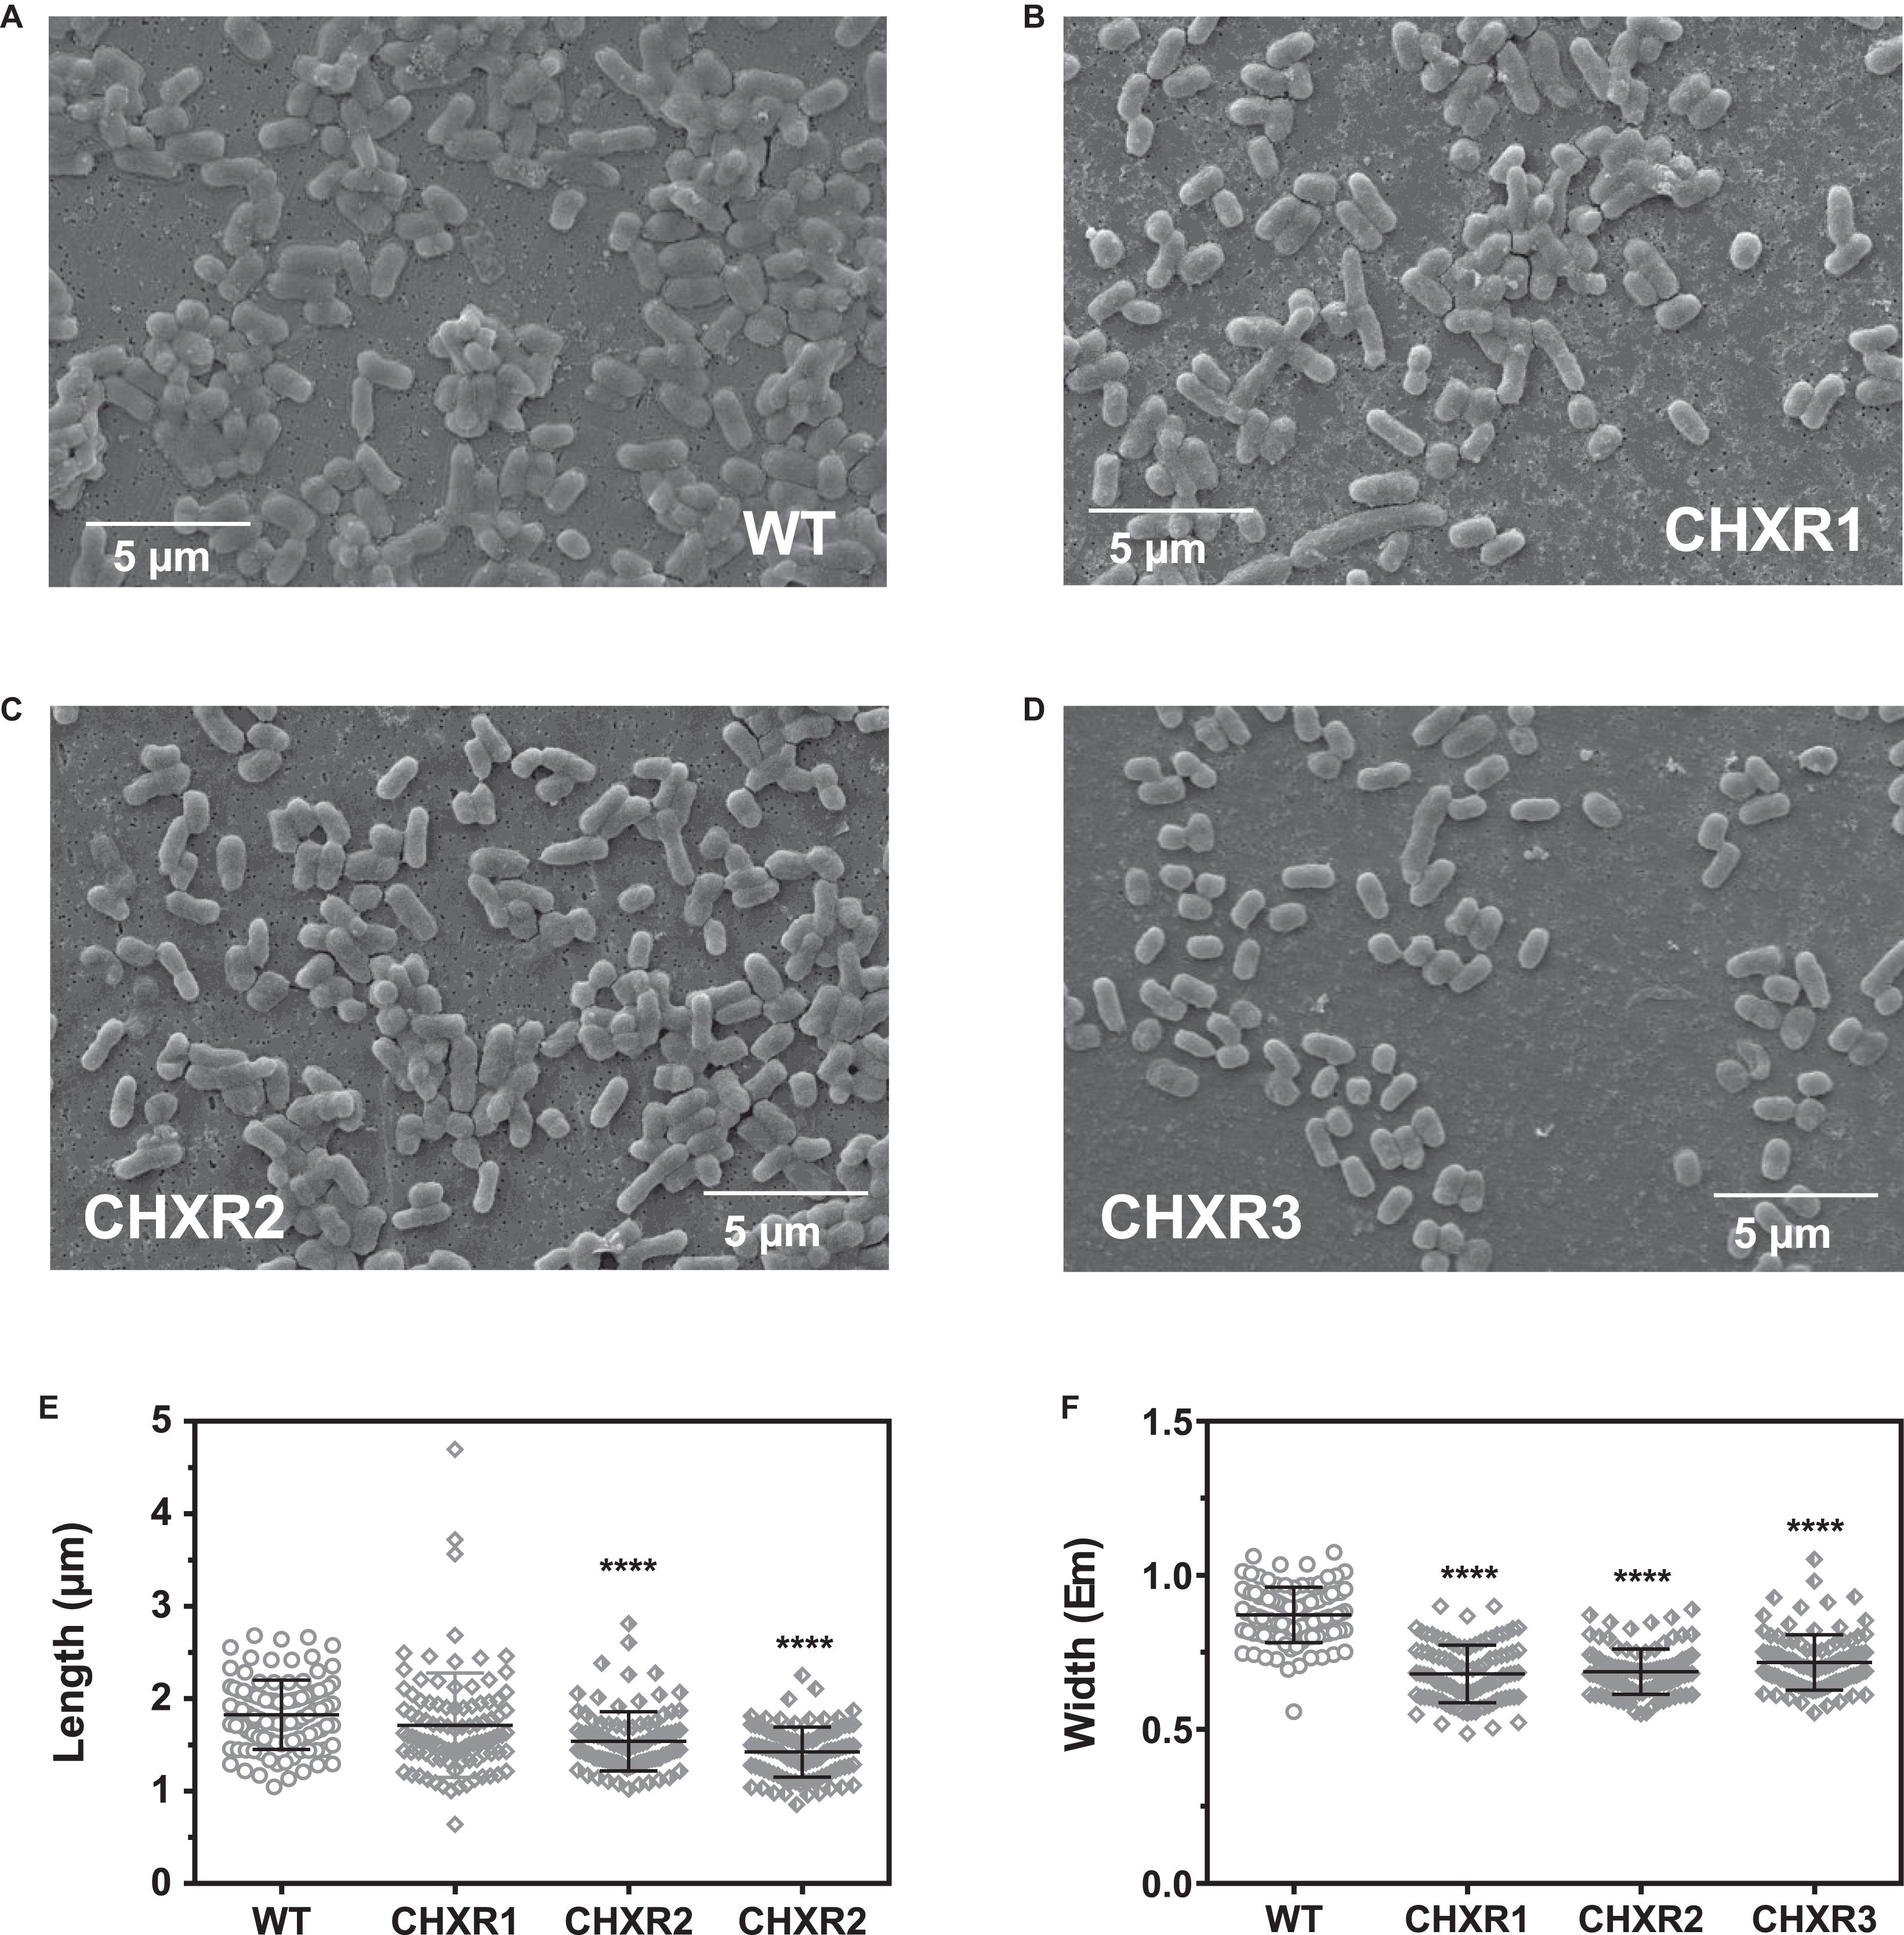
Figure 2. Scanning electron microscopy (SEM) images of CHXR isolates and a summary of measured CHXR cell lengths and widths. (A–D) Show representative 5,000X magnification SEM images of WT (A), CHXR1 (B), CHXR2 (C), and CHXR3 (D) cells. Bars shown in each panel indicate a 5 μm length as a size reference. (E,F) Indicate a summary cell lengths (E) and widths (F) in μm of 200 cells (n = 200) and are shown as plotted symbols. Each CHXR isolate or WT was measured from five SEM images collected from each biological replicate using ImageJ software v1.8.0 measurement tools. Bar plots overlaid on measured cells indicates the maximum, median, and minimum interquartile ranges of the cell measurement datasets and asterisks (****) indicate significant differences between the WT and each CHXR isolate median values at P-values < 0.0001.
To verify if CHXR isolate membranes were significantly altered from the WT, we examined membrane permeation differences using the membrane impermeant fluorescent dye (propidium iodide). This dye increases in fluorescent emission (at 620 nm) when bound to DNA/RNA and was used to indirectly compare the membrane integrity differences of CHXR1 and WT cells. This commonly used dye is applied to measure dead bacterial cells (Stiefel et al., 2015), and we recently showed it can be used to discriminate the membrane integrity differences between antiseptic-resistant and susceptible Enterobacterial isolates (Gregorchuk et al., 2020). We monitored the relative fluorescent emission unit (RFUs) values of live and heat-treated CHXR isolates and WT cells exposed to the same concentration of dye in buffer after 30-min of exposure. We expected heat-treated (dead) cells would have the highest dye RFUs, as compared to live cells, and live cells with higher cell permeability should correspond to greater dye penetration due to more permeable cell membranes as we verified in Supplementary Figure 4A. A comparison of live mid-log CHXR1 to WT cell preparations showed significantly higher dye RFUs after 30-min for CHXR isolates (2.2-fold increase; mean RFU = 565 ± 248 error, n = 9) as compared to WT cells (mean RFU = 252 ± 122 error, n = 9; Supplementary Figure 4B). These findings show that CHXR cell membranes are more CHX-permeant than WT and suggests that CHX adaptation alters the E. coli membrane from WT, in agreement with our SEM images. Together, our SEM and 30-min impermeant fluorescent dye RFU analyses confirm that CHX adaptation of E. coli BW25113 causes phenotypic alterations that can be detected by visual as well as fluorescent techniques.
To identify any alterations in protein presence and abundance between CHXR isolates and WT, we performed proteomic analysis on CHXR1 and WT. We specifically focused on CHXR1 for proteomic analysis due to its greater phenotypic CHX-resistant stability and its higher resistance to CHX (Tables 2, 3). A comparison of CHXR1 and WT whole cell extracted proteomes to cytoplasmic extracted proteomes was conducted using nano LC-MS/MS to determine the relative abundances of soluble and membrane proteins that were altered in the CHXR1 isolate (Supplementary Tables 4, 5). From this analysis, we identified a total of 1904 whole cell (WC) extracted proteins and 2307 cytoplasmic (CY) CHXR1 proteins, of which only 24 WC and 17 CY proteins were noted to significantly differ in abundance or detection when compared to the WT (Figure 3 and Supplementary Tables 4, 5).
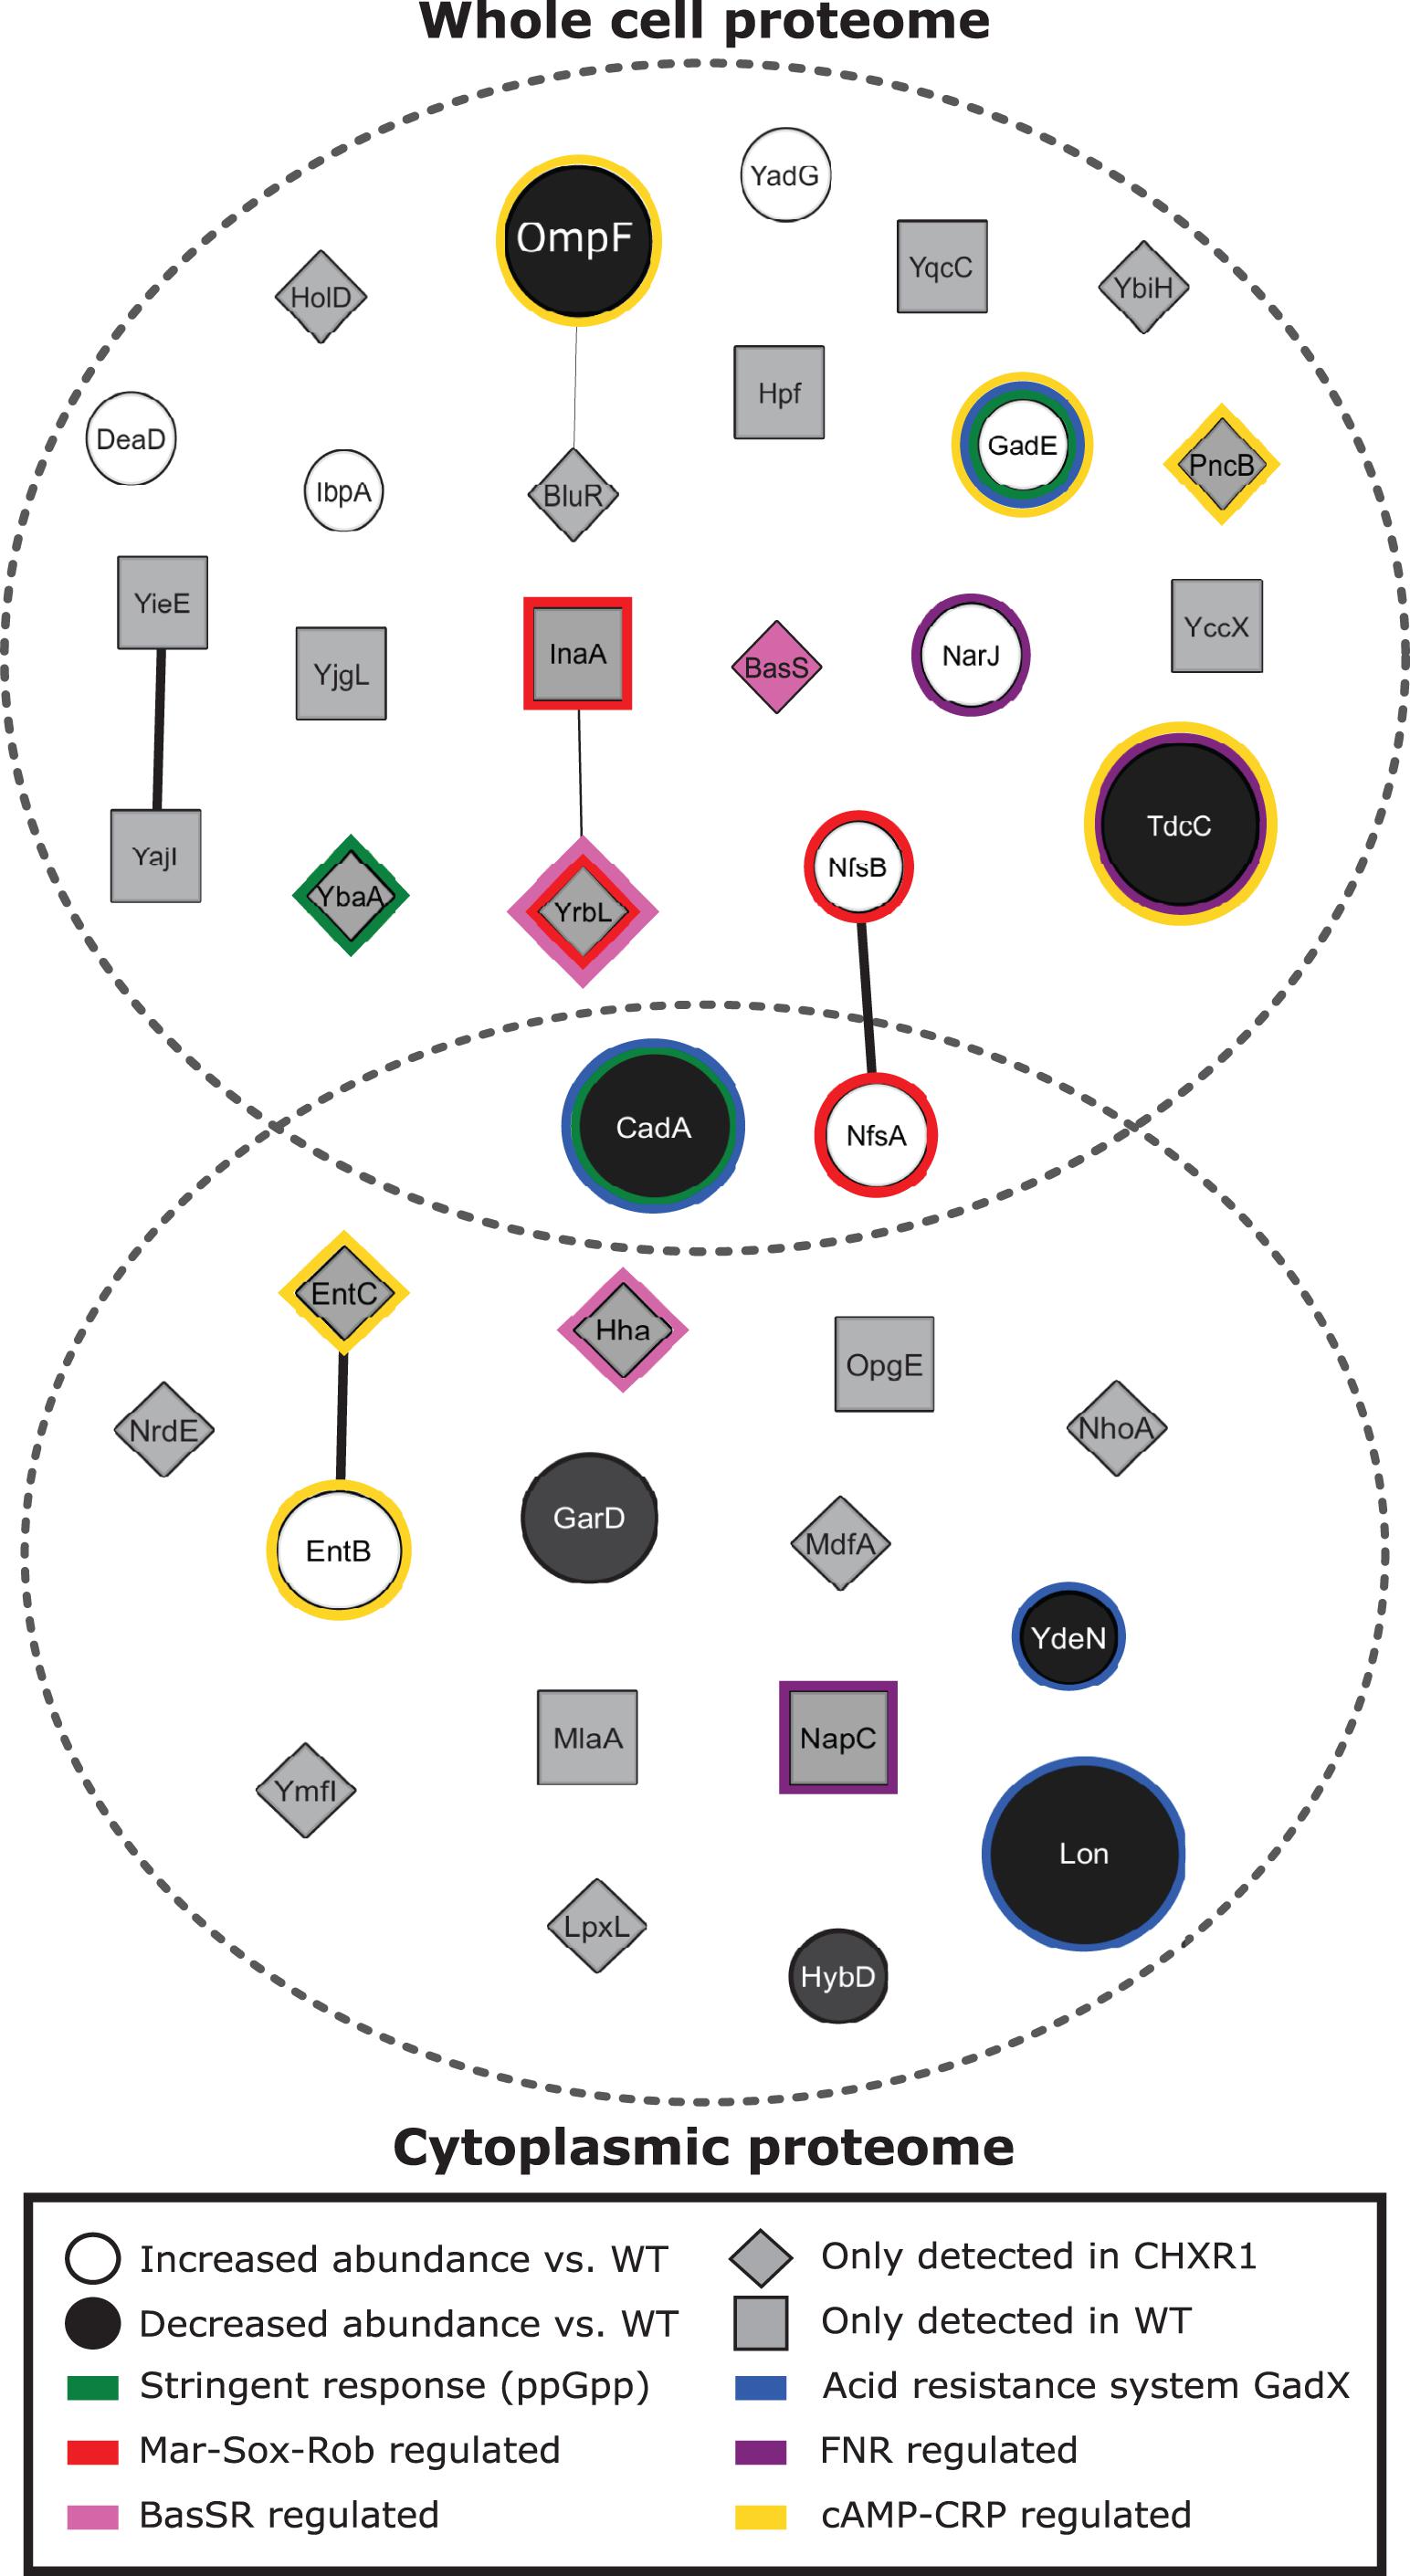
Figure 3. A network diagram summary of significantly identified proteins determined from the CHXR1 isolate and WT proteomic analyses. The network diagram was generated using Cytoscape v3.7.2 (Shannon et al., 2003) using the StringApp v1.5.0 software package (Doncheva et al., 2019). As summarized in the panel legend, significantly altered protein abundances are represented as circles with protein names and indicate proteins that differed between WT and CHXR1 in both the WC and CY proteomes. The size of the protein circles represents the degree of fold change from the WT proteome, where white filled circles represent CHXR1 proteins with increased abundance and black filled circles represent CHXR1 proteins with decreased abundance. Gray filled squares and diamonds represent WT and CHXR1 proteins respectively, that were not detected in the opposite (WT or CHXR1) proteome. Known regulatory systems influencing protein accumulation are outlined by color according to the bottom panel legend.
Few significantly altered relative protein abundance differences were observed between CHXR1 and WT proteomes (shown as circles in Figure 3), where only two proteins, CadA and NfsA, were differentially accumulated in both the WC and CY extracted proteomes. Lysine decarboxylase (CadA), part of the lysine-dependent organic acid resistance system (Kanjee and Houry, 2013), was decreased in abundance (3.8-fold reduction) in both CHXR1 proteomes as compared to WT. GadE, a central transcriptional activator of glutamic acid decarboxylase (GAD) system that maintains pH homeostasis and regulates multidrug efflux pump MdtEF expression (Ma et al., 2003; Hommais et al., 2004), showed increased (4.6-fold) abundance in the CHXR1 WC proteome (Figure 3). Since CHX is cationic at lower acidity, it was not surprising to see upregulation of pH homeostasis systems in the CHX-adapted proteome. NfsA had significantly increased (2.0-fold) in abundance in the CHXR1 WC and CY proteomes as well as NfsB (1.8-fold) in the WC proteome (Figure 3). NfsA is an NADPH-dependent nitroreductase that catalyzes the reduction of nitrocompounds and is frequently upregulated in E. coli exposed to QACs, paraquat, and nitrofuran antimicrobials (Zenno et al., 1996; Whiteway et al., 1998). The increased abundance of NfsA and NfsB in the CHXR1 proteome suggests that this nitrogen reductive pathway may help counteract exposure to toxic nitrogen rich compounds like CHX. Besides NfsAB, many other proteins with altered in abundance between the CHXR and WT were noted to be regulated by stress inducible pathways associated with antimicrobial resistance, such as the Mar-Sox-Rob regulon (Chubiz et al., 2012), the stringent response (Strugeon et al., 2016), and the fumarate and nitrate reduction (FNR) pathways (Kurabayashi et al., 2017). Lon protein, an ATP-dependent protease that degrades misfolded proteins involved in transient multidrug resistance, particularly MarA, SoxS, and GadE (Heuveling et al., 2008; Nicoloff and Andersson, 2013) was significantly reduced (5.3-fold) in abundance in the CHXR1 CY proteomes only (Figure 3). The reduction of Lon in CHXR1 is expected if prolonged activation of the Mar-Sox-Rob and organic acid resistance systems are induced by acidic CHX exposure.
Lastly, nearly half of all proteins we identified in WC and CY proteomes shown in Figure 3 were detectable in either CHXR1 or WT samples (gray filled proteins). Although we cannot compare the relative abundances of these proteins, their detection in the CHX-adapted isolate or WT only were important to note. There was a noticeable absence of MlaA detection in both CHXR1 proteomes (Figure 3), we expected this outcome based on our WGS SNV findings of mlaA (Table 4). We also detected MdfA in the in the CHXR1 WC proteome (Figure 3); MdfA is an alkali-resistant chloramphenicol selective multidrug efflux pump belonging to the Major Facilitator Superfamily (MFS) (Edgar and Bibi, 1997; Bohn and Bouloc, 1998). Altered detection of this MFS alkali-resistant efflux pump in CHXR1 suggests upregulated expression of this efflux pump, possibly contributing to CHX-resistance. BasS, also known as PmrB, was detectable only in CHXR1 WC proteomes and is the sensor histidine kinase of the BasSR two-component system that regulates the expression of the arnBCADTEF operon which modifies LPS and is often detected in colistin resistant species (Olaitan et al., 2014). Additionally, lipid A biosynthesis enzyme, lauroyl acyltransferase (LpxL) was only detected in the CY proteome of CHXR1, suggesting that LPS biosynthesis may be altered in the CHX-adapted isolate.
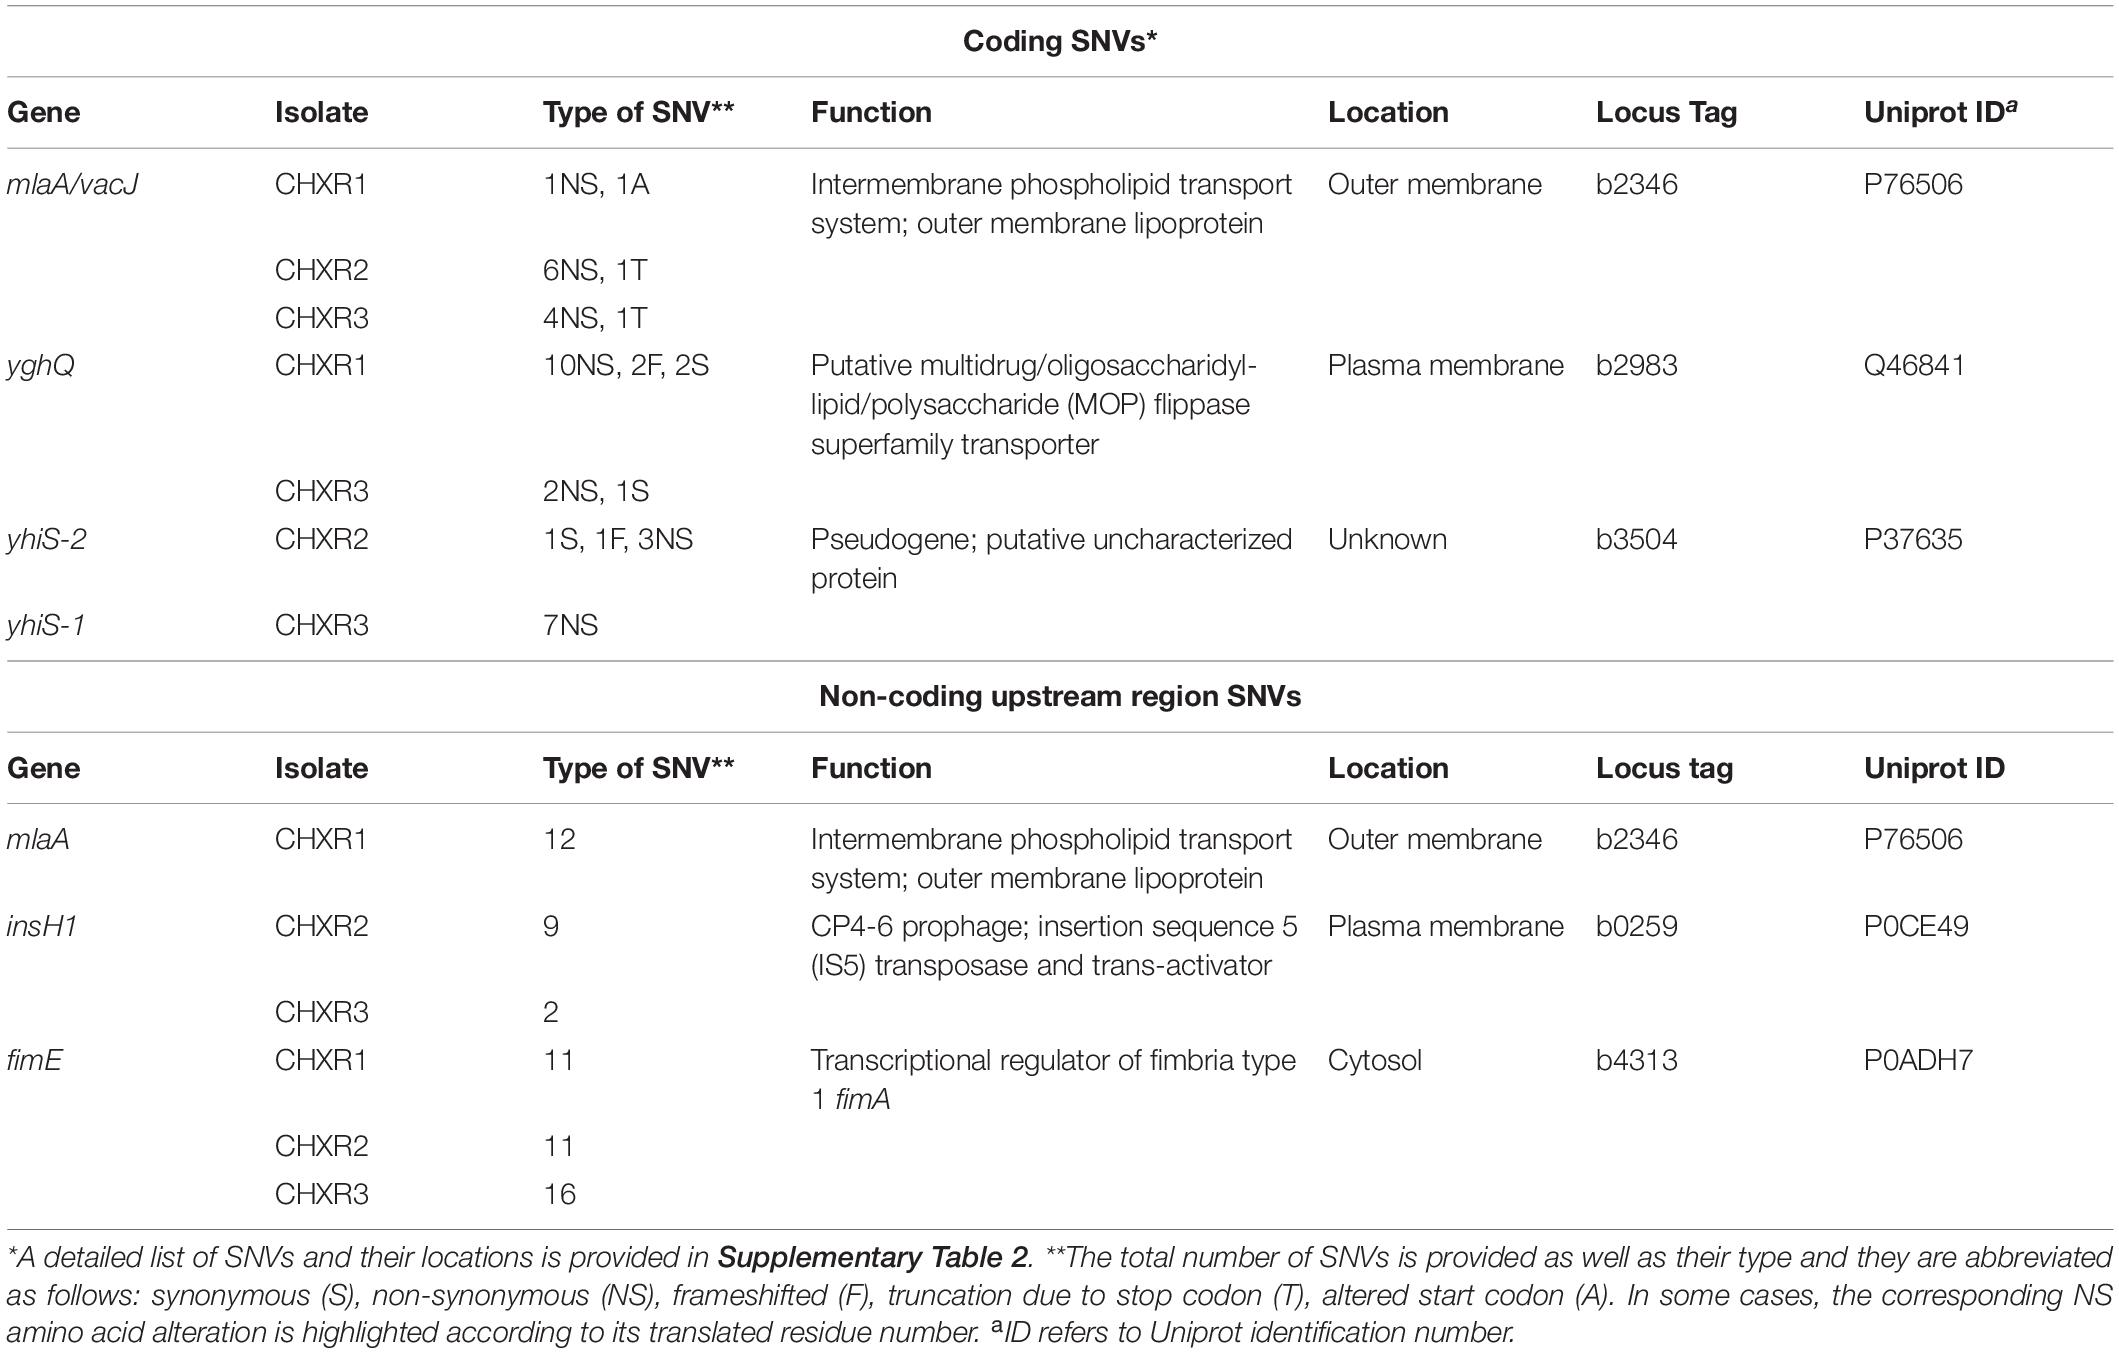
Table 4. A summary of repetitive coding and non-coding SNVs identified from CHX-adapted genomes sequenced in this study.
Overall, CHX-adaptation resulted in the significant alteration of a small collection of proteins pivotal in acid resistance, prolonged antimicrobial stress, as well as LPS biosynthesis and transport highlighting many new and previously identified proteins involved in antimicrobial resistance that overlap with CHX-resistance.
To determine if any CHX-adaptation resulted in any gene expression changes in addition to the proteomic changes we observed, RNA-seq transcriptome analyses was performed on mid-log cultures of CHXR1 and WT under the same growth conditions used for proteomic analyses. A total of 4490 genes had altered gene expression as detected by RNA-seq analysis, where only 505 were significantly up- or down-regulated in CHXR1 and WT transcripts (Supplementary Table 6). In an effort to identify significantly altered transcripts from other omics analyses performed herein (proteomic and genomic), we generated a summary heatmap of these differentially expressed gene from CHXR1 and WT (Figure 4). This analysis identified that 11 CHXR1 transcripts up or down regulated from RNA-seq were also similarly altered in protein abundance (bolded genes; Figure 4). Notably, up-regulated efflux pump mdfA and down-regulated porin ompF transcripts in CHXR1 (Figure 4), had similar accumulation differences in their translated CHXR1 proteins when compared to WT proteomes (Figure 3). In CHXR1 transcriptomes, efflux pump emrAB was up-regulated 2-fold, whereas only three additional porins ompX (3.1-fold up-regulated), ompA (2.2-fold upregulated) and ompT (4.3-fold down-regulated) exhibited altered expression in CHXR1 when compared to WT (Figure 4). Acid resistance and pH regulatory genes cadA and gadE previously identified as having altered protein accumulation also demonstrated similar alterations in transcript levels in CHXR1 transcriptomes (Figure 4). Up-regulation of gadE transcripts (8.1-fold from WT) and other GAD system transcriptional regulators gadX (4-fold), and gadW (2-fold) were detected in CHXR1 when compared to the WT transcriptome (Figure 4). Altered expression of GAD regulated genes were also noted and included mdtEF, gadABC, cadA, hdeABD, and ydeN (Mates et al., 2007) when compared to the WT transcriptome (Figure 4); YdeN is important to note as it was also down-regulated in CHXR1 proteomes (Figure 3). This suggests that gadE and the GAD system regulon may play a role in E. coli CHX resistance.
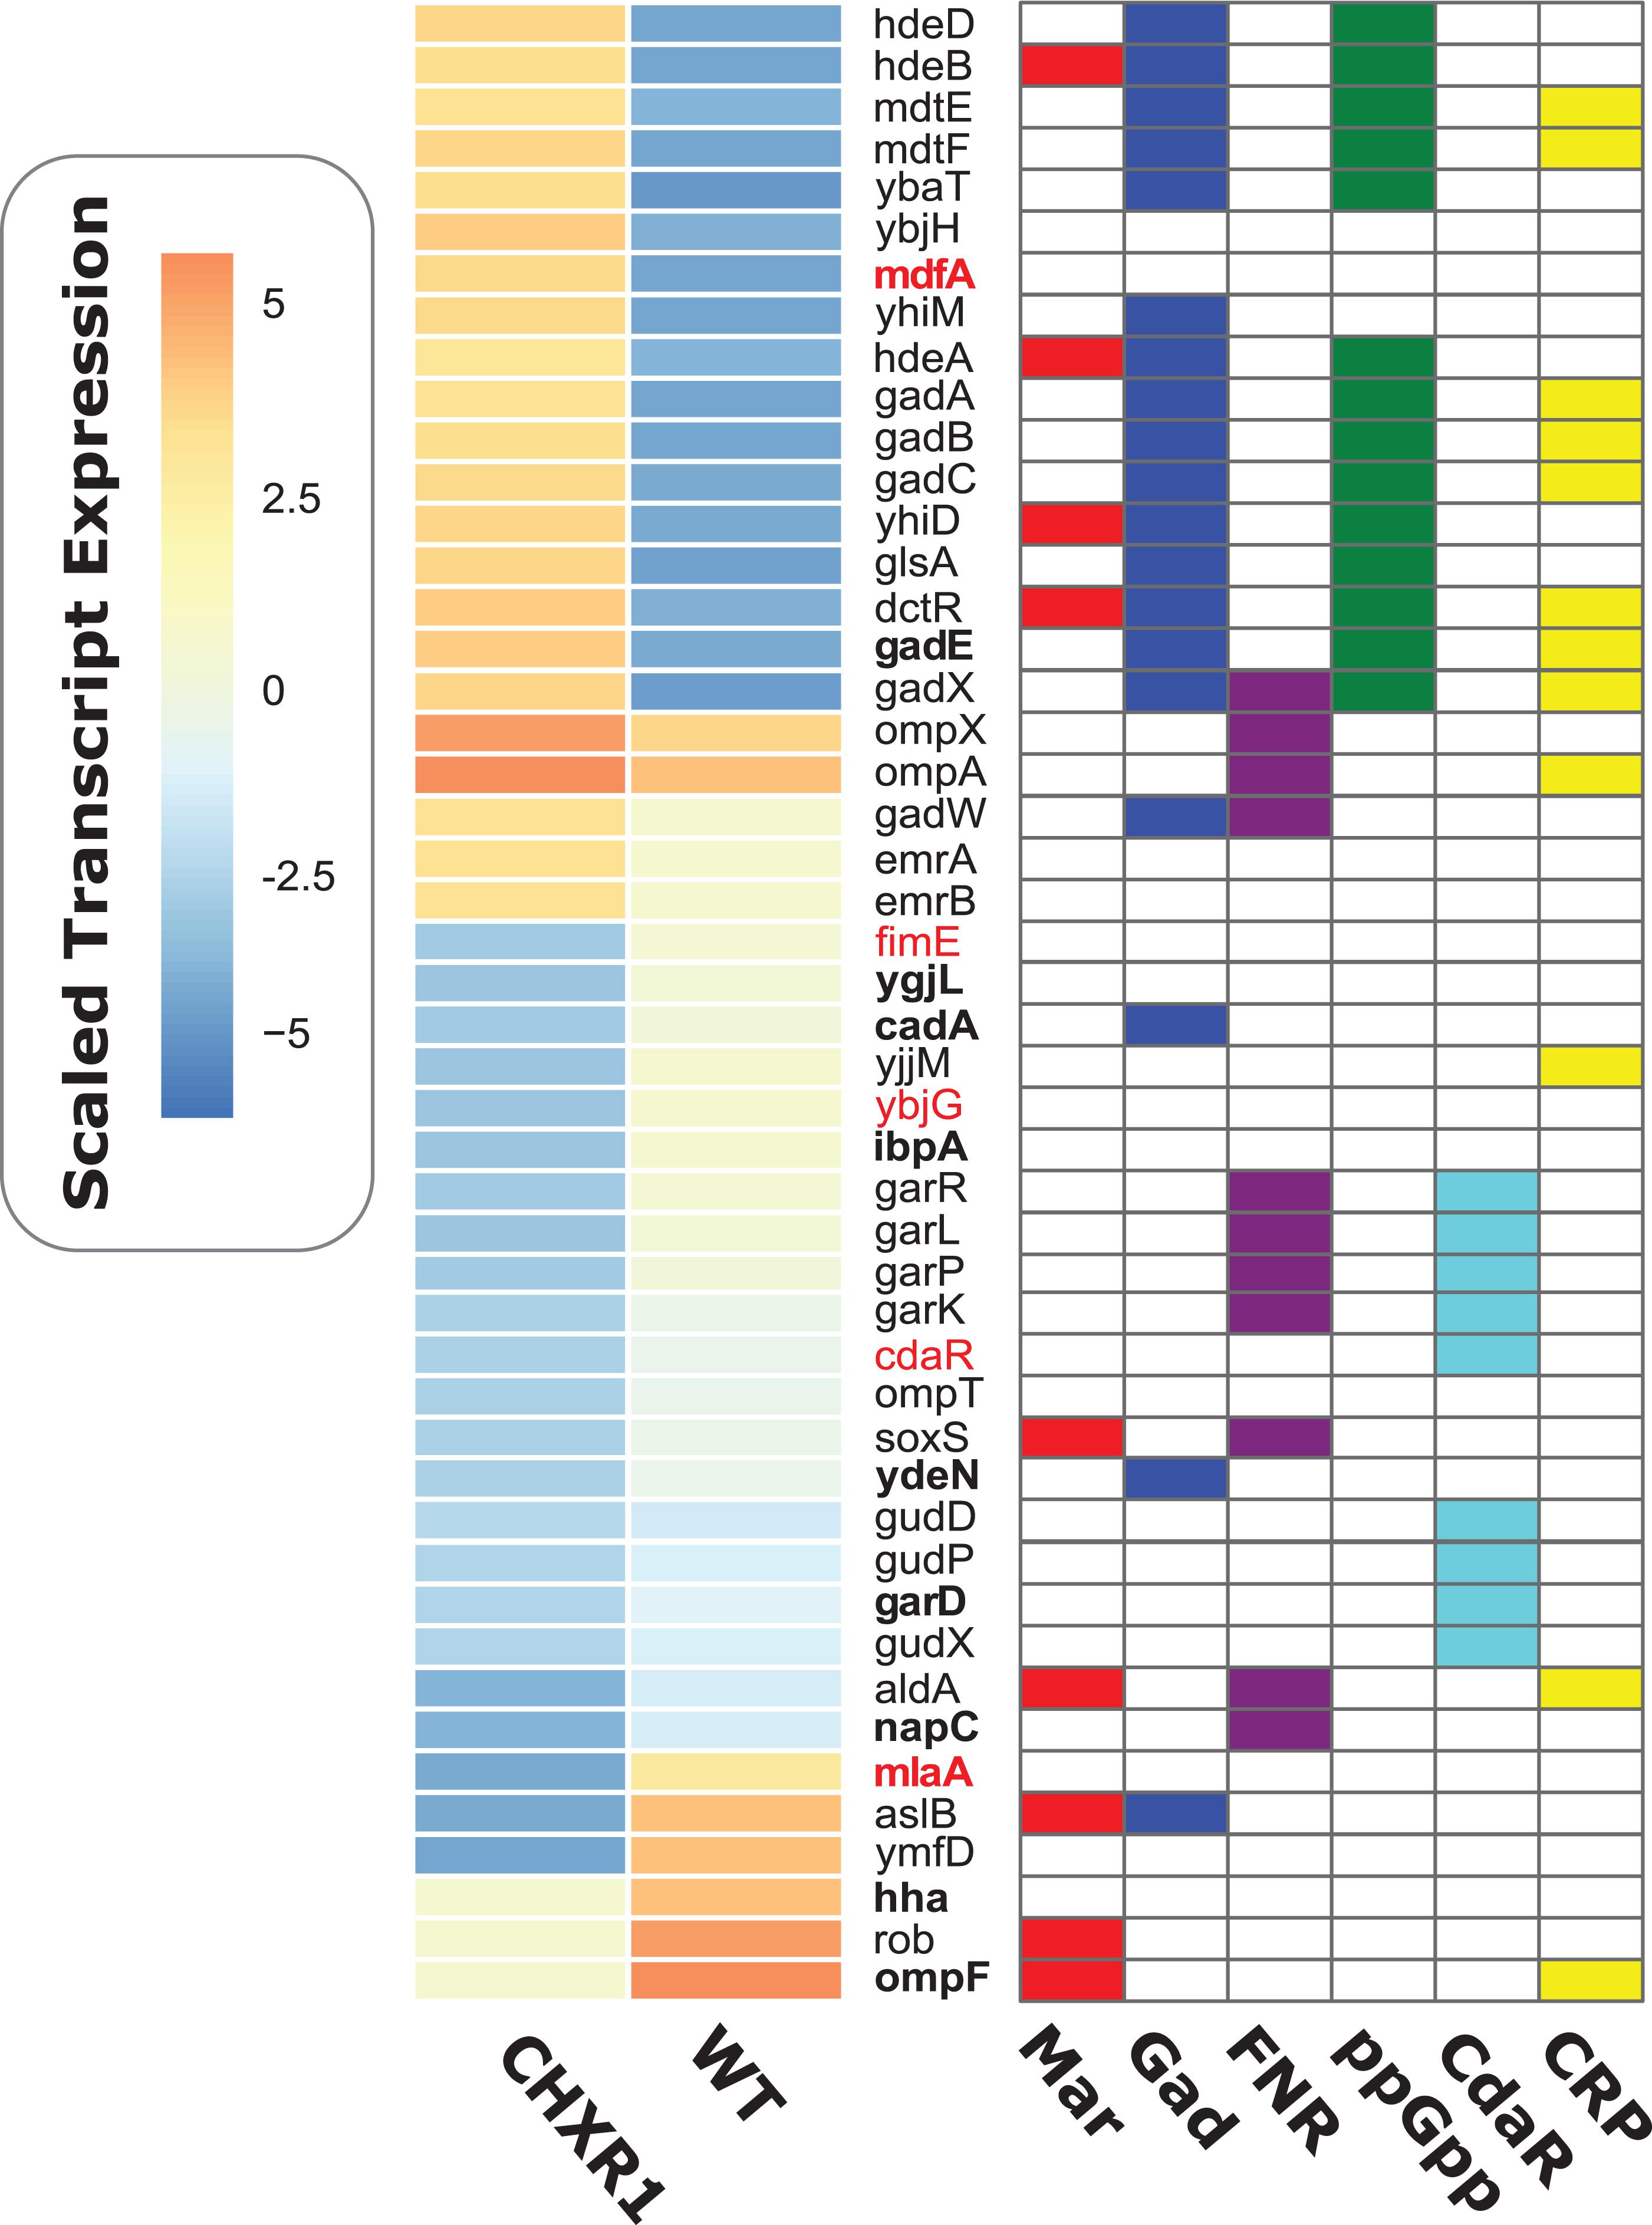
Figure 4. A heatmap diagram of significantly altered gene transcripts of CHXR1 and WT E. coli for RNA-seq transcriptional analysis. The heatmap shown to the left of the gene names listed indicates scaled median gene expression values of CHXR1 and WT, where red to orange colors indicate genes that were up-regulated and blue to dark blue colors indicate down-regulated transcripts of CHXR1 to WT. Heat mapped expression data represents median gene expression values from three biological replicates (n = 3) of WT and CHXR1 isolates. Colored charts on the right-hand grid beside each y-axis gene name indicate whether or not the listed gene is regulated by the mar-sox-rob regulon (Mar; red), GadE/W/X (Gad; blue), fumarate and nitrate reductase regulon (FNR; purple), stringent response system (ppGpp; green), carbohydrate diacid regulator CdaR (light blue), and cyclic AMP-CRP regulon (CRP; yellow). Gene names in red font indicate genes that possessed SNVs (Figure 5B and Table 4) and genes with bolded font indicate translated protein products that were significantly altered in abundance based on proteomic analyses (Figure 3).
Altered expression of genes in CHXR1 that were genetically altered by SNVs based on WGS were identified for mlaA and the carbohydrate diacid regulator cdaR (Table 4). Reduced transcript levels of outer membrane lipoprotein mlaA (6.4-fold reduction) was identified in CHXR1 and this finding also corresponds with proteomic data where MlaA protein was only detectable in WT CY proteomes only, highlighting its consistent absence in CHXR isolates. The carbohydrate diacid regulator cdaR, which had a single frame shift mutation in cdaR in the CHXR1 genome, was also significantly down-regulated (6-fold) in the CHXR1 transcriptome (Figure 4 and Supplementary Table 6). Many of the genes regulated by cdaR, such as D-glucarate degrading enzymes gudDPX and D-galactarate degrading enzymes garDKPLR (Monterrubio et al., 2000), were noticeably down-regulated in CHXR1 as well (Figure 4 and Supplementary Table 6), suggesting that the reduction of each carbohydrate degrading enzyme pathway may increase these osmolytes and contribute to CHXR1 resistance.
Lastly, antimicrobial stress inducible genes rob and soxS were down-regulated 3 to 4-fold in CHXR1 (Figure 4). rob and soxS are part of the multiple antibiotic resistance mar-sox-rob regulon that directly regulates efflux pumps (acrAB-tolC) and indirectly ompF porin transcription (via micF) (Chubiz and Rao, 2011), however, we only detected significant ompF down-regulation in CHXR1 (Figure 4 and Supplementary Table 6). Altogether, this indicates that antimicrobial, and pH/acid inducible stress systems are significantly altered in CHX-adapted E. coli, in addition to genes corresponding to antiseptic resistance mechanisms (i.e., efflux pump, LPS modifiers, and porins).
To discern the genetic consequences of CHX-adaptation, we performed WGS analysis at 30X coverage on each CHX-adapted isolate (CHXR1-3) and compared them to sequenced WT as summarized in Supplementary Tables 7, 8. Findings from this analysis identified relatively few SNVs among each CHXR isolate (47–74 SNVs total), indicating that prolonged CHX-exposure did not generate numerous SNVs in this E. coli strain (Figure 5A and Supplementary Table 8). Maximum Likelihood phylogenetic analyses of the sequenced genomes showed that all CHX-adapted isolates grouped together and separately from the WT sequence, where CHXR1 and CHXR3 grouped more closely together than CHXR2 but at lower bootstrap confidence values (60/100; Figure 5A). After comparing CHXR genomic sequences to the sequenced WT reference we identified SNVs in a number of coding and non-coding regions as summarized in Supplementary Table 8. However, very few of these SNVs were repeatedly identified in the same gene(s) amongst all three CHXR isolates as summarized in Figure 5B and Table 4. As shown in the Venn diagram SNV summary of Figure 5B only a single gene mlaA (also known as vacJ), encoding for an outer membrane lipoprotein and component of the Mla retrograde phospshoplipid transport system, was repeatedly identified in all three CHXR isolates. In each CHXR isolate, the mlaA gene possessed deleterious SNVs that either truncated the gene, resulting in reading frameshifts (CHXR2-3) or eliminated its start codon (CHXR1) as noted in Table 4. Several SNVs were also repeatedly identified in 2/3 CHXR isolates, specifically, in yghQ a putative multidrug/oligosaccharidyl-lipid/polysaccharide (MOP) flippase superfamily transporter (Saier et al., 2016) and a pseudogene yhiS (yhiS-1, yhiS-2) which is disrupted by an insertion element and encodes for an as yet uncharacterized protein (Figure 5B and Table 4).
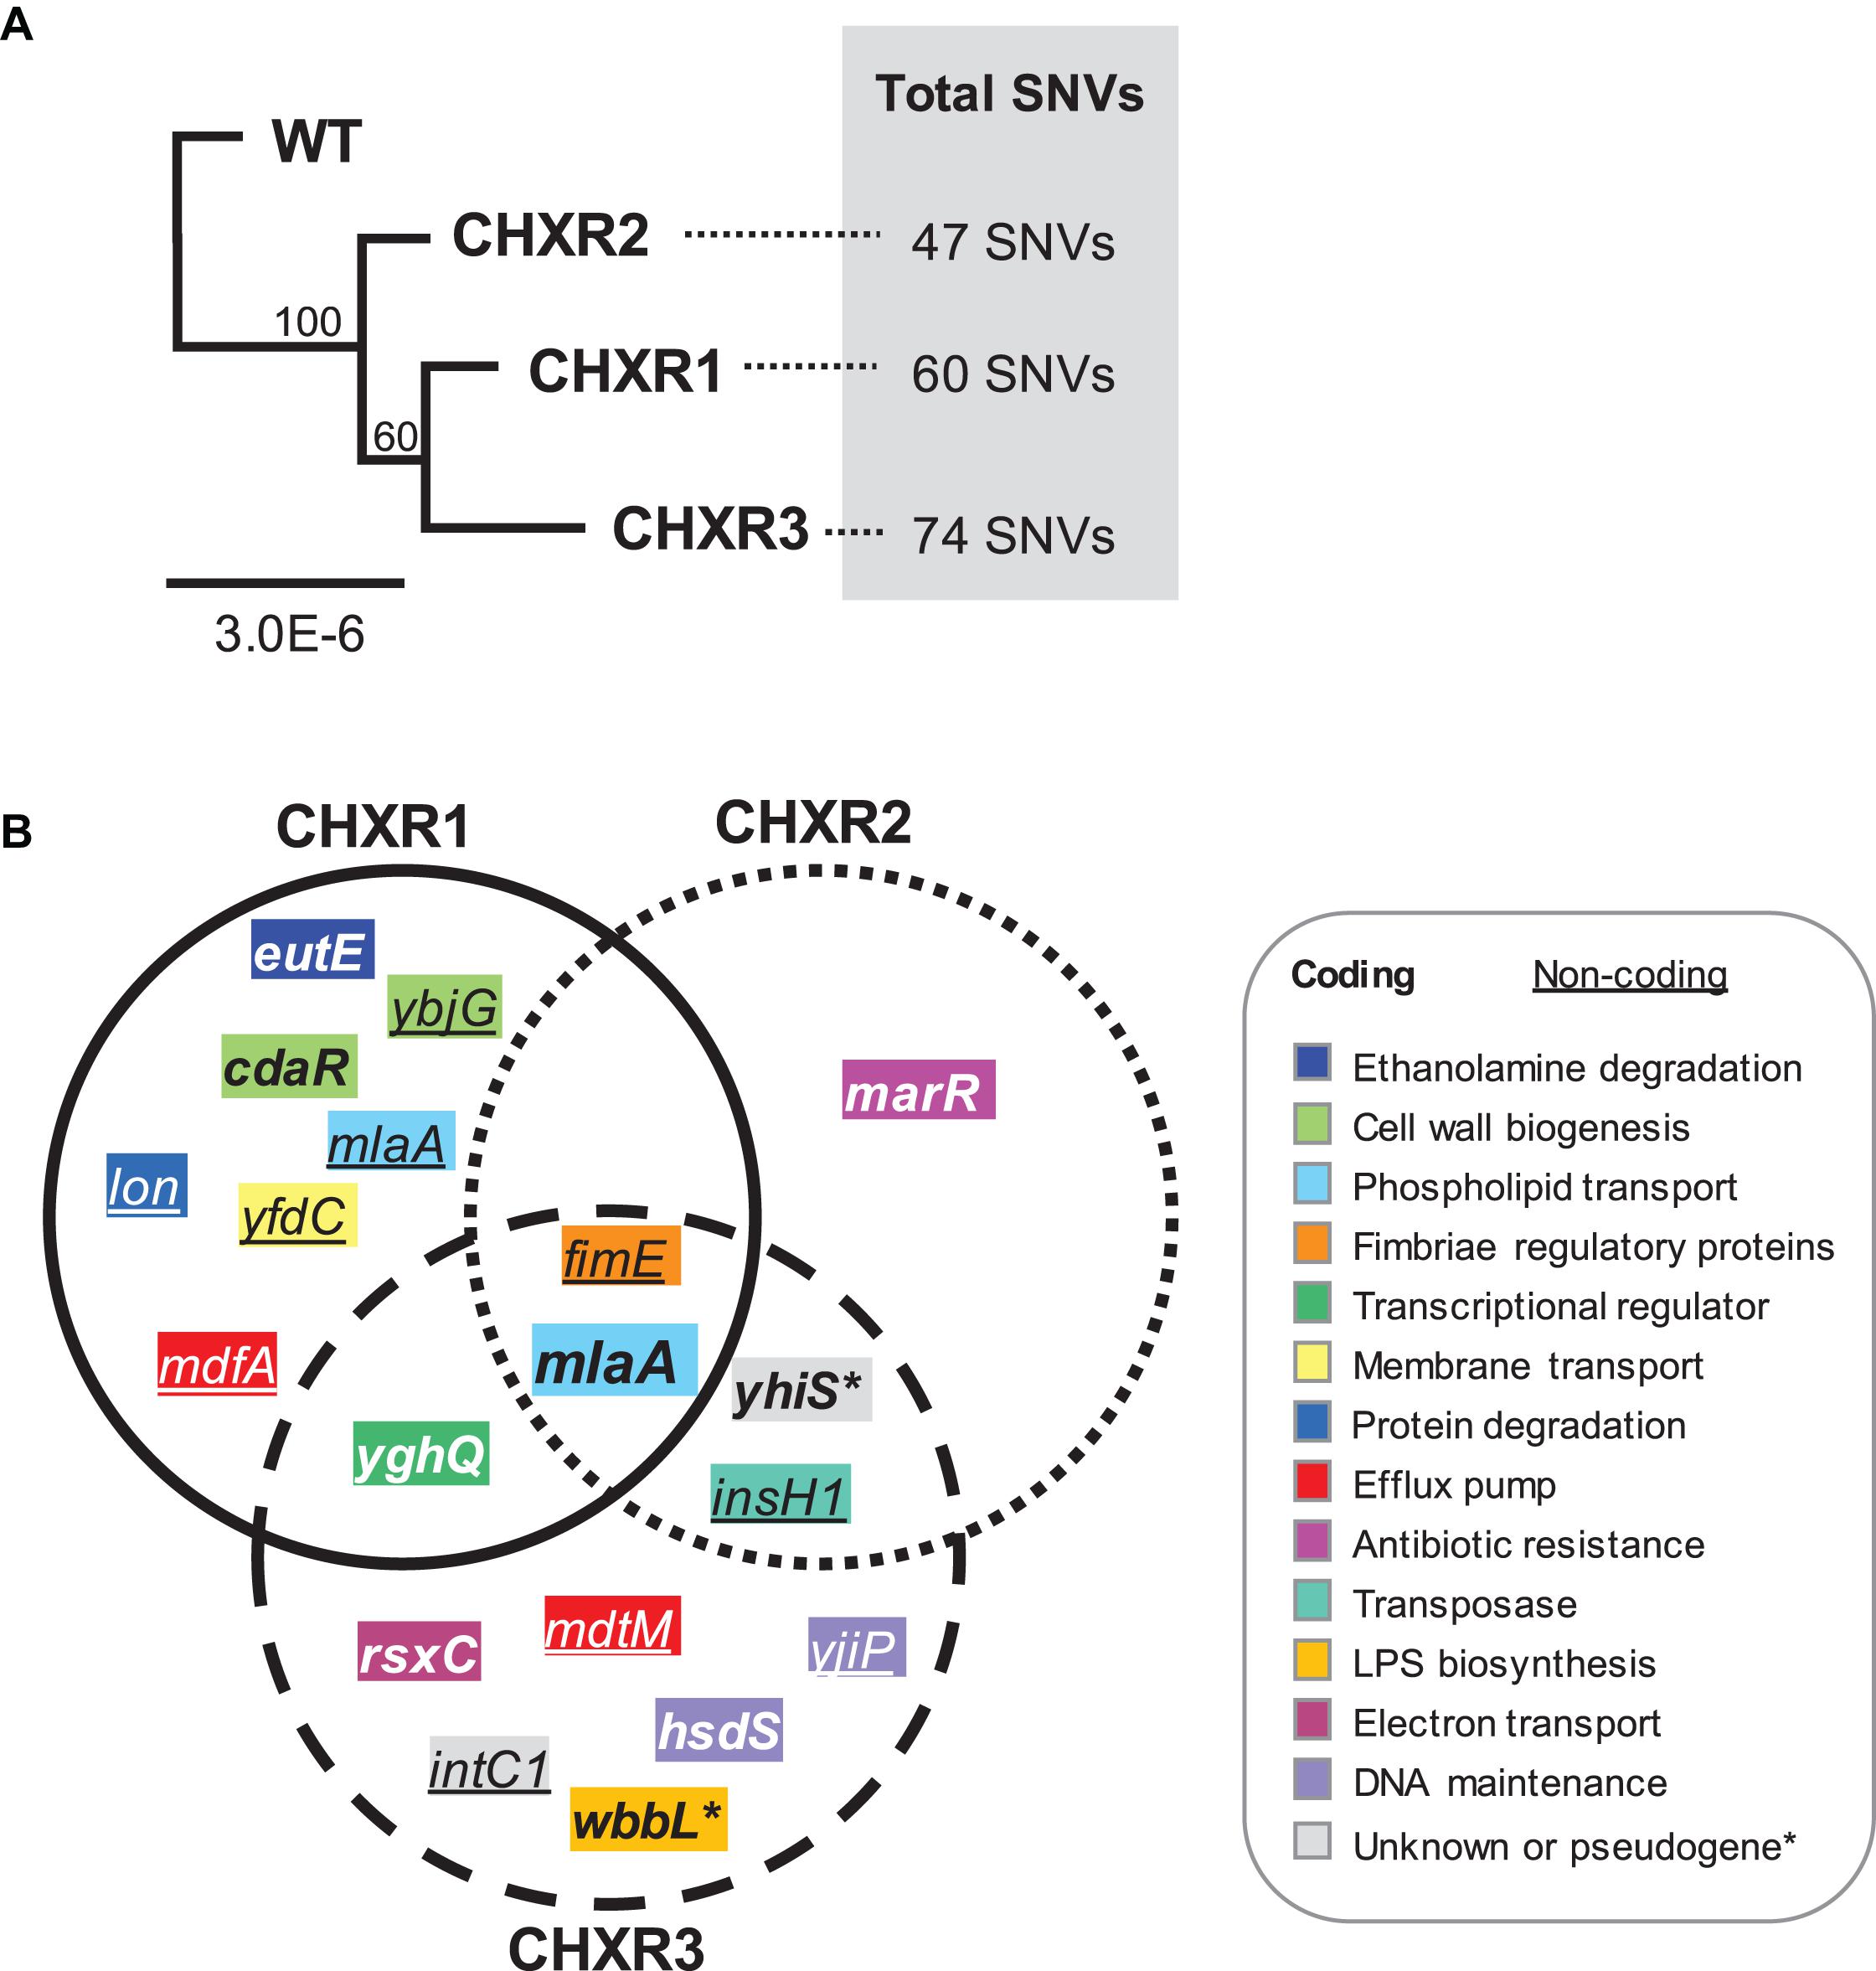
Figure 5. Phylogenetic analysis of CHXR isolate genomes and a Venn diagram summary of coding and non-coding SNVs identified in each CHXR isolate. (A) A Maximum Likelihood dendrogram of aligned WGS WT and CHXR1-3 sequences, where bootstrap confidence values are indicated at each node. Total SNVs identified from genomic comparisons of each CHXR isolate to the WT is indicated on the right-hand side of the dendrogram. (B) A Venn diagram summary highlighting SNVs identified in the coding genes and non-coding upstream regions of genes (underlined) identified from CHXR isolates by WGS. The gene names shown in the diagram are color-coded according to their functional association as shown in the panel legend.
Our analysis of non-coding SNVs in repetitively occurring regions of the CHX-adapted isolates primarily focused on upstream genetic regions for their potential to disrupt coding sequence expression/regulation (Table 4). In all three CHXR isolates, there was only one set of repetitively identified non-coding SNVs in the upstream of fimE, which is a transcriptional regulator of the type 1 fimbrial gene fimA. FimE is a recombinase that controls the “ON-OFF” fim-switch (fimS) that regulates transcription of the type 1 fimbrial operon referred to as phase-variation (Kulasekara and Blomfield, 1999). In CHXR1 transcriptomes, fimE was down-regulated by 3.6-fold but no significant changes in any other fim operon gene expression was identified (Figure 4 and Supplementary Table 6). More in-depth analysis of the fimS region from WGS contigs revealed that all three CHXR possessed SNVs and indel alterations of the fimS resembling a hybrid ON-OFF promoter sequence (Supplementary Figure 5), which may explain why fimE expression was reduced in CHXR1 when compared to WT. The only other repetitively identified non-coding SNV region was in the upstream region of insH1 in CHXR2-3 isolates. InsH1 is a transposase and transcriptional trans-activator of the insertion sequence element IS5 and it is a stress inducible gene within the cryptic prophage (CP) 4–6 in E. coli K-12 (Schnetz and Rak, 1992). Transcripts of insH1 were not shown to significantly differ between CHXR1 and WT transcriptomes (Supplementary Table 6). Lastly, it is worth noting that the upstream region of mlaA in the CHXR1 isolate had numerous nucleotide sequence substitutions and transversions that altered the putative –35 and –10 regions of the mlaA promoter (Supplementary Table 8). When this finding is combined with coding SNV data showing the start codon of mlaA is altered in CHXR1, all three CHXR isolates are expected to have non-functional mla genes. In summary, WGS revealed that relatively few genes were repetitively altered in all CHX-adapted and suggests the involvement of mlaA and fimE in all CHXR isolates.
Our final aim sought to identify which genes that were confidently and repeatedly identified in our multi-omics analyses of CHX-adapted isolates, specifically contributed to overall CHX-resistance mechanisms. Using the E. coli ASKA plasmid clone library we transformed plasmids with cloned genes for marR, mlaA, yghQ, yhiS, fimE, gadE, and cdaR (Table 1), into each CHXR isolate and the WT strain to determine if there were any significant changes in CHX susceptibility using broth microdilution AST methods as previously described. The results from all plasmid complementations revealed that only CHXR isolates transformed with pMlaA showed significant 4-fold reductions in CHX MIC values as compared to the parental vector pCA24N (Figure 6A and Table 5). Complementation of the WT strain with these plasmids also demonstrated a significant reduction in CHX MIC values for pMlaA only (Figure 6B and Table 5). No changes in CHXR1-3 transformant CHX MIC values were determined for pYghQ, pFimE, or pMarR indicating that mlaA primarily influences the CHX-resistant phenotype (Table 5). It is important to note that transformation of WT with pFimE resulted in a 2-fold increase in CHX MIC when compared to the parental vector but no changes in CHX MIC were observed in any CHXR isolate transformed with pFimE (Table 5), indicating that FimE had no impact on CHX-resistant phenotypes. Additionally, only pCdaR CHXR1 transformants showed 2-fold CHX MIC reduction as compared to the parental vector (Table 5). Since CHXR1 was the only isolate to have cdaR mutations, the partial complementation of a functional cdaR gene suggests this carbohydrate diacid regulator may also contribute to CHX resistance mechanisms. However, cdaR likely is most effective in combination with ΔmlaA deletions based on the lack of CHX MIC values difference from the WT in ΔcdaR strain (Table 5).
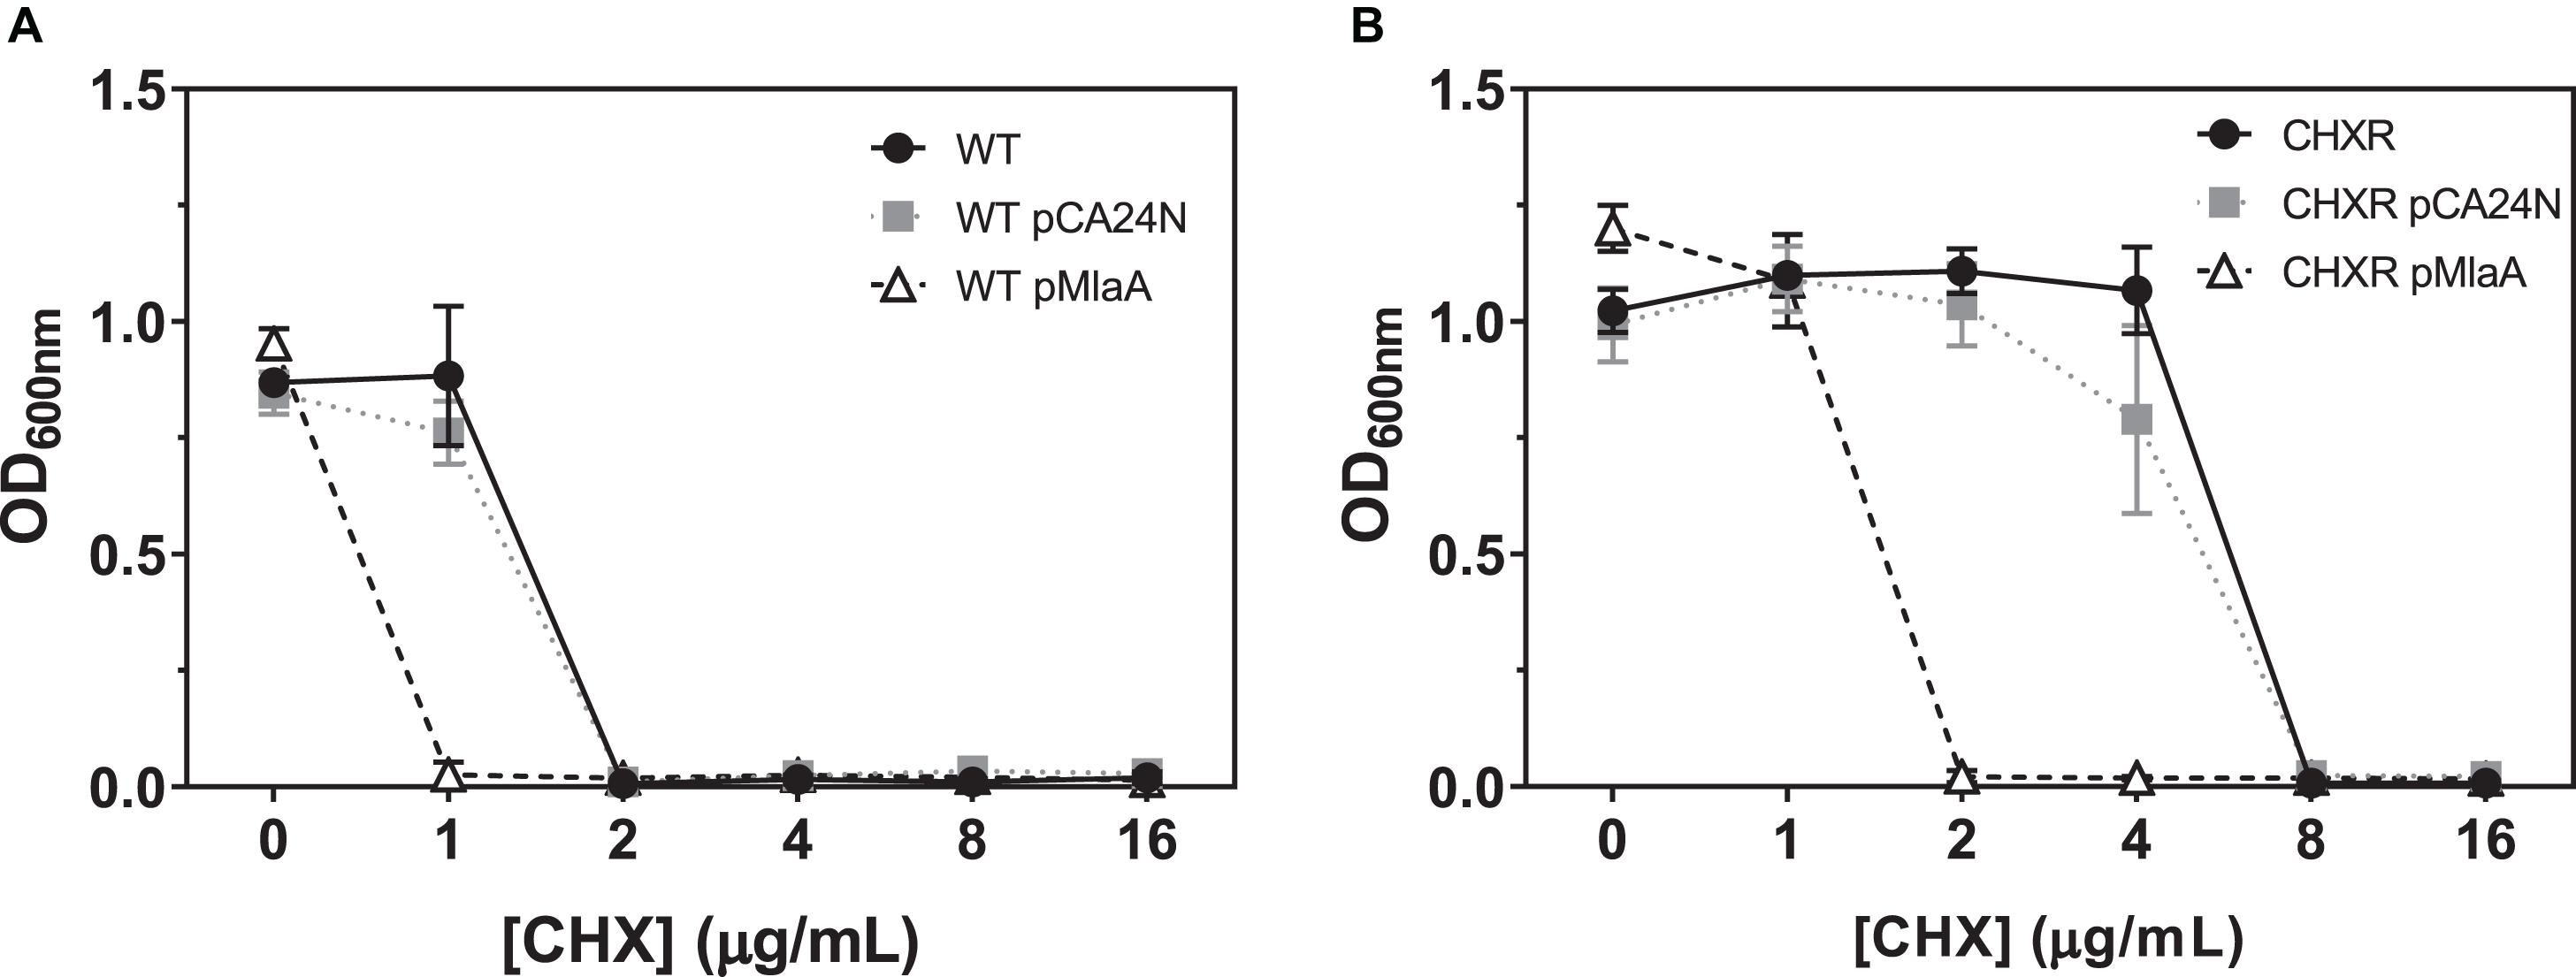
Figure 6. A summary of broth microdilution AST OD600 nm values for CHXR and WT pCA24N and pMlaA transformants after 18 h of growth at 37°C. (A) pCA24N, and pMlaA transformed CHXR1-3 isolates OD600 nm values after 18 h of growth at 37°C at increasing CHX concentrations. The results of CHXR1-3 isolate OD600 nm values are shown as a plotted average and error bars indicate standard deviation. (B) pCA24N, and pMlaA transformed WT (BW25113) isolates OD600 nm values after 18 h of growth at 37°C at increasing CHX concentrations with chloramphenicol selection. Untransformed CHXR1-3 isolate (A) or WT (B) OD600 nm values are shown in each panel as a negative control reference and were grown in the absence of chloramphenicol. All transformant AST OD600 nm values were measured in biological triplicate.
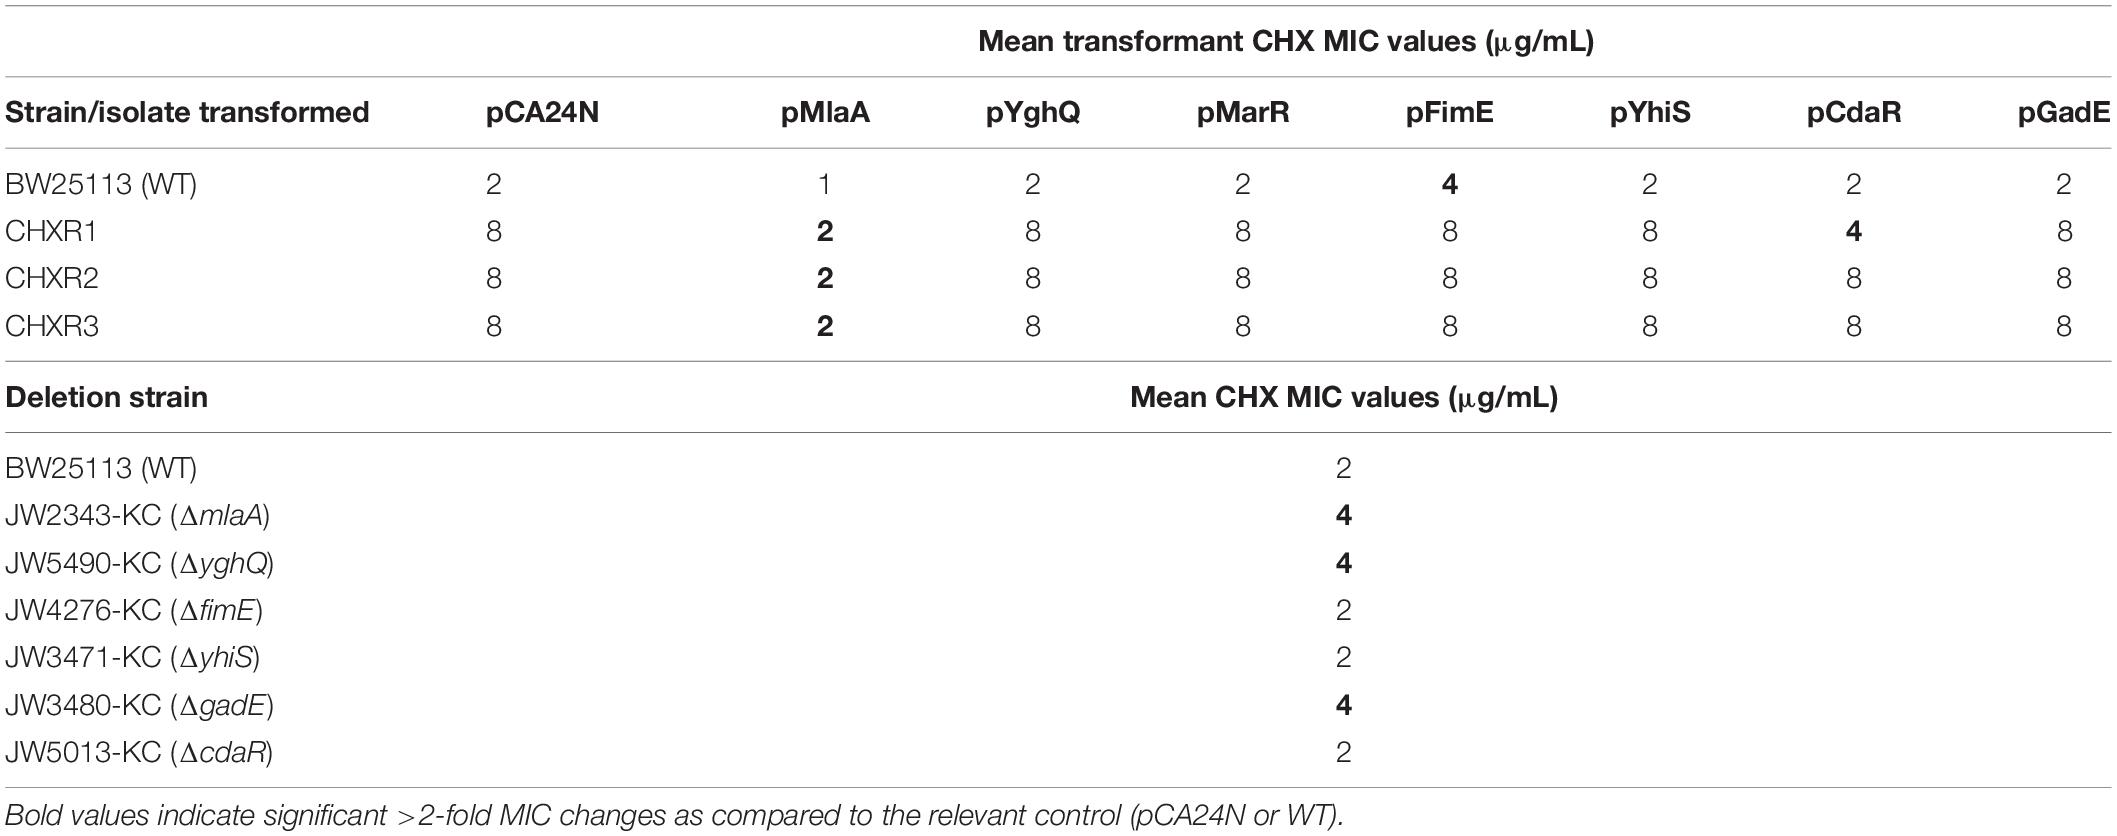
Table 5. A summary of CHX MIC values from AST of plasmid transformed WT, CHXR isolates, and E. coli K-12 single gene deletions.
Antimicrobial susceptibility testing of E. coli K-12 BW25113 Keio collection strains containing single gene deletions the same complemented genes listed above, revealed that only the deletion of ΔmlaA (JW2343-KC), ΔyghQ (JW5490-KC), and ΔgadE (JW3480-KC) increased CHX MIC values by 2-fold from the WT (Table 5). This suggests that the loss of mlaA in E. coli, as well as the individual deletion of putative polysaccharide exporter yghQ or the GAD transcriptional regulator gadE can also confer modest CHX-resistance enhancements based on MIC values. Growth curve analysis of ΔmlaA and WT showed no statistically significant differences in growth rate in all media tested (Supplementary Figure 6 and Supplementary Table 3). However, similar to CHXR isolate growth curves, ΔmlaA also had significantly higher final OD600nm values than WT (by 20–29%) in all media tested (LB, MHB, and DG) with and without added CHX (Supplementary Figure 6). These findings confirm that pMlaA complementation and mlaA over-expression in CHXR and WT strains is detrimental for CHX resistance and in fact even increases WT cell susceptibility to CHX. Our results also identify additional E. coli genes (yghQ, fimE, gadE, and cdaR) that when altered, may additively contribute toward CHX-resistant phenotypes and serve as additional CHX biomarkers with mlaA.
The findings from this phenotypic and multi-omics study of CHX-adapted E. coli isolates have revealed the importance of MlaA in intrinsic CHX resistance. Outer membrane lipoprotein MlaA forms a complex with outer membrane porins OmpF and OmpC (Chong et al., 2015), and serves as the outer membrane component linking the remaining MlaFEDBC system components in the plasma membrane and periplasm to the outer membrane. The Mla system, referred to as the maintenance of outer membrane lipid asymmetry in Gram-negative species, functions as a retrograde phospholipid transport system. This system removes phospholipids from the outer membrane back into the plasma membrane in an ATP-dependent process (Ekiert et al., 2017). Retrograde phospholipid trafficking helps maintain LPS enrichment in the outer leaflet of the outer membrane and assists in cellular phospholipid recycling. In our study of CHX-adapted E. coli isolates, we observed deleterious SNVs in a single gene, mlaA amongst all three CHXR isolates indicating its involvement in CHX resistance (Figure 5B and Table 4). This suggests that intrinsic CHX resistance by E. coli and potentially other Gram-negative species is enhanced when the retrograde phospholipid Mla transport system is inactivated and may be an important contributor to CHX resistance mechanisms. Since CHX acts by forming gaps between paired lipids, we speculate that CHX may be brought along with its paired lipids as they are returned back to the plasma membrane by the Mla system, this may also identify a route of entry of CHX into the cell. When the MlaA is absent, as we observed in our CHX-adapted isolates, CHX entry and potentially its membrane disruptive mechanisms of action are prevented.
Our findings related to MlaA and CHX-resistance herein appear to be novel, however, other Mla system components have been previously identified as antimicrobial resistant contributors in various proteobacterial studies (Bernier et al., 2018; Elliott et al., 2020). MlaC, a periplasmic spanning protein component of the Mla system was previously shown to confer resistance to antimicrobial peptide arenicin-3 in uropathogenic strains of E. coli (Elliott et al., 2020). MlaC was also shown to participate in the intrinsic resistance of Burkholderia cepacia complex species, where mutants were more susceptible to Gram-positive selective antibiotics (macrolides, rifampin) as well as fluoroquinolones and tetracyclines (Bernier et al., 2018). In our study, CHXR isolates were more susceptible to cationic antiseptic QACs (CTAB and CDAB) and tobramycin which is cationic antibiotic at neutral pH (Table 2). Although we included Gram-positive selective antimicrobials rifampin, vancomycin, and macrolide erythromycin, we did not see any significant changes in MIC values for our CHXR isolates (Table 2). This may suggest that mlaA mutants we observed in our E. coli isolates may confer more selective antimicrobial resistant profiles as compared to mutations in internal mlaFEDBC system inter-membrane spanning components.
Our adaptation of E. coli K-12 to CHX did not result in colistin cross-resistant phenotypes as shown in previous studies of Klebsiella and Salmonella species (Wand et al., 2017; Hashemi et al., 2019; Verspecht et al., 2019). We did, however, identify two proteins (BasS, LpxL; Figure 5B) in our CHXR1 isolate that have been previously implicated as mechanistic contributors of colistin resistance and LPS modification (Olaitan et al., 2014). Based on our study, the alteration of only two proteins previously associated with colistin resistance was insufficient to confer colistin cross-resistance in CHX-adapted E. coli. Our findings also show that the LB growth medium we used to initially adapt E. coli K-12 only contained CHX, and as result, it generated adapted isolates with resistance exclusively to CHX and even excluded cross-resistance to the other bisbiguanide ALX we tested (Table 2). The chemical structure of ALX differs significantly from CHX as ALX possesses ethylhexane chains instead of benzene rings at the end of the biguanidine moieties. These key chemical differences likely impact how each bisbiguanide displaces or disrupts phospholipid associations and could result in different lipid-to-bisbiguanide compound configurations, thereby affecting different outer membrane systems. ALX was previously shown to have a higher affinity for LPS binding than CHX, which may be an influential factor (Zorko and Jerala, 2008). It is also important to note that species isolated from the environment are likely exposed to far more antimicrobials than the controlled conditions of our study and the lack of antimicrobial cross-resistance we observed in our CHX-adapted isolates may simply reflect controlled lab conditions. Additionally, E. coli K-12 lacks the O-antigen moiety present in most pathogenic E. coli strains and LPS antigens present in other Enterobacterial clinical isolates like Klebsiella spp. and Salmonella spp. (Rai and Mitchell, 2020). Future studies of mlaA and its role in antimicrobial resistance and antiseptic resistance can now focus on exploring other Enterobacterial species including clinical isolates, which may identify additional outer membrane contributors to intrinsic CHX-resistance and cross-resistance.
A notable finding from transcriptome and proteomic analyses show a small, but potentially important role for two acid regulatory systems in CHX resistance, specifically the GAD (gadE) system and carbohydrate diacid regulator (cdaR) (Figures 3, 4). Due to the cationic charge of CHX in solution (<pH 7), CHX can decrease pH as its concentration increases, likely triggering acid resistance system requirement. The glutamate dependent GAD system transcriptional activator gadE had increased protein abundance and transcript levels in CHXR1 multi-omics analyses (Figures 3, 4). GadE, along with GAD system regulators GadX/GadW, regulate the expression of many genes involved in pH homeostasis and acid resistance, including the efflux pump mdtEF gene which were shown to be transcriptionally up-regulated in CHXR1 (Figure 4). Complementation of pGadE in all three CHXR isolates did not alter CHX MIC values, however, deletion of ΔgadE in E. coli did increase WT resistance by 2-fold (Table 5). This suggests gadE deletions may partially contribute to CHX resistance mechanisms. Additionally, carbohydrate diacid regulator CdaR was another proteomically and transcriptomically diminished protein/transcript in CHXR1 (Figures 3, 4), that was also mutated by a single frame shifting SNVs in the CHXR1 isolate (Table 4). As we observed from AST, only pCdaR CHXR1 had a 2-fold reduced CHX MIC value (Table 5), suggesting that the loss CdaR expression can partially rescue the CHX susceptible phenotype back to WT levels. Since CdaR regulates the D-glucarate (gudPDX) and D-galactarate (garPLRK) uptake and metabolism (Monterrubio et al., 2000), the build-up of glucarate and galactarate compounds may offset the pH and osmotic stress associated with CHX exposure. Although neither gadE/cdaR gene deletion or plasmid complementations resulted in significant CHX MIC changes on their own (Table 5), it is likely that cdaR deletion or gadE up-regulation may be important additive acid regulatory systems with ΔmlaA to confer greater intrinsic CHX resistance.
Lastly, our phenotypic analysis of CHX-adapted E. coli isolates herein demonstrated that these isolates had similar or enhanced growth rates as the un-adapted WT across the rich and minimal media we tested (Figure 1, Supplementary Figures 1, 2, and Supplementary Tables 2, 3). CHXR cells were also narrower and shorter than WT cells in mid-log phase based on SEM imaging (Figure 2) and more permeant to the dead cell stain propidium iodide (Supplementary Figure 4), indicating that the cell membranes of CHXR1 are more compromised than WT. Molecular explanations for these morphological alterations are likely due to expected outer membrane phospholipid distribution problems that would be caused by the loss of functional MlaA in the CHXR isolates (as discussed above). Our growth curve analyses of WT and (ΔmlaA) revealed that the loss of mlaA increased CHXR cell CFU/mL numbers and cells grew to higher final ODs than WT but CHXR isolates did not increase doubling times significantly from WT (Supplementary Figure 6 and Supplementary Table 3). We speculate that the lack of phospholipid recycling caused by the deletion of mlaA in cells exposed to CHX, helps the cell overcome its membrane disruptive actions by providing more phospholipids for CHX to interact with, ultimately slowing CHX entry into the cell. In addition to mlaA mutations, we identified non-coding alterations to the promoter region of the transcriptional regulator fimE, which is an important type 1 fimbrial regulator (Figure 3 and Table 4). Although changes in type 1 fimbrial expression primarily impacts cell attachment, previous studies have also shown that type 1 fimbrial gene (fim) mutants can influence bacterial colony morphology (Hasman et al., 2000). Our transcriptomic analysis of CHXR1 identified that fimE was significantly down regulated in CHXR1 but fimAICDFGH operon expression was not significantly altered as compared to WT (Figure 4 and Supplementary Table 6). This might be explained by our WGS findings; all CHXR isolates had significant SNVs and indels that altered the fimS promoter region regulated by fimE, where it had a hybrid ON-OFF sequence configuration (Supplementary Figure 5). This hybrid promoter may explain the fimE and fimAICDFGH operon transcriptome results (Figure 4). Transformation of CHXR isolates with plasmids expressing fimE failed to alter their CHX MIC values (Table 5) but deletion of fimE in E. coli (JW4276-KC) did increase CHX resistance by 2-fold as compared to WT (Table 5). This suggests that similar to gadE and cdaR, fimE, and the fim operon it transcriptionally regulates may also play another small but additive role when combined with the ΔmlaA phenotype.
In conclusion, our phenotypic and multi-omics analyses of CHX-adapted E. coli K-12 isolates has identified the involvement of mlaA as an intrinsic CHX resistance contributor. The role of MlaA, the outer membrane component of the Mla retrograde phospholipid transport system, in CHX resistance is a novel finding that may have broader implications for intrinsic CHX resistance in E. coli as well as other Gram-negative bacterial species. The Mla system component MlaC, was shown to contribute to antimicrobial resistance in other proteobacterial species, such as Burkholderia (Bernier et al., 2018) highlighting the importance of this lipid transport system as a potential therapeutic antimicrobial target. When combined with our proteomic and transcriptome analysis, the findings of our study offer greater insights into the mechanism of intrinsic CHX resistance and identify many other pertinent antiseptic resistant biomarkers (yghQ, fimE, gadE, cdaR) that may be helpful for future initiatives to rapidly detect CHX-resistant phenotypes.
Chlorhexidine digluconate (CHX), as well as all other antimicrobials and chemicals used in this study were obtained from either Tokyo Chemical Industry America (United States), Millipore Sigma (United States), Fisher Scientific (United States), or VWR (Canada). E. coli K-12 BW25113 (Baba et al., 2006) was obtained from the Coli Genetic Stock Centre (CGSC3). All cultures were grown with selection when necessary in Luria-Bertani (LB) broth at 37°C with shaking at 150 revolutions per min (RPM) (WT transformants: 30 μg/mL chloramphenicol (CM); CHXR: 2 μg/mL CHX; CHXR transformants: 2 μg/mL CHX and 30 μg/mL CM).
Chlorhexidine adaptation experiments were performed in LB broth medium using a gradual adaptation sub-culturing method as described by Bore et al. (2007) with modifications. Briefly, E. coli K-12 BW25113 was initially grown overnight (18 h) from a dimethylsulfoxide (DMSO) cryopreserved stock and then diluted 10–2 into 5 mL LB containing 0.4 μg/mL CHX (20% of the WT MIC value) in triplicate. The next day, each individual culture was re-inoculated into 5 mL of fresh LB containing 0.4 μg/mL CHX and grown overnight until day 12 to expose the cultures to prolonged sub-inhibitory CHX. After day 12, cultures were exposed to increasing CHX above the MIC value of WT (2 μg/mL) for an additional 8 generations for a total of 20 days. This process generated three independent isolates: CHXR1, CHXR2, and CHXR3 (Table 1) and a summary of the CHX concentrations added to each sub-culture is shown in Supplementary Table 1. At the end of this process, adapted bacteria were cryopreserved in LB with 16% (v/v) glycerol and stored at –80°C.
A modified broth microdilution AST method (CLSI, 2012) was used to determine MIC values. Briefly, cryopreserved stocks of WT or CHX-adapted E. coli were inoculated overnight without selection, then overnight with selection. Culture turbidity was measured and standardized spectrophotometrically to obtain an optical density (OD600 nm) of 1.0 unit in LB with a Multiskan Spectrum microplate reader (Thermo Fisher Scientific, United States). The adjusted cultures were diluted 10–2 into 96-well microtiter plates containing 2-fold serial dilutions of antimicrobial in LB broth. AST for all isolates was performed in technical triplicate. A total of 22 antimicrobial compounds were included for AST and are summarized in Table 1. For antimicrobials that required solubilization in ethanol (linezolid; LZD, rifampicin; RMP, erythromycin; ERY), or DMSO (alexidine; ALX, trimethoprim-sulfamethoxazole; SXT), control plates containing the same concentration of these solvents only were used to assure the results were due to the antimicrobial. Once inoculated, all microplates were incubated overnight before OD600 nm spectrophotometric measurement. Significant increases in MIC were defined as greater than 2-fold MIC changes when compared to the WT.
Bacterial fitness was assessed for CHX-adapted isolates, WT (BW25113), and JW2343-KC (ΔmlaA) in 96-well microplate broth cultures. Microplate growth curves were set up as described for AST testing, however, CHX concentrations used in these assays were 20% of the WT strain’s MIC value (0.4 μg/mL) to compare isolates grown at identical drug exposures. Growth curves were measured spectrophotometrically over 24 h using a Synergy Neo2 Hybrid Multimode reader (Biotek, United States). Twenty-four hour growth curve experiments were repeated for each replicate tested in a variety of rich media [LB, LB plus 0.4% (w/v) glucose; LB + Glc, cation adjusted Mueller Hinton broth; MHB, Tryptic Soy broth; TSB] and minimal (minimal nine salts; M9, Davis Glucose; DG) media. To calculate the doubling time of the WT, ΔmlaA, and CHXR isolates in each media, OD600 nm values were blank subtracted and plotted on a semi-log graph; calculated values are provided in Supplementary Table 3. The linear slopes of plotted OD600 nm trendlines (R2 ≥ 0.99) were used to calculate each culture’s doubling time/growth rate in 2-min intervals. Final mean colony-forming units/mL (CFU/mL) were determined from the number of colonies produced from three biological replicates of 100 μl of diluted (10–7) E. coli 24 h culture plated on LB agar and incubated overnight (18 h) at 37°C (Supplementary Table 3).
The phenotypic stability of each CHX-adapted E. coli was assessed by repeated sub-culturing of the CHX-adapted isolates in LB without CHX over 10 days. Each day, AST against CHX was performed as described above. All stability experiments were completed in technical triplicate per isolate (Table 3).
To identify morphological anomalies between WT and CHX-adapted E. coli, SEM was performed using conditions described by Golding et al. (2016). Briefly, bacterial samples were grown with selection to an OD600 nm of 0.5 units, pelleted by microcentrifugation (30 s at 14,000 RPM) and resuspended in PBS. Once resuspended, we modified the protocol by diluting the sample 1:1000 instead of 1:10 as to not overload the filter. Each sample’s filter was washed with increasing concentrations of ethanol before being allowed to dry. Samples were mounted onto a carbon disk, put onto an aluminum stud, and contact between the stud and the filter was established using flash dry silver paint. Samples were subsequently sputtered with gold using a Quorum Q150R S (Quorum Technologies, United Kingdom). Each stud was imaged with the JCM-5700 SEM (JEOL, United States), at 5,000X magnification in five different locations on the filter to help assess overall patterns in cell imaging. Twenty bacterial cell lengths and widths were measured in five separate images for each biological replicate (n = 100) where measurements were performed using ImageJ v1.8.0 (Abràmoff et al., 2007). Statistical analysis of measured cell lengths and widths were analyzed using Prism6 v6.0 (Graphpad Software, United States) and significant differences were assessed using the Student’s t-test (P < 0.001). Two biological replicates of each WT and CHXR1-3 cells were measured by SEM, with no significant difference (P > 0.05) between each replicate. Differences between WT and CHXR1-3 in terms of average cell lengths and widths were assessed using a Student’s t-test.
Propidium iodide assays were performed as described by Gregorchuk et al. (2020) using modified live-and heat-treated cell fluorescent dye emission assays. Briefly, mid-log (OD600 nm = 0.5 units) cultures of CHXR1-3 and WT were grown as described for SEM, but these preparations were washed in cold phosphate buffered saline and resuspended to a final OD600 nm value of 0.2 units and stored on ice. Samples were divided, where half were heat-treated at 120°C for 20 min (heat-treated) and the other were not (live samples) and added to 96-well fluorescent black-walled microtiter plates containing propidium iodide at 2 μg/ml final concentration. Plates containing heat-treated and live cell preparations of CHXR and WT in biological triplicate and technical triplicate were measured in a fluorescent microplate-reader (Polarstar Optima, BMG labtech, Germany) for 30 min at 37°C taking fluorescent emission measurements at 620 nm every 5 min. RFU values were determined for live as well as heat-treated samples, which were baseline subtracted from emission values from wells lacking cells but containing PBS and dye only. RFU values for each heat-treated and live cell reparations are plotted in Supplementary Figures 4A,B. Statistical analysis was performed using Prism v6.0 (Graphpad Software, United States) software to compare significantly different RFU values between WT and CHXR1 samples using Mann–Whitney tests at P-values of < 0.05.
Genomic DNA (10–30 ng/μL) was isolated from each CHX-adapted replicate using a Purelink Microbiome DNA isolation kit (A29790, Thermo Fisher Scientific, United States) according to manufacturer’s instructions for bacterial culture DNA extraction. Genome sequencing was performed by MicrobesNG4 (United Kingdom) with an Illumina-MiSeq system (Illumina Inc., United States) at a minimum of 30X coverage. Sequencing details are found in Supplementary Table 2. Trimmed paired reads were generated and assembled in-house using the MicrobesNG pipeline with E. coli BW25113 (CP009273.1) as the mapping reference. Each sequenced CHX-adapted E. coli genome sequence is available as BioProject ID PRJNA646979 in NCBI GenBank. SNV analysis was performed using Geneious v11.1.5 software (Biomatters Ltd., New Zealand) to identify SNVs and compare DNA sequences from each CHX-adapted replicate to the reference genome. We controlled for genetic drift of the adapted isolates by eliminating any WT SNVs found in the CHX-adapted isolates. A multiple sequence alignment of genome assemblies was created from the mapped reads, and a Maximum Likelihood tree was constructed using E. coli BW25113 (NZ_CP009273) as the root sequence using PhyML v.3.3.20180621 (Guindon et al., 2010). Confidence of tree branching was determined by performing 100 bootstrap replicates and these values are indicated at each node in the dendrogram.
Proteomic analysis of the CHXR1 was performed on biological triplicate cultures grown in 4 L batches with CHX selection. Cultures were grown to a final OD600 nm = 0.5 units and were then harvested by centrifugation at 6000 RPM for 10 min in Avanti-J-E High performance centrifuge (HPC; Beckman, United States). The pellet was resuspended by wet weight in an equal volume of isolation buffer: 50 mM 3-(N-morpholino) propane sulfonic acid (MOPS), 8% v/v glycerol, 5 mM ethylenediaminetetraacetic acid (EDTA), 1 mM dithiothreitol, pH 7 and WC pellets were stored frozen at –80°C. Cytoplasmic protein extractions were performed from thawed WC pellet preparations, where pellets were thawed and a final concentration of 0.1 mM phenylmethylsulfonyl fluoride was added. This cell slurry was immediately French pressed in a 4°C chilled Thermofisher Sim Aminco 30,000 lb/in2 cylinder twice at 1,500 lb/in2 each pressing. The pressed slurry was centrifuged at 10,000 RPM in a JA-20 Beckman rotor, where the supernatant was collected and ultracentrifuged at 40,000 RPM for 90 min in a Type 70Ti rotor in a Beckman Optima XPN-100 ultracentrifuge. The supernatant was saved as the cytosolic protein fraction and protein concentrations were determined using a modified Lowry assay (Shen et al., 2013). This cytoplasmic protein extraction was stored at −80°C.
Thawed WC pellets and cytoplasmic extracted protein samples were prepared similarly as detailed below. Thawed pellets were homogenized in sterile Milli-Q water, mixed with 100 μl 0.1-mm glass beads (Scientific Industries Inc., United States), and heated for 5 min at 95°C. Cells were lysed by highspeed vortex-mixing for 3 min, followed by centrifugation at 3000 RPM for 1 min. The supernatant was collected, and another aliquot of cold sterile Milli-Q water was added to the beads, followed by 1 min of vortexing and 1 min of 3000 RPM centrifugation to pool protein supernatants from the beads. This was repeated five times total to extract the remaining proteins, which was stored at –80°C. Protein was quantified using a bicinchoninic acid (BCA) protein assay kit, with bovine serum albumin (BSA) as the standard (Pierce Protein Research Products; Thermo Fisher Scientific, United States). Hundred microgram of protein was isolated from WT and CHXR1 in biological triplicate, and digested with trypsin (Promega, United States) overnight (16–18 h) using a filter-assisted sample preparation (FASP) method described previously (Wiśniewski et al., 2009). Following digestion, all samples were dried down and reconstituted using mass spectrometry grade water to a final concentration of 1 μg/μl for LC-MS/MS analysis.
Each sample was separately analyzed using a nano-flow Easy nLC 1200 connected in-line to an Orbitrap Fusion Lumos mass spectrometer with a nanoelectrospray ion source at 2.3 kV (Thermo Fisher Scientific, United States). The peptide samples were loaded (2 μl) onto a C18-reversed phase Acclaim PepMap 100 trap column (2 cm × 75 μm, 3 μm particles; Thermo Fisher Scientific, United States) with 30 μL of buffer A (2% v/v acetonitrile, 0.1% v/v formic acid) and then separated on an Easy Spray column (50 cm long, 75 μm inner diameter, 2 μm particles; Thermo Fisher Scientific, United States). Peptides were eluted using a gradient of 2–30% buffer B (80% v/v acetonitrile, 0.1% v/v formic acid) over 100 min, 30–40% buffer B for 20 min, 40–100% buffer B for 5 min and a wash at 100% B for 10 min at a constant flow rate of 250 nl/min. Total LC-MS/MS run-time was about 175 min, including the loading, linear gradient, column wash, and the equilibration.
LC-MS/MS data was acquired using the settings described below. The most abundant precursor ions from each survey scan that could be fragmented in 1 second (s) were dynamically chosen, where each ion was isolated in the quadrupole (0.7 m/z isolation width) and fragmented by higher-energy collisional dissociation (27% normalized collision energy). The survey scans were acquired in the Orbitrap at mass over charge ratios (m/z) of 375–1500 with a target resolution of 240,000 at m/z 200, and the subsequent fragment ion scans were acquired in the ion trap at a rapid scan rate. The lower threshold for selecting a precursor ion for fragmentation was 1.5 × 10⁴. Dynamic exclusion was enabled using a m/z resistance of 10 parts per million (ppm), a repeat count of 1, and an exclusion duration of 15 s.
All spectra were processed using MaxQuant (v1.6.7, Max Planck Institute) using the imbedded Andromeda search engine. Searches were performed against a subset of the SwissProt database set to E. coli K-12 (4519 sequences). The following search parameters were used: Carbamidomethyl (C) was selected as a fixed modification, Oxidation (M) and Acetyl (Protein N-term) as variable modifications, fragment ion mass resistance of 0.5 Da, parent ion resistance of 20 ppm, and trypsin enzyme with up to two missed cleavage. False discovery rates were set up using 0.01 for peptides, 0.01 for proteins, and at least 1 razor peptide per protein. Label free quantification (LFQ) was enabled for Quantitation. Resulting LFQ intensities were imported into Perseus v1.6.5 (Max Planck Institute) (Tyanova et al., 2016). In Perseus the data was Log2 transformed. All proteins that did not have a least three valid log2 LFQ intensities from ID were filtered out. Proteins present were assessed for significance using volcano plots with a modified Student’s t-test (false discovery rate of 0.05; S0 = 0.1). Enrichment analysis of protein-to-protein interactions was performed with Cytoscape v3.7.2 (Shannon et al., 2003) using the StringApp v1.5.0 software package (Doncheva et al., 2019). To analyze functional pathways involved in adaptation, significant proteins were categorized using the KEGG pathway database with ClueGO v2.5.5 (Bindea et al., 2009) application for Cytoscape. Default parameters for KEGG analysis were used, with network specificity set at “medium” and 50% overlap of genes for the group merge.
Transcriptomic analyses were preformed with 10 mL WT and CHXR1 cultures grown to mid-log phase (OD600 nm = 0.5 units) in biological triplicate, where CHXR1 cultures were grown with CHX selection as described for proteomic analyses. Cells reaching mid-log were immediately stored on ice and total RNA was extracted using a bacterial RiboPure RNA purification isolation kit (Ambion Inc, TX, United States) according to the manufacturer’s protocol for Gram-negative bacterial extraction yielding 25–50 μg of RNA/sample. Ribosomal RNA was depleted from these samples using MICROBExpress Bacterial mRNA Enrichment kit (Ambion Inc, TX, United States) based on the manufactures recommended standard protocol. mRNA sequencing analyses were performed by LC Sciences total RNA sequencing services (StateTexas, United States) using an Illumina NovaSeq 6000 for paired-end sequencing. RNA integrity, quality control and quantification analyses were performed using an Agilent Technologies 2100 Bioanalyzer with high sensitivity DNA chip.
Transcript sequences were bioinformatically analyzed by LC Sciences using the following workflow. Raw transcript sequence reads were assembled using Cutadapt (Martin, 2011) and in-house perl scripts to remove adaptor contaminated reads, low quality bases and undetermined bases. Sequences were verified using FastQC5 and bowtie2 (Langmead and Salzberg, 2012) was used to map reads to the E. coli BW25113 genome (GenBank accession number CP009273.1). Mapped reads for each bioreplicate were assembled using StringTie software (Pertea et al., 2015) and transcriptome datasets were merged to reconstruct a comprehensive transcriptome using perl scripts and gffcompare (Pertea and Pertea, 2020). StringTie (Pertea et al., 2015) and R statistics package edgeR6 were used to estimate the expression levels of all transcripts (Supplementary Table 6). The statistical significance (p-values < 0.05) of differentially expressed mRNAs based on their log2(fold change; FC) > 1 or log2(FC) < -1 were assessed using R statistics edgeR v3.14.0 package. Agglomerative hierarchical heatmaps of selected differentially transcribed genes listed in Supplementary Table 6 was generated using R statistics software v 4.0.3 (R Development Core Team, 2008) using the heatmap.plus (Day, 2012) package (Figure 5).
Plasmid complementation assays were performed using chemical competent cell preparations of E. coli BW25113, Keio collection gene deletion mutants (listed in Table 1), and CHRX1-3 isolates using the RbCl2 protocol described in Green and Rogers (2013). ASKA collection strains AG1 (ME5305; pCA24N–), JW2343-AM (pMlaA–), JW5490-AM (pYghQ–), JW5248-AM (pMarR–), JW4276-AM (pFimE), JW3480-AM (pGadE), and JW5013-AM (pCdaR) were used to extract and purify their respective plasmid clones, using plasmid DNA extraction kits and isolation protocols from BioBasic Inc (ON, Canada). pCA23N(–) plasmids add an in-frame amino-terminal hexahistidine affinity tag to each cloned gene as described by Kitagawa et al. (2005). Plasmids were individually transformed into each E. coli strain listed above using the protocol described by Green and Rogers (2013) and transformants were selected and grown on LB medium with 30 μg/mL CM to maintain plasmid selection. Plasmids were re-isolated from each transformant to verify proper plasmid transformation. All transformants were examined using the same broth microdilution AST methods as described in sections above, at increasing CHX concentration ranges (0.5–16 μg/mL) to calculate any differences in MIC values between the transformants. All AST experiments were performed in triplicate for each transformed isolate or strain (Table 5).
The datasets presented in this study can be found in online repositories. The names of the repository/repositories and accession number(s) can be found in the article/Supplementary Material.
DCB and NC designed the study, where NC performed the adaptation experiment. NC, KG, and BG performed the AST and evaluated MIC data. KG and BG measured the growth curve data. KG measured the stability data. NC and SR performed the Genomic DNA extractions and WGS SNV identification. SR generated and analyzed the WGS phylogenetic trees. BG and SR performed the SEM imaging with DRB, SH, and TB. BG and SR prepared all proteomic samples for nano LC-MS/MS collection by PC and GW. KG, BG, and SR extracted the transcriptome RNA. DCB conducted sequencing by LC Sciences services and analyzed the data. BG and SR performed CHXR and WT plasmid transformant and gene deletion MIC testing. BG performed impermeant fluorescent dye CHXR and WT cell experiments. BG, SR, and DCB analyzed the all data and prepared manuscript figures. DCB wrote the manuscript draft in consultation with KG, BG, and SR. DCB and GZ edited the manuscript. All the authors read and approved the final manuscript.
Funding for this study was provided by Natural Sciences and Engineering Research Council of Canada (NSERC) Discovery Grant (RGPIN-2016-05891) operating funds to DCB.
The authors declare that the research was conducted in the absence of any commercial or financial relationships that could be construed as a potential conflict of interest.
We would like to thank Stuart McCorrister and the Mass Spectrometry and Proteomics Core Facility group (National Microbiology Laboratory, Public Health Agency of Canada, Winnipeg, MB, Canada) for help with proteomics data acquisition and analysis. Thanks to the Diagnostic Microscopy and Imaging group (National Microbiology Laboratory, Public Health Agency of Canada, Winnipeg, MB, Canada) for assistance with scanning electron microscopy experiments.
The Supplementary Material for this article can be found online at: https://www.frontiersin.org/articles/10.3389/fmolb.2021.659058/full#supplementary-material
Abràmoff, M. D., Magalhães, P. J., and Ram, S. J. (2007). Image Processing with ImageJ. Biophotonics Int. 11, 36–42.
Abuzaid, A., Hamouda, A., and Amyes, S. G. B. (2012). Klebsiella pneumoniae susceptibility to biocides and its association with cepA, qacΔE and qacE efflux pump genes and antibiotic resistance. J. Hosp. Infect. 81, 87–91. doi: 10.1016/j.jhin.2012.03.003
Baba, T., Ara, T., Hasegawa, M., Takai, Y., Okumura, Y., Baba, M., et al. (2006). Construction of Escherichia coli K-12 in-frame, single-gene knockout mutants: the Keio collection. Mol. Syst. Biol. 2:2006.0008. doi: 10.1038/msb4100050
Bernier, S. P., Son, S., and Surette, M. G. (2018). The Mla pathway plays an essential role in the intrinsic resistance of Burkholderia cepacia complex species to antimicrobials and host innate components. J. Bacteriol. 200:e00156-18. doi: 10.1128/JB.00156-18
Bindea, G., Mlecnik, B., Hackl, H., Charoentong, P., Tosolini, M., Kirilovsky, A., et al. (2009). ClueGO: a Cytoscape plug-in to decipher functionally grouped gene ontology and pathway annotation networks. Bioinformatics 25, 1091–1093. doi: 10.1093/bioinformatics/btp101
Bohn, C., and Bouloc, P. (1998). The Escherichia coli cmlA gene encodes the multidrug efflux pump Cmr/MdfA and is responsible for isopropyl-β-D-thiogalactopyranoside exclusion and spectinomycin sensitivity. J. Bacteriol. 180, 6072–6075.
Bore, E., Hébraud, M., Chafsey, I., Chambon, C., Skjaeret, C., Moen, B., et al. (2007). Adapted resistance to benzalkonium chloride in Escherichia coli K-12 studied by transcriptome and proteome analyses. Microbiology 153, 935–946. doi: 10.1099/mic.0.29288-0
Braoudaki, M., and Hilton, A. C. (2004). Adaptive resistance to biocides in Salmonella enterica and Escherichia coli O157 and cross-resistance to antimicrobial agents. J. Clin. Microbiol. 42, 73–78. doi: 10.1128/JCM.42.1.73
Brauner, A., Fridman, O., Gefen, O., and Balaban, N. Q. (2016). Distinguishing between resistance, tolerance and persistence to antibiotic treatment. Nat. Rev. Microbiol. 14, 320–330. doi: 10.1038/nrmicro.2016.34
Brookes, Z. L. S., Bescos, R., Belfield, L. A., Ali, K., and Roberts, A. (2020). Current uses of chlorhexidine for management of oral disease: a narrative review. J. Dent. 103:103497. doi: 10.1016/j.jdent.2020.103497
Cerf, O., Carpentier, B., and Sanders, P. (2010). Tests for determining in-use concentrations of antibiotics and disinfectants are based on entirely different concepts: “Resistance” has different meanings. Int. J. Food Microbiol. 136, 247–254. doi: 10.1016/j.ijfoodmicro.2009.10.002
Chong, Z. S., Woo, W. F., and Chng, S. S. (2015). Osmoporin OmpC forms a complex with MlaA to maintain outer membrane lipid asymmetry in Escherichia coli. Mol. Microbiol. 98, 1133–1146. doi: 10.1111/mmi.13202
Chubiz, L. M., and Rao, C. V. (2011). Role of the mar-sox-rob regulon in regulating outer membrane porin expression. J. Bacteriol. 193, 2252–2260. doi: 10.1128/JB.01382-10
Chubiz, L. M., Glekas, G. D., and Rao, C. V. (2012). Transcriptional cross talk within the mar-sox-rob regulon in Escherichia coli is limited to the rob and marRAB operons. J. Bacteriol. 194, 4867–4875. doi: 10.1128/JB.00680-12
Cieplik, F., Jakubovics, N. S., Buchalla, W., Maisch, T., Hellwig, E., and Al-Ahmad, A. (2019). Resistance toward chlorhexidine in oral bacteria-is there cause for concern? Front. Microbiol. 10:587. doi: 10.3389/fmicb.2019.00587
CLSI (2012). Methods for Dilution Antimicrobial Susceptibility Tests for Bacteria That Grow Aerobically; Approved Standard, 9th Edn. Wayne, PA: Clinical Laboratory Standards Institute.
Condell, O., Iversen, C., Cooney, S., Power, K. A., Walsh, C., Burgess, C., et al. (2012). Efficacy of biocides used in the modern food industry to control Salmonella enterica, and links between biocide resistance and resistance to clinically relevant antimicrobial compounds. Appl. Environ. Microbiol. 78, 3087–3097. doi: 10.1128/AEM.07534-11
Day, A. (2012). heatmap.plus.package: Heatmap With More Sensible Behavior. Available online at: https://cran.r-project.org/web/packages/heatmap.plus/heatmap.pdf
Doncheva, N. T., Morris, J. H., Gorodkin, J., and Jensen, L. J. (2019). Cytoscape StringApp: network analysis and visualization of proteomics data. J. Proteome Res. 18, 623–632. doi: 10.1021/acs.jproteome.8b00702
Edgar, R., and Bibi, E. (1997). MdfA, an Escherichia coli multidrug resistance protein with an extraordinarily broad spectrum of drug recognition. J. Bacteriol. 179, 2274–2280.
Ekiert, D. C., Bhabha, G., Isom, G. L., Greenan, G., Ovchinnikov, S., Henderson, I. R., et al. (2017). Architectures of lipid transport systems for the bacterial outer membrane. Cell 169, 273–285. doi: 10.1016/j.cell.2017.03.019.e17
Elliott, A. G., Huang, J. X., Neve, S., Zuegg, J., Edwards, I. A., Cain, A. K., et al. (2020). An amphipathic peptide with antibiotic activity against multidrug-resistant Gram-negative bacteria. Nat. Commun. 11:3184. doi: 10.1038/s41467-020-16950-x
Fang, C. T., Chen, H. C., Chuang, Y. P., Chang, S. C., and Wang, J. T. (2002). Cloning of a cation efflux pump gene associated with chlorhexidine resistance in Klebsiella pneumoniae. Antimicrob. Agents Chemother. 46, 2024–2028. doi: 10.1128/AAC.46.6.2024-2028.2002
Fernández-Cuenca, F., Tomás, M., Caballero-Moyano, F. J., Bou, G., Martínez-Martínez, L., Vila, J., et al. (2015). Reduced susceptibility to biocides in Acinetobacter baumannii: association with resistance to antimicrobials, epidemiological behaviour, biological cost and effect on the expression of genes encoding porins and efflux pumps. J. Antimicrob. Chemother. 70, 3222–3229. doi: 10.1093/jac/dkv262
Gadea, R., Fernández Fuentes, M. Á, Pérez Pulido, R., Gálvez, A., and Ortega, E. (2016). Adaptive resistance to phenolic biocides in bacteria from organic foods: effects on antimicrobial susceptibility and resistance to physical stresses. Food Res. Int. 85, 131–143. doi: 10.1016/j.foodres.2016.04.033
Gadea, R., Fernández Fuentes, M. Á, Pérez Pulido, R., Gálvez, A., and Ortega, E. (2017). Effects of exposure to quaternary-ammonium-based biocides on antimicrobial susceptibility and resistance to physical stresses in bacteria from organic foods. Food Microbiol. 63, 58–71. doi: 10.1016/j.fm.2016.10.037
Gilbert, P., and Moore, L. E. (2005). Cationic antiseptics: diversity of action under a common epithet. J. Appl. Microbiol. 99, 703–715. doi: 10.1111/j.1365-2672.2005.02664.x
Golding, C. G., Lamboo, L. L., Beniac, D. R., and Booth, T. F. (2016). The scanning electron microscope in microbiology and diagnosis of infectious disease. Sci. Rep. 6:26516. doi: 10.1038/srep26516
Green, R., and Rogers, E. J. (2013). Chemical transformation of E. coli. Methods Enzymol. 529, 329–336. doi: 10.1016/B978-0-12-418687-3.00028-8
Gregorchuk, B. S. J., Reimer, S. L., Beniac, D. R., Hiebert, S. L., Booth, T. F., Wuzinski, M., et al. (2020). Antiseptic quaternary ammonium compound tolerance by gram-negative bacteria can be rapidly detected using an impermeant fluorescent dye-based assay. Sci. Rep. 10:20543. doi: 10.1038/s41598-020-77446-8
Guindon, S., Dufayard, J. F., Lefort, V., Anisimova, M., Hordijk, W., and Gascuel, O. (2010). New algorithms and methods to estimate Maximum-Likelihood phylogenies: assessing the performance of PhyML 3.0. Syst. Biol. 59, 307–321. doi: 10.1093/sysbio/syq010
Hashemi, M. M., Holden, B. S., Coburn, J., Taylor, M. F., Weber, S., Hilton, B., et al. (2019). Proteomic analysis of resistance of gram-negative bacteria to chlorhexidine and impacts on susceptibility to colistin, antimicrobial peptides, and ceragenins. Front. Microbiol. 10:210. doi: 10.3389/fmicb.2019.00210
Hasman, H., Schembri, M. A., and Klemm, P. (2000). Antigen 43 and type 1 fimbriae determine colony morphology of Escherichia coli K-12. J. Bacteriol. 182, 1089–1095. doi: 10.1128/JB.182.4.1089-1095.2000
Hassan, K. A., Liu, Q., Henderson, P. J. F., and Paulsen, I. T. (2015). Homologs of the Acinetobacter baumannii aceI transporter represent a new family of bacterial multidrug efflux systems. mBio 6:e01982-14. doi: 10.1128/mBio.01982-14
Heuveling, J., Possling, A., and Hengge, R. (2008). A role for Lon protease in the control of the acid resistance genes of Escherichia coli. Mol. Microbiol. 69, 534–547. doi: 10.1111/j.1365-2958.2008.06306.x
Hommais, F., Krin, E., Coppée, J. Y., Lacroix, C., Yeramian, E., Danchin, A., et al. (2004). GadE (YhiE): a novel activator involved in the response to acid environment in Escherichia coli. Microbiology 150, 61–72. doi: 10.1099/mic.0.26659-0
Kampf, G. (2016). Acquired resistance to chlorhexidine- is it time to establish an “antiseptic stewardship” initiative? J. Hosp. Infect. 94, 213–227. doi: 10.1016/j.jhin.2016.08.018
Kampf, G. (2018). Biocidal agents used for disinfection can enhance antibiotic resistance in gram-negative species. Antibiotics 7:110. doi: 10.3390/antibiotics7040110
Kanjee, U., and Houry, W. A. (2013). Mechanisms of acid resistance in Escherichia coli. Annu. Rev. Microbiol. 67, 65–81.
Kitagawa, M., Ara, T., Arifuzzaman, M., Ioka-Nakamichi, T., Inamoto, E., Toyonaga, H., et al. (2005). Complete set of ORF clones of Escherichia coli ASKA library (a complete set of E. coli K-12 ORF archive): unique resources for biological research. DNA Res. 12, 291–299. doi: 10.1093/dnares/dsi012
Kulasekara, H. D., and Blomfield, I. C. (1999). The molecular basis for the specificity of fimE in the phase variation of type 1 fimbriae of Escherichia coli K-12. Mol. Microbiol. 31, 1171–1181. doi: 10.1046/j.1365-2958.1999.01257.x
Kurabayashi, K., Tanimoto, K., Tomita, H., and Hirakawa, H. (2017). Cooperative actions of CRP-cAMP and FNR increase the fosfomycin susceptibility of enterohaemorrhagic Escherichia coli (EHEC) by elevating the expression of glpT and uhpT under anaerobic conditions. Front. Microbiol. 8:426. doi: 10.3389/fmicb.2017.00426
Langmead, B., and Salzberg, S. L. (2012). Fast gapped-read alignment with Bowtie 2. Nat. Methods 9, 357–359. doi: 10.1038/nmeth.1923
Ma, Z., Gong, S., Richard, H., Tucker, D. L., Conway, T., and Foster, J. W. (2003). GadE (YhiE) activates glutamate decarboxylase-dependent acid resistance in Escherichia coli K-12. Mol. Microbiol. 49, 1309–1320. doi: 10.1046/j.1365-2958.2003.03633.x
Martin, M. (2011). Cutadapt removes adapter sequences from high-throughput sequencing reads. EMBnet. Journal 17, 10–12. doi: 10.14806/ej.17.1.200
Mates, A. K., Sayed, A. K., and Foster, J. W. (2007). Products of the Escherichia coli acid fitness island attenuate metabolite stress at extremely low pH and mediate a cell density-dependent acid resistance. J. Bacteriol. 189, 2759–2768. doi: 10.1128/JB.01490-06
Monterrubio, R., Baldoma, L., Obradors, N., Aguilar, J., and Badia, J. (2000). A common regulator for the operons encoding the enzymes involved in D-galactarate, D-glucarate, and D-glycerate utilization in Escherichia coli. J. Bacteriol. 182, 2672–2674. doi: 10.1128/jb.182.9.2672-2674.2000
Naparstek, L., Carmeli, Y., Chmelnitsky, I., Banin, E., and Navon-Venezia, S. (2012). Reduced susceptibility to chlorhexidine among extremely-drug-resistant strains of Klebsiella pneumoniae. J. Hosp. Infect. 81, 15–19. doi: 10.1016/j.jhin.2012.02.007
Nayyar, A. S. (2015). Chlorhexidine: a cationic bisbiguanide, membrane active drug in periodontal medicine, structure advantages and associated adverse effects, a brief communication. World J. Pharm. Pharm. Sci. 4, 370–392.
Nicoloff, H., and Andersson, D. I. (2013). Lon protease inactivation, or translocation of the lon gene, potentiate bacterial evolution to antibiotic resistance. Mol. Microbiol. 90, 1233–1248. doi: 10.1111/mmi.12429
Pertea, M., and Pertea, G. (2020). GFF Utilities: GffRead and GffCompare. F1000Res. 9:ISCB Comm J-304. doi: 10.12688/f1000research.23297.1
Pertea, M., Pertea, G. M., Antonescu, C. M., Chang, T.-C., Mendell, J. T., Salzberg, S. L., et al. (2015). StringTie enables improved reconstruction of a transcriptome from RNA-seq reads. Nat. Biotechnol. 33, 290–295. doi: 10.1038/nbt.3122
Olaitan, A. O., Morand, S., and Rolain, J. M. (2014). Mechanisms of polymyxin resistance: acquired and intrinsic resistance in bacteria. Front. Microbiol. 26:643. doi: 10.3389/fmicb.2014.00643
Rai, A. K., and Mitchell, A. M. (2020). Enterobacterial common antigen: synthesis and function of an enigmatic molecule. mBio 11:e01914-20. doi: 10.1128/mBio.01914-20
R Development Core Team (2008). R: A Language and Environment for Statistical Computing. Available online at: http://www.r-project.org
Saier, M. H., Reddy, V. S., Tsu, B. V., Ahmed, M. S., Li, C., and Moreno-Hagelsieb, G. (2016). The Transporter Classification Database (TCDB): recent advances. Nucleic Acids Res. 44, D372–D379. doi: 10.1093/nar/gkv1103
Schnetz, K., and Rak, B. (1992). IS5: a mobile enhancer of transcription in Escherichia coli. Proc. Natl. Acad. Sci. U.S.A. 89, 1244–1248. doi: 10.1073/pnas.89.4.1244
Shannon, P., Markiel, A., Ozier, O., Baliga, N. S., Wang, J. T., Ramage, D., et al. (2003). Cytoscape: a software environment for integrated models of biomolecular interaction networks. Genome Res. 13, 2498–2504. doi: 10.1101/gr.1239303
Shen, Y. X., Xiao, K., Liang, P., Ma, Y. W., and Huang, X. (2013). Improvement on the modified Lowry method against interference of divalent cations in soluble protein measurement. Appl. Microbiol. Biotechnol. 97, 4167–4178. doi: 10.1007/s00253-013-4783-3
Stiefel, P., Schmidt-Emrich, S., Maniura-Weber, K., and Ren, Q. (2015). Critical aspects of using bacterial cell viability assays with the fluorophores SYTO9 and propidium iodide. BMC Microbiol. 15:36. doi: 10.1186/s12866-015-0376-x
Strugeon, E., Tilloy, V., Ploy, M.-C., and Da Re, S. (2016). The stringent response promotes antibiotic resistance dissemination by regulating integron integrase expression in biofilms. mBio 7:e00868-16. doi: 10.1128/mBio.00868-16
Tyanova, S., Temu, T., Sinitcyn, P., Carlson, A., Hein, M. Y., Geiger, T., et al. (2016). The Perseus computational platform for comprehensive analysis of (prote)omics data. Nat. Methods 13, 731–740. doi: 10.1038/nmeth.3901
Vali, L., Dashti, A. A., El-Shazly, S., and Jadaon, M. M. (2015). Klebsiella oxytoca with reduced sensitivity to chlorhexidine isolated from a diabetic foot ulcer. Int. J. Infect. Dis. 34, 112–116. doi: 10.1016/j.ijid.2015.03.021
Verspecht, T., Rodriguez Herrero, E., Khodaparast, L., Khodaparast, L., Boon, N., Bernaerts, K., et al. (2019). Development of antiseptic adaptation and cross-adapatation in selected oral pathogens in vitro. Sci. Rep. 9:8326. doi: 10.1038/s41598-019-44822-y
Wand, M. E. E., Bock, L. J. J., Bonney, L. C. C., and Sutton, J. M. M. (2017). Mechanisms of increased resistance to chlorhexidine and cross-resistance to colistin following exposure of Klebsiella pneumoniae clinical isolates to chlorhexidine. Antimicrob. Agents Chemother. 61:e01162-16. doi: 10.1128/AAC.01162-16
Whiteway, J., Koziarz, P., Veall, J., Sandhu, N., Kumar, P., Hoecher, B., et al. (1998). Oxygen-insensitive nitroreductases: analysis of the roles of nfsA and nfsB in development of resistance to 5-nitrofuran derivatives in Escherichia coli. J. Bacteriol. 180, 5529–5539. doi: 10.1128/jb.180.21.5529-5539.1998
Wiśniewski, J. R., Zougman, A., Nagaraj, N., and Mann, M. (2009). Universal sample preparation method for proteome analysis. Nat. Methods 6, 359–362. doi: 10.1038/nmeth.1322
World Health Organization (2019). World Health Organization Model List of Essential Medicines: 21st list 2019. Geneva: WHO.
Zenno, S., Koike, H., Kumar, A. N., Jayaraman, R., Tanokura, M., and Saigo, K. (1996). Biochemical characterization of NfsA, the Escherichia coli major nitroreductase exhibiting a high amino acid sequence homology to Frp, a Vibrio harveyi flavin oxidoreductase. J. Bacteriol. 178, 4508–4514. doi: 10.1128/jb.178.15.4508-4514.1996
Keywords: chlorhexidine, retrograde phospholipid transport, disinfectant, Escherichia coli, MlaA, antiseptic resistance, multi-omics, antimicrobial resistance (AMR)
Citation: Gregorchuk BSJ, Reimer SL, Green KAC, Cartwright NH, Beniac DR, Hiebert SL, Booth TF, Chong PM, Westmacott GR, Zhanel GG and Bay DC (2021) Phenotypic and Multi-Omics Characterization of Escherichia coli K-12 Adapted to Chlorhexidine Identifies the Role of MlaA and Other Cell Envelope Alterations Regulated by Stress Inducible Pathways in CHX Resistance. Front. Mol. Biosci. 8:659058. doi: 10.3389/fmolb.2021.659058
Received: 26 January 2021; Accepted: 09 April 2021;
Published: 19 May 2021.
Edited by:
Heidi Vitrac, University of Texas Health Science Center at Houston, United StatesReviewed by:
Luke Peter Allsopp, Imperial College London, United KingdomCopyright © 2021 Gregorchuk, Reimer, Green, Cartwright, Beniac, Hiebert, Booth, Chong, Westmacott, Zhanel and Bay. This is an open-access article distributed under the terms of the Creative Commons Attribution License (CC BY). The use, distribution or reproduction in other forums is permitted, provided the original author(s) and the copyright owner(s) are credited and that the original publication in this journal is cited, in accordance with accepted academic practice. No use, distribution or reproduction is permitted which does not comply with these terms.
*Correspondence: Denice C. Bay, ZGVuaWNlLmJheUB1bWFuaXRvYmEuY2E=
Disclaimer: All claims expressed in this article are solely those of the authors and do not necessarily represent those of their affiliated organizations, or those of the publisher, the editors and the reviewers. Any product that may be evaluated in this article or claim that may be made by its manufacturer is not guaranteed or endorsed by the publisher.
Research integrity at Frontiers
Learn more about the work of our research integrity team to safeguard the quality of each article we publish.