 Zhan Chen
 Yan Lv
- Department of Urology, CR & WISCO General Hospital, Wuhan University of Science and Technology, Wuhan, China
Background: Clear cell renal cell carcinoma (ccRCC) is the most frequent and lethal type of kidney cancer. Although differential expression of cyclin-dependent kinase-like 2 (CDKL2) has been reported to be associated with tumor progression in other cancers, its prognostic value, and potential mechanism in patients with ccRCC still remain unknown.
Methods: Gene expression analysis was conducted using The Cancer Genome Atlas (TCGA), Gene Expression Omnibus, and International Cancer Genome Consortium databases. Further, clinicopathologic analysis; Kaplan–Meier survival analysis; weighted gene co-expression network analysis; gene set enrichment analysis; gene ontology enrichment; methylation; and immune infiltration analyses were performed using TCGA-kidney renal clear cell carcinoma profiles. CDKL2 translational levels were analyzed using The Human Protein Atlas database.
Results: CDKL2 expression was decreased in ccRCC samples retrieved from the four databases. Gender, survival status, histologic grade, clinical stage, TNM classification, and tumor status were closely related to CDKL2 expression. In addition, CDKL2 downregulation was an independent prognostic factor for poor prognosis in multivariate analysis. Enrichment analyses using multiple tests revealed that CDKL2 is not just closely related to immune response but this association is highly correlated as well. Further, we found that CDKL2 expression was significantly correlated with the infiltration levels of T cell CD4 memory resting; monocytes; macrophages M0, M1, and M2; dendritic cells resting; mast cells resting; plasma cells; T cell CD8; and T cell regulatory.
Conclusion: This is the first report to study the expression of CDKL2 in ccRCC, wherein we suggest that decreased CDKL2 expression is closely correlated with poor prognosis in ccRCC. We consider that CDKL2 is a novel and potential prognostic biomarker associated with immune infiltrates in ccRCC.
Introduction
In 2019, kidney cancer is the sixth and eighth most commonly diagnosed cancers in men and women, respectively. There were 73,820 Americans diagnosed with carcinoma of the kidney and renal pelvis; of them, an estimated 14,770 would die of the disease in 2019 (Siegel et al., 2019). Renal cell carcinoma (RCC) is the most frequent subtype of kidney cancer that accounts for over 90% of all renal malignancies (Lipworth et al., 2016). Further, clear cell renal cell carcinoma (ccRCC) accounts for approximately 70% of all cases of RCC. ccRCC has an extremely poor prognosis owing to its considerably high rate of metastasis, vascular invasion, recurrence, and mortality. Moreover, it easily develops resistance to radiotherapy and chemotherapy (Rini et al., 2009). Currently, standard surgical resection is widely used for effective treatment of localized tumor. However, approximately 30% of these patients are diagnosed with local invasion or distant metastasis. Moreover, about one third of them with local RCC experience tumor recurrence after nephrectomy (Escudier et al., 2016). Hence, it is extremely crucial to explore novel and more reliable and effective biomarkers that can reveal the molecular mechanisms of tumor progression, thereby improving prognosis of ccRCC and intervention benefit in patients.
CDKL2 encodes the cyclin-dependent kinase-like 2 (CDKL2) protein, also known as P56 and KKIAMRE. CDKL2 is a member of the CDC2-related serine/threonine protein kinase family and is similar to mitogen-activated protein kinase (MAPK) family based on genetics and biochemical studies. (Malumbres et al., 1996; Yeh et al., 2013; Zhou et al., 2019). It mainly accumulates in the cytoplasm, while having a relatively lower level in the nucleus. Several studies have shown that CDKL2 expressed in the nervous system plays a role in cognitive functions, emotion, and neurological disorders (Gomi et al., 1999; Sassa et al., 2000; Sassa et al., 2004; Gomi et al., 2010; Canning et al., 2018). In the Genecards database, papillary serous adenocarcinoma is included among the diseases associated with CDKL2. Moreover, recent studies have indicated that CDKL2 is associated with malignant tumors, such as prostate cancer (Rubicz et al., 2019), breast cancer (Li et al., 2014; Lindqvist et al., 2014), hepatocellular carcinoma (HCC) (Shen et al., 2012; Zhou et al., 2019), glioma (Yi et al., 2020), and gastric cancer (Fang et al., 2018).
In this study, we conducted an integrated bioinformatic investigation in kidney renal clear cell carcinoma (KIRC) cohort from the data available at The Cancer Genome Atlas (TCGA). We analyzed the expression of CDKL2 with respect to the clinicopathological features, prognostic value, and potential mechanism.
Materials and Methods
CDKL2 Expression Level Using TIMER2.0 Web Tool
TIMER2.0 is the latest web resource that includes samples of various cancer types accessible in the TCGA cohort. This tool can be used for systematic analysis of immune infiltrate signatures in different cancer types (https://cistrome.shinyapps.io/timer/) (Li et al., 2020). We used the tool’s Gene_DE in Exploration Module to evaluate the CDKL2 differential expression between normal tissues and various tumor tissues. Further, we used Gene_Outcome Module to investigate the clinical relevance of CDKL2 expression levels across different cancer types. This module uses the Cox proportional hazard model to evaluate the outcome association of gene expression.
Data Acquisition From Several Databases
We retrieved standardized gene expression data (611 cases, N = 72, T = 539, Workflow Type: HTSeq-FPKM) and their relevant clinical data profiles from the TCGA database for KIRC projects in January 2020. Next, we used the merge script of Perl 5.26.1 language to separately merge the RNA-seq and clinical data files into single matrix file. Ensemble gene IDs were transformed to official gene symbols by Perl language. To identify CDKL2 mRNA expression between tumor (N = 539) and non-cancerous kidney tissue (N = 72) samples, limma packages (Ritchie et al., 2015) were used. Further, we obtained CDKL2 expression profiles of GSE40435 (N = 101, T = 101) (Wozniak et al., 2013) and GSE53757 (N = 72, T = 72) (von Roemeling et al., 2014) from Gene Expression Omnibus (GEO) database. In addition, RCC data from International Cancer Genome Consortium (ICGC) were retrieved and CDKL2 in 45 normal and 91 tumor tissue samples were compared to identify differential expression. To identify translational levels of CDKL2, we obtained immunohistochemistry sections of ccRCC and normal tissues from The Human Protein Atlas database (HPA) (https://www.proteinatlas.org/) (Uhlen et al., 2017). Furthermore, E-MTAB-3267 dataset in ArrayExpress database ((https://www.ebi.ac.uk/arrayexpress/) was used to validation the result, there 59 samples in total, 6 sample was normal tissues and have no progression-free survival (PFS) information, the rest 53 samples were clear cell carcinoma pathological type.
Evaluation of Patient Characteristics
We obtained CDKL2 expression samples from TCGA to test diagnostic value of CDKL2. Receiver operating characteristic (ROC) curve was generated for estimating a biomarker that predicts the prognostic survival of patients. Based on multivariate logistic regression, a nomogram was accessed using “rms” (Harrell, 2020) and “foreign” (R Core Team, 2018) packages in R. Additionally, we evaluated the concordance index (c-index) and compared the nomogram-predicted estimates with Kaplan–Meier estimates of survival probability.
Co-Expression Analysis of CDKL2 Using WGCNA
To investigate the potential genes co-expressed with CDKL2, the top 1,000 remarkable positively and negatively correlated genes were extracted from TCGA-KIRC database and examined one by one using Pearson correlation test. p < 0.05 was chosen as the threshold criterion. We divided the 2000 extracted genes into different gene modules using WGCNA package (Langfelder and Horvath, 2008) of R (min Module Size = 30). We aimed to identify the relationship between the co-expressed gene module and clinical characteristics, including futime (survival time), fustat (survival status), gender, histologic grade, clinical stage, and tumor status.
Analysis of CDKL2 Methylation in ccRCC
UALCAN (Chandrashekar et al., 2017), a web tool based on TCGA cohort, was used to identify the methylation levels of CDKL2 in ccRCC and normal tissue samples. We browsed the TCGA-KIRC database at LinkedOmics (Vasaikar et al., 2018) to analyze the co-expression of genes induced by CDKL2 methylation using Pearson correlation test. Volcano map and heatmaps were generated to show the results. For further analysis, MethSurv (Modhukur et al., 2018) was chosen to perform survival analysis based on single CpG methylation of CDKL2.
Biological Processes and KEGG Analysis of Gene Modules and CDKL2 Methylation-Related Genes
Genes in the WGCNA key modules and CDKL2 methylation-related genes were subjected to Gene Ontology and Kyoto Encyclopedia of Genes and Genomes (KEGG) pathway analyses with DAVID (Huang et al., 2009a; Huang et al., 2009b) 6.8, respectively. p < 0.05 was chosen as the criterion. Oncobox (Sorokin et al., 2021) was a free and convenient webtool that can identify functional roles of the pathway components and applied it to annotate 3,044 human molecular pathways extracted from the Biocarta, Reactome, KEGG, Qiagen Pathway Central, NCI, and Human CYC databases and including 9,022 gene products.
Gene Set Enrichment Analysis of CDKL2
We used the computational method GSEA that determines statistical significance of a priori-defined set of genes and existence of concordant differences between two biological states (Mootha et al., 2003; Subramanian et al., 2005). In this study, we set the gene set permutations for each analysis a thousand times. CDKL2 expression level was used as phenotype label. The gene sets “kegg (v7.1),” “bp (v7.1),” and “hallmark (v7.1)” were retrieved from the Molecular Signatures Database; they were subjected to GSEA 4.0.3 to analyze the potential enrichment pathways and biological processes (BP). Additionally, Normalized Enrichment Scores (NESs), nom p-value, and FDR q-value in GSEA were generated to sort the enriched pathways into two phenotypes. In our study, gene sets with a nom p-value < 0.05 and an FDR q-value < 0.25 were considered remarkably enriched.
Analysis of the Relative Abundance of Tumor-Infiltrating Immune Cells
To assess the relative correlation between CDKL2 expression and TIICs, we used CIBERSORT (http://cibersort.stanford.edu/), which is a deconvolution algorithm based on gene expression. This method aided in characterizing the cell composition of complex tissues (Newman et al., 2015). Immune responses of 22 TIICs were used to evaluate the relationship between high and low CDKL2 expression groups using the CIBERSORT method. Further, we calculated the p-value of each sample according to the deconvolution algorithm.
Statistical Analysis
Statistical analyses were conducted using R software (v.3.6.1) and SPSS 22. Median value of CDKL2 expression was chosen as the cut-off value. Clinicopathological features associated with high and low CDKL2 expression groups were analyzed using the chi-square and Fisher exact tests. Additionally, correlation between CDKL2 expression and clinicopathological features was analyzed using Wilcoxon signed-rank test. Kruskal–Wallis test was used for multigroup comparison (such as tumor stage, clinical stage, and pathological grade). To estimate the influence of CDKL2 expression on survival and clinicopathological factors, overall survival (OS) in TCGA patients was assessed using Cox regression and the Kaplan–Meier method. p < 0.05 was considered significant.
Results
Differential CDKL2 Expression in ccRCC Compared to Normal Kidney Tissue Samples
We estimated CDKL2 mRNA levels in a variety of human tumors using the TIMER2.0 web tool. As shown in Figures 1A,B, CDKL2 mRNA levels in ccRCC tissue samples were lower than those in normal kidney tissue samples. Also, CDKL2 was expressed differently in tumor tissues of other organs and normal tissues, such as liver, lung, breast, brain, colon, rectum, uterus, bile duct, pancreas, stomach, and thyroid. Only in cholangiocarcinoma (CHOL) and pheochromocytoma and paraganglioma (PCPG), CDKL2 expression is up-regulated in tumor tissues. In the TIMER2.0 Gene_Outcome Module, we found that CDKL2 was most strongly associated with a decreased risk of OS (p < 0.05, z < 0). For further analysis, we assessed the CDKL2 mRNA level in ccRCC using TCGA data, where CDKL2 was downregulated in ccRCC samples as compared to normal samples (Figure 1C).
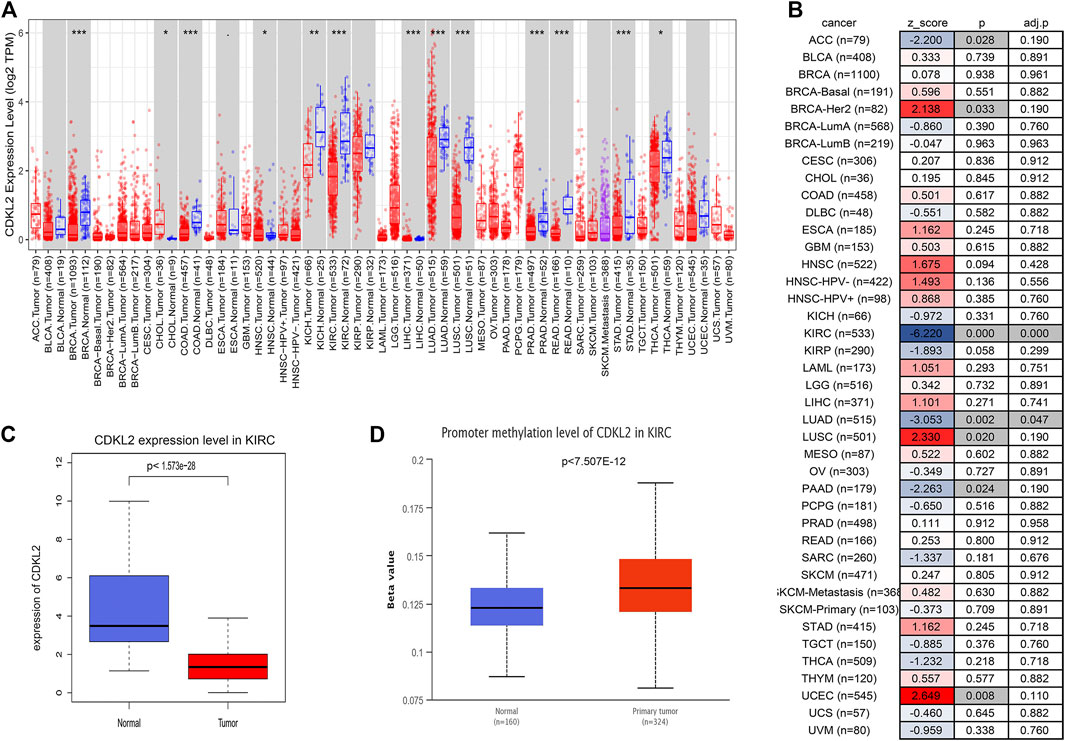
FIGURE 1. CDKL2 expression levels in different types of cancers in TCGA. (A) Human CDKL2 expression levels in different tumor types from TIMER tool. (B) Heatmap was drawn to show the normalized coefficient of the CDKL2 in Cox model from TIMER outcome module. (C) The KIRC database verified that CDKL2 gene expression was significantly downregulated in ccRCC (n = 539) compared with normal kidney tissues (n = 72), (D), The methylation level of CDKL2 in the normal kidney tissues and ccRCC tissues. *p < 0.05, **p < 0.01, ***p < 0.001.
Relationship Between CDKL2 and Clinicopathological Features in TCGA Cohort
Clinical datasets of 537 patients with ccRCC were retrieved from TCGA-KIRC database. Detailed clinicopathological information is shown in Table 1. Subsequently, all cases were divided into high and low CDKL2 expression groups based on the median value of CDKL2 expression. Gender, survival status, histologic grade, clinical stage, cancer status, and T, N, and M classification were significantly correlated with CDKL2 expression (Figure 2). Correlation between CDKL2 expression and the clinicopathologic variables of ccRCC is summarized in Table 2. Consistent with the result in Figure 2, CDKL2 expression level was highly correlated with gender, survival status, histologic grade, clinical stage, T and M classification, and tumor status.
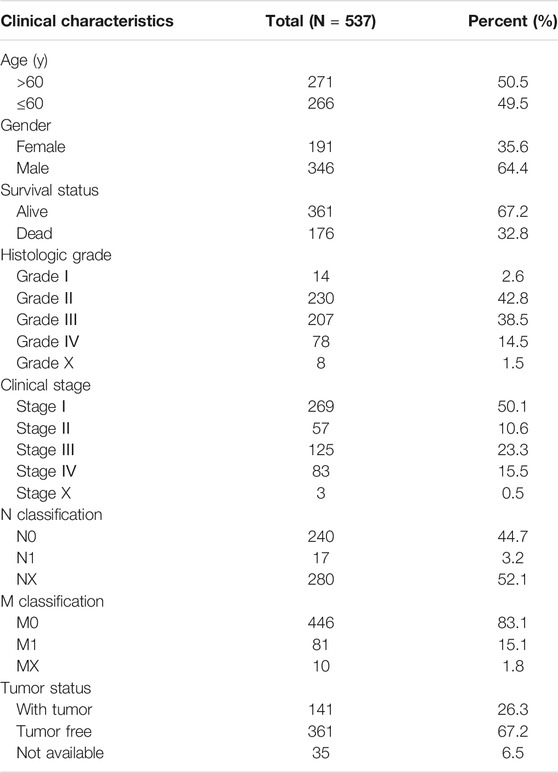
TABLE 1. TCGA-KIRC patient characteristics.
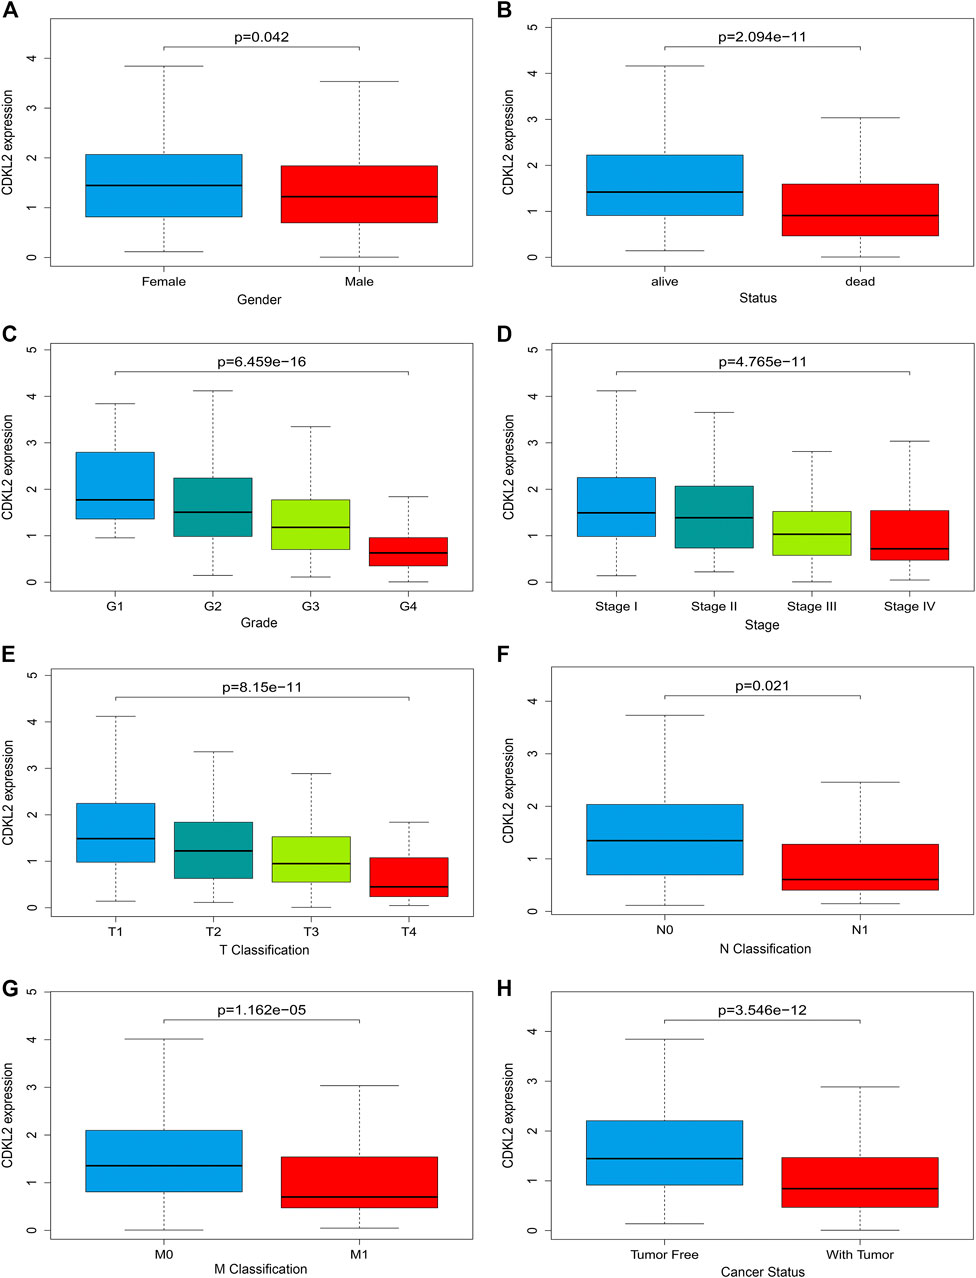
FIGURE 2. Associations between CDKL2 gene expressions and clinicopathological parameters in ccRCC. (A) Gender, (B) Patients lived status, (C) Tumor grade, (D) TNM stage, (E) T classification, (F) N classification (Lymph node metastasis), (G) M classification (Distant metastasis), (H) Cancer status (with tumor vs.tumor free).
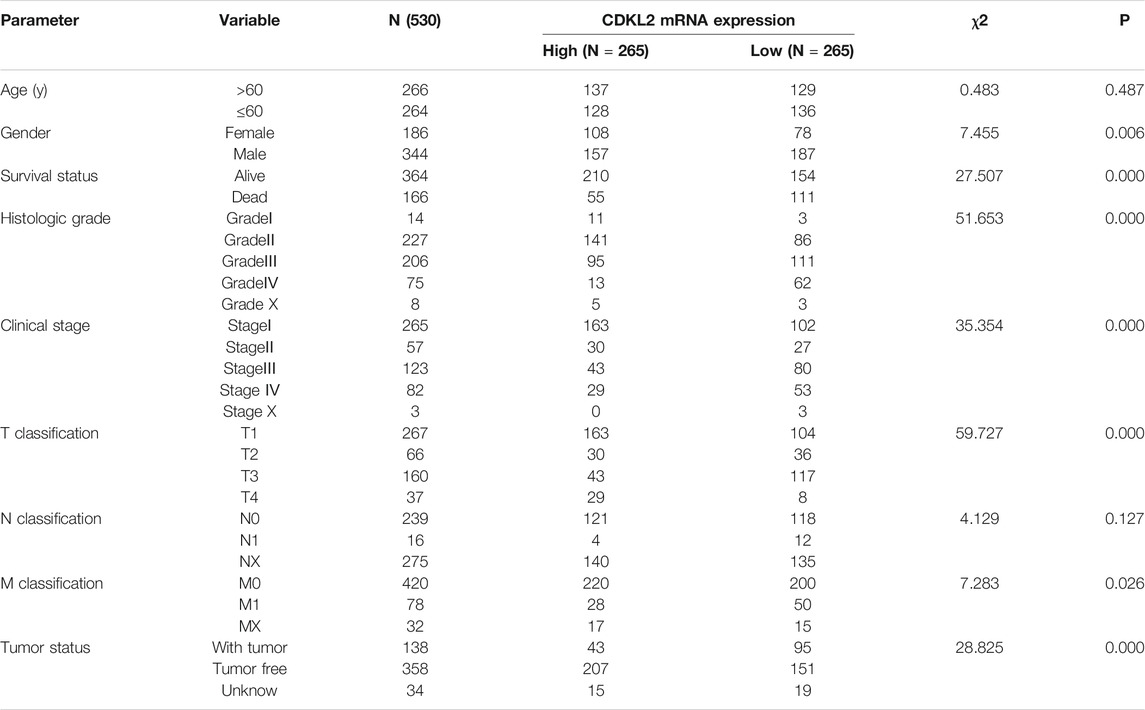
TABLE 2. Relationship between the clinicopathological characteristics and CDKL2 expression.
Low CDKL2 Expression Associated With Poor OS in Patients With ccRCC
We carried out OS analysis of CDKL2 using “survival” and “survminer” packages in R and the ROC cure was plotted using Kaplan–Meier method. The results indicated that low CDKL2 expression in ccRCC tissue samples was significantly associated with poor OS (p < 0.001; Figure 3A). Further, we performed OS analysis between CDKL2 mRNA expression and various subgroups of patients with ccRCC (Supplementary Figure S1). Furthermore, univariate Cox analysis revealed that high CDKL2 expression in ccRCC was closely associated with good OS (HR = 0.502, CI: 0.399–0.630, p < 3.217E-09). For multivariate analysis, CDKL2 correlated independently with OS (HR = 0.764, CI: 0.602–0.970, p = 0.027), along with stage and tumor status. The results are shown in Table 3. We generated the ROC curve of CDKL2, age, grade, stage and cancer-status, the area under curve (AUC) was 0.703, 0.688, 0.732, 0.767, respectively (Figure 3B). AUC of combine model (CDKL2 + age + stage + grade + cancer-status) in TCGA was 0.856. The area under ROC curve (AUC) of our CDKL2 model for overall survival suggested our model had a favorable efficiency in predicting overall prognosis. Predictive model with nomograms integrating age, gender, grade, stage, cancer status, and CDKL2 expression level in TCGA dataset was generated (Figure 4); the c-index was 0.787. To assess nomogram-predicted 1-, 3-, 5-, and 7-years survival, in Supplementary Figure S2, calibration curves were generated to indicate a good agreement between the nomogram prediction and actual survival.
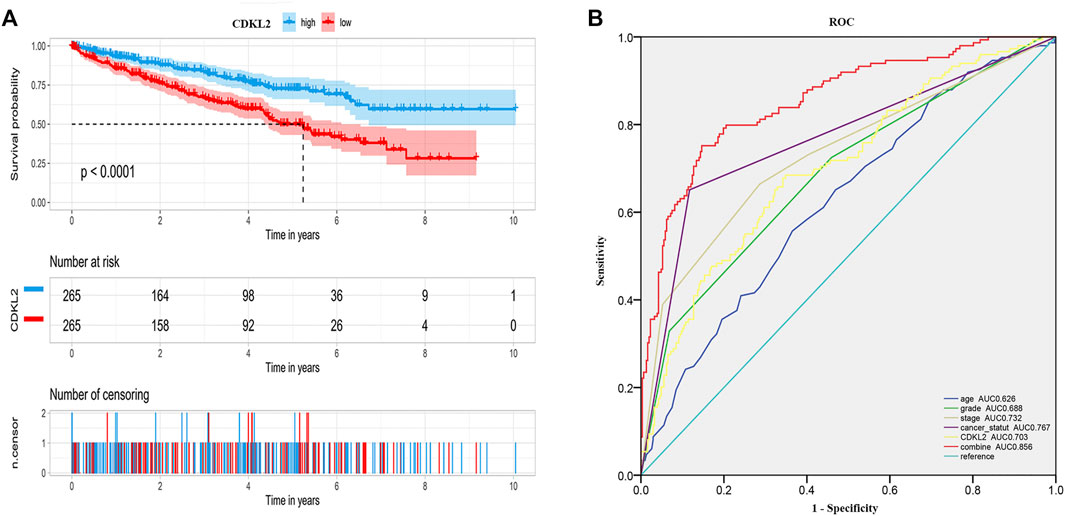
FIGURE 3. Overall survival of ccRCC patients grouped by CDKL2 median cutoff in TCGA database (A), ROC of overall survival in TCGA-KIRC (B).
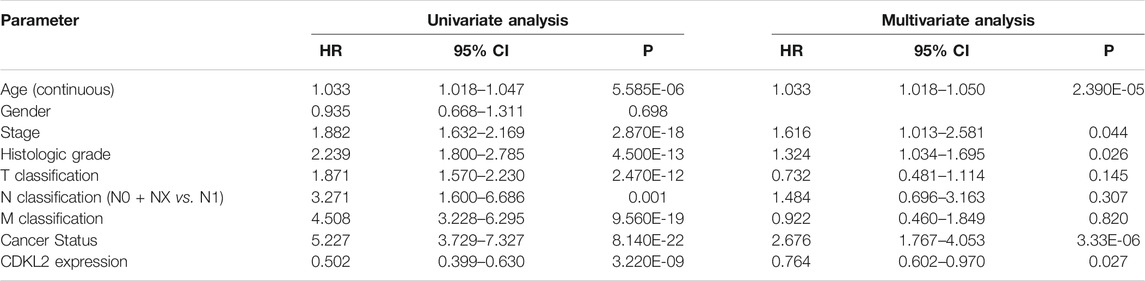
TABLE 3. Univariate analysis and multivariate analysis of the correlation of CDKL2 expression with OS among ccRCC patients.
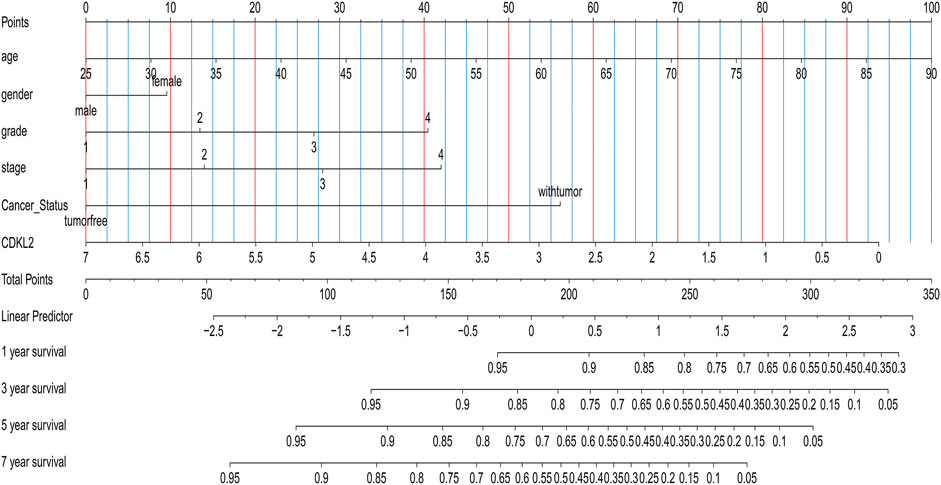
FIGURE 4. Nomogram for predicting 1-, 3-, 5-,or 7-year survival in ccRCC patients.
Co-Expression Analysis of CDKL2 and GO Enrichment Analysis
A total of 2000 correlated genes (top 1,000 positively and negatively) were subjected to construct a weighted co-expression network using WGCNA; 486 patients with complete clinical information were selected. According to the scale-free network standard, the soft threshold power value was set as 8 (Figure 5A). Blue (353 genes), brown (243 genes), green (135 genes), gray (577 genes), red (74 genes), turquoise (407 genes), and yellow (211 genes) modules were established (Figure 5B). As the module-trait correlation analysis shown in Figure 5C, the blue, brown, and turquoise modules were highly related to grade and stage (p < 0.05). Moreover, the brown and turquoise modules were related to cancer status, and the brown, yellow, turquoise modules was significantly related to survival status. Further, we performed GO enrichment analysis of the genes in the hub module. GO terms in BP results are shown in Table 4. Many genes were enriched in “SRP-dependent cotranslational protein targeting to membrane,” “NIK/NF-kappa B signaling,” “cell cycle arrest,” “apoptotic process,” “regulation of immune response,” and “T cell receptor signaling pathway,” etc. As shown in Table 5, genes were related to “Ribosome,” “Endocytosis,” “Pathways in cancer,” and “Natural killer cell mediated cytotoxicity,” in the KEGG pathway. By using Oncobox, we explored the 2000 CDKL2-relared gene (top 1,000 positively and negatively) in TCGA database to investigate their major pathway. Kidney 8.0 as the control group, and explore pathway in Biocarta (v1.2), KEGG (v1.2), KEGG (adjust1.4), Qiagen (v1.4), and Reactome (v1.3). In Biocarta, the top five pathway sort by p-value were “how does salmonella hijack a cell,” “how does salmonella hijack a cell (lamellipodium assembly),” “role of pi3k subunit p85 in regulation of actin organization and cell migration,” “y-branching of actin filaments,” and “role of pi3k subunit p85 in regulation of actin organization and cell migration (filopodium formation)”. In KEGG (v1.2), the top5 were “Pathways in cancer,” “mRNA surveillance,” “HIF-1_signaling,” “ErbB signaling,” and “Small cell lung cancer”. In KEGG (adjust1.4), the top five was “Protein export,” “Pathways in cancer”, “Proteasome,” “mRNA surveillance,” and “HIF_1_signaling”. The top5 pathway sort by p-value in Qiagen (v1.4) were “PTEN Pathway Cell Survival,” “mTOR Pathway Translation Elongation,” “PTEN Pathway Protein Synthesis,” “mTOR Pathway Autophagy,” “mTOR Pathway Mitochondria Proliferation and Function” and in Reactome (v1.3) were “Inactivation of Cdc42 and Rac,” “Bicarbonate transporters,” “HSF1 dependent transactivation,” “Activation of BIM and translocation to mitochondria,” and “Formation of the ternary complex and subsequently the 43S complex”.
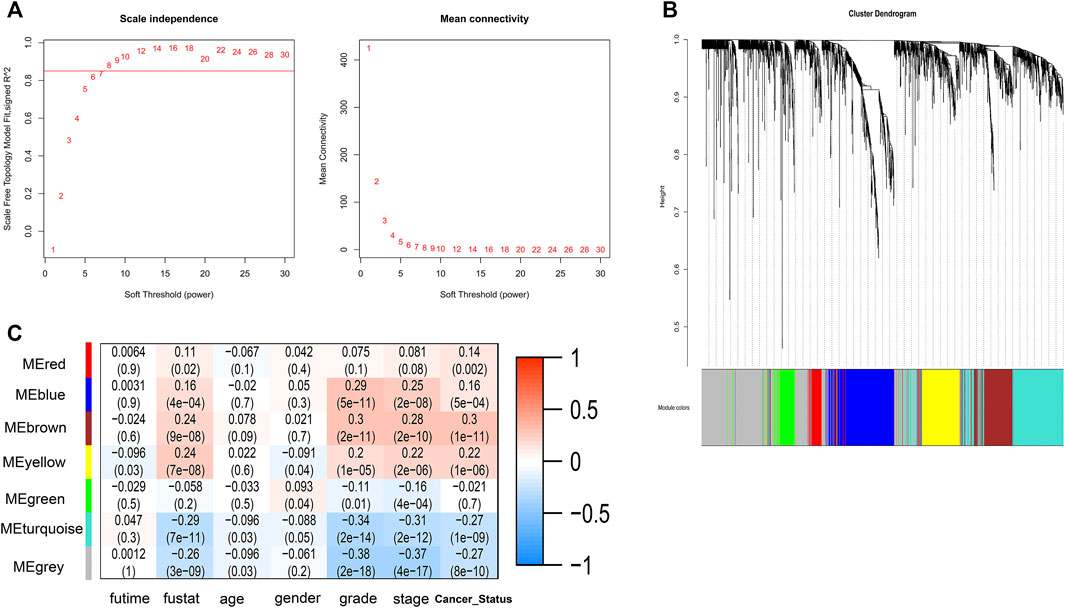
FIGURE 5. WGCNA network and module detection. (A) Selection of the soft-thresholding powers. Power 8 was chosen because the fit index curve flattened out upon reaching a high value (>0.85). (B) Cluster dendrogram and module assignment for modules from WGCNA. (C) A correlation heatmap between module eigengenes and clinical factors of ccRCC.
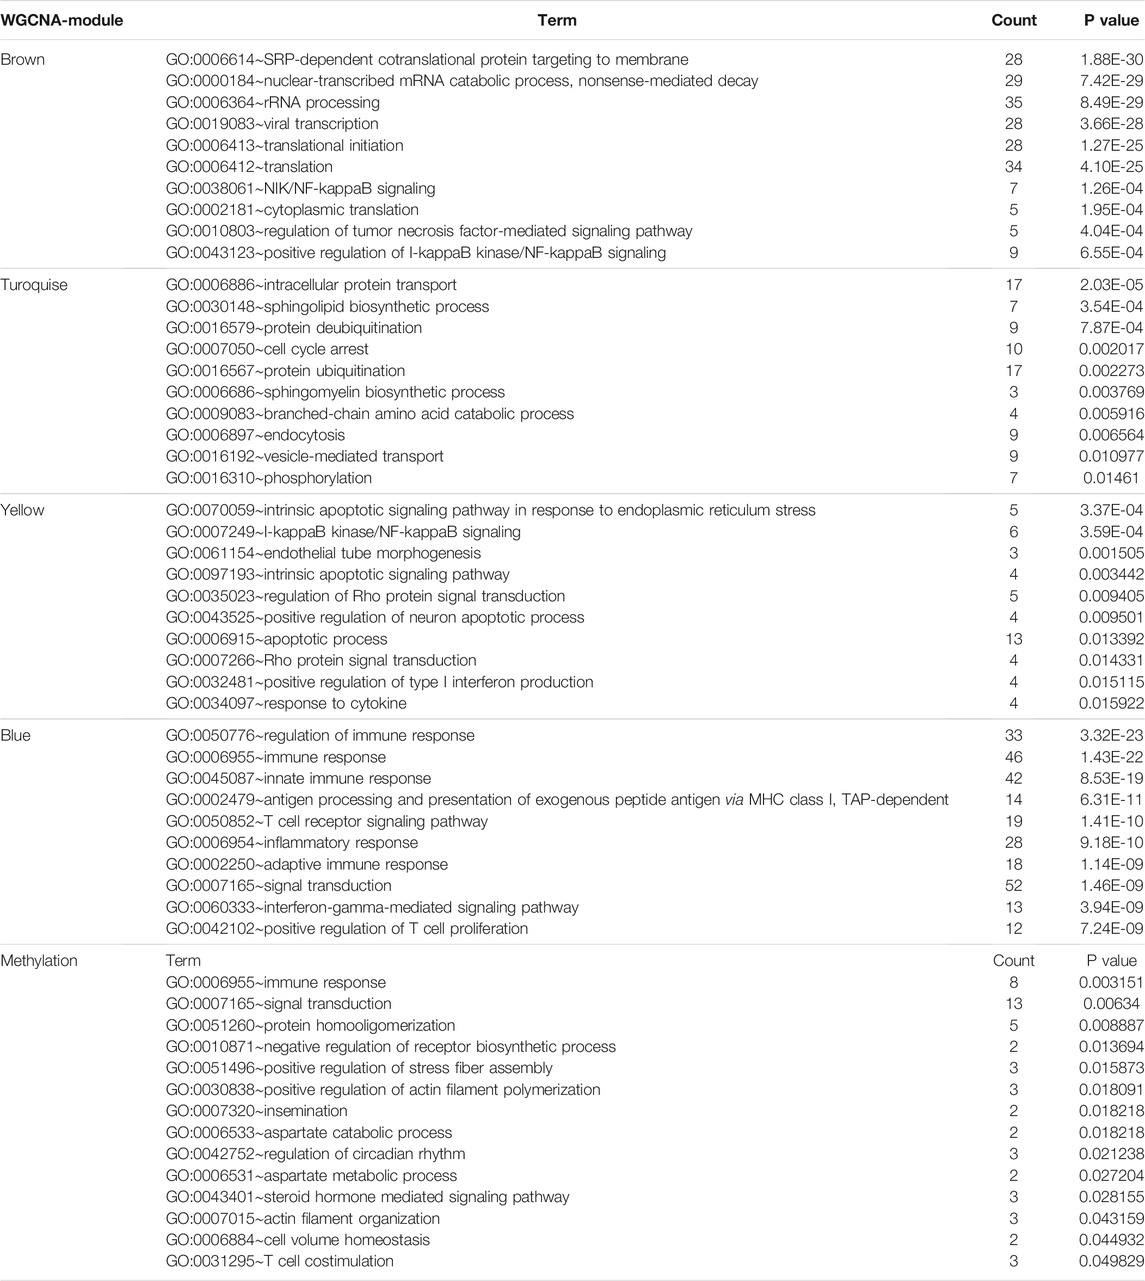
TABLE 4. Biological processes analysis of genes in the significant module traits in WCGNA and the top100 genes related to CDKL2 methylation.
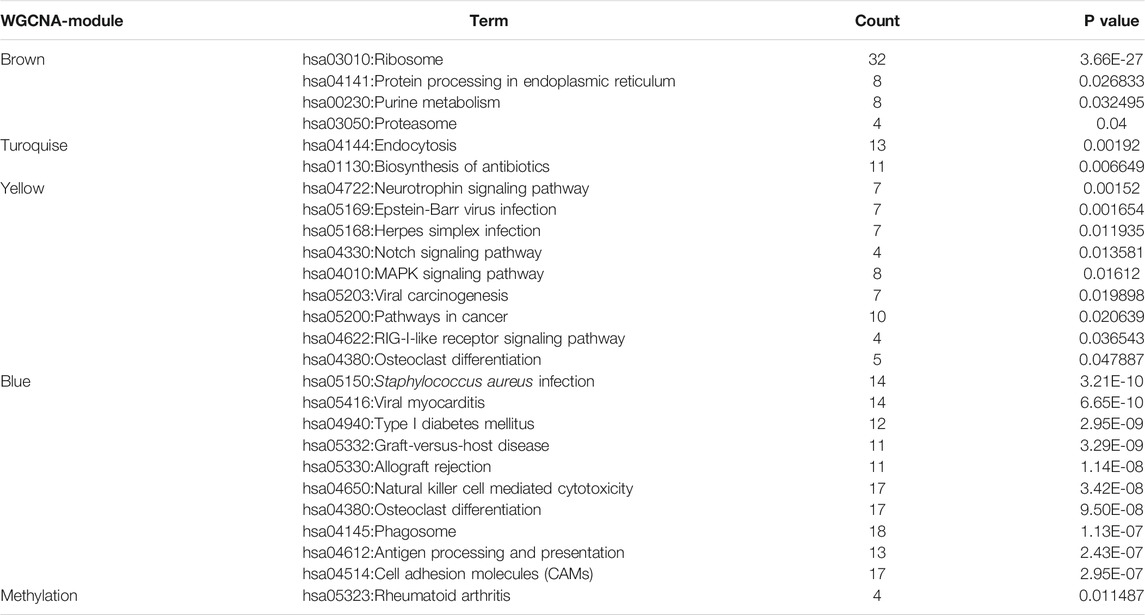
TABLE 5. KEGG analysis of genes in the significant module traits in WCGNA and the top100 genes related to CDKL2 methylation.
Analysis of CDKL2 Methylation in ccRCC and Related Genes GO Enrichment Analysis
First, we found that CDKL2 methylation level in ccRCC tissue samples was higher than that in normal tissue samples on screening against the UALCAN database (Figure 1D). Next, we used LinkedOmics to understand the co-expression genes associated with CDKL2 and its methylation related genes, as shown in the volcano maps in Supplementary Figures S3A,D. The top 50 genes positively and negatively correlated with CDKL2 in KIRC were presented in two heatmap (Supplementary Figures S3B,C). Another two heatmaps (Supplementary Figures S3E,F) show the top 50 significant genes that were positively/negatively correlated with CDKL2 methylation. Further, we explored GO enrichment analysis of the genes and found that the most significant terms in BP were “immune response,” “signal transduction,” and “protein homooligomerization.” The most highly enriched terms from KEGG analysis were “Rheumatoid arthritis.” Finally, we observed the methylation site of CDKL2 in the MethSurv network, wherein we found that cg00977384, cg14988503, cg05426966, cg14263942, cg10344081, cg03757145, cg20463808, cg24432073, and cg05982271 were significantly related to prognosis. (Table 6).
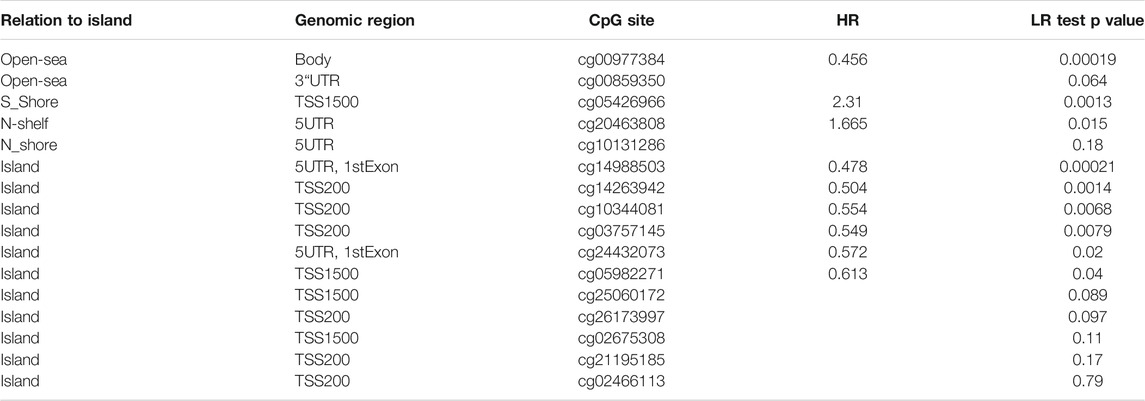
TABLE 6. The significant prognostic value of CpG sites in CDKL2 DNA methylation.
GSEA Identifies CDKL2-Related Signaling Pathway
In order to explore potential signaling pathways activated in ccRCC, we conducted GSEA between the high and low CDKL2 expression groups. To investigate potential biological processes of CDKL2, “bp V7.1” was used to perform the BP ontology analysis. In the group with low CDKL2, top 10 of gene sets that correlated were “acute inflammatory response to antigenic stimulus,” “collagen catabolic process,” “eosinophil chemotaxis,” “humoral immune response,” “eosinophil migration,” “humoral immune response mediated by circulating immunoglobulin,” “inflammatory response to antigenic stimulus,” “positive regulation to interleukin 17 production,” “regulation of inflammatory response to antigenic stimulus,” and “respiratory burst.” Gene sets associated with allograft rejection “allograft rejection,” “epithelial-mesenchymal transition,” “cardiac muscle condition,” “cytokine-cytokine receptor interaction,” “glycosaminoglycan biosynthesis chondroitin sulfate,” “hematopoietic cell lineage,” “proteasome,” and “ribosome” were differentially enriched in the CDKL2 low-expressed phenotype in KEGG and Hallmark (hallmark, v7.1) pathway analyses. Details are shown in Figures 6A,B. In summary, these results revealed that CDKL2 was closely associated with immune response.
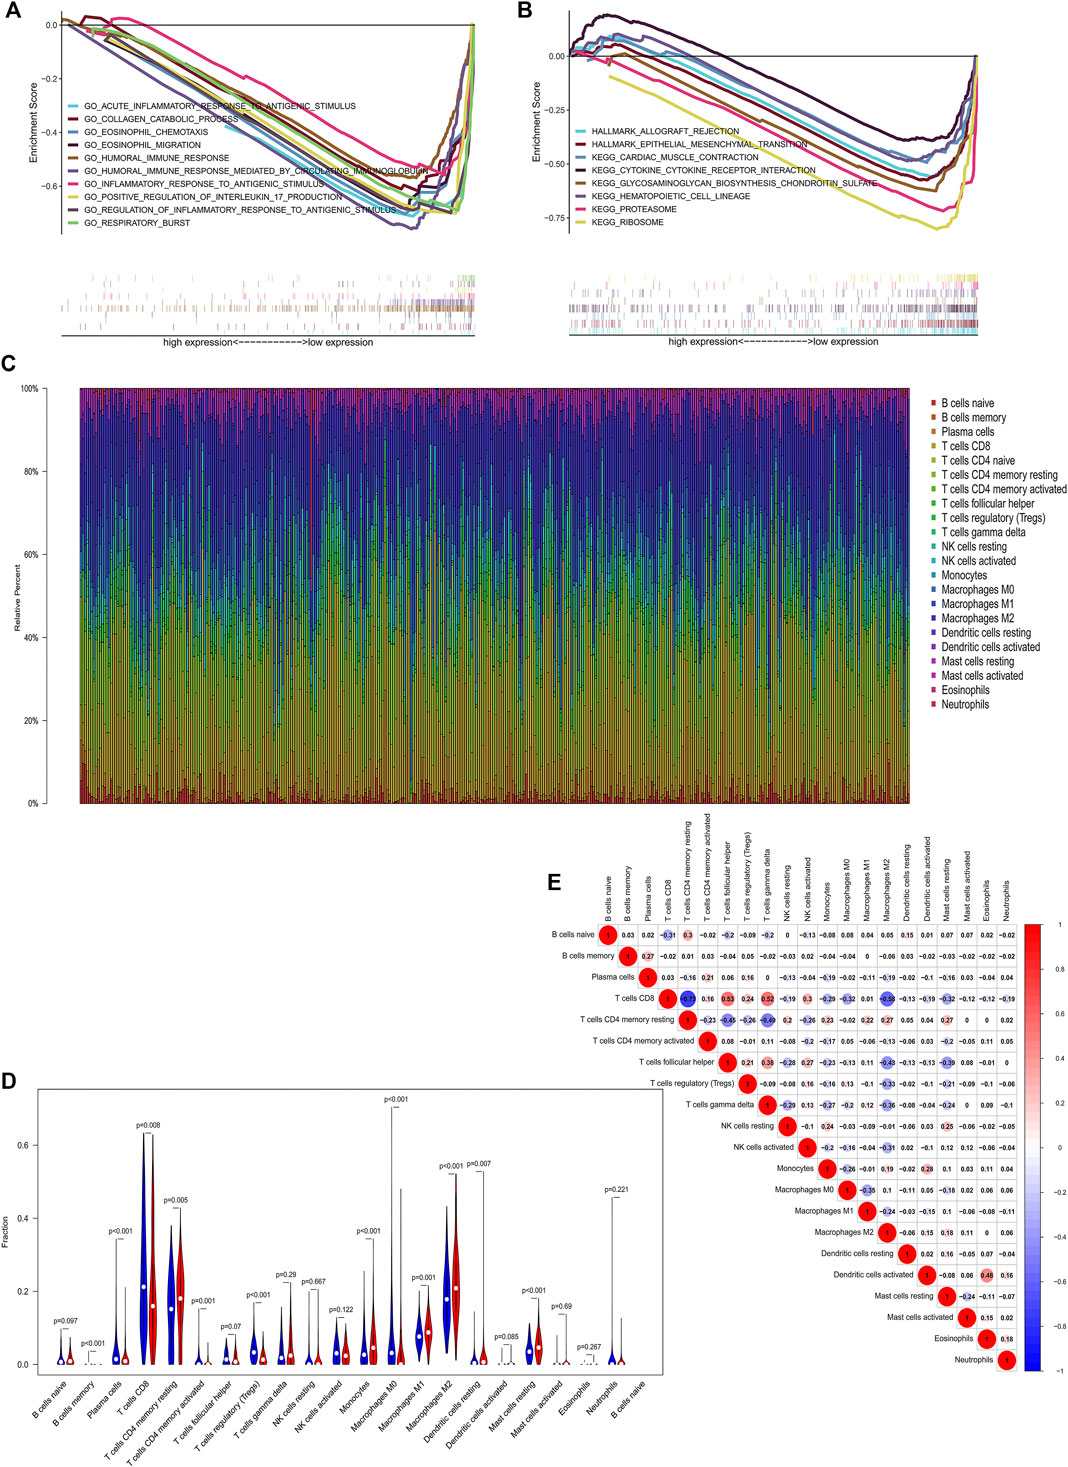
FIGURE 6. GSEA (A, B) and immune cell infiltration analysis (C–E). Enriched pathways in the Low-CDKL2 group based on GSEA. (A) Biological processes (B) Hallmark and KEGG pathway analysis. Correlations of CDKL2 expression with immune infiltration levels in the TCGA cohort. (C) Stacked bar chart representing deviations in immune infiltration in each sample. (D) Difference in proportion of each immune cell in low-CDKL2 and high-CDKL2 according to the CDKL2 expressed median value. Blue represents low-CDKL2 samples and red represents high-CDKL2 samples. (E) Correlation matrix of immune cell proportions. The red color represents positive correlation and the blue color represents negative correlation.
Tumor-Infiltrating Immune Cells
It has been previously reported that TIICs can modulate cancer progression and have an effect on survival rate (Singh et al., 2017). Infiltrating CD4+ T cells fascinate TGFβ1 expression and regulated kidney cancer cell proliferation by activating TGFβ1/YBX1/HIF2α signals (Wang et al., 2018). We investigated the relationship between CDKL2 expression and TIICs in ccRCC using the CIBERSORT method. A total of 379 tumor samples from TCGA-KIRC gene expression profiles were used to identify the subpopulation of 22 immune cells. The landscape of immune infiltrations in ccRCC provided from the three normal samples and 379 tumor samples is summarized in Figure 6C. CDKL2 samples were segregated into high (N = 190) and low (N = 189) expression groups. Proportions of the 22 immune cell subpopulations were generated from CIBERSORT results. As shown in Figure 6D, “T cells CD4 memory resting,” “Monocytes,” “Macrophages M1,” “Dendritic cells resting,” “Macrophages M2,” and “Mast cells resting” were greatly increased in the high expression group. Meanwhile, “Plasma cells,” “T cells CD8,” “T cells regulatory (Tregs),” and “Macrophages M0” were decreased in the high expression group as compared to the low expression group. Then, the proportions of 22 TIIC subpopulations had weak to strong correlations in ccRCC tissues (Figure 6E). “T cells CD8” and “T cells follicular helper” had the strongest positive correlation (cor = 0.53), while “T cells CD8” and “T cells CD4 memory resting” showed the strongest negative correlation (cor = −0.73). Moreover, “T cells CD8” had obviously positive correlation with “T cells gamma delta” (cor = 0.52) and negative correlation with “Macrophages M2” (cor = −0.58). In summary, our findings suggest that CDKL2 plays a significant role in the immune response in ccRCC.
Validation in the ICGC, HPA, and GEO Database
A total of 101 ccRCC and their matched adjacent normal kidney tissue samples in GSE40435 and 72 paired samples in GSE53757 were found to be differentially expressed using paired Student’s t-test. In ICGC, CDKL2 expression in ccRCC samples (N = 91) was downregulated compared to that in normal kidney tissue samples (N = 45). At the mRNA level, CDKL2 was significantly decreased in ccRCC tissue samples as compared to the normal kidney tissue samples in GSE53757, GSE40435, and ICGC (Figures 7A–C). Further, at the protein level, CDKL2 is decreased in KIRC tissues as compared to that in normal tissues in the HPA (Supplementary Figure S4). In E-MTAB-3267 datasets, CDKL2 has a significant difference in Normal (N = 6) vs. ccRCC (N = 53), p < 0.01, was downregulated in ccRCC, the result was consistent with the GEO, ICGC, and TCGA-KIRC datasets. According to the expression level of CDKL2, the ccRCC samples (N = 53) were divided into low CDKL2 (N = 27), and high CDKL2 (N = 26) groups, Figure 7D. Survival curves were generated using the Kaplan–Meier method, as a result, the PFS survival was generated from the E-MTAB-3267 dataset, as shown in Figure 7E, and Log-Rank p < 0.05. From this result, it can be concluded that the survival rate of samples with low CDKL2 is lower than that of samples with high CDKL2 in the ccRCC. In addition, these results are consistent with previous results in TCGA-KIRC.
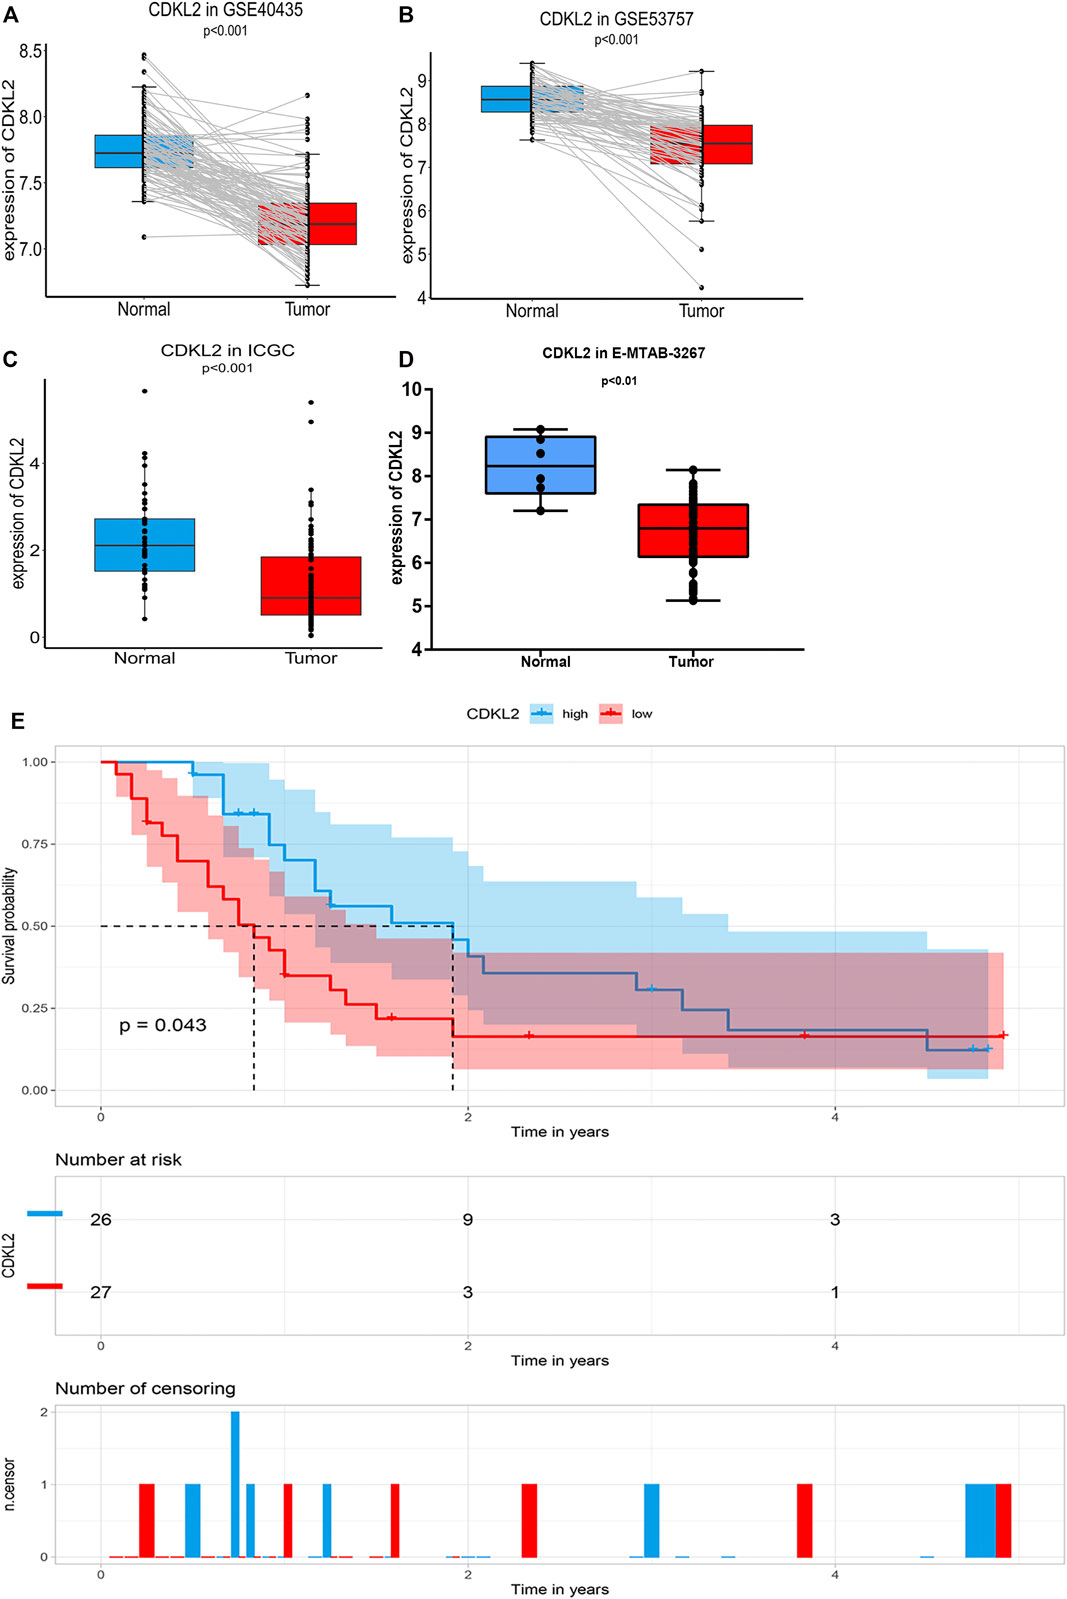
FIGURE 7. Verification CDKL2 expression in ccRCC tissue and normal kidney tissues. [Figure (A,B)] Differential CDKL2 mRNA expression between ccRCC and its’ matched normal kidney tissues in the GSE53757 [(Figure 7A, N = 72) and GSE40435 (Figure 7B, N = 101), respectively. (C) Differential CDKL2 mRNA expression between normal tissues and ccRCC in ICGC database [Figure (C)] and E-MTAB-3267. [Figure (D)]. Figure (E) indicate Kaplan–Meier survival (PFS) analysis of E-MTAB-3267.
Discussion
Cell cycle is regulated at the G1/S and G2/M checkpoints by proteins, such as cyclin-dependent kinases (CDKs) and cyclins (Lundberg and Weinberg, 1999). CDKL family is considered as a separate branch of the CDK family, identified by biochemical and genetic methods (Malumbres et al., 1996; Malumbres et al., 2009). CDKL2 is a member of a large family of CDC2-related serine/threonine protein kinases. Although several studies till date have revealed that CDKL2 is essential for tumorigenesis and development, its role in cancer seems to be intricate without deep understanding. To date, only one published study by Li and colleagues (Li et al., 2014) revealed the involvement of CDKL2 in cancers, wherein they reported that expression of CDKL2 was remarkably higher in human breast cancer tissues and cells than that in their normal counterparts. In human invasive breast cancers, overexpression of CDKL2 had a significantly shorter OS time. In addition, CDKL2 promotes epithelial-mesenchymal transition and increases CD44-high mesenchymal cell subpopulation by upregulating ZEB1 expression. Their results suggested that CDKL2 serves as a carcinogenic gene in breast cancer, promoting epithelial-mesenchymal transition and tumor progression. However, the detailed data from their research are not coherent with those described in the Oncomine database. Further, Lindqvist et al. (2014) reported that CDKL2 was hypermethylated in tumors and its expression was downregulated in HER2+ breast cancer tissues compared to the normal tissues. Similar to most studies, CDKL2 was considered a tumor suppressor gene and its upregulated expression was suggested to inhibit cancer cell proliferation and invasion. In gastric cancer (Fang et al., 2018), loss of CDKL2 expression was significantly correlated with clinicopathological characteristics (such as pathologic staging, histologic type, and grade); moreover, it could shorten patient disease-free survival and OS. Likewise, a study that included 151 glioma and 34 para-carcinoma tissues was analyzed by qPCR, western blot, and immunohistochemistry. They reported that the expression of CDKL2 in glioma tissues was significantly lower than that in non-cancerous brain tissues (Yi et al., 2020). In addition, decreased CDKL2 expression predicted an evidently poor OS in glioma. Further, Zhou et al. (2019) investigated CDKL2 expression levels in 178 HCC, 169 adjacent non-cancerous, and 24 normal liver tissues. They reported that compared to normal liver tissues, CDKL2 mRNA expression was downregulated in HCC cell lines and tumor tissues, which was inversely related to DNA methylation, suggesting that CDKL2 methylation may be involved in tumorigenesis and progression. Besides, CDKL2 expression can be upregulated by treating HCC cell lines with 5-aza-2-deoxycytidine. Rubicz et al. (2019) reported a high methylation level in the promoter region of CDKL2 and a corresponding decrease in mRNA levels in patients with more aggressive prostate cancer. Zhao et al. (2019) found that in HeLa cells, HSV-2- encoded miRNA-H4 regulates cell cycle progression and actinomycin D. Further, targeting CDKL2 and CDKN2A induced apoptosis in these cells. In the recent time, Ruan et al. (2020) constructed a renal clear cell carcinoma model containing CDKL2, LRFN1, STAT2 and SOWAHB in KIRC, and also verified that CDKL2 is low in renal clear cell carcinoma and is associated with prognosis, but there is no further research on CDKL2 related methylation site, GO enrichment analysis of related genes, clinical application of nomogram, and potential mechanism related to immunity.
In this study, we performed a series of bioinformatic analyses on the publicly available ccRCC database for elucidating the expression of CDKL2. First, we identified that CDKL2 mRNA expression levels were notably decreased in ccRCC tissues as compared to normal kidney tissues. This result was in concurrence with the abovementioned cases of gastric cancer, HCC, and glioma. Further, we studied the correlation between CDKL2 and clinicopathological features. In this subgroup analysis, CDKL2 downregulation was associated with certain clinicopathological factors including gender, poor tumor grade, advanced TNM stages, positive nodal invasion, metastasis, tumor status, and survival of patients with ccRCC. We found that decreased CDKL2 expression was linked to poor prognosis. By generating ROC curves, we found that CDKL2 could be a prognostic marker for the OS of patients with ccRCC. At the same time, we obtained CDKL2 as an independent prognostic factor for ccRCC through Cox analysis. Based on CDKL2 expression levels and clinical factors, we generated a nomogram to predict the OS rate of patients with ccRCC. To further investigate its mechanism in ccRCC, genes associated with CDKL2, including WGCNA and methylation, were analyzed. Functional enrichment analysis showed that CDKL2 is mainly enriched in immune responses. Based on these results, we suggest that low expression of CDKL2 may be linked to immunity in ccRCC. Moreover, we simultaneously revealed that multiple immune cell infiltrations were associated with the differential expression of CDKL2 in ccRCC by CIBERSORT. The result indicated that expression of CDKL2 is closely correlated with the infiltration levels of a variety of immune cells. Although we used several databases to validate the results that adds merits to the present study, there is a major limitation associated. Briefly, we did not perform experimental research for exploring potential mechanisms of CDKL2 in ccRCC and their correlation with immune cell infiltrations. Further, our future prospects include not only bioinformatic analyses but in vitro and/or in vivo experiments as well, to strengthen the findings of the present study.
Our findings may guide us to further investigate the importance/association of CDKL2 in ccRCC, the potential mechanism of CDKL2 expression, and immune interaction in tumor development and progression. In addition, CDKL2 may be a favorable biomarker for diagnosis and treatment of ccRCC in the future.
Data Availability Statement
Publicly available datasets were analyzed in this study. This data can be found here: TCGA (https://portal.gdc.cancer.gov), ICGC (https://icgc.org/), NCBI Gene Expression Omnibus (GSE40435 and GSE53757), and ArrayExpress (E-MTAB-3267).
Author Contributions
ZC: data curation, writing-initial draft preparation. YL and ZW: methodology. ZC, SW, LH, and ZW: software analysis. All authors have contributed to the article and approved the submitted version.
Conflict of Interest
The authors declare that the research was conducted in the absence of any commercial or financial relationships that could be construed as a potential conflict of interest.
Publisher’s Note
All claims expressed in this article are solely those of the authors and do not necessarily represent those of their affiliated organizations, or those of the publisher, the editors and the reviewers. Any product that may be evaluated in this article, or claim that may be made by its manufacturer, is not guaranteed or endorsed by the publisher.
Acknowledgments
We would like to thank Editage (www.editage.cn) for English language editing.
Supplementary Material
The Supplementary Material for this article can be found online at: https://www.frontiersin.org/articles/10.3389/fmolb.2021.657672/full#supplementary-material
Abbreviations
ccRCC, clear cell renal cell carcinoma; GEO, gene expression omnibus; GO, gene ontology; GSEA, gene set enrichment analysis; HCC, hepatocellular carcinoma; HPA, human protein atlas; ICGC, international cancer genome consortium; KEGG, kyoto encyclopedia of genes and genomes; KIRC, kidney renal clear cell carcinoma; OS, overall survival; RCC, renal cell carcinoma; TCGA, the cancer genome atlas; TIICs, tumor-infiltrating immune cells.
References
Canning, P., Park, K., Gonçalves, J., Li, C., Howard, C. J., Sharpe, T. D., et al. (2018). CDKL Family Kinases Have Evolved Distinct Structural Features and Ciliary Function. Cel Rep. 22 (4), 885–894. doi:10.1016/j.celrep.2017.12.083
Chandrashekar, D. S., Bashel, B., Balasubramanya, S. A. H., Creighton, C. J., Ponce-Rodriguez, I., Chakravarthi, B. V. S. K., et al. (2017). UALCAN: A Portal for Facilitating Tumor Subgroup Gene Expression and Survival Analyses. Neoplasia 19 (8), 649–658. doi:10.1016/j.neo.2017.05.002
Escudier, B., Porta, C., Schmidinger, M., Rioux-Leclercq, N., Bex, A., Khoo, V., et al. (2016). Renal Cell Carcinoma: ESMO Clinical Practice Guidelines for Diagnosis, Treatment and Follow-Up. Ann. Oncol. 27 (Suppl. 5), v58–v68. doi:10.1093/annonc/mdw328
Fang, C. L., Uen, Y. H., Chen, H. K., Hseu, Y. C., Lin, C. C., Hung, S. T., et al. (2018). Loss of Cyclin‐dependent Kinase‐like 2 Predicts Poor Prognosis in Gastric Cancer, and its Overexpression Suppresses Cells Growth and Invasion. Cancer Med. 7 (7), 2993–3002. doi:10.1002/cam4.1577
Gomi, H., Sassa, T., Thompson, R. F., and Itohara, S. (2010). Involvement of Cyclin-dependent Kinase-like 2 in Cognitive Function Required for Contextual and Spatial Learning in Mice. Front. Behav. Neurosci. 4, 17. doi:10.3389/fnbeh.2010.00017
Gomi, H., Sun, W., Finch, C. E., Itohara, S., Yoshimi, K., and Thompson, R. F. (1999). Learning Induces a CDC2-Related Protein Kinase, KKIAMRE. J. Neurosci. 19 (21), 9530–9537. doi:10.1523/JNEUROSCI.19-21-09530.1999
Harrell, F. E. (2020). Regression Modeling Strategies. R Package Version 6.0-1. Available athttp://CRAN.R-project.org/package=rms.
Huang, D. W., Sherman, B. T., and Lempicki, R. A. (2009). Bioinformatics Enrichment Tools: Paths toward the Comprehensive Functional Analysis of Large Gene Lists. Nucleic Acids Res. 37 (1), 1–13. doi:10.1093/nar/gkn923
Huang, D. W., Sherman, B. T., and Lempicki, R. A. (2009). Systematic and Integrative Analysis of Large Gene Lists Using DAVID Bioinformatics Resources. Nat. Protoc. 4 (1), 44–57. doi:10.1038/nprot.2008.211
Langfelder, P., and Horvath, S. (2008). WGCNA: an R Package for Weighted Correlation Network Analysis. BMC Bioinformatics 9, 559. doi:10.1186/1471-2105-9-559
Li, L., Liu, C., Amato, R. J., Chang, J. T., Du, G., and Li, W. (2014). CDKL2 Promotes Epithelial-Mesenchymal Transition and Breast Cancer Progression. Oncotarget 5 (21), 10840–10853. doi:10.18632/oncotarget.2535
Li, T., Fu, J., Zeng, Z., Cohen, D., Li, J., Chen, Q., et al. (2020). TIMER2.0 for Analysis of Tumor-Infiltrating Immune Cells. Nucleic Acids Res. 48 (W1), W509–W514. doi:10.1093/nar/gkaa407
Lindqvist, B. M., Wingren, S., Motlagh, P. B., and Nilsson, T. K. (2014). Whole Genome DNA Methylation Signature of HER2-Positive Breast Cancer. Epigenetics 9 (8), 1149–1162. doi:10.4161/epi.29632
Lipworth, L., Morgans, A. K., Edwards, T. L., Barocas, D. A., Chang, S. S., Herrell, S. D., et al. (2016). Renal Cell Cancer Histological Subtype Distribution Differs by Race and Sex. BJU Int. 117 (2), 260–265. doi:10.1111/bju.12950
Lundberg, A. S., and Weinberg, R. A. (1999). Control of the Cell Cycle and Apoptosis. Eur. J. Cancer 35 (14), 1886–1894. doi:10.1016/s0959-8049(99)00292-0
Malumbres, C. A., Wysk, M., and Davis, R. J. (1996). Molecular Cloning of the Epidermal Growth Factor-Stimulated Protein Kinase P56 KKIAMRE. Oncogene 13 (12), 2563–2574.
Malumbres, M., Harlow, E., Hunt, T., Hunter, T., Lahti, J. M., Manning, G., et al. (2009). Cyclin-dependent Kinases: a Family Portrait. Nat. Cel Biol 11 (11), 1275–1276. doi:10.1038/ncb1109-1275
Modhukur, V., Iljasenko, T., Metsalu, T., Lokk, K., Laisk-Podar, T., and Vilo, J. (2018). MethSurv: a Web Tool to Perform Multivariable Survival Analysis Using DNA Methylation Data. Epigenomics 10 (3), 277–288. doi:10.2217/epi-2017-0118
Mootha, V. K., Lindgren, C. M., Eriksson, K.-F., Subramanian, A., Sihag, S., Lehar, J., et al. (2003). PGC-1α-responsive Genes Involved in Oxidative Phosphorylation Are Coordinately Downregulated in Human Diabetes. Nat. Genet. 34 (3), 267–273. doi:10.1038/ng1180
Newman, A. M., Liu, C. L., Green, M. R., Gentles, A. J., Feng, W., Xu, Y., et al. (2015). Robust Enumeration of Cell Subsets from Tissue Expression Profiles. Nat. Methods 12 (5), 453–457. doi:10.1038/nmeth.3337
R Core Team (2018). Package ‘foreign. Available athttps://cran.r-project.org/src/contrib/Archive/foreign/.
Rini, B. I., Campbell, S. C., and Escudier, B. (2009). Renal Cell Carcinoma. The Lancet 373 (9669), 1119–1132. doi:10.1016/S0140-6736(09)60229-4
Ritchie, M. E., Phipson, B., Wu, D., Hu, Y., Law, C. W., Shi, W., et al. (2015). Limma powers Differential Expression Analyses for RNA-Sequencing and Microarray Studies. Nucleic Acids Res. 43 (7), e47. doi:10.1093/nar/gkv007
Ruan, B., Feng, X., Chen, X., Dong, Z., Wang, Q., Xu, K., et al. (2020). Identification of a Set of Genes Improving Survival Prediction in Kidney Renal Clear Cell Carcinoma through Integrative Reanalysis of Transcriptomic Data. Dis. Markers 2020, 1–20. Published 2020 Oct 13. doi:10.1155/2020/8824717
Rubicz, R., Zhao, S., Geybels, M., Wright, J. L., Kolb, S., Klotzle, B., et al. (2019). DNA Methylation Profiles in African American Prostate Cancer Patients in Relation to Disease Progression. Genomics 111 (1), 10–16. doi:10.1016/j.ygeno.2016.02.004
Sassa, T., Gomi, H., and Itohara, S. (2004). Postnatal Expression of Cdkl2 in Mouse Brain Revealed by LacZ Inserted into the Cdkl2 Locus. Cel Tissue Res. 315 (2), 147–156. doi:10.1007/s00441-003-0828-8
Sassa, T., Gomi, H., Sun, W., Ikeda, T., Thompson, R. F., and Itohara, S. (2000). Identification of Variants and Dual Promoters of Murine Serine/threonine Kinase KKIAMRE. J. Neurochem. 74 (5), 1809–1819. doi:10.1046/j.1471-4159.2000.0741809.x
Shen, J., Wang, S., Zhang, Y.-J., Kappil, M., Wu, H.-C., Kibriya, M. G., et al. (2012). Genome-wide DNA Methylation Profiles in Hepatocellular Carcinoma. Hepatology 55 (6), 1799–1808. doi:10.1002/hep.25569
Siegel, R. L., Miller, K. D., and Jemal, A. (2019). Cancer Statistics, 2019. CA A. Cancer J. Clin. 69 (1), 7–34. doi:10.3322/caac.21551
Singh, R., Mishra, M. K., and Aggarwal, H. (2017). Inflammation, Immunity, and Cancer. Mediators Inflamm. 2017, 1. doi:10.1155/2017/6027305
Sorokin, M., Borisov, N., Kuzmin, D., Gudkov, A., Zolotovskaia, M., Garazha, A., et al. (2021). Algorithmic Annotation of Functional Roles for Components of 3,044 Human Molecular Pathways. Front. Genet. 12, 617059. Published 2021 Feb 9. doi:10.3389/fgene.2021.617059
Subramanian, A., Tamayo, P., Mootha, V. K., Mukherjee, S., Ebert, B. L., Gillette, M. A., et al. (2005). Gene Set Enrichment Analysis: a Knowledge-Based Approach for Interpreting Genome-wide Expression Profiles. Proc. Natl. Acad. Sci. 102 (43), 15545–15550. doi:10.1073/pnas.0506580102
Uhlen, M., Zhang, C., Lee, S., Sjöstedt, E., Fagerberg, L., Bidkhori, G., et al. (2017). A Pathology Atlas of the Human Cancer Transcriptome. Science 357 (6352), eaan2507. doi:10.1126/science.aan2507
Vasaikar, S. V., Straub, P., Wang, J., and Zhang, B. (2018). LinkedOmics: Analyzing Multi-Omics Data within and across 32 Cancer Types. Nucleic Acids Res. 46 (D1), D956–D963. doi:10.1093/nar/gkx1090
von Roemeling, C. A., Radisky, D. C., Marlow, L. A., Cooper, S. J., Grebe, S. K., Anastasiadis, P. Z., et al. (2014). Neuronal Pentraxin 2 Supports clear Cell Renal Cell Carcinoma by Activating the AMPA-Selective Glutamate Receptor-4. Cancer Res. 74 (17), 4796–4810. doi:10.1158/0008-5472.CAN-14-0210
Wang, Y., Wang, Y., Xu, L., Lu, X., Fu, D., Su, J., et al. (2018). CD4 + T Cells Promote Renal Cell Carcinoma Proliferation via Modulating YBX1. Exp. Cel Res. 363 (1), 95–101. doi:10.1016/j.yexcr.2017.12.026
Wozniak, M. B., Le Calvez-Kelm, F., Abedi-Ardekani, B., Byrnes, G., Durand, G., Carreira, C., et al. (2013). Integrative Genome-wide Gene Expression Profiling of clear Cell Renal Cell Carcinoma in Czech Republic and in the United States. PLoS One 8 (3), e57886. doi:10.1371/journal.pone.0057886
Yeh, C.-W., Kao, S.-H., Cheng, Y.-C., and Hsu, L.-S. (2013). Knockdown of Cyclin-dependent Kinase 10 (Cdk10) Gene Impairs Neural Progenitor Survival via Modulation of Raf1a Gene Expression. J. Biol. Chem. 288 (39), 27927–27939. doi:10.1074/jbc.M112.420265
Yi, R., Yang, S., Liao, Y., Hu, Z., Long, H., Zeng, Y., et al. (2020). Decreased CDKL2 Expression Is Correlated with the Progression and Poor Prognosis of Glioma. Pathol. - Res. Pract. 216 (5), 152920. doi:10.1016/j.prp.2020.152920
Zhao, Y., Yang, J., Liu, Y., Fan, J., and Yang, H. (2019). HSV-2-encoded miRNA-H4 Regulates Cell Cycle Progression and Act-D-Induced Apoptosis in HeLa Cells by Targeting CDKL2 and CDKN2A. Virol. Sin. 34 (3), 278–286. doi:10.1007/s12250-019-00101-8
Keywords: Cdkl2, clear cell renal cell carcinoma, immune infiltrates, biomarker, overall survival
Citation: Chen Z, Lv Y, He L, Wu S and Wu Z (2022) Decreased CDKL2 Expression in Clear Cell Renal Cell Carcinoma Predicts Worse Overall Survival. Front. Mol. Biosci. 8:657672. doi: 10.3389/fmolb.2021.657672
Received: 27 July 2021; Accepted: 24 December 2021;
Published: 13 January 2022.
Edited by:
Anton A. Buzdin, I.M. Sechenov First Moscow State Medical University, RussiaReviewed by:
Marianna Arsenovna Zolotovskaia, Moscow Institute of Physics and Technology, RussiaMaxim Sorokin, I.M. Sechenov First Moscow State Medical University, Russia
Bin Li, Central South University, China
Copyright © 2022 Chen, Lv, He, Wu and Wu. This is an open-access article distributed under the terms of the Creative Commons Attribution License (CC BY). The use, distribution or reproduction in other forums is permitted, provided the original author(s) and the copyright owner(s) are credited and that the original publication in this journal is cited, in accordance with accepted academic practice. No use, distribution or reproduction is permitted which does not comply with these terms.
*Correspondence: Zhuang Wu, Mzc4MTE5OTJAcXEuY29t