 Yi Lu
Yi Lu Xianhe Kong1,2
 Chujun Li
- 1Department of Gastrointestinal Endoscopy, The Sixth Affiliated Hospital, Sun Yat-sen University, Guangzhou, China
- 2Guangdong Provincial Key Laboratory of Colorectal and Pelvic Floor Diseases, The Sixth Affiliated Hospital, Sun Yat-sen University, Guangzhou, China
Background: Gastric cancer (GC) is the fifth leading cancer in the world. The dysregulated expressions of the thrombospondin (THBS) family were reported to associate with GC, but their relations with tumor stage, prognosis, and correlations with tumor immunity have not been systematically reported.
Methods: We used versatile public databases such as Oncomine, GEPIA, UALCAN, Kaplan–Meier Plotter, LinkedOmics, STRING, cBioPortal, TIMER, and TISIDB to analyze the expression and mutations of different THBSs in GC, along with their functional networks, survival analysis, and tumor–immune interactions.
Results: The mRNA levels of THBS2, THBS4, and COMP were significantly higher in the tumor tissues; the expression levels of THBS1, THBS2, and THBS4 were higher in stages 2–4 than that of stage 1; patients with high expression of THBS1, THBS2, THBS4, and COMP had poor OS; the genes correlated with THBSs were enriched in focal adhesion, glycosaminoglycan biosynthesis, ECM-receptor interaction, and hedgehog signaling pathway; THBS1 and THBS4 expression had significant correlations with tumor purity, and all the THBSs expression correlated with macrophage and dendritic cells infiltration.
Conclusions: THBS2, THBS4, and COMP were potentially diagnostic markers for GC; THBS1, THBS2, THBS4, and COMP were potentially prognostic markers for GC; investigating the relations of THBSs and tumor immunology might help in immunotherapy of GC, while more studies are needed to confirm these results.
Introduction
Gastric cancer (GC) ranks as the fifth leading cancer and the third leading cause of cancer-related death globally, presenting as a significant public health problem, especially in Asian areas (Petryszyn et al., 2020). It was estimated that the incidence of GC was 1,033,000 globally in 2018 and that the GC-related deaths were 783,000 (Bray et al., 2018). Although we have achieved considerable advancements in diagnostic and therapeutic methods in GC, the 5-year survival rate of advanced GC is still not that satisfactory, which is reported to be 18–29% (Banks et al., 2019). Therefore, more effective potential drug targets and prognostic biomarkers should be identified.
The thrombospondin (THBS) family is of extracellular matrix (ECM) proteins, which can be classified into two groups based on their molecular architecture. The first group consists of two trimeric proteins [thrombospondin 1 (THBS1) and thrombospondin 2 (THBS2)], and the second one includes pentameric proteins [thrombospondin 3 (THBS3), thrombospondin 4 (THBS4), and cartilage oligomeric matrix protein (COMP)] (Sid et al., 2004). The THBSs affect multiple biological processes involving tissue remodeling, angiogenesis, and neoplasia, and the mechanisms are extremely complicated (Lawler and Detmar, 2004). In the early stage of cancer progression, the normal tissues secrete THBS1 and THBS2, playing a role as an antiangiogenic fence, while under some circumstances, they might switch to an angiogenic phenotype, acting as supporter for tumor development and metastasis, and their roles in GC were not consistent in different studies (Albo et al., 2002; Kazerounian et al., 2008; Sun et al., 2014; Eto et al., 2015; Ao et al., 2018). The relationship between THBS3 and GC has not been reported up to now, and in osteosarcoma, THBS3 was found to express at significantly high levels in patients with metastasis (Dalla-Torre et al., 2006). High expression of THBS4 and COMP hypomethylation was reported to correlate with poor prognosis (Chen et al., 2019; Liang et al., 2019). To our knowledge, the dysregulated expression of the THBS family and their relations with tumor stage, prognosis, and correlations with tumor immunity in GC have not been systematically reported. With the revolutionized development of microarray and bioinformatic technology, we conducted this study using the data from The Cancer Genome Atlas (TCGA) and other versatile public databases to analyze the expression levels and mutations of different THBSs in GC, along with their functional networks, prognostic values, and tumor–immune interactions, so as to reveal potential diagnostic, therapeutic, and prognostic targets for GC, and the results in different databases were verified with each other to make the results more convincible.
Materials and Methods
Oncomine Database Analysis
We used the Oncomine database version 4.5 (www.oncomine.org) to determine the mRNA levels and DNA copy numbers of THBSs in patients with GC. Oncomine, which involves 715 datasets and 86,733 samples, is a cancer microarray database uncovering the complex gene expression patterns of a variety of cancers (Rhodes et al., 2004). The cutoff criteria were set as gene rank top 10%, fold change >2, and p <0.05. As there were several datasets comparing the mRNA expression levels and DNA copy numbers of THBSs between tumor and normal tissues (Chen et al., 2003; Cho et al., 2011; Cui et al., 2011; Deng et al., 2012; D'Errico et al., 2009; Wang et al., 2012), Oncomine was capable of pooling the results together, and the results were shown as heat maps.
Gene Expression Profiling Interactive Analysis
GEPIA (http://gepia.cancer-pku.cn/) is a gene expression analysis web which contains 9,736 tumors and 8,587 normal samples from the TCGA and the GTEx databases (Tang et al., 2017). It is equipped with the functions of differential expression analysis, stage analysis, survival analysis, multiple gene comparison, similar gene detection, and so forth (Tang et al., 2017). Here we used GEPIA to compare the expression levels and its relationship with GC stages. The results were expressed as boxplots and violin plots, and the cutoff criteria were set as p < 0.05 and |Log2FC| > 1.
UALCAN Analysis
UALCAN (http://ualcan.path.uab.edu/) obtains and processes the gene expression and patient’s clinical data from TCGA and generates differential expression, survival analysis, methylation information, and the like. Furthermore, it can compare the differential expression levels in various subgroups (by race, gender, stage, etc.). Here, we used UALCAN to verify the comparison results of expression levels of THBSs and their relationship with tumor stages.
Survival Analysis
Kaplan–Meier Plotter (http://kmplot.com/analysis/) includes data sources from European Genome-phenome Archive (EGA), Gene Expression Omnibus (GEO), and TCGA, which is capable of assessing the survival results of 21 types of cancer including GC (Szász et al., 2016). We used it to perform the overall survival (OS) analysis. The split cutoff of low and high expression was set in auto select best cutoff model, and biased arrays were excluded. The log-rank test was used for computing p-value, and p < 0.05 was regarded as significant. Hazard ratio (HR), 95% confidence interval (CI), and false discovery rate (FDR) were also generalized.
LinkedOmics Database Analysis
LinkedOmics (http://www.linkedomics.org/) contains multi-omics and clinical data for 32 types of cancer from TCGA (SV et al., 2018). The Spearman correlation test was applied to find the significantly associated genes. The LinkFinder module showed the association result, presenting as tables, heat maps, and volcano plots. The LinkInterpreter module could perform the Gene Set Enrichment Analysis (GSEA), such as Gene Ontology (GO) and Kyoto Encyclopedia of Genes and Genomes (KEGG) pathways, and the former includes biological process (BP), cellular component (CC), and molecular function (MF). The selection criteria were p < 0.05 and 500 simulations.
Protein–Protein Interaction Network Analysis
We put the top 20 positively and top 20 negatively associated genes of each THBSs to the STRING database version 11.0 (website: http://string-db.org/) to obtain the information of PPI (Szklarczyk et al., 2017). The cutoff criterion was set as combined score >0.4. Then, we used Cytoscape version 3.6.0 to picture the interaction networks of the correlated genes (Shannon et al., 2003). Genes with node degree ≥10 were regarded as potential hub genes. MCODE plug-in was applied to find the significant cluster, and two clusters were found. The elements in the two clusters were all among the potential hub genes.
cBio Cancer Genomics Portal (cBioPortal) Analysis
cBioPortal (https://www.cbioportal.org/) converts molecular information of cancer tissues and cell lines into genetic, epigenetic, and gene expression data (Cerami et al., 2012; Gao et al., 2013). We used it to figure out the THBSs alterations in GC (stomach adenocarcinoma, TCGA, and Firehose Legacy were chosen). We also estimated the mutual correlations of THBSs by analyzing their mRNA expression (RNA Seq V2 RSEM), and then the Spearman correlation coefficient was put into Microsoft Excel 2007 to draw the heat maps.
Tumor Immunology Analysis
Tumor Immune Estimation Resource (TIMER, https://cistrome.shinyapps.io/timer/) can analyze immune infiltrates in a diversity of cancers systematically (Li et al., 2017). We used it to explore the associations between gene expression, survival outcome, somatic copy number alterations (CNA), and immune infiltration. TISIDB (http://cis.hku.hk/TISIDB/) is another web portal to analyze tumor and immune system interaction. It integrates multiple data types, and users can explore the correlations of a certain gene with tumor-infiltrating lymphocytes, immunomodulators, chemokines, subtypes, and survival information (Ru et al., 2019).
Results
Transcriptional Levels of THBSs in Patients With Gastric Cancer
Data in the Oncomine database showed that the DNA copy numbers of all the THBSs in the tumor tissues were not statistically different from the normal (Figure 1A), but the mRNA expression levels of the all the THBSs were significantly higher in the tumor tissues; moreover, the levels were associated with the cancer histopathologic types (Figure 1B). The boxplot results in the GEPIA showed that the expression levels of THBS2, THBS4, and COMP were significantly higher in the GC tumor tissues than the normal tissues, while the expression levels of THBS1 and THBS3 were not significantly different (Figure 1C). Results from the UALCAN database also indicated that the expression levels of THBS1 were not significantly different between the tumor and normal tissues, while for other THBSs certain differences existed and which might also be associated with tumor stages (Table 1).
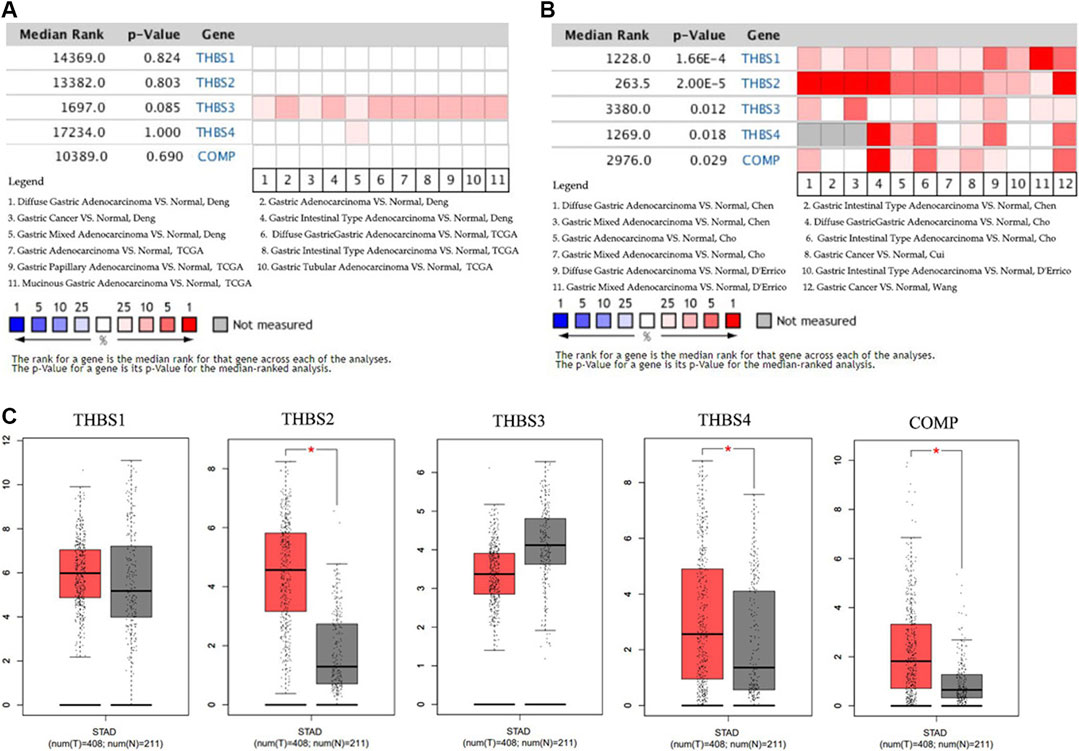
FIGURE 1. Heat maps showing variations between the gastric cancer tumor tissues and normal tissues of (A) the DNA copy numbers of the THBSs and (B) the mRNA expression levels of the THBSs (Oncomine); (C) boxplot showing the expression levels of THBSs in gastric cancer (red star means p < 0.05, GEPIA).
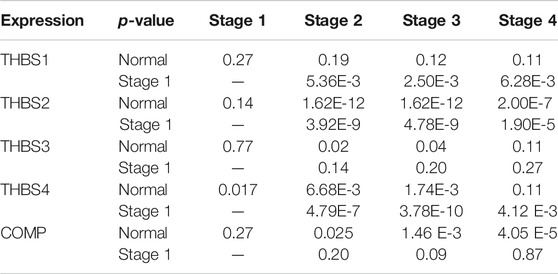
TABLE 1. The UALCAN results of the differential THBSs expression levels between the gastric cancer and normal tissues and correlation with tumor stage.
Relationship Between the THBSs and Tumor Stage in Gastric Cancer
Stage plot in the GEPIA showed that the expression levels of THBS1, THBS2, and THBS4 varied with tumor stages of GC, while no significant variation was found in THBS3 and THBS5 (Figure 2). Furthermore, analysis from UALCAN also supported that the expression levels of THBS1, THBS2, and THBS4 were higher in stages 2–4 than that of stage 1 and that the expression levels of THBS3 and COMP did not vary with different tumor stages (Table1).
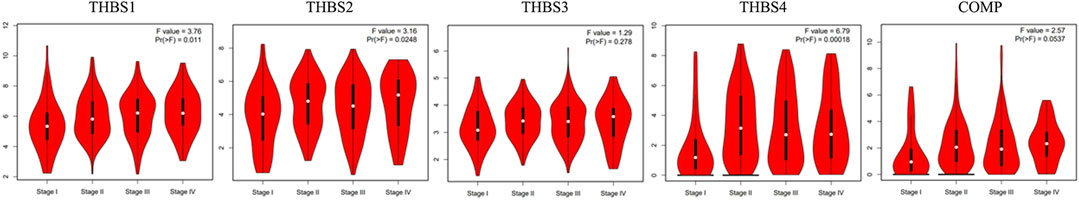
FIGURE 2. Stage plot showing the correlation between THBSs expression with tumor stage in gastric cancer (GEPIA).
THBSs and Survival Analysis
When using the Kaplan–Meier Plotter for survival analysis, THBS1 had five probe IDs, and the rest THBSs each had only one. The probe IDs of 201107_s_at (HR = 1.73, 95% CI: 1.42–2.1, p = 2.5E-8, FDR 1%), 201108_s_at (HR = 1.51, 95% CI: 1.26–1.81, p = 5.1E-6, FDR 1%), 201109_s_at (HR = 1.37, 95% CI: 1.15–1.64, p = 3.5E-4, FDR 10%), and 215775 _at (HR = 1.9, 95% CI: 1.57–2.29, p = 9.3E-12, FDR 1%) suggested that high expression of THBS1 had poor OS, while the probe IDs of 201110_s_at (HR = 0.85, 95% CI: 0.71–1.02, p = 0.07, FDR 100%) did not. In addition, high expression of THBS2 (HR = 1.55, 95% CI: 1.3–1.85, p = 1.2E-6, FDR 1%), THBS3(HR = 2.47, 95% CI: 1.98–3.08, p = 1.1E-16, FDR 1%), THBS4 (HR = 1.58, 95% CI: 1.33–1.87, p = 1.1E-7, FDR 1%), and COMP (HR = 1.54, 95% CI: 1.3–1.83, p = 5.5E-7, FDR 1%) were all correlated with poor OS (Figure 3).
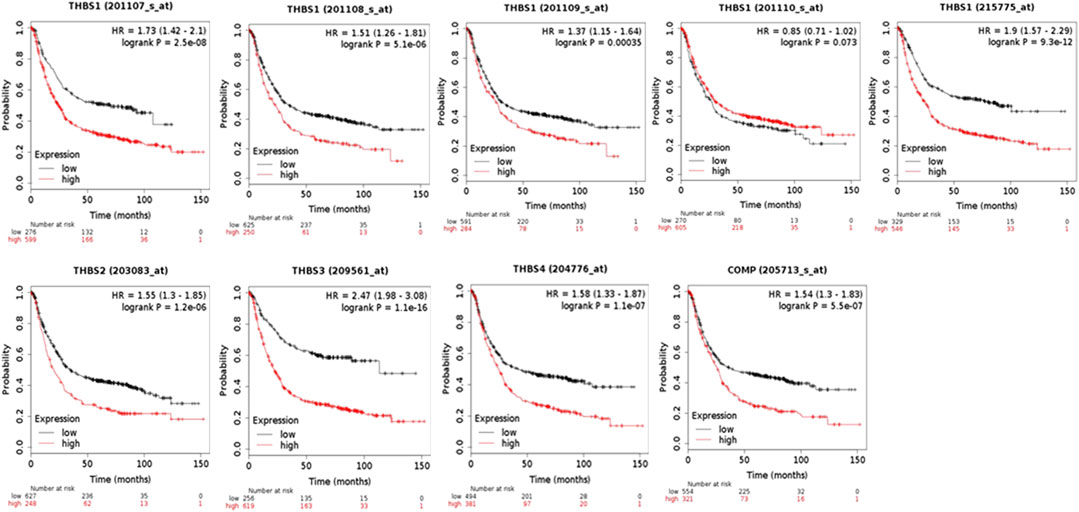
FIGURE 3. The overall survival analysis of the patients with gastric cancer grouped by expression levels of THBSs (Kaplan–Meier plotter).
Co-Expression Genes Correlated With THBSs in Gastric Cancer
THBS1 expression showed a strong positive association with expression of FBN1, VGLL3, and FSTL1, and a strong negative correlation with C6orf136, C1orf172, and ZWINT. THBS2 expression showed a strong positive association with expression of FAP, FNDC1, and COL1A2 and a strong negative correlation with ESRP2, TMEM125, and HAPLN. THBS3 expression showed a strong positive association with expression of MAP1A, NFATC4, and SSC5D and a strong negative correlation with RRM2, CCNA2, and ZWINT. THBS4 expression showed a strong positive association with expression of BOC, CCDC8, and AOC3 and a strong negative correlation with NCAPG, MELK, and DKC1. COMP expression showed a strong positive association with expression of ITGBL1, SFRP4, and FNDC13 and a strong negative correlation with GNPNAT1, TC2N, and C14orf129. The correlations between THBSs and genes differentially expressed in GC are presented as volcano plots (Figure 4A), and the top 50 genes positively (Figure 4B) or negatively (Figure 4C) correlated with THBSs in GC are shown as heat maps. The details of the top 100 correlated genes are shown in the Supplementary Table S1.
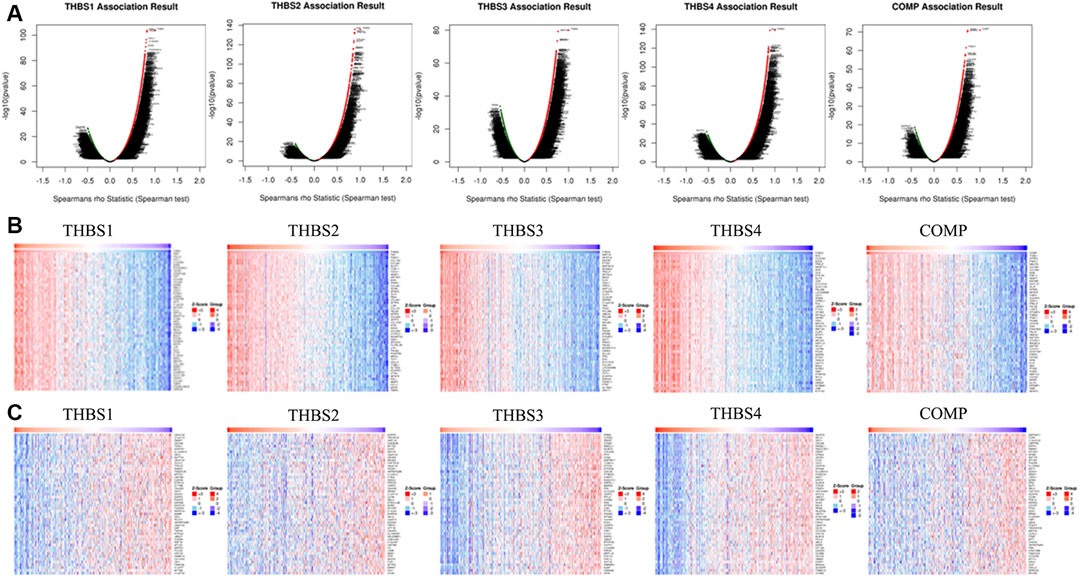
FIGURE 4. (A) Volcano plots showing the correlations between THBSs and genes differentially expressed in gastric cancer (GC); (B) heat maps showing top 50 genes positively correlated with THBSs in GC; (C) heat maps showing top 50 genes negatively correlated with THBSs in GC. Red indicates positively correlated genes and blue/green indicates negatively correlated genes (LinkedOmics).
GO and KEGG Pathway Analysis
GO analysis presented that the genes correlated with THBS1 were enriched in cellular response to vascular endothelial growth factor stimulus, collagen trimer, and extracellular matrix binding; for those correlated with THBS2, they were enriched in extracellular structure organization, ECM, and ECM binding; for those correlated with THBS3, they were enriched in extracellular structure organization, sarcolemma, and growth factor binding; for those correlated with THBS4, they were enriched in dopamine receptor signaling pathway, sarcolemma, and coreceptor activity; and for those correlated with COMP, they were enriched in osteoblast proliferation, endoplasmic reticulum lumen, and collagen binding. KEGG pathway analysis suggested that the genes correlated with THBS1-5 were enriched in focal adhesion, glycosaminoglycan biosynthesis, ECM-receptor interaction, hedgehog signaling pathway, and ECM-receptor interaction, respectively (Supplementary Figure S1).
Protein–Protein Interaction Network Analysis
The PPI network mapped 106 nodes and 512 edges of the correlated genes (Figure 5A). Forty-two genes with node degree ≥10 were regarded as potential hub genes (Figure 5B).
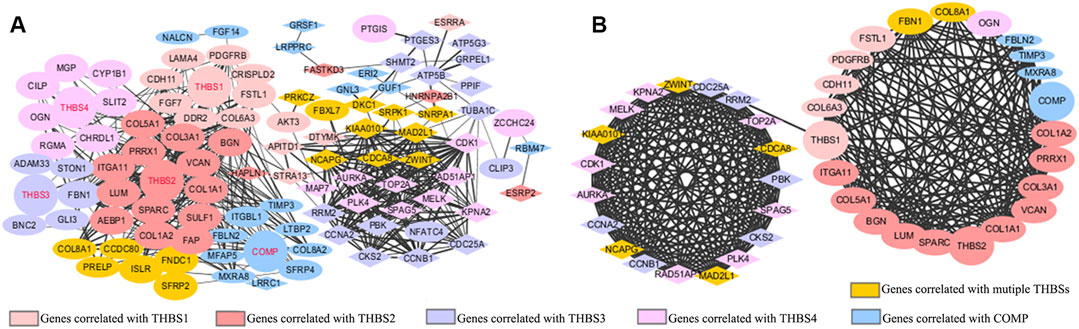
FIGURE 5. Protein–protein interaction (PPI) network of (A) the top 20 positively and top 20 negatively correlated genes of each THBSs; (B) potential hub genes (node degree ≥10). Ellipses stand for positively correlated genes, triangles stand for negatively correlated genes, a larger size of the node stands for a larger absolute value of Spearman correlation coefficient, and a wider line stands for a larger combined score (LinkedOmics and Cytoscape).
THBSs Alterations and Correlations in Gastric Cancer
THBSs were altered in 118 samples out of 478 (24.69%) in GC, the exact alterations of each THBS is presented in Figure 6A, and the alterations varied in different cancer types (Figure 6B). Mutual correlations between THBSs in GC are shown in heat maps in Figure 6C.
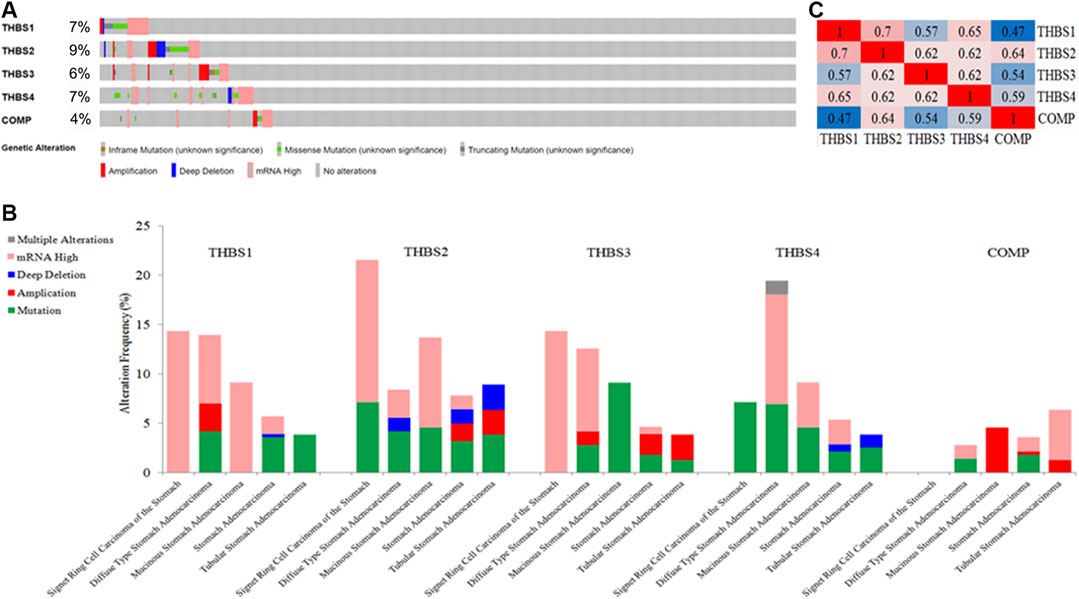
FIGURE 6. (A) Oncoprint of THBSs alterations in gastric cancer (GC); (B) cancer type summary of THBSs alterations in gastric cancer (GC); (C) mutual correlations of THBSs in GC (cBioportal).
Tumor Immunology Analysis
Tumor immunology analysis showed that THBS1 expression had significant correlations with tumor purity (r = −0.18, p = 3.3E-4) and dominant immune cells’ infiltration levels (except for B cell); THBS2 expression had no significant correlation with tumor purity (r = −0.10, p = 0.07) but had significant correlations with dominant immune cells infiltration levels; THBS3 expression had no significant correlation with tumor purity (r = −0.04, p = 0.48) but had significant correlations with some immune cells infiltration levels (CD4+ T cell, macrophage, and dendritic cell); THBS4 expression had significant correlations with tumor purity (r = 0.12, p = 0.02) and dominant immune cells’ infiltration levels (except for B cell); COMP expression had no significant correlation with tumor purity (r = 0.04, p = 0.40) but had significant correlations with some immune cells infiltration levels (CD4+ T cell, macrophage, and dendritic cell) (Figure 7). Furthermore, THBSs CNA has significant correlations with dominant immune cells infiltration levels (Figure 8). Survival Kaplan–Meier in TIMER (split percentage set as 25%) showed that infiltration levels of B cell, CD8+ T cell, CD4+ T cell, neutrophil cell, and dendritic cell had no significant difference in the OS, while higher levels of macrophage associated with poor OS. Additionally, patients with high expression of THBS1, THBS2, THBS4, and COMP all had poor OS (Supplementary Figure S2). Cox proportional hazard model analysis in TIMER showed that stage 3, stage 4, age, B cell, and macrophage infiltration were risk factors for poor OS (Supplementary Table S2).
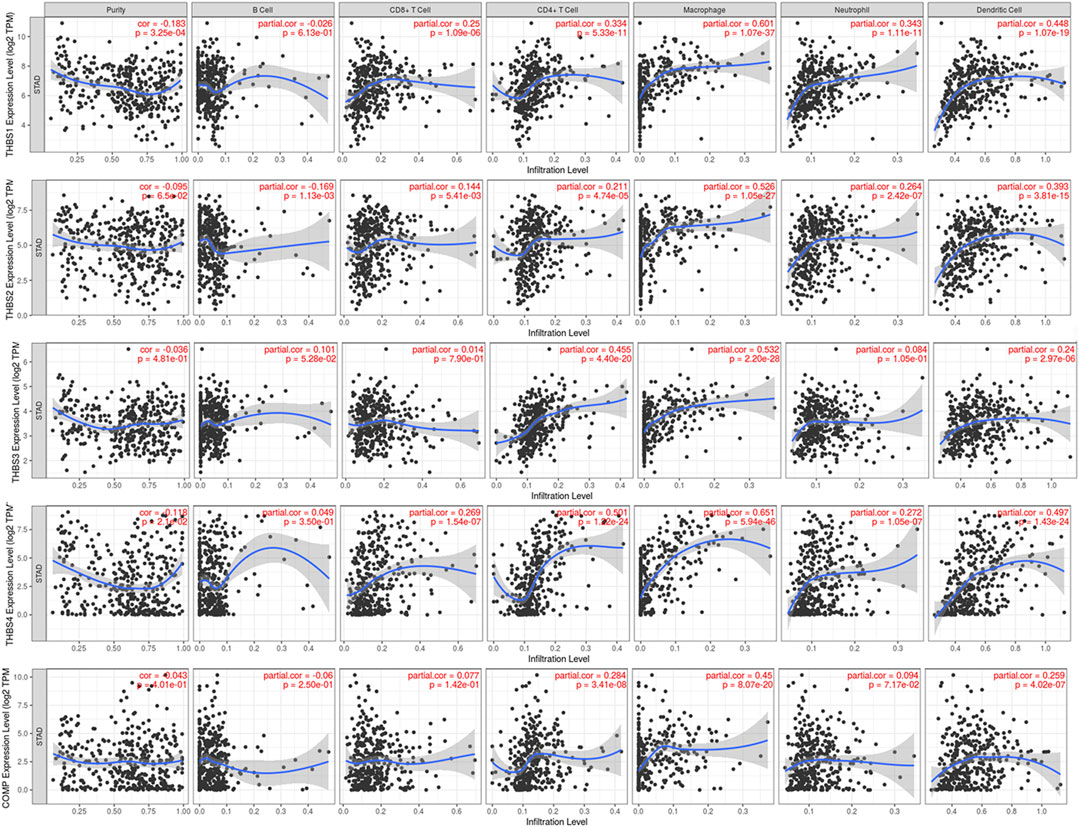
FIGURE 7. Correlations between THBSs expression and tumor purity and dominant immune cells infiltration levels (TIMER).
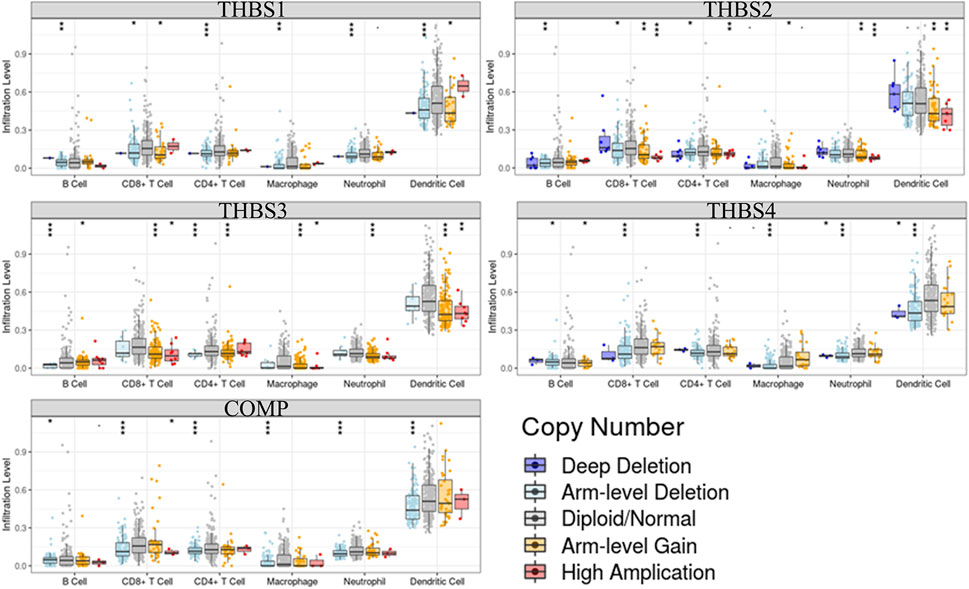
FIGURE 8. Correlations between THBSs somatic copy number alterations and dominant immune cells infiltration levels (significant codes: 0≤***<0.001≤**≤0.01≤*˂0.05≤●<0.1, TIMER).
Relations between abundance of tumor-infiltrating lymphocytes and expression or copy number of the THBSs are presented as heat maps in Figure 9. TISIDB further pointed out that the expression of THBSs had different immune subtypes in GC (Figure 10A) and that the expression of THBSs varied in different molecular subtypes (Figure 10B).
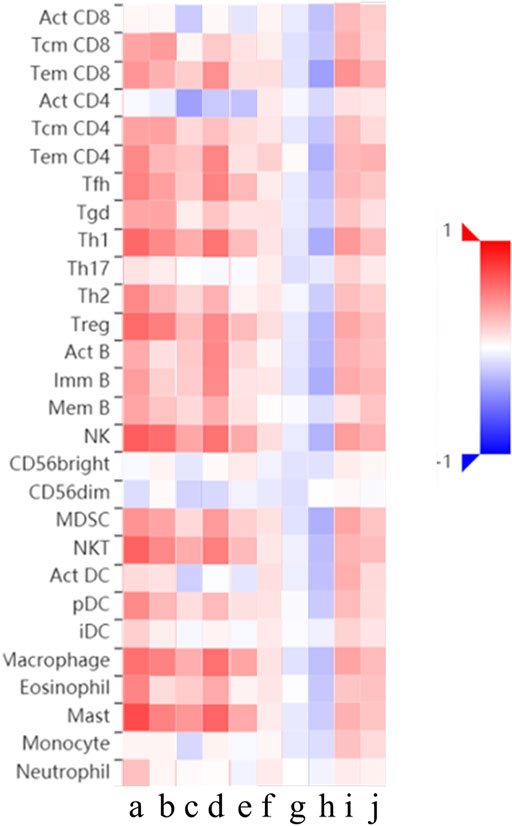
FIGURE 9. Relations between abundance of tumor-infiltrating lymphocytes and expression or copy number of THBSs, a–e: expression of THBS1-5, respectively; f–j: copy number of THBS1-5, respectively (TISIDB).
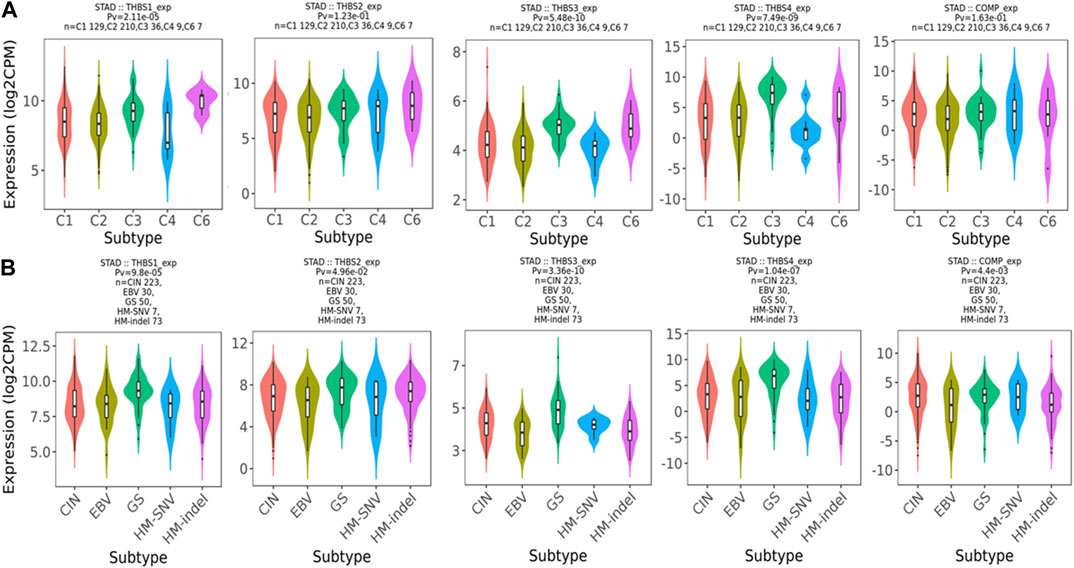
FIGURE 10. (A) Associations between THBSs expression and immune subtypes in gastric cancer (C1: wound healing; C2: IFN-γ dominant; C3: inflammatory; C4: lymphocyte depleted; C5: immunologically quiet; C6: TGF-β dominant); (B) associations between THBSs expression and molecular subtypes in gastric cancer (CIN: chromosomal instable; EBV: Epstein–Barr virus–positive; GS: genomically stable; HM-SNV: hypermutated with elevated single nucleotide variation; HM-indel: hypermutated enriched for insertion/deletion) (TISIDB).
Discussion
In this study, we used versatile public databases to reveal the dysregulated expression of the THBS family and their relations with tumor stage, prognosis, and tumor immunity. We mainly found that the mRNA expression levels of THBS2, THBS4, and COMP were significantly higher in the tumor tissues, while the expression levels of THBS1 and THBS3 were distinct in different databases; the expression levels of THBS1, THBS2, and THBS4 were higher in stages 2–4 than that of stage 1; patients with high expression of THBS1, THBS2, THBS4, and COMP all had poor OS; the genes correlated with THBSs were enriched in focal adhesion, glycosaminoglycan biosynthesis, ECM-receptor interaction, and hedgehog signaling pathway; THBS1 and THBS4 expression had significant correlations with tumor purity and that all the THBSs expression correlated with dominant immune cells’ infiltration more or less.
THBS1 is a multifunctional matricellular glycoprotein (Guo et al., 2010), some studies showed that the mRNA levels of THBS1 were higher in the tumor tissues than adjacent normal tissues (Lin et al., 2012; Huang et al., 2017), while this was opposite in gastric cardia adenocarcinoma (Guo et al., 2010). In our study, data from Oncomine supported that the mRNA levels of THBS1 were higher in the tumor tissues, while data from GEPIA and UALCAN did not agree with it. From the subgroup analysis, we deduced that the inconsistency might lie in the different histopathologic types and tumor stages included in the samples. Lin et al. further proved that the mRNA levels of THBS1 were higher in patients with larger tumors or nodal metastasis (Lin et al., 2012), which is in accordance with our results. Eto et al. selected 65 GC patients with recurrence after surgery, and they found that patients with THBS1 positive had better OS (Eto et al., 2015). In our study, we first used Kaplan–Meier plotter to perform the survival analysis, and we found that THBS1 had five probe IDs, only the probe IDs of 201110_s_at had no association with OS, whose FDR was 100%, while the other probe IDs all showed associations with OS, and results from TIMER also supported that high expression of THBS1 had poor OS. Our result is different from theirs, the reason may lie in: 1) difference in group dividing as we set the split cutoff of low and high expression in auto select best cutoff model, and Eto et al. divided the patients as THBS1 immunohistochemistry positive or negative; 2) the number of patients included might have influence in the results. The mechanism for THBS1 associating with an aggressive tumor phenotype may happen through upregulation of matrix metalloproteinase 9, which is a key protease in cancer cell invasion and metastasis by degrading the ECM and basement membranes (Albo et al., 2002). On the other hand, tumors with strong THBS1 expression were proved to have significantly higher microvessel counts (Zhang et al., 2003).
Several studies have shown that the mRNA expression levels of THBS2 were elevated in the tumor tissues and that higher expression correlated with later tumor stages and poorer OS (Yang et al., 2007; Zhuo et al., 2016; Ao et al., 2018), while only one study showed a positive result (Sun et al., 2014). Zhuo et al. explained that this may be due to the sample size in the latter being smaller (Zhuo et al., 2016). Our results were in accordance with the former ones. THBS2 is a matricellular Ca2+-binding glycoprotein excreted by stromal fibroblasts, immune cells, and endothelial cells. It plays a vital role in ECM-receptor interaction and mediating cell-to-cell and cell-to-matrix interactions (Bornstein et al., 2000). Some studies have shown that THBS2 acted as a new fibroblast growth factor-2 (FGF2) ligand that blocked FGF2 interaction with proangiogenic receptors, presenting antiangiogenic and antineoplastic activity (Rusnati et al., 2019). The conclusion may contradict with ours, the reason which probably lies in that first, THBS2 may possess multifunctional and complicated mechanisms, and other potentials have not yet been identified, and secondly, it might act differently in different cancer. As in colorectal cancer, a meta-analysis showed that high THBS2 expression levels were correlated more often with lymph node and distant metastasis, and high levels of THBS2 expression associated with poor survival (Wang et al., 2016). While in bladder cancer, the expression levels of THBS2 were negatively associated with tumor stages, metastasis, and grades (Nakamura et al., 2019).
Until now, we could not find any studies about THBS3 in GC. In our study, results from Oncomine indicated that the mRNA levels of THBS3 were higher in the tumor tissues, while there was no difference in GEPIA. No association was found between the expression of THBS3 and tumor stages, and data in Kaplan–Meier Plotter supported high expression of THBS3 had poor OS, while data from TIMER did not. In osteosarcoma, THBS3 was differentially expressed, and especially in patients with metastasis at diagnosis; moreover, patients with overexpressed THBS3 had worse relapse-free survival after chemotherapy (Dalla-Torre et al., 2006). In a cross-cancer genome-wide analysis, the expression quantitative trait loci results showed an association between THBS3 expression and lung cancer (Fehringer et al., 2016).
THBS4 is another extracellular secreted glycoproteins regulating the organization, repair, and remodeling of ECM. In vitro study showed that THBS4 mRNA and protein levels were higher in MGC-803 and BGC-823 cells compared to normal gastric cells, and THBS4 overexpression enhanced the migration and invasion of GC cells (Chen et al., 2019). THBS4 was also reported to have strong correlations with histological type, as it was extensively overexpressed in the diffuse type, and generally lacked in intestinal type. Furthermore, immunohistochemistry demonstrated that its intensities were highest in regions with large tumor cell density and invasion (Förster et al., 2011). In our study, the mRNA levels were significantly higher in the tumor tissues and had association with tumor stages. Heat maps in Oncomine presented that the color in the diffuse type was darker than the intestinal type, in accordance with the previous study (Förster et al., 2011). Kuroda et al. showed that it was cancer-associated fibroblasts (CAFs) rather than normal-associated fibroblasts that expressed THBS4, and high expression of THBS4 was correlated with larger tumor size, more aggressiveness, lymph node metastasis, and poor OS, which was similar to our findings (Kuroda et al., 2019). Research studying the mechanism of THBS4 in GC is rare, and in endothelial cells, TGF-β1 can upregulate the THBS4 expression and affect angiogenesis, contributing to tumor growth (Muppala et al., 2017).
COMP is a soluble glycoprotein expressed in cartilage. Zhou et al. developed a gene signature consisting of COMP and five other genes, which correlated with recurrence of patients with GC in stages III and IV (Zhou et al., 2018). Another study also proved that COMP hypomethylation was associated with poor OS (Liang et al., 2019). These results were similar to ours. The regulatory mechanisms of COMP in GC are unknown. Papadakos et al. proved that breast cancer cells expressing COMP formed larger size tumors in vivo and in vitro and that COMP could activate Notch3, interacting with both Notch3 and its ligand Jagged1, and they may also interact with β-catenin and AKT pathways (Papadakos et al., 2019).
Conclusion
Our results implied that THBS2, THBS4, and COMP were potentially diagnostic markers for GC; THBS1, THBS2, THBS4, and COMP were potentially prognostic markers for GC; the function and regulatory mechanisms of THBSs in GC might happen through focal adhesion, glycosaminoglycan biosynthesis, ECM-receptor interaction, and hedgehog signaling pathway; investigating the relations of THBSs and tumor immunology might help in immunotherapy in GC. The results were based on multidimensional bioinformatic analysis, and several databases have been used to verify the results with each other, but a small part of the results were not consistent with the previously published ones; hence, more studies are still needed to confirm these results.
Data Availability Statement
The original contributions presented in the study are included in the article/Supplementary Material, further inquiries can be directed to the corresponding author.
Author Contributions
CL proposed and revised the study. YL performed the literature search and data mining in the versatile databases (Oncomine, GEPIA, UALCAN, Kaplan–Meier plotter, LinkedOmics, STRING) and analyzed the data, put the pictures together, and wrote the first draft. XK performed data mining (Oncomine, GEPIA, UALCAN, Kaplan-Meier plotter, LinkedOmics, STRING) and analyzed the data. WZ performed the data mining (cBioportal, TIMER, TISIDB) and put the pictures together. MH performed data mining (cBioportal, TIMER, TISIDB).
Conflict of Interest
The authors declare that the research was conducted in the absence of any commercial or financial relationships that could be construed as a potential conflict of interest.
Supplementary Material
The Supplementary Material for this article can be found online at: https://www.frontiersin.org/articles/10.3389/fmolb.2021.647095/full#supplementary-material.
References
Albo, D., Shinohara, T., and Tuszynski, G. P. (2002). Up-regulation of matrix metalloproteinase 9 by thrombospondin 1 in gastric cancer. J. Surg. Res. 108 (1), 51–60. doi:10.1006/jsre.2002.6452
Ao, R., Guan, L., Wang, Y., and Wang, J. N. (2018). Silencing of COL1A2, COL6A3, and THBS2 inhibits gastric cancer cell proliferation, migration, and invasion while promoting apoptosis through the PI3k‐Akt signaling pathway. J. Cell. Biochem. 119 (6), 4420–4434. doi:10.1002/jcb.26524
Banks, M., Graham, D., Jansen, M., Gotoda, T., Coda, S., Di Pietro, M., et al. (2019). British Society of Gastroenterology guidelines on the diagnosis and management of patients at risk of gastric adenocarcinoma. Gut 68 (9), 1545–1575. doi:10.1136/gutjnl-2018-318126
Bornstein, P., Kyriakides, T. R., Yang, Z., Armstrong, L. C., and Birk, D. E. (2000). Thrombospondin 2 modulates collagen fibrillogenesis and angiogenesis. J. Investig. Dermatol. Symp. Proc. 5 (1), 61–66. doi:10.1046/j.1087-0024.2000.00005.x
Bray, F., Ferlay, J., Soerjomataram, I., Siegel, R. L., Torre, L. A., and Jemal, A. (2018). Global cancer statistics 2018: GLOBOCAN estimates of incidence and mortality worldwide for 36 cancers in 185 countries. CA. Cancer J. Clin. 68 (6), 394–424. doi:10.3322/caac.21492
Cerami, E., Gao, J., Dogrusoz, U., Gross, B. E., Sumer, S. O., Aksoy, B. A., et al. (2012). The cBio cancer genomics portal: an open platform for exploring multidimensional cancer genomics data. Cancer Discov. 2 (5), 401–404. doi:10.1158/2159-8290.cd-12-0095
Chen, X., Huang, Y., Wang, Y., Wu, Q., Hong, S., and Huang, Z. (2019). THBS4 predicts poor outcomes and promotes proliferation and metastasis in gastric cancer. J. Physiol. Biochem. 75 (1), 117–123. doi:10.1007/s13105-019-00665-9
Chen, X., Leung, S. Y., Yuen, S. T., Chu, K. M., Ji, J., Li, R., et al. (2003). Variation in gene expression patterns in human gastric cancers. Mol. Biol. Cell 14 (8), 3208–3215. doi:10.1091/mbc.e02-12-0833
Cho, J. Y., Lim, J. Y., Cheong, J. H., Park, Y. Y., Yoon, S. L., Kim, S. M., et al. (2011). Gene expression signature-based prognostic risk score in gastric cancer. Clin. Cancer Res. 17 (7), 1850–1857. doi:10.1158/1078-0432.ccr-10-2180
Cui, J., Chen, Y., Chou, W. C., Sun, L., Chen, L., Suo, J., et al. (2011). An integrated transcriptomic and computational analysis for biomarker identification in gastric cancer. Nucleic Acids Res. 39 (4), 1197–1207. doi:10.1093/nar/gkq960
D'Errico, M., De Rinaldis, E., Blasi, M. F., Viti, V., Falchetti, M., Calcagnile, A., et al. (2009). Genome-wide expression profile of sporadic gastric cancers with microsatellite instability. Eur. J. Cancer 45 (3), 461–469. doi:10.1016/j.ejca.2008.10.032
Dalla-Torre, C. A., Yoshimoto, M., Lee, C. H., Joshua, A. M., de Toledo, S. R., Petrilli, A. S., et al. (2006). Effects of THBS3, SPARC and SPP1 expression on biological behavior and survival in patients with osteosarcoma. BMC Cancer 6, 237. doi:10.1186/1471-2407-6-237
Deng, N., Goh, L. K., Wang, H., Das, K., Tao, J., Tan, I. B., et al. (2012). A comprehensive survey of genomic alterations in gastric cancer reveals systematic patterns of molecular exclusivity and co-occurrence among distinct therapeutic targets. Gut 61 (5), 673–684. doi:10.1136/gutjnl-2011-301839
Eto, S., Yoshikawa, K., Shimada, M., Higashijima, J., Tokunaga, T., Nakao, T., et al. (2015). The relationship of CD133, histone deacetylase 1 and thrombospondin-1 in gastric cancer. Anticancer Res. 35 (4), 2071–2076.
Fehringer, G., Kraft, P., Pharoah, P. D., Eeles, R. A., Chatterjee, N., Schumacher, F. R., et al. (2016). Cross-cancer genome-wide analysis of lung, ovary, breast, prostate, and colorectal cancer reveals novel pleiotropic associations. Cancer Res. 76 (17), 5103–5114. doi:10.1158/0008-5472.CAN-15-2980
Förster, S., Gretschel, S., Jöns, T., Yashiro, M., and Kemmner, W. (2011). THBS4, a novel stromal molecule of diffuse-type gastric adenocarcinomas, identified by transcriptome-wide expression profiling. Mod. Pathol. 24 (10), 1390–1403. doi:10.1038/modpathol.2011.99
Gao, J., Aksoy, B. A., Dogrusoz, U., Dresdner, G., Gross, B., Sumer, S. O., et al. (2013). Integrative analysis of complex cancer genomics and clinical profiles using the cBioPortal. Sci. Signal 6 (269), l1. doi:10.1126/scisignal.2004088
Guo, W., Dong, Z., He, M., Guo, Y., Guo, J., Chen, Z., et al. (2010). Aberrant methylation of thrombospondin-1 and its association with reduced expression in gastric cardia adenocarcinoma. J. Biomed. Biotechnol. 2010, 721485. doi:10.1155/2010/721485
Huang, T., Wang, L., Liu, D., Li, P., Xiong, H., Zhuang, L., et al. (2017). FGF7/FGFR2 signal promotes invasion and migration in human gastric cancer through upregulation of thrombospondin-1. Int. J. Oncol. 50 (5), 1501–1512. doi:10.3892/ijo.2017.3927
Kazerounian, S., Yee, K. O., and Lawler, J. (2008). Thrombospondins in cancer. Cell. Mol. Life Sci. 65 (5), 700–712. doi:10.1007/s00018-007-7486-z
Kuroda, K., Yashiro, M., Sera, T., Yamamoto, Y., Kushitani, Y., Sugimoto, A., et al. (2019). The clinicopathological significance of Thrombospondin-4 expression in the tumor microenvironment of gastric cancer. PLoS One 14 (11), e224727. doi:10.1371/journal.pone.0224727
Lawler, J., and Detmar, M. (2004). Tumor progression: the effects of thrombospondin-1 and -2. Int. J. Biochem. Cell Biol 36 (6), 1038–1045. doi:10.1016/j.biocel.2004.01.008
Li, T., Fan, J., Wang, B., Traugh, N., Chen, Q., Liu, J. S., et al. (2017). TIMER: a web server for comprehensive analysis of tumor-infiltrating immune cells. Cancer Res. 77 (21), e108–e110. doi:10.1158/0008-5472.can-17-0307
Liang, Y., Zhang, C., and Dai, D. Q. (2019). Identification of DNA methylation-regulated differentially-expressed genes and related pathways using Illumina 450K BeadChip and bioinformatic analysis in gastric cancer. Pathol. Res. Pract. 215 (10), 152570. doi:10.1016/j.prp.2019.152570
Lin, X. D., Chen, S. Q., Qi, Y. L., Zhu, J. W., Tang, Y., and Lin, J. Y. (2012). Overexpression of thrombospondin-1 in stromal myofibroblasts is associated with tumor growth and nodal metastasis in gastric carcinoma. J. Surg. Oncol. 106 (1), 94–100. doi:10.1002/jso.23037
Muppala, S., Xiao, R., Krukovets, I., Verbovetsky, D., Yendamuri, R., Habib, N., et al. (2017). Thrombospondin-4 mediates TGF-β-induced angiogenesis. Oncogene 36 (36), 5189–5198. doi:10.1038/onc.2017.140
Nakamura, Y., Miyata, Y., Takehara, K., Asai, A., Mitsunari, K., Araki, K., et al. (2019). The pathological significance and prognostic roles of thrombospondin-1, and -2, and 4N1K-peptide in bladder cancer. Anticancer Res. 39 (5), 2317–2324. doi:10.21873/anticanres.13348
Papadakos, K. S., Bartoschek, M., Rodriguez, C., Gialeli, C., Jin, S. B., Lendahl, U., et al. (2019). Cartilage Oligomeric Matrix Protein initiates cancer stem cells through activation of Jagged1-Notch3 signaling. Matrix Biol. 81, 107–121. doi:10.1016/j.matbio.2018.11.007
Petryszyn, P., Chapelle, N., and Matysiak-Budnik, T. (2020). Gastric cancer: where are we heading? Dig. Dis. 38, 280–285. doi:10.1159/000506509
Rhodes, D. R., Yu, J., Shanker, K., Deshpande, N., Varambally, R., Ghosh, D., et al. (2004). ONCOMINE: a cancer microarray database and integrated data-mining platform. Neoplasia 6 (1), 1–6. doi:10.1016/s1476-5586(04)80047-2
Ru, B., Wong, C. N., Tong, Y., Zhong, J. Y., Zhong, S., Wu, W. C., et al. (2019). TISIDB: an integrated repository portal for tumor-immune system interactions. Bioinformatics 35 (20), 4200–4202. doi:10.1093/bioinformatics/btz210
Rusnati, M., Borsotti, P., Moroni, E., Foglieni, C., Chiodelli, P., Carminati, L., et al. (2019). The calcium-binding type III repeats domain of thrombospondin-2 binds to fibroblast growth factor 2 (FGF2). Angiogenesis 22 (1), 133–144. doi:10.1007/s10456-018-9644-3
Shannon, P., Markiel, A., Ozier, O., Baliga, N. S., Wang, J. T., Ramage, D., et al. (2003). Cytoscape: a software environment for integrated models of biomolecular interaction networks. Genome Res. 13 (11), 2498–2504. doi:10.1101/gr.1239303
Sid, B., Sartelet, H., Bellon, G., El Btaouri, H., Rath, G., Delorme, N., et al. (2004). Thrombospondin 1: a multifunctional protein implicated in the regulation of tumor growth. Crit. Rev. Oncol. Hematol. 49 (3), 245–258. doi:10.1016/j.critrevonc.2003.09.009
Sun, R., Wu, J., Chen, Y., Lu, M., Zhang, S., Lu, D., et al. (2014). Down regulation of Thrombospondin2 predicts poor prognosis in patients with gastric cancer. Mol. Cancer 13, 225. doi:10.1186/1476-4598-13-225
Sv, V., P, S., J, W., and B, Z. (2018). LinkedOmics: analyzing multi-omics data within and across 32 cancer types. Nucleic Acids Res. 46, D956–D963. doi:10.1093/nar/gkx1090
Szász, A. M., Lánczky, A., Nagy, Á., Förster, S., Hark, K., Green, J. E., et al. (2016). Cross-validation of survival associated biomarkers in gastric cancer using transcriptomic data of 1,065 patients. Oncotarget 7 (31), 49322–49333. doi:10.18632/oncotarget.10337
Szklarczyk, D., Morris, J. H., Cook, H., Kuhn, M., Wyder, S., Simonovic, M., et al. (2017). The STRING database in 2017: quality-controlled protein-protein association networks, made broadly accessible. Nucleic Acids Res. 45 (D1), D362–D368. doi:10.1093/nar/gkw937
Tang, Z., Li, C., Kang, B., Gao, G., Li, C., and Zhang, Z. (2017). GEPIA: a web server for cancer and normal gene expression profiling and interactive analyses. Nucleic Acids Res. 45 (W1), W98–W102. doi:10.1093/nar/gkx247
Wang, Q., Wen, Y. G., Li, D. P., Xia, J., Zhou, C. Z., Yan, D. W., et al. (2012). Upregulated INHBA expression is associated with poor survival in gastric cancer. Med. Oncol. 29 (1), 77–83. doi:10.1007/s12032-010-9766-y
Wang, X., Zhang, L., Li, H., Sun, W., Zhang, H., and Lai, M. (2016). THBS2 is a potential prognostic biomarker in colorectal cancer. Sci. Rep. 6, 33366. doi:10.1038/srep33366
Yang, S., Shin, J., Park, K. H., Jeung, H. C., Rha, S. Y., Noh, S. H., et al. (2007). Molecular basis of the differences between normal and tumor tissues of gastric cancer. Biochim. Biophys. Acta 1772 (9), 1033–1040. doi:10.1016/j.bbadis.2007.05.005
Zhang, J., Ito, R., Oue, N., Zhu, X., Kitadai, Y., Yoshida, K., et al. (2003). Expression of thrombospondin-1 is correlated with microvessel density in gastric carcinoma. Virchows Arch. 442 (6), 563–568. doi:10.1007/s00428-003-0810-6
Zhou, Y. Y., Kang, Y. T., Chen, C., Xu, F. F., Wang, H. N., and Jin, R. (2018). Combination of TNM staging and pathway based risk score models in patients with gastric cancer. J. Cell. Biochem. 119 (4), 3608–3617. doi:10.1002/jcb.26563
Keywords: gastric cancer, THBS1, THBS2, THBS3, THBS4, cartilage oligomeric matrix protein
Citation: Lu Y, Kong X, Zhong W, Hu M and Li C (2021) Diagnostic, Therapeutic, and Prognostic Value of the Thrombospondin Family in Gastric Cancer. Front. Mol. Biosci. 8:647095. doi: 10.3389/fmolb.2021.647095
Received: 29 December 2020; Accepted: 19 February 2021;
Published: 28 April 2021.
Edited by:
Mahendra Pratap Kashyap, University of Alabama at Birmingham, United StatesReviewed by:
Sayan Chatterjee, University School of Biotechnology, Guru Gobind Singh Indraprastha University, IndiaZeliha Selamoglu, Niğde Ömer Halisdemir University, Turkey
Copyright © 2021 Lu, Kong, Zhong, Hu and Li. This is an open-access article distributed under the terms of the Creative Commons Attribution License (CC BY). The use, distribution or reproduction in other forums is permitted, provided the original author(s) and the copyright owner(s) are credited and that the original publication in this journal is cited, in accordance with accepted academic practice. No use, distribution or reproduction is permitted which does not comply with these terms.
*Correspondence: Chujun Li, bGljaHVqdW5AbWFpbC5zeXN1LmVkdS5jbg==