 Ruy Freitas Reis1,2*
 Alexandre Bittencourt Pigozzo3
 Carla Rezende Barbosa Bonin4
 Barbara de Melo Quintela1,2
 Lara Turetta Pompei2
 Ana Carolina Vieira5
 Larissa de Lima e Silva2
 Maicom Peters Xavier6
 Rodrigo Weber dos Santos1,2,6
 Marcelo Lobosco1,2,6
- 1Institute of Exact Sciences, Department of Computing, Federal University of Juiz de Fora, Juiz de Fora, Brazil
- 2FISIOCOMP - Laboratory of Computational Fisiology and High-Performance Computing, Federal University of Juiz de Fora, Juiz de Fora, Brazil
- 3Computer Science Department, Federal University of São João Del-Rei, São João Del-Rei, Brazil
- 4Institute of Education, Science and Technology of Southeast of Minas Gerais - Cataguases Advanced Campus, Cataguases, Brazil
- 5GET-EngComp, Grupo de Educação Tutorial Engenharia Computacional, Federal University of Juiz de Fora, Juiz de Fora, Brazil
- 6Graduate Program on Computational Modeling, Federal University of Juiz de Fora, Juiz de Fora, Brazil
By June 2021, a new contagious disease, the Coronavirus disease 2019 (COVID-19), has infected more than 172 million people worldwide, causing more than 3.7 million deaths. Many aspects related to the interactions of the disease’s causative agent, SAR2-CoV-2, and the immune response are not well understood: the multiscale interactions among the various components of the human immune system and the pathogen are very complex. Mathematical and computational tools can help researchers to answer these open questions about the disease. In this work, we present a system of fifteen ordinary differential equations that models the immune response to SARS-CoV-2. The model is used to investigate the hypothesis that the SARS-CoV-2 infects immune cells and, for this reason, induces high-level productions of inflammatory cytokines. Simulation results support this hypothesis and further explain why survivors have lower levels of cytokines levels than non-survivors.
1 Introduction
By the beginning of June 2021, the number of confirmed deaths caused by the novel coronavirus pneumonia, COVID-19, surpassed 3.7 millions, while more than 172 millions worldwide were infected. The causative virus was first identified as SARS-CoV-2, also referred to as HCoV-19. It has been shown that SARS-CoV-2 infects the alveolar epithelial cells, mainly type 2 alveolar epithelial cells (AEC2), via the angiotensin-converting enzyme receptor 2 (ACE2) (Catanzaro et al., 2020; Hoffmann et al., 2020; Shang et al., 2020). The ensuing destruction of the epithelial cells and the increase in cell permeability lead to the release of the virus. During the fight against the virus, the innate immune system cells release a large number of extracellular molecular regulators, like cytokines and chemokines, that will induce the adaptive response to recruit more cells from the innate system (Coperchini et al., 2020; Prompetchara et al., 2020). In most individuals, recruited cells (mainly CD8+ T cells) are sufficient to clear the infection. However, in some patients, a dysfunctional immune response occurs, which triggers a “cytokine storm” that mediates widespread inflammation and damage (Tay et al., 2020), mainly in the lung.
The Cytokine Release Syndrome (CRS) or cytokine storm has been associated with a wide variety of infectious and non-infectious diseases for the past decades, including influenza and SARS-CoV (Tisoncik et al., 2012; Shimabukuro-Vornhagen et al., 2018). Nevertheless, the exact signalling pathways that lead to the CRS are yet to be determined (Lukan, 2020). Several mechanisms have been proposed to explain the CRS and the differences between survivors and non-survivors concerning viral dynamics and the immune response to SARS-CoV-2. One hypothesis is that SARS-CoV-2 infects macrophages, CD4+ T cells, and CD8+ T cells in addition to alveolar epithelial cells (Davanzo et al., 2020; Grant et al., 2021), thus causing the production of several pro-inflammatory cytokines (mainly IL-6) and also impairments in the immune response mediated by macrophages and T cells. The infection of CD8+ T cells, for example, prevents those cells from killing other infected cells and induces high-level production of some inflammatory cytokines, including IL-6 (Li H. et al., 2020; Blanco-Melo et al., 2020; Chen et al., 2020).
In this work, the hypothesis above is tested by a mathematical model of the immune response to SARS-CoV-2. The model developed is an extension of a prior model of the adaptive immune response, which was validated using experimental data obtained from vaccination against yellow fever (Bonin et al., 2019). The original model considers the main cells and molecules present in the immune response, such as, for example, antigen-presenting cells, CD4+ and CD8+ T cells, B cells, and IgM and IgG antibodies. We further extended the model in this work, including pro-inflammatory cytokines and infected immune system cells. Also, the model is validated with experimental data of the viremia, antibodies (IgM and IgG), and cytokines obtained from patients with COVID-19 (Long et al., 2020; To et al., 2020; Zhou et al., 2020). Moreover, a sensitivity analysis (SA) revealed important characteristics of the immune response to SARS-CoV-2.
2 Related Works
A large number of works use mathematical and computational tools to model the Human Immune System (HIS) using distinct techniques, such as ordinary differential equations (ODEs) (Perelson, 1989; Baker et al., 1997; Chang et al., 2005; Vodovotz et al., 2006; Jarrett et al., 2015; Bonin et al., 2016), partial differential equations (PDEs) (Pettet et al., 1996; Su et al., 2009; Flegg et al., 2012; Pigozzo et al., 2013; Quintela et al., 2014), stochastic methods (Chao et al., 2004; Xavier et al., 2017), cellular automaton and agents (Celada and Seiden, 1992; Morpurgo et al., 1995; Kohler et al., 2000; Bernaschi and Castiglione, 2001; Pappalardo et al., 2018). On the other hand, very few papers were published describing the dynamics of SARS-CoV-2 (Almocera et al., 2020; Du and Yuan, 2020; Hernandez-Vargas and Velasco-Hernandez, 2020; Xavier et al., 2020), although some additional non-peer-reviewed papers can also be found on the internet. Three out four published works (Almocera et al., 2020; Du and Yuan, 2020; Hernandez-Vargas and Velasco-Hernandez, 2020) are based on the target cell-limited model proposed by Perelson (2002): a system of three ODEs to model target cells, infected cells, and viruses. In this work, we use a set of fifteen ODEs to model not only the virus but also immune cells, antibodies and cytokines.
Du and Yuan (2020) developed a mathematical model to investigate the dynamics of the immune response to influenza and the SARS-CoV-2 virus, including in their analysis the effects of a hypothetical antiviral drug on the SARS-Cov-2 infection. The model uses constants to represent the adaptive system CD8+ cells, IgM and IgG antibodies. The authors argue, based on their numerical results, that the innate immune system is the main responsible for clearing the influenza virus, while the adaptive system is the main responsible for controlling the SARS-CoV-2 virus. Their numerical results also suggest that the peak concentration of the adaptive immune cells for patients with COVID-19 is more likely to occur before the number of infected cells by SAR-CoV-2 reaches its peak (Du and Yuan, 2020). However, these results have not been validated: the viral loads found were not compared to experimental results.
A model similar to the one of Du and Yuan (2020) was proposed by Hernandez-Vargas and Velasco-Hernandez (2020), but including latent cells. The idea is that newly infected cells spend time in a latent phase, a concept similar to the “Eclipse phase” (Beauchemin et al., 2008). Another difference is that instead of using a constant to represent T cells (Du and Yuan, 2020), Hernandez-Vargas and Velasco-Hernandez (2020) used an equation to represent them. The viral loads obtained by numerical experiments were compared to values found in the literature (Wölfel et al., 2020), with good fitness between numerical and experimental results. The authors then present the Stability Analysis of their model (Almocera et al., 2020), which suggests that the SARS-CoV-2 virus replicates fast enough to overcome T cell response and cause infection.
Xavier et al. (2020) proposed a model based on five Ordinary Differential Equations to model the immune response to SARS-CoV-2. The model parameters and initial conditions were adjusted to cohort studies that collected viremia and antibody data. The results have shown that the model was able to reproduce both viremia and antibodies dynamics successfully. However, the model does not take into account the CRS. The mathematical model proposed in this paper can describe the immune response to SARS-CoV-2 for survivors and non-survivors. The difference between the two scenarios is the cytokine storm, which leads to a deregulated immune response in the second group.
A nonlinear differential equation model was proposed by Waito et al. (2016) to represent the dynamics of the CRS. The authors consider in their model that the rate of production of cytokines is dependent on interactions with other cytokines. The model was adjusted using type I interferon (IFN) receptor (IFNAR)-knockout mice data since mice lacking the IFNAR on their leukocytes experienced a profound cytokine storm (Waito et al., 2016). Although thirteen cytokines were considered in their model, the computational results have shown that TNF-α, IL-10, IL-6, and MIP-1β, have the largest effects on the dynamics of the cytokine storm. In this work, we do not distinguish the cytokines types nor consider the interactions among cytokines in their production rate.
The mathematical model proposed in this paper is an extension of a prior model of the adaptive immune response (Bonin et al., 2019). The original model (Bonin et al., 2019) had their parameters adjusted to reproduce the immune response against the Yellow Fever vaccine. The model of Bonin et al. (2019) considers the main cells and molecules present in the immune response against a virus such as antigen-presenting cells, CD4+ and CD8+ T cells, B cells and antibodies.
In order to represent the immune response to SARS-CoV-2, the model presented in this paper has slight differences from the model shown in our previous work (Bonin et al., 2019), and these differences are summarised in Table 1. Some changes were necessary to represent the hypothesis that some immune system cells can be infected by the SARS-CoV-2 virus (Davanzo et al., 2020; Grant et al., 2021). To implement these changes, a new population was included in the model (I, to represent immune defence cells infected by SARS-CoV-2) as well as new terms were included in the defence cells to represent their infection. Furthermore, the production of pro-inflammatory citokines was introduced in order to represent the dynamics of the CRS. To achieve this purpose, a new population was included (C, to represent the cytokine), as well as new terms were included to represent their production by the immune cells. Finally, we differentiate the production of antibodies into
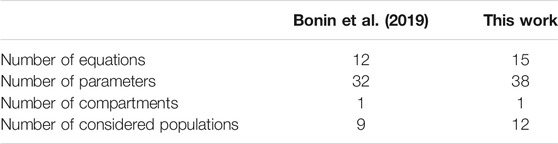
TABLE 1. Major differences between the models proposed in a previous work (Bonin et al., 2019) and in this work.
3 Materials and Methods
3.1 Mathematical Model
The model proposed in this work consists of a set of 15 Ordinary Differential Equations (ODEs), one to represent the behaviour of each population: virus (V), naive (
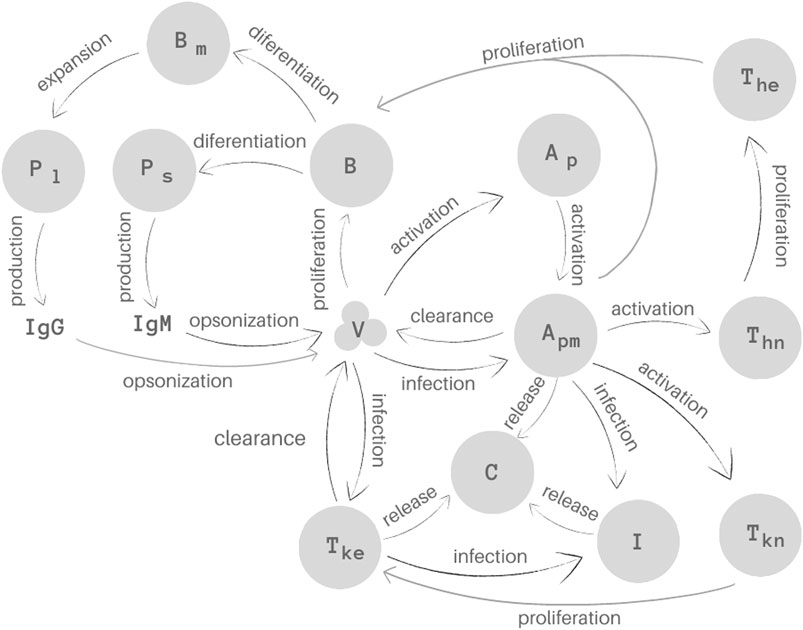
FIGURE 1. Representation of the 15 biological species and their interactions as considered in the mathematical model. Homeostasis is not illustrated in this Figure.
The first equation describes the virus (V) behaviour. SARS-CoV-2 uses the cell surface receptor ACE2 to infect healthy cells (Catanzaro et al., 2020; Hoffmann et al., 2020; Shang et al., 2020), using its machinery to replicate itself. The replication is represented implicitly by the first term of Eq. 1,
APCs are found in two stages, naive and mature (Murphy and Weaver, 2008). The second and third equations represent these two stages of the APCs, naive (
In Eq. 3, which represents mature APCs,
The dynamics of the infected immune system cells is represented by Eq. 4. The first term,
Equation 5 represents the population of naive CD4+ T cells (
Equation 6 represents effector CD4+ T cell population (
Equations 7, 8 represent the population of naive (
In Eq. 8, the term
Equation 9 represents both naive and effector B cells (B). These populations were not considered separately in order to simplify the model. The term
Equation 10 represents the short-lived plasma cells (
Equation 11 represents the long-lived plasma cells (
Memory B cells (
Equations 13, 14 represents the production of antibodies. The terms
Finally, Eq. 15 describes the pro-inflammatory cytokine dynamics. In this equation, the first term,
We did not include in the model infected and non-infected epithelial cells because the model would be more complex, with more constants to adjust and, the worst, without data available to validate these cell populations along time. The use of implicit antigen replication does not affect the quality of the result, more specifically those related to the virus population, as our previous works have demonstrated (Bonin et al., 2018; Pigozzo et al., 2018; Bonin et al., 2019; Reis et al., 2019).
We are assuming that only mature cells are infected by the SARS-CoV-2 virus. In our simplification, we assume that the virus is located in the tissue, and that most of the naive cells are activated either in (or just after leaving) the bloodstream (APCs) or in the lymph nodes (CD4 and CD8) (Murphy and Weaver, 2008; Paul, 2008; Sompayrac, 2012). Another simplification adopted in this paper is that infected cells do not produce new virions: we assume that virus is mainly produced by the epithelial tissue despite the evidence that infected alveolar macrophages may support viral replication (Grant et al., 2021). We also assume that the phagocytic activity by infected cells does not occur. Finally, we assume that infected cells continue to produce pro-inflammatory cytokines and we implicitly consider the effects of different pro-inflammatory cytokines, the main effects of which are related to the IL-6 cytokine (Tanaka et al., 2014; Narazaki and Kishimoto, 2018; Zhang et al., 2020).
3.2 Experimental Data
Cohort studies available in the literature with people infected with SARS-CoV-2 were used to evaluate the mathematical model’s performance. In particular, viremia, antibodies (IgG and IgM), and cytokine levels for patients that survived and died due to COVID-19 were collected from three different papers.
The first paper presents a temporal profile of serial viral load from a set of 23 patients admitted at two hospitals in Hong Kong, all of them with laboratory-confirmed COVID-19 cases (To et al., 2020). Most of the viral load data reported in the paper were collected daily for 29°days from posterior oropharyngeal saliva samples. For this reason, we have used only this subset from this first paper. The number of patients who provided a sample on each day varies from one to ten. Data were extracted from the paper using the WebPlotDigitalizer tool (Rohatgi, 2020). WebPlotDigitizer is an on-line tool that can extract data in a semi-automatic way from graphics uploaded to the website.
The second paper presents antibody responses to SARS-CoV-2 (Long et al., 2020). A cohort composed of 285 Chinese patients confirmed to be infected with SARS-CoV-2 by RT-PCR assays were enrolled in this study from three hospitals. To measure the level of IgG and IgM against SARS-CoV-2, serum samples were collected at four different time intervals after the reported symptoms onset (Long et al., 2020). Antibody levels were measured using magnetic chemiluminescence, which provides values divided by the cutoff (S/CO) (Long et al., 2020), and were presented as
The third paper presents a retrospective cohort study with 191 adult inpatients from two Chinese hospitals (Zhou et al., 2020) diagnosed with COVID-19 according to WHO interim guidance and a clear outcome (dead or discharged) at the early stage of the outbreak. According to Zhou et al. (2020), 54 patients died during the stay in the hospital (non-survivors) while 137 were discharged (survivors). IL-6 plays a central role in the cytokine storm. For this reason, IL-6 data from this paper were collected using the WebPlotDigitalizer tool and used to adjust the cytokine levels of our mathematical model.
In all these three papers, the reported temporal profile of viremia, antibodies, and cytokines starts after symptom onset (Long et al., 2020; To et al., 2020; Zhou et al., 2020). This imposes an additional challenge because the exact day each patient has been infected is not clear. Epidemiological studies carried with 425 laboratory-confirmed COVID-19 cases in Wuhan, China, have estimated that the mean incubation period is about 5.2°days (Li Q. et al., 2020). Based on these results, we adjusted the cohort data accordingly to reflect the incubation period, i.e., we have added 5°days at the beginning of each dataset to represent the time between the estimated infection until the symptom onset.
3.3 Parameter Estimation
One of the challenges related to the set of equations proposed to describe the immune response against the SARS-CoV-2 virus is the estimation of their parameters, i.e., find the values of the parameters which give the best fit to the set of the cohort studies. Unfortunately most of the parameters cannot be measured directly by experiments, and for this reason their biological ranges are unknown. Many distinct methods for non-linear systems can be used to estimate their values (Varah, 1982; Rodriguez-Fernandez et al., 2006; Schwaab et al., 2008). In this work we adopt the differential evolution (DE) optimisation method (Storn and Price, 1997).
Both initial conditions for the 15 variables and the 38 model parameters were calibrated to data obtained from cohort studies using DE. The DE was used to estimate each of the model parameters presented in Table 2, respecting the limits established for each one of them as presented in Tables 2 and 3.
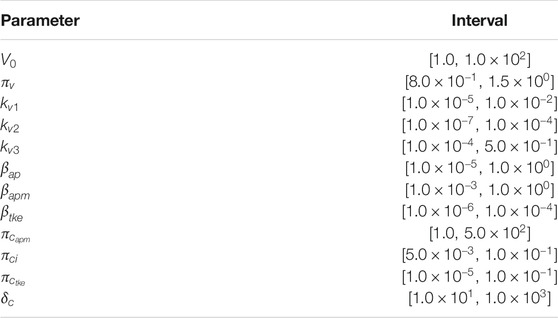
TABLE 2. Bounds used for parameters calibration of the COVID-19 model for survivors.
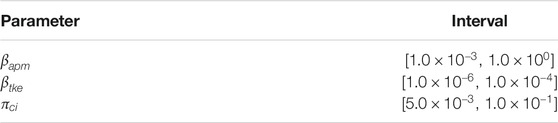
TABLE 3. Bounds used for parameters calibration of the COVID-19 model for non-survivors.
The idea used in the fitting is quite simple: minimise the difference between the model curves (viremia, IgG, IgM, and cytokines) to the given data (relative error) accordingly to Eq. 16.
where
The initial conditions for each variable are presented in Table 4. Table 5 presents the complete set of values used to calibrate our model to survivors’ data, including those found by the DE for the parameters listed in Table 2. The values that fit the model to non-survivors data are the same, except for those presented in Table 6, which were also obtained by the DE using the bounds presented in Table 3.
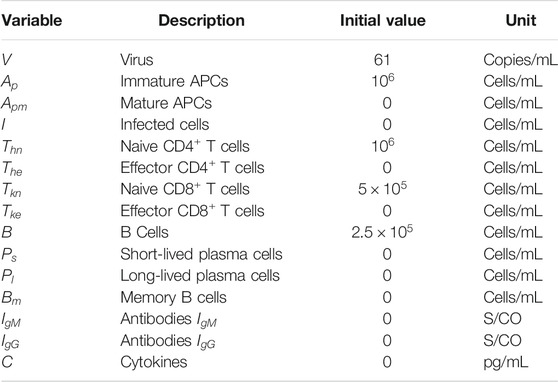
TABLE 4. Model variables and their initial values.
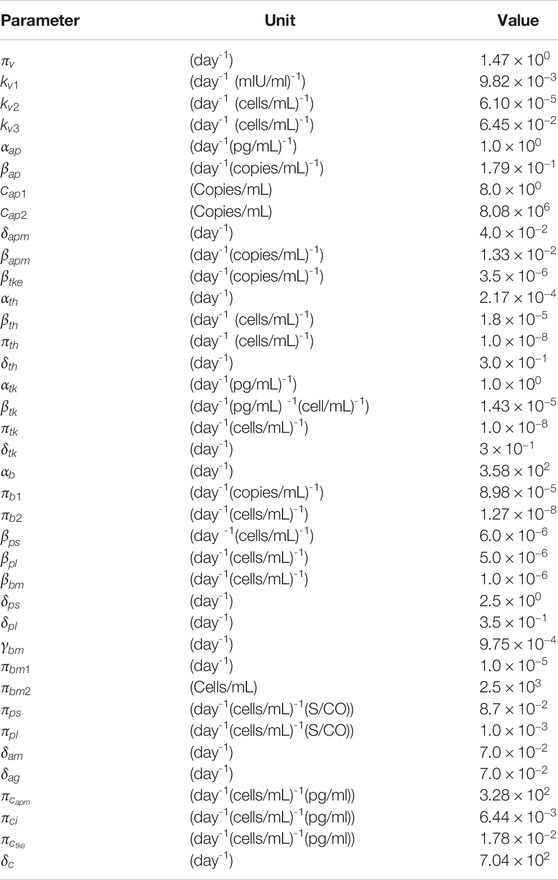
TABLE 5. Model parameters values that fit survivors’ data. The parameter presented in Table 2 were estimated using DE. The other values were based on the work of Bonin et al. (2019).
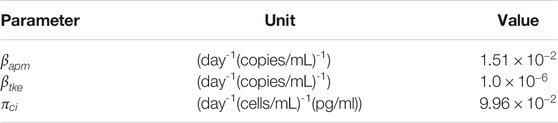
TABLE 6. Model parameters values that fit non-survivors data. All other model parameters values were those from Table 5.
3.4 Sensitivity Analysis
A sensitivity analysis (SA) was performed via main Sobol indices (Sobol, 2001). The SA is used to quantify the contribution of each uncertain model input
where N is the number of parameters,
The sensitivity analysis was performed considering all parameters of the model. So, the main Sobol indices were evaluated considering all model parameter as uniform distributions, considering perturbations of
3.5 Implementation
The model was implemented in the Python programming language. Numerical solution of the system of ODEs performed by the solve_ivp function, a member of the integrate package in the scipy library (Scipy, 2021). Among the integrate methods offered by this function it was used the Radau option, i.e. the fifth-order implicit Runge-Kutta method of the Radau IIA family. DE was implemented using the differential_evolution method available in the package optimize from the scipy. The SA was executed aided by SALib library (Herman and Usher, 2017).
4 Results
This section presents the predictions of the mathematical model presented in Section Materials and methods, comparing them with experimental data (Long et al., 2020; To et al., 2020; Zhou et al., 2020). Since one of the papers present cytokines levels for patients that survived and died due to COVID-19 (Zhou et al., 2020), we decided to divide our numerical simulations into two distinct scenarios: survivors and non-survivors.
This section also presents the results of the SA, identifying the ten parameters that most affect the outputs of the model.
First Scenario: Survivors
Initially, as a validation step, we calibrated the model using data from patients that survived COVID-19 to check if the proposed model can fit the available cohort data. The model was able to represent viremia, cytokines, IgG and IgM from the patient data without CRS (Figure 2).
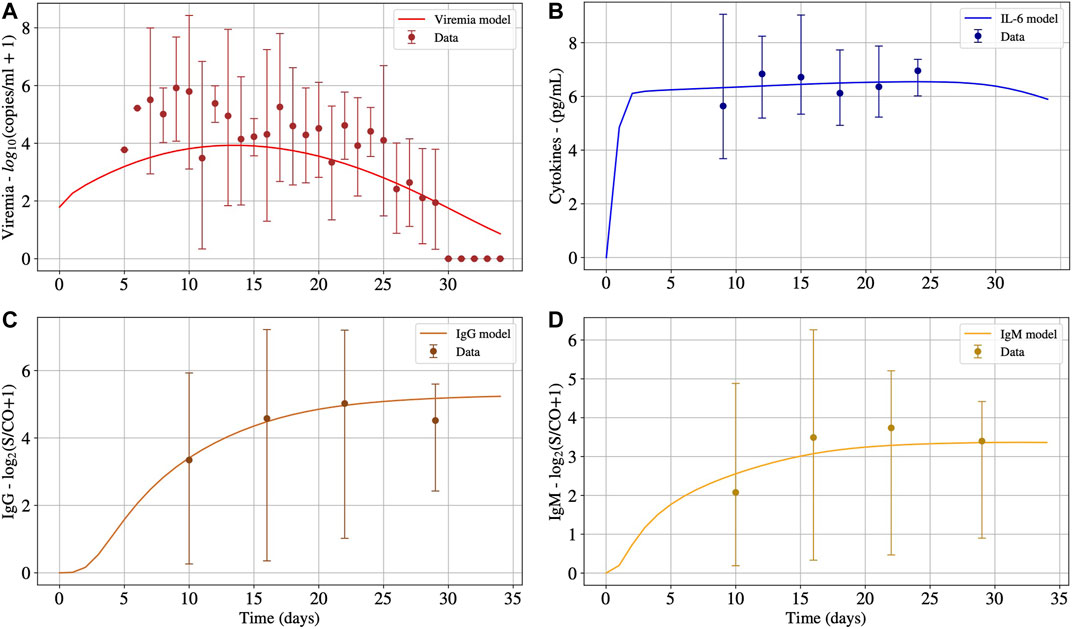
FIGURE 2. The numerical results presented in Panels A, B, C and D represent the solution of Eqs 1, 15, 14 and 13, respectively. These numerical solutions were fitted for patients without CRS. Interval used for initial conditions and parameters are given in Table 2.
Second Scenario: Non-survivors
The second scenario simulates the immune response of non-survivors patients. Figure 3 presents the results. For this scenario, most of the parameters obtained in the first calibration were kept, except for
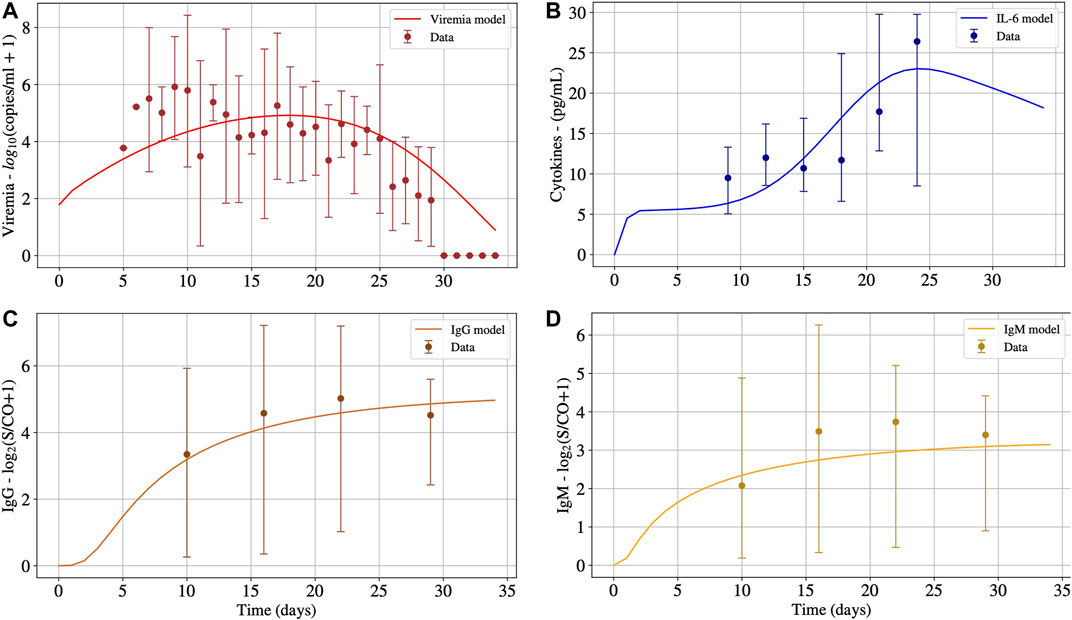
FIGURE 3. The numerical results presented in Panels A, B, C and D represent the solution of Eqs 1, 15, 14 and 13, respectively. These numerical solutions were fitted for patients with CRS adjusting the values of
Figure 4 presents the impacts of
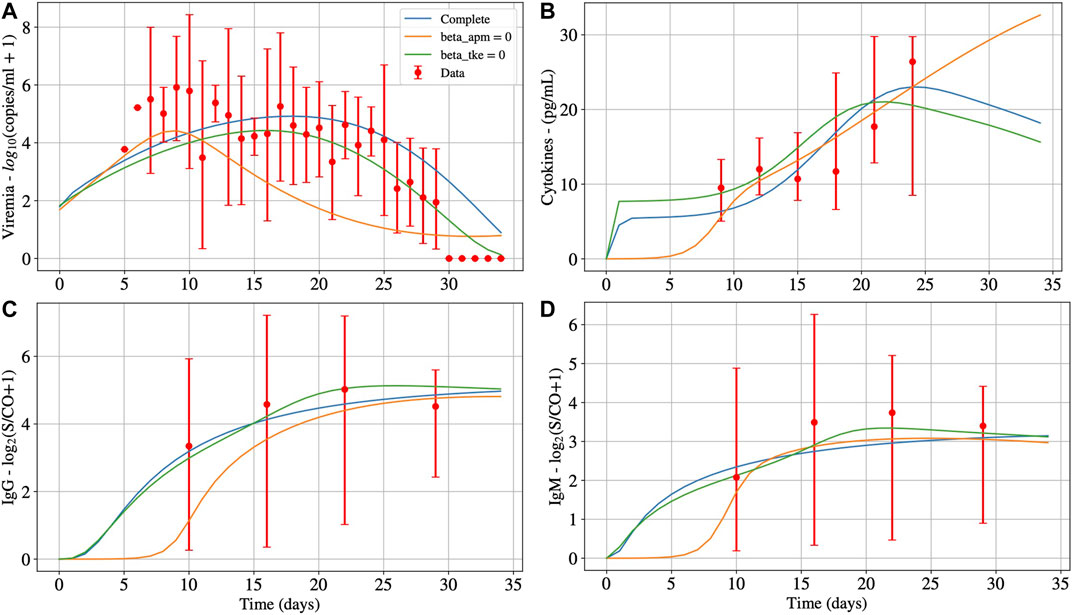
FIGURE 4. Deterministic numerical solution of Eqs 1, 15, 14 and 13 for the non-survivors case considering three hypothesis: 1) Infection of both effector APCs and CD8+ T cells (complete, with
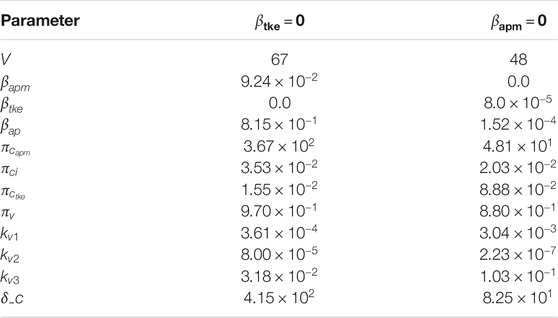
TABLE 7. Model parameters values that fit non-survivors’ data, when considering that only APCs (
Sensitivity Analysis
Figure 5 shows the main Sobol index (
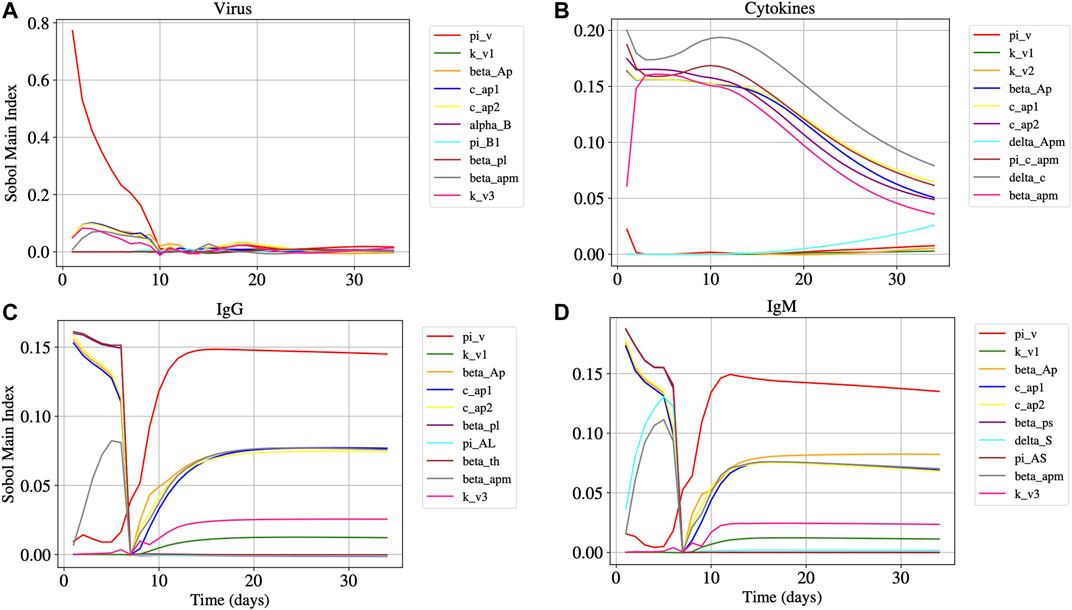
FIGURE 5. Panels A, B, C, and D represents the Sobol main index over time of Eqs 1, 15, 14 and 13, respectively. The main Sobol indexes were evaluated for all model parameters, but Panels A, B, C, and D presents the 10 parameters with largest influence in the results.
5 Discussion
It can be seen in Panel A of Figure 2 that after 30°days, viruses were almost eliminated, but the concentrations of IL-6 (Panel B), IgG (Panel C), and IgM (Panel D) antibodies remain at high levels. Cytokines start to decrease after 27°days approximately. It is expected that IgG remains at high levels after the resolution of the inflammation. For how long these levels remain high is still an open question in the case of COVID-19. Moreover, after 30°days, the immune response has not ended, and the inflammation has not been regulated. In the presence of inflammation and viruses, the cells of the immune system continue to migrate, causing more inflammation. It is important to highlight that, after the complete elimination of the virus, the inflammation will decrease until it ceases, and the concentration of cells and molecules of the immune system will return to a homeostatic level. However, this process will occur slowly because the model does not consider an anti-inflammatory response.
As one can observe in Figure 3, after 30°days, the virus concentration (Panel A) tends to zero. On the other hand, the IL-6 concentration (Panel B) starts to increase considerably after ten days, achieving its peak around the
In Figure 4, we observe that the infection of mature APCs, CD8+ T cells, or both cells simultaneously by SARS-CoV-2 can be determinant to the outcome of the disease. In other words, all hypotheses are plausible from a numerical perspective. The main differences in results are that the production of cytokines, IgG, and IgM (Panels B, C and D, respectively) starts later when
From the results of the sensitivity analysis (Figure 5), we can observe that the most influential parameters in respect to the dynamics of the virus (Panel A), cytokines (Panel B), IgG (Panel C), and IgM (Panel D) populations are related to the APCs. We observe that
It is worth mentioning that the experimental data presents a huge variation (observe that the scale adopted is log10), challenging the calibration process reported in Section 4. The severity of the disease could explain this. The literature reports that severe/critical patients tend to peak in the second week of illness, with values ranging from 5.57 to 9.66 log10 copies/mL, whereas mild/moderate patients tend to peak in the first week of illness, with values ranging from 3.25 to 6.40 log10 copies/mL (Lui et al., 2020). Thus, one possible explanation for the considerable variation observed in the viremia is that the dataset mixes patients with distinct disease severity degrees. In such a case, the numerical results represent an average value for distinct severity degrees. Nevertheless, some factors suggest a prevalence of severe/critical patients in the dataset: 1) the need for hospital admission; 2) the fact that the viremia peak observed in the numerical result occurs around the 15th°day, with a value about 6.0 log10 copies/mL, which is compatible with the one reported for severe/critical patients (Lui et al., 2020).
COVID-19 is a new disease, and for this reason, some studies and datasets seem to contradict each other. Different studies in the literature adopt distinct methods and metrics, so it is not easy to gather their data to create a much larger dataset. In addition, the experimental data used in this paper to calibrate the model comprises a reduced number of patients and measurements. In this sense, the results presented in this work have limitations due to the restrictions imposed by data availability.
This paper has analysed the hypothesis that the infection of immune defence cells causes the CRS in patients with COVID-19, mainly macrophages and CD8+ T cells, by the SARS-CoV-2. Although at first our numerical results suggest that this hypothesis may be correct, we must stress that the limitations described in this section could lead us to obtain an adjustment that supports, falsely, the hypothesis. Another limitation that can weaken our conclusions is that the combinations of values associated with other parameters except
Other techniques could be considered to distinguish survivors and non-survivors groups. The use of ODEs was motivated by our prior experience in using this tool to describe the dynamics of the immune response. Although we are not specialists in other techniques, such as deep learning, we believe that present limitations in the available data set can make it difficult or even impossible to use data driven models.
In the near future, we intend to explicitly represent the dynamics of different pro-inflammatory cytokines such as GM-CSF, TNF-α, IL-6, IL-8, among others. In addition, the model can be extended by considering anti-inflammatory responses through the incorporation of regulatory T cells (Treg cells), macrophages in a regulatory phenotype (Mreg phenotype), and anti-inflammatory cytokines such as IL-10. Finally, we also plan to use this model to reproduce the immune response against the SARS-CoV-2 vaccines.
Data Availability Statement
The original contributions presented in the study are included in the article/Supplementary Material, further inquiries can be directed to the corresponding author.
Author Contributions
Conception and design of the mathematical model: RR, CB, AP, RW, and ML. Computational implementation of the mathematical model: RR, CB, AP, BMQ, LP, AV, and ML have also been involved in drafting the manuscript. LS, MX, and RR ajusted the numerical results to experimental data. LP, LS, and AV were responsible for extracting experimental data from the literature. RR, AP, BMQ, RW, and ML revised the final manuscript. All authors have read and approved the final manuscript.
Funding
This study was financed in part by the Coordenação de Aperfeiçoamento de Pessoal de Nível Superior (CAPES)-Brasil-Finance Code 001 (scholarship), Conselho Nacional de Desenvolvimento Científico e Tecnológico (CNPq)-Brasil-PIBIC/CNPq/UFJF and Produtividade em Pesquisa (scholarships), Universidade Federal de Juiz de Fora-Brasil-BIC/UFJF (scholarship), and Fundação de Amparo á Pesquisa do Estado de Minas Gerais (FAPEMIG)-Brasil-Bolsa de Doutorado (scholarship) and CEX APQ 02830/17 (equipments).
Conflict of Interest
The authors declare that the research was conducted in the absence of any commercial or financial relationships that could be construed as a potential conflict of interest.
Acknowledgments
The authors would like to thank the infrastructure provided by Universidade Federal de Juiz de Fora (UFJF), Universidade Federal de São João del-Rey (UFSJ), Instituto Federal de Educação, Ciência e Tecnologia do Sudeste de Minas Gerais-Campus Avançado de Cataguases (IF Sudeste MG).
References
Almocera, A. E. S., Quiroz, G., and Hernandez-Vargas, E. A. (2021). Stability Analysis in COVID-19 Within-Host Model with Immune Response. Commun. Nonlinear Sci. Numer. Simul 95, 105584. doi:10.1016/j.cnsns.2020.105584
Baker, C. T. H., Bocharov, G. A., and Paul, C. A. H. (1997). Mathematical Modelling of the Interleukin-2 T-Cell System: A Comparative Study of Approaches Based on Ordinary and Delay Differential Equation. J. Theor. Med. 1, 117–128. doi:10.1080/10273669708833012
Beauchemin, C. A. A., McSharry, J. J., Drusano, G. L., Nguyen, J. T., Went, G. T., Ribeiro, R. M., et al. (2008). Modeling Amantadine Treatment of Influenza a Virus In Vitro. J. Theor. Biol. 254, 439–451. doi:10.1016/j.jtbi.2008.05.031
Bernaschi, M., and Castiglione, F. (2001). Design and Implementation of an Immune System Simulator. Comput. Biol. Med. 31, 303–331. doi:10.1016/s0010-4825(01)00011-7
Blanco-Melo, D., Nilsson-Payant, B. E., Liu, W.-C., Uhl, S., Hoagland, D., Møller, R., et al. (2020). Imbalanced Host Response to SARS-CoV-2 Drives Development of COVID-19. Cell 181, 1036–1045. doi:10.1016/j.cell.2020.04.026
Bonin, C. R. B., Fernandes, G. C., Menezes, R. M., Camacho, L. A. B., da Mota, L. M. H., de Lima, S. M. B., et al. (2019). “Quantitative Validation of a Yellow Fever Vaccine Model,” in 2019 IEEE International Conference on Bioinformatics and Biomedicine (BIBM), San Diego, CA, USA, 18-21 Nov. 2019 (IEEE), 2113–2120.
Bonin, C. R. B., dos Santos, R. W., Fernandes, G. C., and Lobosco, M. (2016). Computational Modeling of the Immune Response to Yellow Fever. J. Comput. Appl. Math. 295, 127–138. doi:10.1016/j.cam.2015.01.020
Bonin, C. R. B., Fernandes, G. C., Dos Santos, R. W., and Lobosco, M. (2018). A Qualitatively Validated Mathematical-Computational Model of the Immune Response to the Yellow Fever Vaccine. BMC Immunol. 19, 15. doi:10.1186/s12865-018-0252-1
Catanzaro, M., Fagiani, F., Racchi, M., Corsini, E., Govoni, S., and Lanni, C. (2020). Immune Response in COVID-19: Addressing a Pharmacological challenge by Targeting Pathways Triggered by SARS-CoV-2. Sig Transduct Target. Ther. 5, 1–10. doi:10.1038/s41392-020-0191-1
Celada, F., and Seiden, P. E. (1992). A Computer Model of Cellular Interactions in the Immune System. Immunol. Today 13, 56–62. doi:10.1016/0167-5699(92)90135-t
Chang, S. T., Linderman, J. J., and Kirschner, D. E. (2005). Multiple Mechanisms Allow mycobacterium Tuberculosis to Continuously Inhibit Mhc Class Ii-Mediated Antigen Presentation by Macrophages. Proc. Natl. Acad. Sci. 102, 4530–4535. doi:10.1073/pnas.0500362102
Chao, D. L., Davenport, M. P., Forrest, S., and Perelson, A. S. (2004). A Stochastic Model of Cytotoxic T Cell Responses. J. Theor. Biol. 228, 227–240. doi:10.1016/j.jtbi.2003.12.011
Chen, X., Zhao, B., Qu, Y., Chen, Y., Xiong, J., Feng, Y., et al. (2020). Detectable Serum Severe Acute Respiratory Syndrome Coronavirus 2 Viral Load (RNAemia) Is Closely Correlated with Drastically Elevated Interleukin 6 Level in Critically Ill Patients with Coronavirus Disease 2019. Clin. Infect. Dis. 71, 1937–1942. doi:10.1093/cid/ciaa449
Coperchini, F., Chiovato, L., Croce, L., Magri, F., and Rotondi, M. (2020). The Cytokine Storm in COVID-19: An Overview of the Involvement of the Chemokine/chemokine-Receptor System. Cytokine Growth Factor. Rev. 53, 25–32. doi:10.1016/j.cytogfr.2020.05.003
Davanzo, G. G., Codo, A. C., Brunetti, N. S., Boldrini, V., Knittel, T. L., Monterio, L. B., et al. (2020). Sars-cov-2 Uses Cd4 to Infect T Helper Lymphocytes. New York, NY: EUA. doi:10.1101/2020.09.25.20200329
Du, S. Q., and Yuan, W. (2020). Mathematical Modeling of Interaction between Innate and Adaptive Immune Responses in COVID-19 and Implications for Viral Pathogenesis. J. Med. Virol. 92, 1615–1628. doi:10.1002/jmv.25866
Flegg, J. A., Byrne, H. M., Flegg, M. B., and Sean McElwain, D. L. (2012). Wound Healing Angiogenesis: the Clinical Implications of a Simple Mathematical Model. J. Theor. Biol. 300, 309–316. doi:10.1016/j.jtbi.2012.01.043
Garvin, M. R., Alvarez, C., Miller, J. I., Prates, E. T., Walker, A. M., Amos, B. K., et al. (2020). A Mechanistic Model and Therapeutic Interventions for COVID-19 Involving a RAS-Mediated Bradykinin Storm. eLife 9, e59177. doi:10.7554/eLife.59177
Goutelle, S., Maurin, M., Rougier, F., Barbaut, X., Bourguignon, L., Ducher, M., et al. (2008). The Hill Equation: a Review of its Capabilities in Pharmacological Modelling. Fundam. Clin. Pharmacol. 22, 633–648. doi:10.1111/j.1472-8206.2008.00633.x
Grant, R. A., Morales-Nebreda, L., Morales-Nebreda, L., Markov, N. S., Swaminathan, S., Querrey, M., et al. (2021). Circuits between Infected Macrophages and T Cells in Sars-Cov-2 Pneumonia. Nature 590, 635–641. doi:10.1038/s41586-020-03148-w
Herman, J., and Usher, W. (2017). SALib: an Open-Source python Library for Sensitivity Analysis. Joss 2, 97. doi:10.21105/joss.00097
Hernandez-Vargas, E. A., and Velasco-Hernandez, J. X. (2020). In-host Mathematical Modelling of COVID-19 in Humans. Annu. Rev. Control 50, 448–456. doi:10.1016/j.arcontrol.2020.09.006
Hoffmann, M., Kleine-Weber, H., Schroeder, S., Krüger, N., Herrler, T., Erichsen, S., et al. (2020). SARS-CoV-2 Cell Entry Depends on ACE2 and TMPRSS2 and Is Blocked by a Clinically Proven Protease Inhibitor. Cell 181, 271–280. doi:10.1016/j.cell.2020.02.052
Jarrett, A. M., Cogan, N. G., and Shirtliff, M. E. (2015). Modelling the Interaction between the Host Immune Response, Bacterial Dynamics and Inflammatory Damage in Comparison with Immunomodulation and Vaccination Experiments. Math. Med. Biol. 32, 285–306. doi:10.1093/imammb/dqu008
Kohler, B., Puzone, R., Seiden, P. E., and Celada, F. (2000). A Systematic Approach to Vaccine Complexity Using an Automaton Model of the Cellular and Humoral Immune System. Vaccine 19, 862–876. doi:10.1016/s0264-410x(00)00225-5
Li, H., Liu, L., Zhang, D., Xu, J., Dai, H., Tang, N., et al. (2020a). SARS-CoV-2 and Viral Sepsis: Observations and Hypotheses. The Lancet 395, 1517–1520. doi:10.1016/S0140-6736(20)30920-X
Li, Q., Guan, X., Wu, P., Wang, X., Zhou, L., Tong, Y., et al. (2020b). Early Transmission Dynamics in Wuhan, china, of Novel Coronavirus–Infected Pneumonia. New Engl. J. Med. 382, 1199–1207. doi:10.1056/nejmoa2001316
Long, Q. X., Liu, B. Z., Deng, H. J., Wu, G. C., Deng, K., Chen, Y. K., et al. (2020). Antibody Responses to SARS-CoV-2 in Patients with COVID-19. Nat. Med. 26, 845–848. doi:10.1038/s41591-020-0897-1
Lui, G., Ling, L., Lai, C. K., Tso, E. Y., Fung, K. S., Chan, V., et al. (2020). Viral Dynamics of SARS-CoV-2 across a Spectrum of Disease Severity in COVID-19. J. Infect. 81, 318–356. doi:10.1016/j.jinf.2020.04.014
Lukan, N. (2020). "Cytokine Storm", Not Only in COVID-19 Patients. Mini-Review. Immunol. Lett. 228, 38–44. doi:10.1016/j.imlet.2020.09.007
Morpurgo, D., Serenthà, R., Seiden, P. E., and Celada, F. (1995). Modelling Thymic Functions in a Cellular Automaton. Int. Immunol. 7, 505–516. doi:10.1093/intimm/7.4.505
Narazaki, M., and Kishimoto, T. (2018). The Two-Faced Cytokine Il-6 in Host Defense and Diseases. Ijms 19, 3528. doi:10.3390/ijms19113528
Pappalardo, F., Russo, G., Pennisi, M., Sgroi, G., Palumbo, G. A. P., Motta, S., et al. (2018). “Agent Based Modeling of Relapsing Multiple Sclerosis: A Possible Approach to Predict Treatment Outcome,” in 2018 IEEE International Conference on Bioinformatics and Biomedicine (BIBM) (IEEE), Madrid, Spain, 3-6 Dec. 2018 (IEEE), 1380–1385. doi:10.1109/BIBM.2018.8621109
Paul, W. (2008). Fundamental Immunology. Fundamental Immunology. Wolters Kluwer/Lippincott Williams & Wilkins. Philadelphia, PA: EUA.
Perelson, A. S. (1989). “Modeling the Interaction of the Immune System with Hiv,” in Mathematical And Statistical Approaches to AIDS Epidemiology (Springer), 350–370. doi:10.1007/978-3-642-93454-4_17
Perelson, A. S. (2002). Modelling Viral and Immune System Dynamics. Nat. Rev. Immunol. 2, 28–36. doi:10.1038/nri700
Pettet, G. J., Byrne, H. M., McElwain, D. L. S., and Norbury, J. (1996). A Model of Wound-Healing Angiogenesis in Soft Tissue. Math. biosciences 136, 35–63. doi:10.1016/0025-5564(96)00044-2
Pigozzo, A. B., Macedo, G. C., Dos Santos, R. W., and Lobosco, M. (2013). On the Computational Modeling of the Innate Immune System. BMC bioinformatics 14, S7. doi:10.1186/1471-2105-14-s6-s7
Pigozzo, A. B., Missiakas, D., Alonso, S., Dos Santos, R. W., and Lobosco, M. (2018). Development of a Computational Model of Abscess Formation. Front. Microbiol. 9, 1355. doi:10.3389/fmicb.2018.01355
Prompetchara, E., Ketloy, C., and Palaga, T. (2020). Immune Responses in COVID-19 and Potential Vaccines: Lessons Learned from SARS and MERS Epidemic. Asian Pac. J. Allergy Immunol. 38, 1–9. doi:10.12932/AP-200220-0772
Quintela, Bd. M., dos Santos, R. W., and Lobosco, M. (2014). On the Coupling of Two Models of the Human Immune Response to an Antigen. Biomed. Research International 2014, 410457. doi:10.1155/2014/410457
Reis, R. F., Fernandes, J. L., Schmal, T. R., Rocha, B. M., Dos Santos, R. W., and Lobosco, M. (2019). A Personalized Computational Model of Edema Formation in Myocarditis Based on Long-axis Biventricular MRI Images. BMC Bioinformatics 20, 532. doi:10.1186/s12859-019-3139-0
Rodriguez-Fernandez, M., Egea, J. A., and Banga, J. R. (2006). Novel Metaheuristic for Parameter Estimation in Nonlinear Dynamic Biological Systems. BMC Bioinformatics 7, 483. doi:10.1186/1471-2105-7-483
Schwaab, M., Biscaia, Jr., E. C., Monteiro, J. L., and Pinto, J. C. (2008). Nonlinear Parameter Estimation through Particle Swarm Optimization. Chem. Eng. Sci. 63, 1542–1552. doi:10.1016/j.ces.2007.11.024
Shang, J., Wan, Y., Luo, C., Ye, G., Geng, Q., Auerbach, A., et al. (2020). Cell Entry Mechanisms of SARS-CoV-2, Proc. Natl. Acad. Sci. USA 117. 11727–11734. doi:10.1073/pnas.2003138117
Shimabukuro-Vornhagen, A., Gödel, P., Subklewe, M., Stemmler, H. J., Schlößer, H. A., Schlaak, M., et al. (2018). Cytokine Release Syndrome. J. Immunotherapy Cancer 6. doi:10.1186/s40425-018-0343-9
Sobol′, I. M. (2001). Global Sensitivity Indices for Nonlinear Mathematical Models and Their Monte Carlo Estimates. Mathematics Comput. simulation 55, 271–280. doi:10.1016/S0378-4754(00)00270-6
Storn, R., and Price, K. (1997). Differential Evolution–A Simple and Efficient Heuristic for Global Optimization over Continuous Spaces. J. Glob. optimization 11, 341–359. doi:10.1023/A:1008202821328
Su, B., Zhou, W., Dorman, K. S., and Jones, D. E. (2009). Mathematical Modelling of Immune Response in Tissues. Comput. Math. Methods Med. 10, 9–38. doi:10.1080/17486700801982713
Tanaka, T., Narazaki, M., and Kishimoto, T. (2014). Il-6 in Inflammation, Immunity, and Disease. Cold Spring Harbor Perspect. Biol. 6, a016295. doi:10.1101/cshperspect.a016295
Tay, M. Z., Poh, C. M., Rénia, L., MacAry, P. A., and Ng, L. F. P. (2020). The trinity of COVID-19: Immunity, Inflammation and Intervention. Nat. Rev. Immunol. 20, 363–374. doi:10.1038/s41577-020-0311-8
Tisoncik, J. R., Korth, M. J., Simmons, C. P., Farrar, J., Martin, T. R., and Katze, M. G. (2012). Into the Eye of the Cytokine Storm, Microbiol. Mol. Biol. Rev., 76, 16–32. doi:10.1128/MMBR.05015-11
To, K. K.-W., Tsang, O. T.-Y., Leung, W.-S., Tam, A. R., Wu, T.-C., Lung, D. C., et al. (2020). Temporal Profiles of Viral Load in Posterior Oropharyngeal Saliva Samples and Serum Antibody Responses during Infection by SARS-CoV-2: an Observational Cohort Study. Lancet Infect. Dis. 20, 565–574. doi:10.1016/S1473-3099(20)30196-1
Varah, J. M. (1982). A Spline Least Squares Method for Numerical Parameter Estimation in Differential Equations. SIAM J. Sci. Stat. Comput. 3, 28–46. doi:10.1137/0903003
Vodovotz, Y., Chow, C. C., Bartels, J., Lagoa, C., Prince, J. M., Levy, R. M., et al. (2006). In Silico models of Acute Inflammation in Animals. Shock 26, 235–244. doi:10.1097/01.shk.0000225413.13866.fo
Waito, M., Walsh, S. R., Rasiuk, A., Bridle, B. W., and Willms, A. R. (2016). “A Mathematical Model of Cytokine Dynamics during a Cytokine Storm,” in Mathematical and Computational Approaches in Advancing Modern Science and Engineering (Springer), 331–339. doi:10.1007/978-3-319-30379-6_31
Wölfel, R., Corman, V. M., Guggemos, W., Seilmaier, M., Zange, S., Müller, M. A., et al. (2020). Virological Assessment of Hospitalized Patients with COVID-2019. Nature 581, 465–469. doi:10.1038/s41586-020-2196-x
Xavier, M. P., Bonin, C. R. B., dos Santos, R. W., and Lobosco, M. (2017). “On the Use of gillespie Stochastic Simulation Algorithm in a Model of the Human Immune System Response to the Yellow Fever Vaccine,” in 2017 IEEE International Conference on Bioinformatics and Biomedicine (BIBM), Kansas City, MO, USA, 13-16 Nov. 2017 (IEEE), 1476–1482. doi:10.1109/BIBM.2017.8217880
Xavier, M. P., Reis, R. F., dos Santos, R. W., and Lobosco, M. (2020). “A Simplified Model of the Human Immune System Response to the COVID-19,” in IEEE International Conference on Bioinformatics and Biomedicine (BIBM) (Los Alamitos, CA, USA: IEEE Computer Society)), 1311–1317. doi:10.1109/BIBM49941.2020.9313418
Zhang, C., Wu, Z., Li, J.-W., Zhao, H., and Wang, G.-Q. (2020). Cytokine Release Syndrome in Severe COVID-19: Interleukin-6 Receptor Antagonist Tocilizumab May Be the Key to Reduce Mortality. Int. J. Antimicrob. Agents 55, 105954. doi:10.1016/j.ijantimicag.2020.105954
Keywords: computational immunology, SARS-CoV-2, COVID-19, mathematical modelling, sensitivity analysis, citokine storm
Citation: Reis RF, Pigozzo AB, Bonin CRB, Quintela BdM, Pompei LT, Vieira AC, Silva LdLe, Xavier MP, Weber dos Santos R and Lobosco M (2021) A Validated Mathematical Model of the Cytokine Release Syndrome in Severe COVID-19. Front. Mol. Biosci. 8:639423. doi: 10.3389/fmolb.2021.639423
Received: 08 December 2020; Accepted: 30 June 2021;
Published: 20 July 2021.
Edited by:
James Leland Olds, George Mason University, United StatesReviewed by:
Carlo Graziani, Argonne National Laboratory (DOE), United StatesRuy Ribeiro, University of Lisbon, Portugal
Copyright © 2021 Reis, Pigozzo, Bonin, Quintela, Pompei, Vieira, Silva, Xavier, Weber dos Santos and Lobosco. This is an open-access article distributed under the terms of the Creative Commons Attribution License (CC BY). The use, distribution or reproduction in other forums is permitted, provided the original author(s) and the copyright owner(s) are credited and that the original publication in this journal is cited, in accordance with accepted academic practice. No use, distribution or reproduction is permitted which does not comply with these terms.
*Correspondence: Ruy Freitas Reis, cnV5LnJlaXNAdWZqZi5icg==