 Amara Jabeen
 Ramya Vijayram2
 Shoba Ranganathan
- 1Department of Molecular Sciences, Macquarie University, Sydney, NSW, Australia
- 2Department of Biotechnology, Bhupat and Jyoti Mehta School of Biosciences, Indian Institute of Technology Madras, Chennai, India
G protein-coupled receptors (GPCRs) are the largest family of membrane proteins with more than 800 members. GPCRs are involved in numerous physiological functions within the human body and are the target of more than 30% of the United States Food and Drug Administration (FDA) approved drugs. At present, over 400 experimental GPCR structures are available in the Protein Data Bank (PDB) representing 76 unique receptors. The absence of an experimental structure for the majority of GPCRs demand homology models for structure-based drug discovery workflows. The generation of good homology models requires appropriate templates. The commonly used methods for template selection are based on sequence identity. However, there exists low sequence identity among the GPCRs. Sequences with similar patterns of hydrophobic residues are often structural homologs, even with low sequence identity. Extending this, we propose a biophysical approach for template selection based principally on hydrophobicity correspondence between the target and the template. Our approach takes into consideration other relevant parameters, including resolution, similarity within the orthosteric binding pocket of GPCRs, and structure completeness, for template selection. The proposed method was implemented in the form of a free tool called Bio-GATS, to provide the user with easy selection of the appropriate template for a query GPCR sequence. Bio-GATS was successfully validated with recent published benchmarking datasets. An application to an olfactory receptor to select an appropriate template has also been provided as a case study.
Introduction
The three-dimensional (3-D) structure of the proteins is important for deciphering its biological function and gaining mechanistic insights of biological events. Analyzing the relationship between sequence, structure, and function between proteins might help in transferring functional annotation between proteins. Cyrus Chothia’s contribution in incorporating computational approaches for a sequence-structure relationship, such as the development of Structural Classification of Proteins (SCOP) database (Lo Conte et al., 2000), has opened up new avenues for structural bioinformatics. The hierarchical division of proteins into classes, folds, superfamilies, and families based on structural and functional similarities by SCOP has enabled linking of known protein structures with homologous sequences lacking a known structure. Distant homologies can also be tracked through the SCOP database (Redfern et al., 2008). The use of homolog structures for generating the structural model of a protein lacking experimental structure forms the basis of homology modeling. The success of the homology model is greatly determined by the selected template and the alignment generated between the target and the template (Wallner and Elofsson, 2005; Haddad et al., 2020). In this article, we have developed a graphical user interface for selecting suitable templates for GPCRs. Our biophysical method for GPCR template selection is based primarily on hydrophobic correspondence (HC) between the target and the template, inspired by the work of Cyrus Chothia on the conceptual methods for hydrophobicity determination (Chothia, 1976).
G protein-coupled receptors, also known as seven transmembrane (TM) domain receptors, constitute the largest family of cell surface receptors with above 800 members in humans. All GPCRs share a common architecture of seven TM helices connected through three extracellular (ECL 1–3) and three intracellular (ICL 1–3) loops with an extracellular amino (N-) terminus and intracellular carboxyl (C-) terminus (Miyagi et al., 2020). The most common classification system used for GPCRs is based on sequence and functional similarities. This schema classifies GPCRs into six classes, viz. class A (rhodopsin-like family), class B (secretin family), class C (metabotropic glutamate family), class D (fungal mating pheromone receptors), class E (cyclic adenosine monophosphate or cAMP receptors), and class F (frizzled/smoothened receptors). All classes of GPCRs govern myriad functionalities within the human body, ranging from sensory perception (smell, taste, vision) to neurotransmission, metabolism, immune response, blood pressure regulation, and cognition (Hu et al., 2017). GPCRs recognize diverse ligands including peptides, hormones, odorants, tastants, vitamins, photons, ions, and metabolites, among others (Wacker et al., 2017). The extracellular ligands bind to the inactive GPCRs and bring about a conformational change to the helical bundle, which in turn activates intracellular transducers such as G-proteins, or β-arrestins. The intracellular transducers are connected to the helical bundle through ICL3. Therefore, GPCRs exhibit multiple conformational states, with the active and inactive states being the predominant ones (Miyagi et al., 2020).
Dysfunction of GPCR signaling leads to pathological conditions within the human body, making GPCRs the largest druggable protein family. More than 34% of FDA approved drugs target GPCRs (Saikia et al., 2019). Currently, only ∼15% of the GPCRs are targeted. This under-representation is mainly due to the absence of known ligands for more than 30% of non-olfactory GPCRs (Insel et al., 2019). Virtual ligand screening coupled with experimentation has resulted in the discovery of novel ligands for numerous GPCRs (Congreve et al., 2020). Both ligand-based virtual screening (LBVS), as well as structure-based virtual screening (SBVs), have been used in finding novel ligands for GPCRs. LBVS can only be applied to the receptors having known ligands. Machine learning-based methods for LBVS are becoming popular for expanding the ligand set of the receptor with a large number of known ligands (Butkiewicz et al., 2019; Jabeen and Ranganathan, 2019). SBVS has also been used to find novel ligands for GPCRs (Congreve et al., 2020) but unfortunately, only 91 GPCRs have experimentally resolved structures to date, according to GPCRdb statistics (Munk et al., 2019) (as of 05.01.2021) with over 500 structures deposited in the Protein Data Bank (PDB) (Berman et al., 2000). This sequence to structure gap is mainly because of the challenges associated with structure determination of GPCRs (Baker et al., 2017; Jabeen et al., 2019a). Among the challenges are difficulties in heterologous expression, lower stability, maintaining the structural integrity by embedding into the membrane-like environment, and the existence of multiple conformations (Miyagi et al., 2020). The booming period for GPCR structural biology started in 2000 when the first GPCR structure (bovine rhodopsin) was resolved (Palczewski et al., 2000). Due to continuous improvement in structural biology methods, experimentally resolved GPCR structures are increasing but they are still under-represented compared to soluble, globular proteins. Experimental structures are now available for all classes except E (Munk et al., 2019). Most of the experimentally resolved structures belong to GPCR class A. Consequently, most of the available drugs in the market target class A receptors (Basith et al., 2018).
Homology modeling could be used for structure-based drug design (SBDD), in the absence of an experimental structure, as it is more reliable than ab initio modeling (Nikolaev et al., 2018). To assess the accuracy of GPCR structural model predictions, community-wide GPCR Dock competitions are conducted. Scientific research groups from all over the world are given the GPCR target sequences for blind structure prediction, with undisclosed 3D structures. The predicted models along with their atomistic interactions with pharmaceutically important small molecules, are then ranked based on the experimentally resolved structures (Kufareva et al., 2014). These competitions have shown that homology models are able to impart valuable insights into receptor-ligand interactions, especially when sequence identity between target and the template exceeds 35% (Alfonso-Prieto et al., 2019). In fact, ligand screening against dopamine D3 receptor was conducted initially using a homology model and provided results comparable to the experimental receptor structure (Carlsson et al., 2011).
Homology modeling of GPCRs poses several challenges, with template selection being the most prominent one. This is due to the unavailability of a close structural template for many GPCRs and limited representation of structures in active and intermediate conformations. Active structures are available for 47 receptors from classes A, B1, C, D, and F, and the structures for 20 receptors (classes A, C, and B1) are present in intermediate conformation. Also, 63 receptors are present in inactive conformation (classes A, B1, C, and F).
The accuracy of homology models is largely dependent on the choice of the template structure (Rataj et al., 2014). There are a number of servers designed specifically for GPCR homology modeling, such as GPCR-I-TASSER, GPCR Online MOdeling and DOcking server (GOMoDo) (Sandal et al., 2013), GPCR-Sequence-Structure-Feature-Extractor (SSFE) (Worth et al., 2017), GPCR-ModSim (Esguerra et al., 2016), and GPCRM (Miszta et al., 2018). The process of template selection varies among each server. GPCR-I-TASSER uses a local meta-threading server (LOMETS) (Zheng et al., 2019) to select templates for a particular GPCR. LOMETS uses eleven different threading programs (CEthreader, FFAS3D, HHpred, HHsearch, MUSTER, Neff-MUSTER, PPAS, PRC, PROSPECT2, SP3, and SparksX) to select templates for a GPCR target. GOMoDo uses the HHsearch protocol to select the template for a query GPCR sequence. The user can either use the server-generated alignment, supply their own alignment, or use a previously stored alignment for GPCR homology model building. GPCR-SSFE selects the template based on the sequence-structure profile generated by HMMER2. The webserver provides a TM-wise template suggestion. It uses 27 GPCR structures as templates. The server-generated alignment is used for model building within GPCR-SSFE. The GPCR-ModSim server uses a set of 33 structures (22 inactive, eight intermediate, and three active) and a GPCR query sequence to generate the profile alignment and then selects the suitable templates. The templates for a specific region can be also selected by the user. The server-generated alignment, as well as a manually edited alignment, can be used for model building. The GPCRM server uses sequence identity calculated by ClustalW2 for selecting the template structures. Single or multiple templates may be selected, depending upon the sequence identity between the query and the template. The server also provides the feature of selecting the template based on the user’s choice. The user can also opt for inactive or active templates. The set of templates include 63 inactive and 31 active GPCR structures.
Numerous benchmarking studies have been conducted by incorporating global and local similarity measures to select the appropriate template for GPCRs. Models based on local similarity measures have produced better results in virtual screening experiments (Castleman et al., 2019; Szwabowski et al., 2020). Multiple studies have shown that sequence identity above 30% could result in good GPCR homology models (within 3 Å) (Shahaf et al., 2016; Loo et al., 2018; Jaiteh et al., 2020). But most of the GPCRs share low sequence identity with available templates. It is also known from the literature that models based on greater sequence identity are not always the best ones and models based on distant homologs have performed well in virtual screening experiments (Rataj et al., 2014; Perry et al., 2015). Therefore, additional measures other than sequence identity must be considered for appropriate template selection. Also, a detailed inspection of all available homolog structures is essential for finding an optimal template, rather than randomly selecting a template based on the closest homolog, to generate better homology models (Kosinski et al., 2013). Sequences with similar hydrophobic patterns are often homologs, resulting in hydrophobicity being used in determining even distant homologs (Lolkema and Slotboom, 1998; Silva, 2008). The consideration of hydrophobic information for GPCR model building enables the representation of functional aspects as well (Crasto, 2010).
We proposed a biophysical approach recently for GPCR template selection (Jabeen and Ranganathan, 2020), which was applied to an olfactory receptor (OR), based on hydrophobicity correspondence (HC), the resolution, completeness of structures (or query coverage), and similarity between the residues within the orthosteric binding pocket for GPCRs (hotspot residues). Bio-GATS presents a GUI for template selection of GPCRs, based on this biophysical approach (Figure 1). Ligand profiles for selected templates and the target can be compared to get an optimal template. Further incorporation of mutagenesis data while refining the binding pocket of the model might help in improving the overall model.
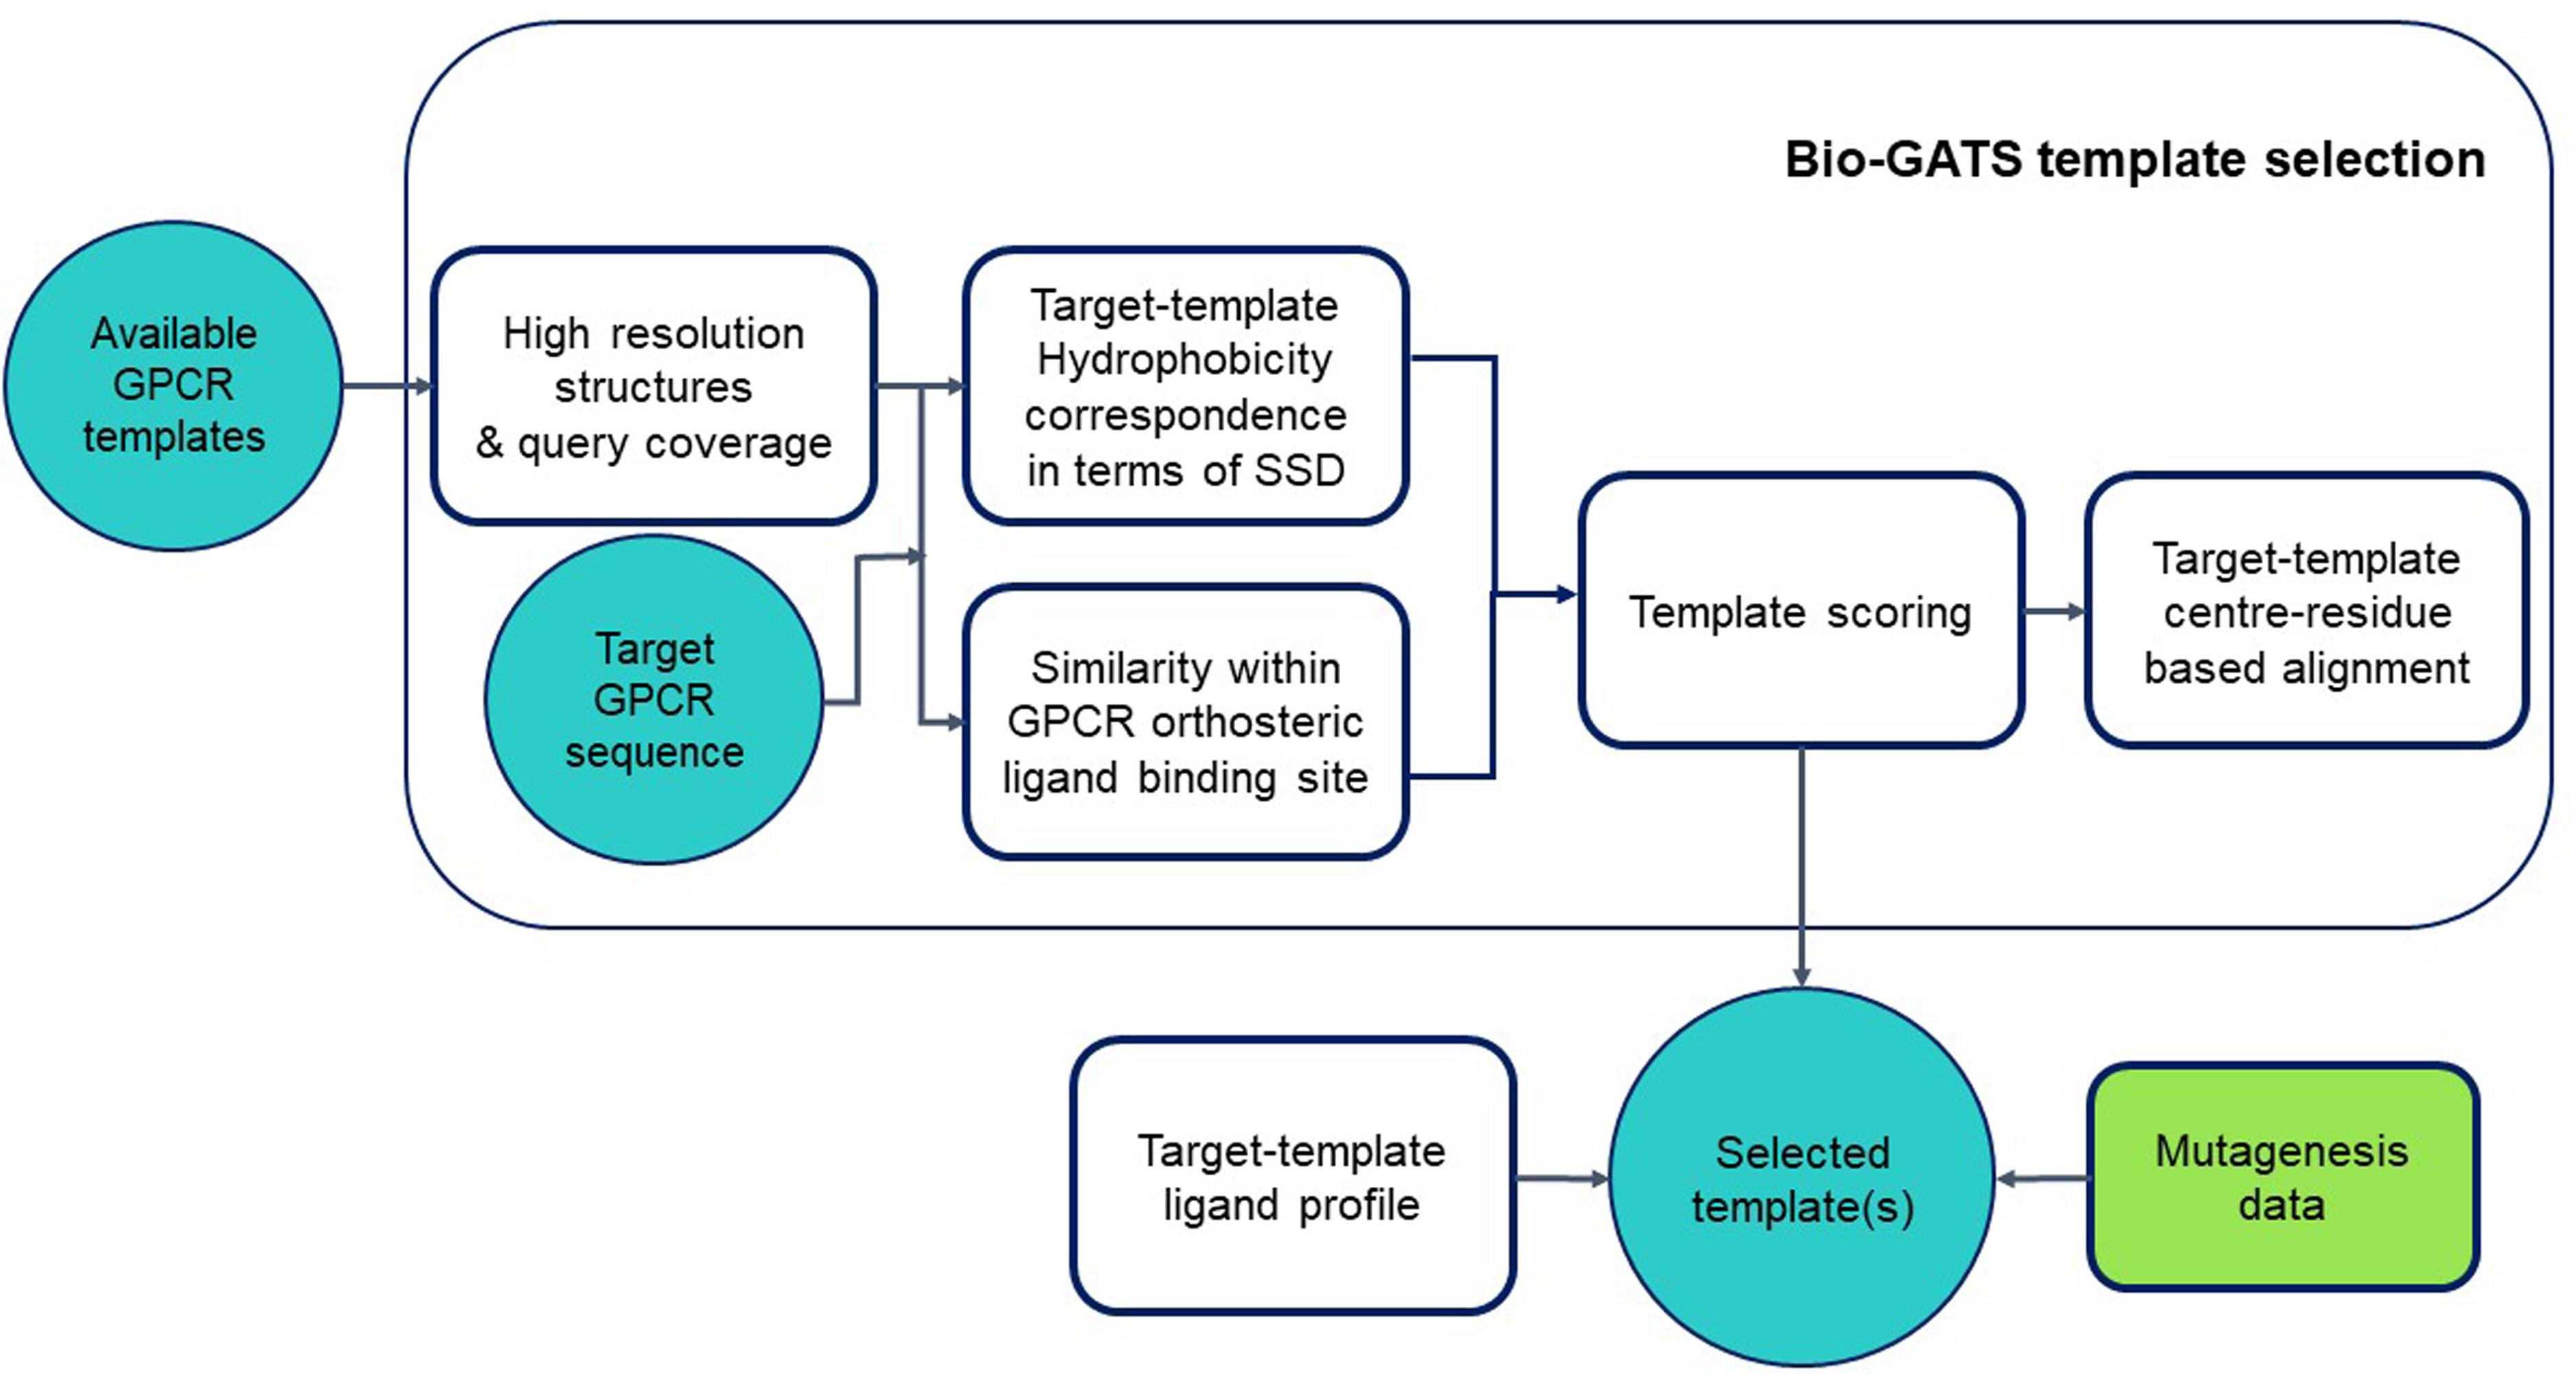
Figure 1. Workflow for GPCR template selection through a biophysical approach, with details of how templates are selected and the alignment is generated.
As a case study, we have selected OR1A1, a human OR, as a query sequence. ORs are the largest superfamily of GPCRs and have no known experimental structure. Only 30 of 405 human ORs are currently known as proteins, with the rest regarded as “missing” proteins on account of insubstantial proteomic evidence (Jabeen et al., 2019a). ORs share low sequence identity with available GPCR structures. Therefore, it is challenging to get a reliable homology model for any OR. OR1A1 is ectopically expressed in gut enterochromaffin cells and proposed to be involved in serotonin release (Braun et al., 2007). Also, OR1A1 is known to be ectopically expressed in HepG2 liver cells where it is responsible for hepatic triglyceride metabolism modulation (Wu et al., 2015).
Materials and Methods
Bio-GATS is written in Python 3 programming language (Van Rossum and Drake, 2011). The interface was built using PyQt5. The computing was performed through pandas. The numPy library was utilized for mathematical tasks. Biopython (Cock et al., 2009) was used for running BLAST (Altschul et al., 1990) locally through the command line, and for aligning the query sequence with that of the template. The HC plots were visualized using matplotlib. The hydrophobicity moment was calculated and plots were visualized using modlAMP package (Müller et al., 2017). A downloadable result summary file, from which images and data can be easily extracted, is generated in Microsoft (MS) Word format, using the docx library.
Bio-GATS requires Python, Biopython and also local BLAST to be installed locally to align sequences and then calculate the sequence identity values. Bio-GATS is linked to the GPCR dataset stored in an MS Excel file, which can be updated locally, as new GPCR structures are solved. The template selection process is divided into three steps: TM splitting and alignment, HC calculation, and finally, sequence similarity calculation among hotspot residue positions within the target and the template.
Also, a scoring matrix has been defined to rank the templates. The final score of the template is calculated based on resolution, the HC score, and binding site (or hotspot) residue similarity (BRS) score.
GPCR Dataset
The dataset used by Bio-GATS comprises GPCR sequences, available GPCR structural templates, TM definition of each entry and structure resolution, conformation, and positions having structural information for each of the available templates (query coverage). The data for available GPCR structures were downloaded from GPCRdb. It contains 76 unique receptors and over 400 PDB entries (as of 05.08.2020). The resolution of GPCR structures varies from 1.7 to 7.7 Å. Some GPCRs are over-represented, with 52 different structures of variable resolution available for bovine rhodopsin (UniProtKB OPSD_BOVIN) followed by 49 structures for human adenosine receptor A2a (AA2AR_ HUMAN). The data for 814 GPCR sequences and their TM definitions were taken from the published GpcR Sequence-Structure (GRoSS) alignment (Cvicek et al., 2016).
TM Splitting and Alignment
During the first step, the sequence of each TM was retrieved after splitting the sequence of both target and template according to the TM definitions taken from the GRoSS alignment. The corresponding TMs of target and template were then aligned together by tethering the center residues of each helix, as adopted by several groups (Wolf et al., 2017; Abaffy et al., 2018). The center residue for each helix is labeled as X.50 (X being the TM number), according to Ballesteros–Weinstein numbering scheme (Ballesteros and Weinstein, 1995).
Hydrophobicity Profile Generation
The hydrophobicity profile for each helix was generated using the Eisenberg scale (Eisenberg et al., 1984), as detailed in our recent publication (Jabeen and Ranganathan, 2020) and briefly outlined here. A moving window of size 11 was set up as suggested for the identification of putative transmembrane α-helices (Wallace et al., 2004). The average value over all the residues in a window was taken and ascribed to the center residue of the window. We then measured the HC between each aligned helix of the target and the template. The HC is represented as the sum of squared differences (SSD) (eq. 1 and eq. 2):
where Hn is the calculated hydrophobicity for the aligned template-target residue in the nth position of the alignment and hi is the hydrophobicity of the ith residue from the Eisenberg scale. The value, is normalized by dividing with the total number of residues in a particular helix, as the SSD value is length dependent and will only be relevant if a per-residue value is considered.
Calculating Sequence Similarity Between Hotspot Residues Known for GPCRs
We have taken the 24 traditional orthosteric ligand binding positions observed in most of the available GPCR structures. The positions are labeled according to Ballesteros–Weinstein numbering scheme and include 3.28, 3.29, 3.32, 3.33, 3.36, 3.37, 4.52, 5.39. 5.40, 5.43, 5.44, 5.47, 5.53, 6.44, 6.48, 6.51, 6.52, 6.55, 6.58, 7.31, 7.34, 7.38, 7.41, 7.42 (Chan et al., 2019). The similarities between these hotspot residues among the target-template pairs were computed using GPCRtm scoring matrix, designed specifically for GPCRs considering the compositional bias of hydrophobic TM regions (Rios et al., 2015).
Target-Template Scoring
Each of the selected templates is scored based on two parameters: the HC-score and the BRS score (Munk et al., 2019). For each aligned helix, if the SSD per residue is between 0 and 0.1, 2 is added to the HC-score, while for SSD per residue >0.1, 1 is subtracted from the HC-score. This scheme is adapted from the BLAST match and mismatch scoring scheme and provides significant weighting for hydrophobicity. The overall HC-score is computed for each target-template pair using eq. 3,
where Sh is the overall hydrophobicity correspondence score ranging from helix 1 to 7, and si is the SSD per residue per helix. Sb is computed through GPCRtm matrix, Sr is the resolution score. If the resolution is ≤ 2.5 Å, the value for Sr is 1, otherwise it is 0. The total score St is computed by eq. 4.
Sh can attain a maximum value of 14 while Sb may exceed 70, depending upon the score computed by GPCRtm. To avoid biases, we normalized both Sh and Sb between 0 and 1 and computed the ranking score, Srank for ranking the top three templates while searching for templates, using eq. 5,
where Srank is the total score between the target-template pair, is the normalized HC-score, is the normalized BRS score and Sr is the resolution score, retained from eq. 4.
Homology Modeling
Bio-GATS provides a complete alignment that was used to build a 3-D structural model for SBVS using Modeller 9.18 (Webb and Sali, 2017) by a previously established protocol for GPCR homology modeling (Jabeen et al., 2019b). The sequence alignment between the target and the template can be manually adjusted using MEGA7 (Kumar et al., 2016) by tethering center residues, class A GPCR conserved motifs, and cysteine residues forming a disulphide bridge. Bio-GATS uses predicted transmembrane regions from the GRoSS sequence alignment of all known GPCRs sequences (Cvicek et al., 2016). The ligand of each template was initially copied to the 3-D model and removed later to create an empty binding pocket within the query model structure for the OR1A1 case study.
Molecular Docking
For OR1A1, molecular docking of ligands was performed with ICM software (Abagyan et al., 1994). The binding pocket was predicted though ICMPocketFinder (An et al., 2005) and selected based on the available mutagenesis data for all ORs (Jabeen et al., 2019a).
Results and Discussion
Bio-GATS has been tested on multiple computers, running on Linux as well as Windows platforms, and found to run successfully with the required dependencies installed. To validate our approach, we applied it to recent target-template datasets from published benchmarking studies and compared the results. We also considered representative receptors from each class (A, B, C, D, and F) with known experimental structure and built their models on the basis of templates selected by Bio-GATS. The models were then compared with the cognate experimental structures by calculating their root mean square deviation (RMSD) values. Further, we carried out a case study using an ectopically expressed olfactory receptor, OR1A1. We used the best templates from our approach, to build the models for OR1A1, which were validated by molecular docking with known ligands of the receptor, to check for retrieval of mutagenesis data important for ligand binding.
Performance of Bio-GATS on Published Benchmarking Datasets
To assess the performance of Bio-GATS, we collated the already published target-template pairs used in benchmarking studies and/or virtual ligand screening (VLS) runs. The best benchmarked modeling pair choices, as well as pairs which did not perform well, were considered for the analysis. The performance of the templates was ranked as good or bad, in published studies, on the basis of good ligand enrichment in VLS (Perry et al., 2015; Loo et al., 2018; Jaiteh et al., 2020), local and global (RMSD) from crystal structures (Castleman et al., 2019), and both ligand enrichment and RMSD from the crystal structure (Shahaf et al., 2016). Researchers have compared varied parameters in these studies among the target-template pairs, including global sequence identity, TM-wise sequence identity, local sequence identity (identity within the binding pocket), model refinement through molecular dynamics and/or induced-fit docking, and the ligand binding site plasticity. These parameters were applied to classify templates as good or bad in their publications.
We applied our approach to these selected target-template pairs and compared the results of published studies and our approach. A total of 28 target-template pairs for nine different GPCR targets belonging to class A and published within last 5 years were considered for comparison. We calculated St for each target-template pair. All target-template pairs rankings in the benchmarking studies corresponded to the numerical St values (Table 1 and Supplementary Table 1). The top St scores for each target was ranked “good” in the benchmarking studies.
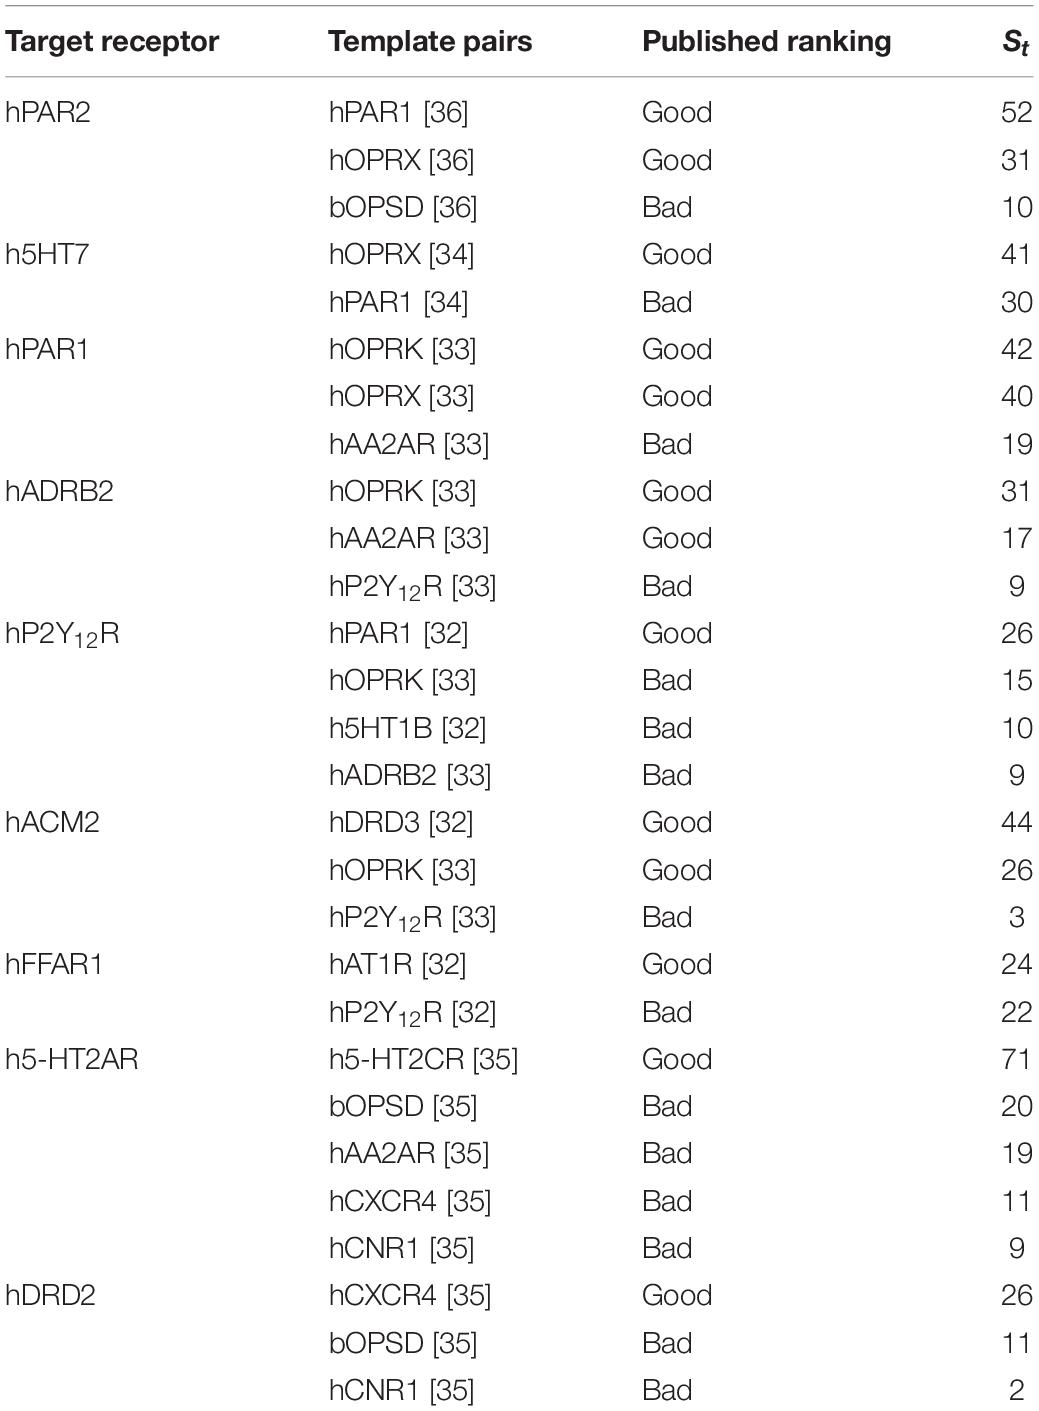
Table 1. Performance of Bio-GATS on recent published target-template pairs.
It was also evident from the collected dataset that high sequence identity does not always imply a good HC. PAR2_HUMAN shows good HC with both PAR1_HUMAN and OPRX_HUMAN, in accord with the VLS results (Perry et al., 2015), although it is closer to PAR1_HUMAN (sequence identity: 41%) than to OPRX_HUMAN (sequence identity: 28%). There are many instances where good HC is observed among the target-template pairs even the sequence identity falls below 30% (Supplementary Table 1).
Also, sequence-structure correlation is not always implied according to the published studies, for instance, the model of P2Y12R based on P2Y12R- PAR1_HUMAN pair (sequence identity: 23%) was closer to the P2Y12R crystal structure in comparison with the model based on the P2Y12R- OPRK_HUMAN pair (sequence identity: 28%) (Castleman et al., 2019). We note that the St scores reported here correctly rank PAR1_HUMAN as the best template over the other three templates (Table 1), without model building and VLS.
In the case of PAR2- PAR1_HUMAN and PAR2-OPSD_BOVIN pairs, although both have good HC, the hotspot residues are dissimilar, with Sb(PAR2-OPSD_BOVIN) of −2, and Sb(PAR2- PAR1_HUMAN) of 51. Thus, BRS comparison is a useful parameter in selecting the appropriate template for GPCRs. Overall, the St score is able to identify the best template for each of the nine target receptors in Table 1.
Validating Bio-GATS Template Selection Through Experimentally Resolved GPCR Structures
To further validate Bio-GATS, we selected 20 class A, 10 class B, four class C, one class D, and three class F receptors having experimentally solved structures. In all cases, the experimental structure was selected as the top ranked target template by Bio-GATS. Ignoring this top ranked structure, homology models for 38 receptors were build using Modeller (Webb and Sali, 2017) based on the second top template selected through Bio-GATS. The alignment was manually edited within loop regions through MEGA7 (Kumar et al., 2016). The generated models were compared with experimental structures through RMSD calculation for TM regions. For all models the RMSD of structurally aligned region was in the range 0.5–2.5 Å (Supplementary Table 2) as shown in Figure 2 (mean = 1.38 ± 0.43 Å, median = 1.29 Å). The interquartile range (IQR) for all classes is 0.60 Å. For individual classes, class A is showing the IQR from 0.62 Å with sample size of 20. The IQR for class B and C is 0.36 and 0.16 with sample size of 10 and 4, respectively. To date, as only one structure is available for class D, this template was selected for this receptor, although it is phylogenetically distant and therefore showing a high RMSD value. The IQR for modeled class F receptors 0.1 with sample size 3 although two of three models were built on the basis of class B templates. The results of this study on 38 representative receptors from each class are showing the utility of hydrophobicity correspondence as a measure for template selection. The median for individual classes was under 1.5 Å except for classes D and F.
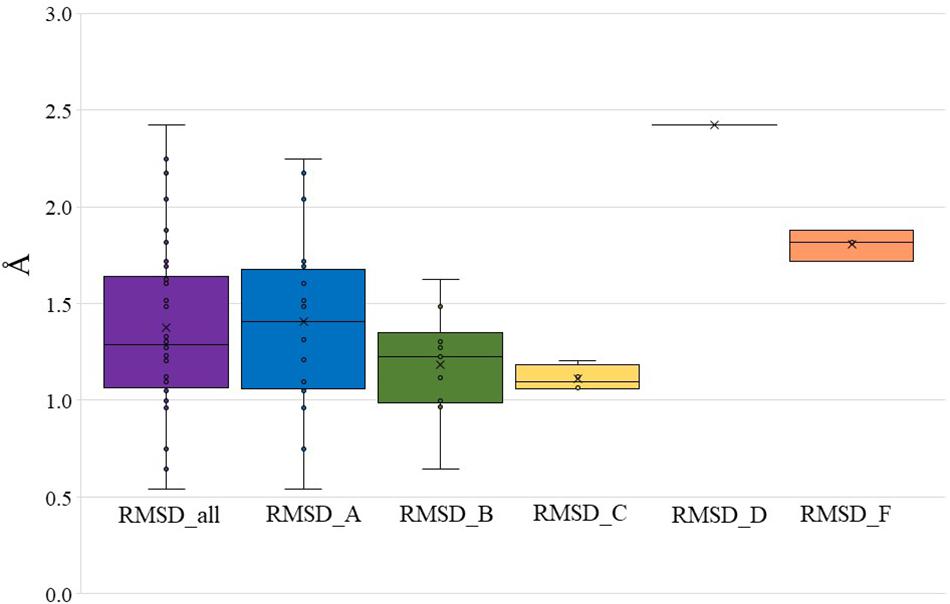
Figure 2. RMSD between modeled structures and experimental structures for all GPCR classes, class A, B, C, D, and F (presented in Supplementary Table 2). The boundary of the box closest to zero indicates the 25th percentile, a black line within the box marks the median, and the boundary of the box farthest from zero indicates the 75th percentile.
Subsequently, three receptors from classes A, B, C, F, and the single class D receptor was modeled through GPCR modeling servers such as GPCR-ModSim (Esguerra et al., 2016), GoMoDo (Sandal et al., 2013), GPCRM (Miszta et al., 2018), and GPCR-SSFE (Worth et al., 2017). The RMSDs for TM regions of automated models and models constructed using Bio-GATS suggested templates were compared (Table 2). We chose to compare RMSDs of TM regions only as loop modeling and refinement within servers is a time taking process. GPCR-SSFE was only able to generate models for class A GPCRs. While GPCR-ModSim cannot accept input sequence greater than 600 residues therefore, could not model selected class C GPCRs and one class F GPCR, i.e., SMO_human. Also, for all the receptors from class A to F considered for this study, GPCR-ModSim always selected the template from class A. Of 13 GPCRs, five models built on the basis of templates selected by Bio-GATS showed minimum RMSD with experimental structure of the receptor. The four models constructed by GPCRM (CRFR1_human, GRM1_human, GRM5_human, SMO_human) were based on receptor’s own structure as a template therefore, showing the minimum RMSD (Table 2). The RMSD comparison shows the utility of our biophysical method to select the appropriate templates for all classes of GPCRs.
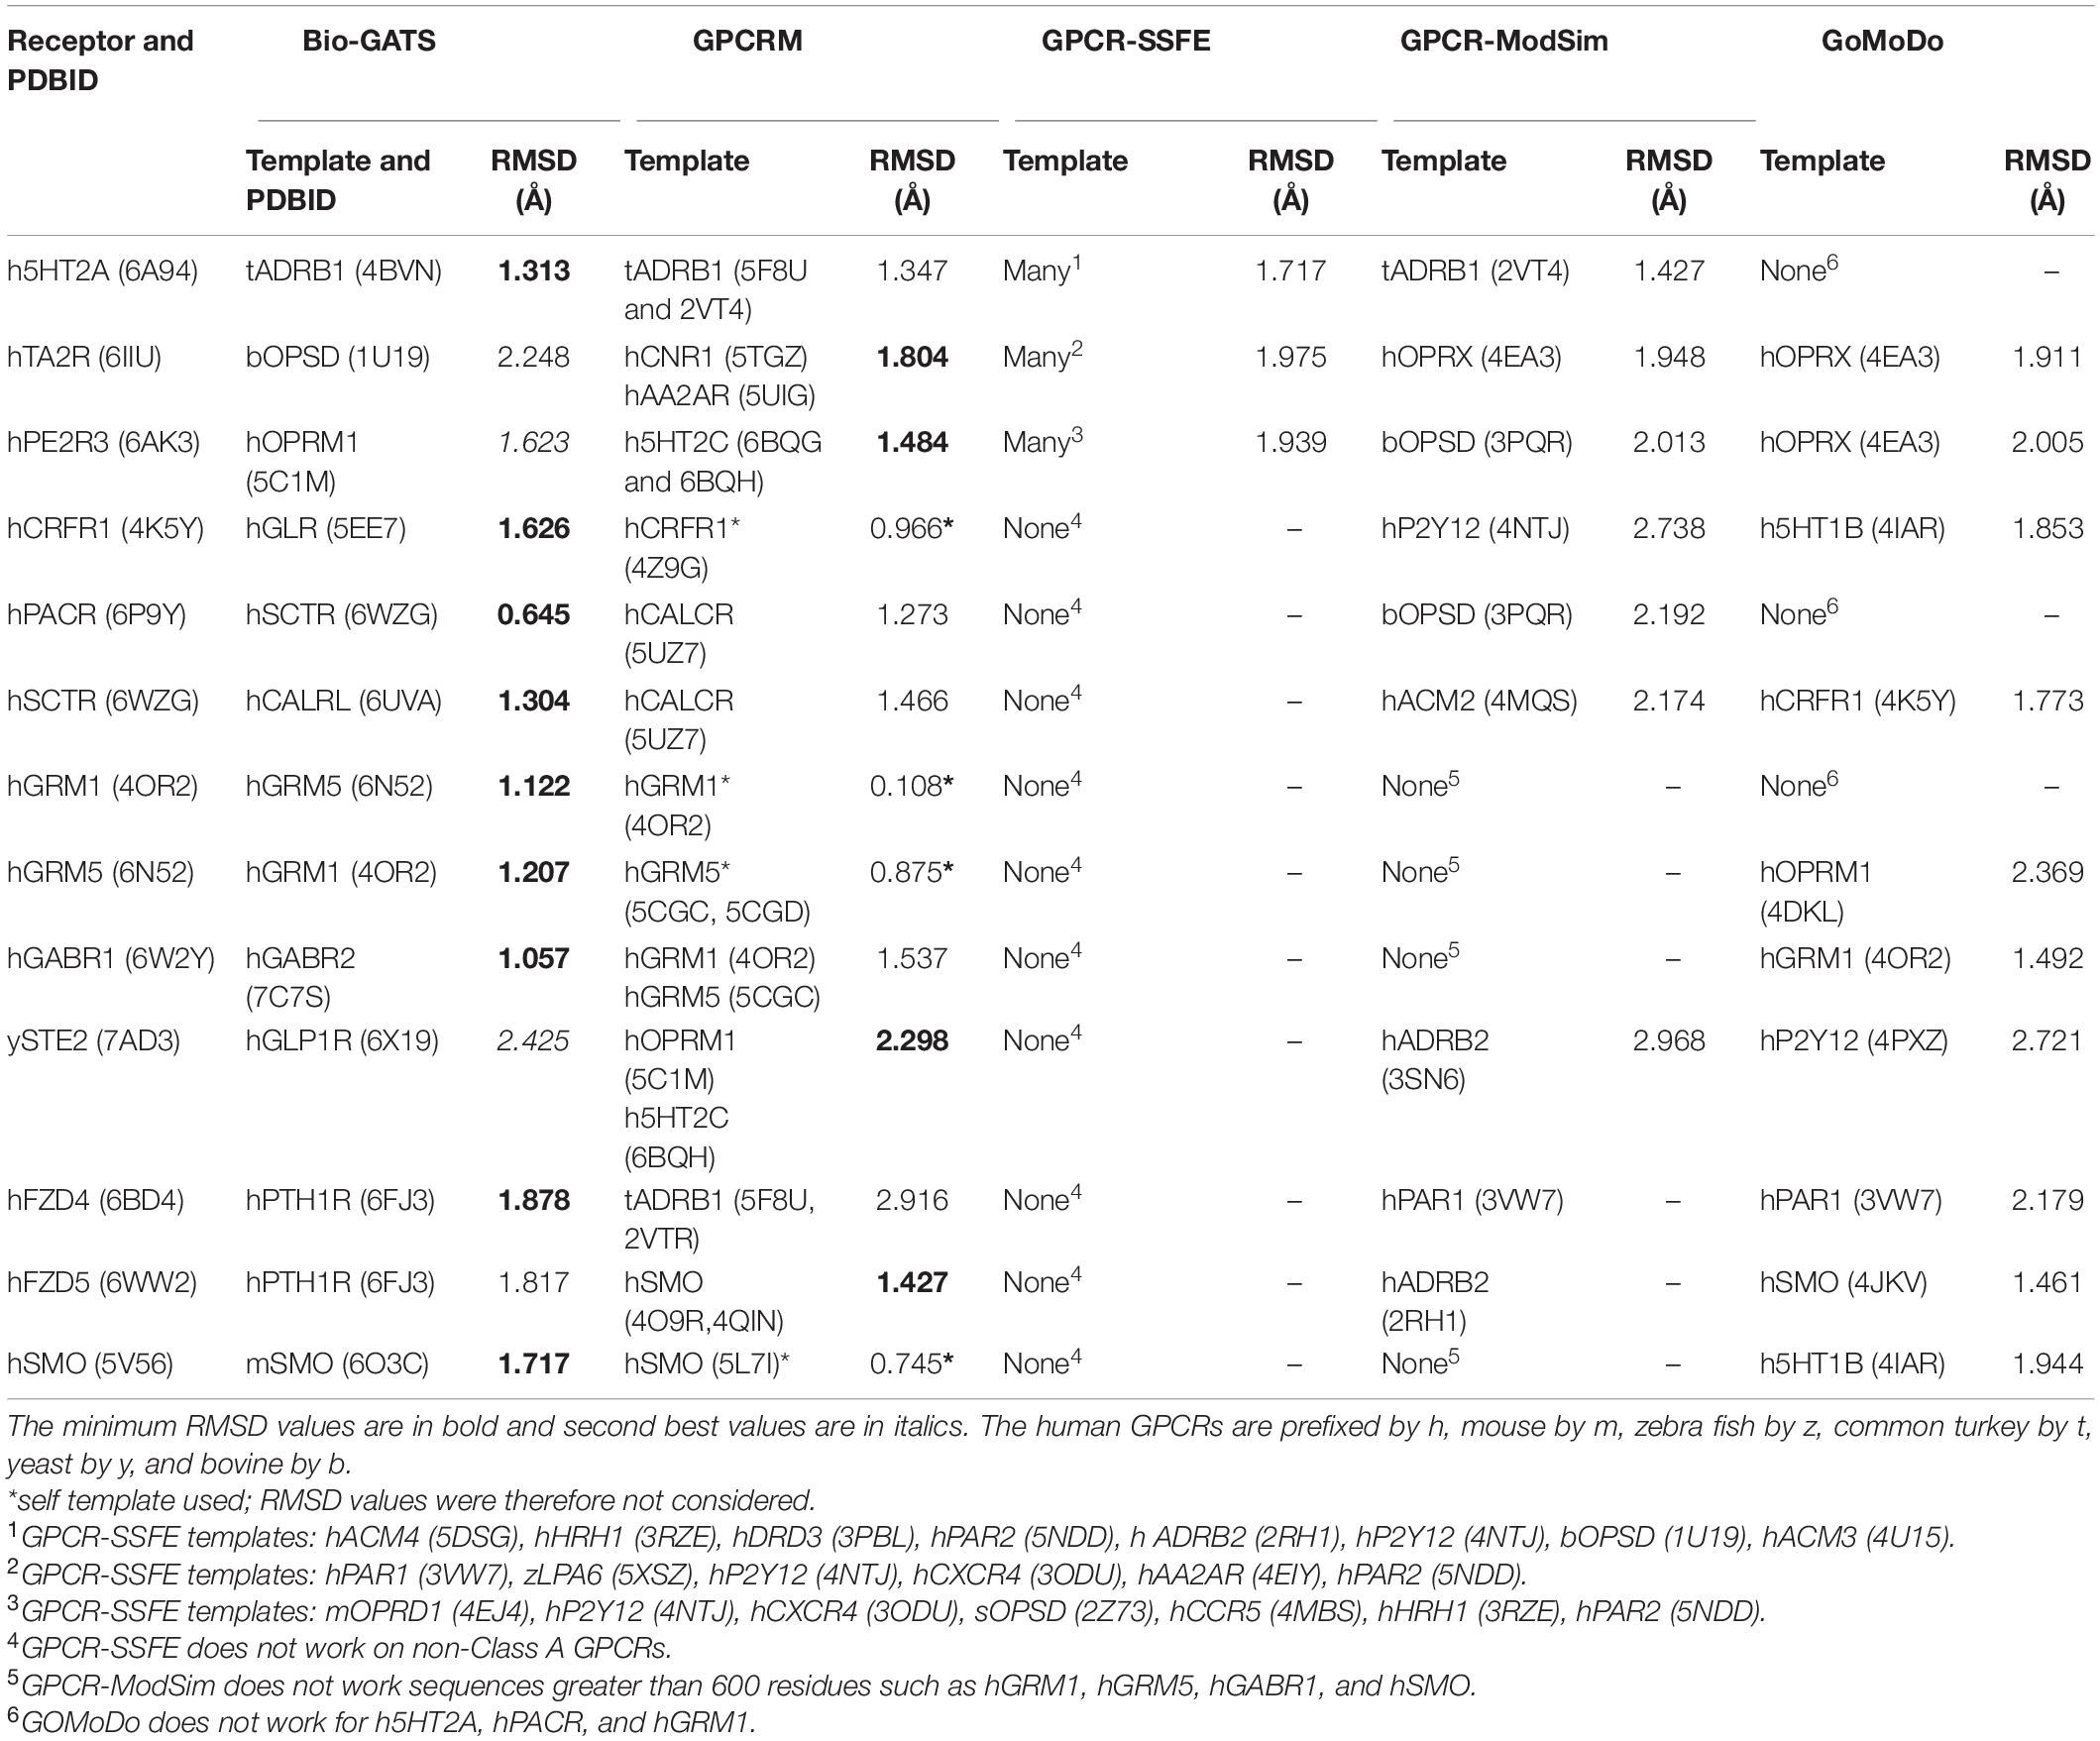
Table 2. The templates selected by Bio-GATS and the automated servers for representative GPCRs from each class along with RMSD values between the generated models and experimental structures for TM residues.
To further extend the application of Bio-GATS we built three models each for class A and C orphans through servers as well as on the basis of Bio-GATS suggested templates. The structural alignment of automated models and manual model (based on Bio-GATS template) for GPR35_human showed the differences in modeling TM1 by GPCRSSFE and TM6 by GPCRM. For P2RY10, the model built by GoMoDo was distorted with disoriented TM1 (Supplementary Figure 1). For class C orphans, there were significant differences among all the automated and manual models as shown by structural superposition (Supplementary Figure 2) and RMSD values (Supplementary Table 3).
Case Study on OR1A1
Currently, there exists no close homolog for ORs as evident from the phylogenetic tree between available GPCR templates and OR1A1 (Figure 3). We used Bio-GATS to search for an optimal template for OR1A1. We selected OR1A1 as a case study because it contains the maximum mutagenesis data against six ligands among OR superfamily. The selection of templates was done on the basis of resolution (Insel et al., 2019), matching hydrophobicity profiles (Sh), and the BRS score (Munk et al., 2019). We considered inactive structures having ≤ 2.5 Å resolution, in accord with our earlier study on OR1A2 (Jabeen and Ranganathan, 2020). The top three templates selected by Bio-GATS for OR1A1 are human NK-1 or tachykinin receptor 1, NK1R_HUMAN (PDBID: 6HLP), bovine rhodopsin, OPSD_BOVIN (PDBID: 1U19) and the human thromboxane A2 receptor, TA2R_Human (PDBID: 6IIU). We also considered one template (CXCR4_HUMAN, PDBID: 3ODU) that was showing poor HC and low BRS score with OR1A1, for comparison, from the downloadable Bio-GATS result summary table (available from Bio-GATS Github page). All four structures belong to class A GPCRs. 6HLP and 6IIU show greater than 35% sequence identity with OR1A1 (Table 3).
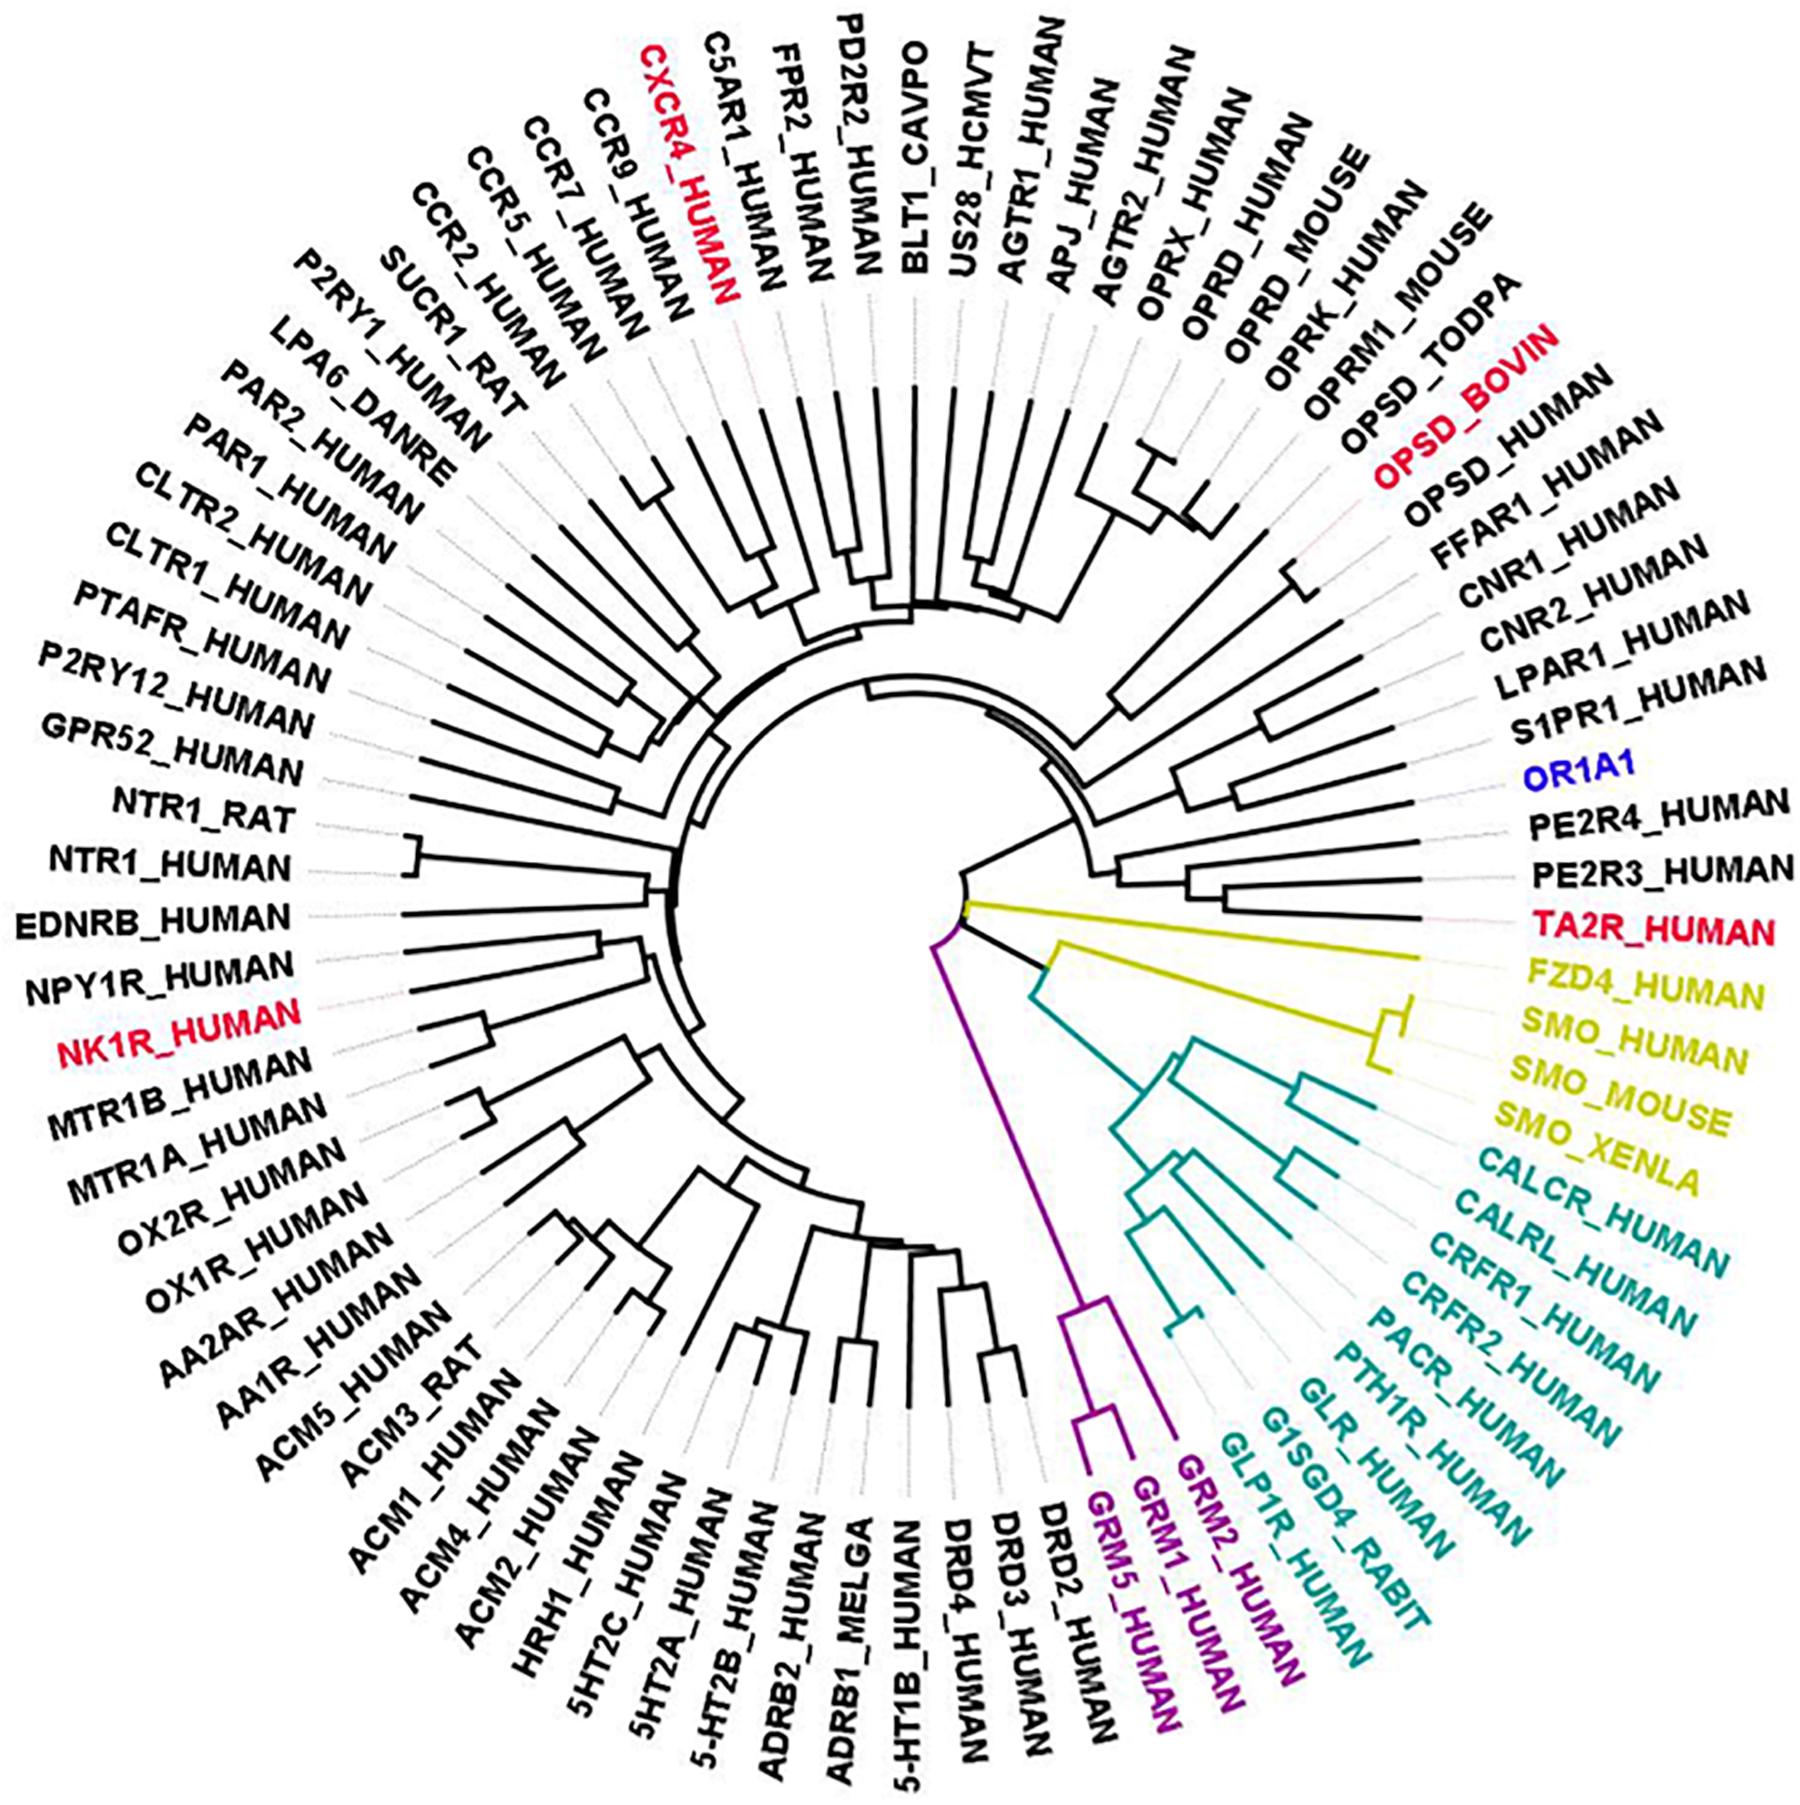
Figure 3. Phylogenetic tree showing all available GPCR templates are distantly related to OR1A1. The selected templates for OR1A1 are shown in red color, members having known structures for class A are in black, Class B1 are in green color, Class C are in purple, and Class F are in gold color.
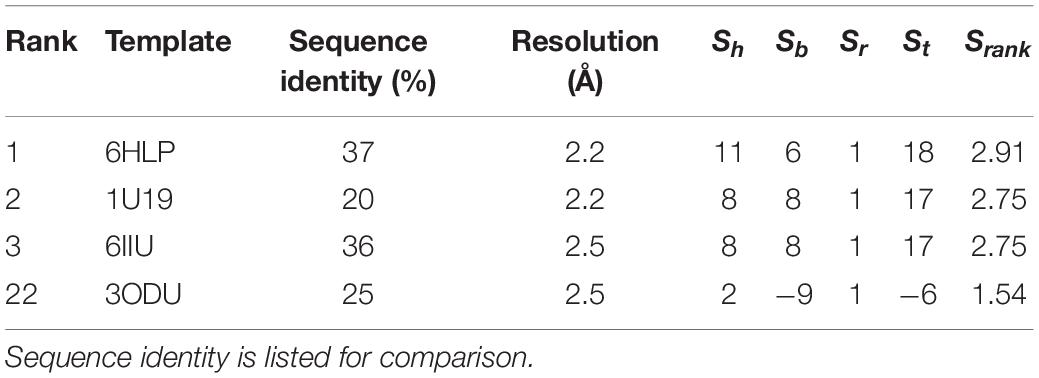
Table 3. Parameters used by Bio-GATS to predict top templates for OR1A1.
Hydrophobic correspondence for each TM of the top two templates 6HLP and 1U19 compared to OR1A1 are shown in Supplementary Figures 3, 4, with the other two templates to OR1A1 shown in Supplementary Figures 5, 6. All OR1A1 TMs have good HC with 6HLP TMs, except TM6. OR1A1 shows good HC with 1U19 from TM1 to TM5 but not for TM6 and TM7, while it shares good HC with 6IIU in TM1, 2, 3, 5, and 6 but not in TM4 and TM7. The OR1A1 has poor HC throughout with 3ODU except within TM1, 3, and 5. The hydrophobic moment was calculated for both the target sequence as well as the template sequences. The hydrophobic moment plots show the amphiphilic nature of the helices for the target as well as templates (TM1 in Figure 4, TM2–7 in Supplementary Figures 7–9). Amphiphilic helices are partly in the membrane and partly exposed to the aqueous phase. We used the Eisenberg scale and a window size of 11 as suitable for membrane proteins (Eisenberg et al., 1984) to calculate the hydrophobic moment of each helix. The hydrophobic moment points in the direction of maximum hydrophobicity (shown by an arrow within the hydrophobic moment plots) and it often faces the lipid surface (Liu et al., 2004). A large hydrophobic moment value shows the amphiphilicity of the helix perpendicular to its axis (Eisenberg et al., 1982). TMs 5, 6, and 7 for OR1A1 are more amphiphilic as compared to the rest of the helices. The hydrophobic moments for OR1A1 TMs 1, 2, 5, and 6 are pointing almost in the same direction as 1U19 (Figure 4 and Supplementary Figures 7–9). The incorporation of hydrophobic moment information into the structural model building is essential in the proper positioning of helices within the model (Crasto, 2010).
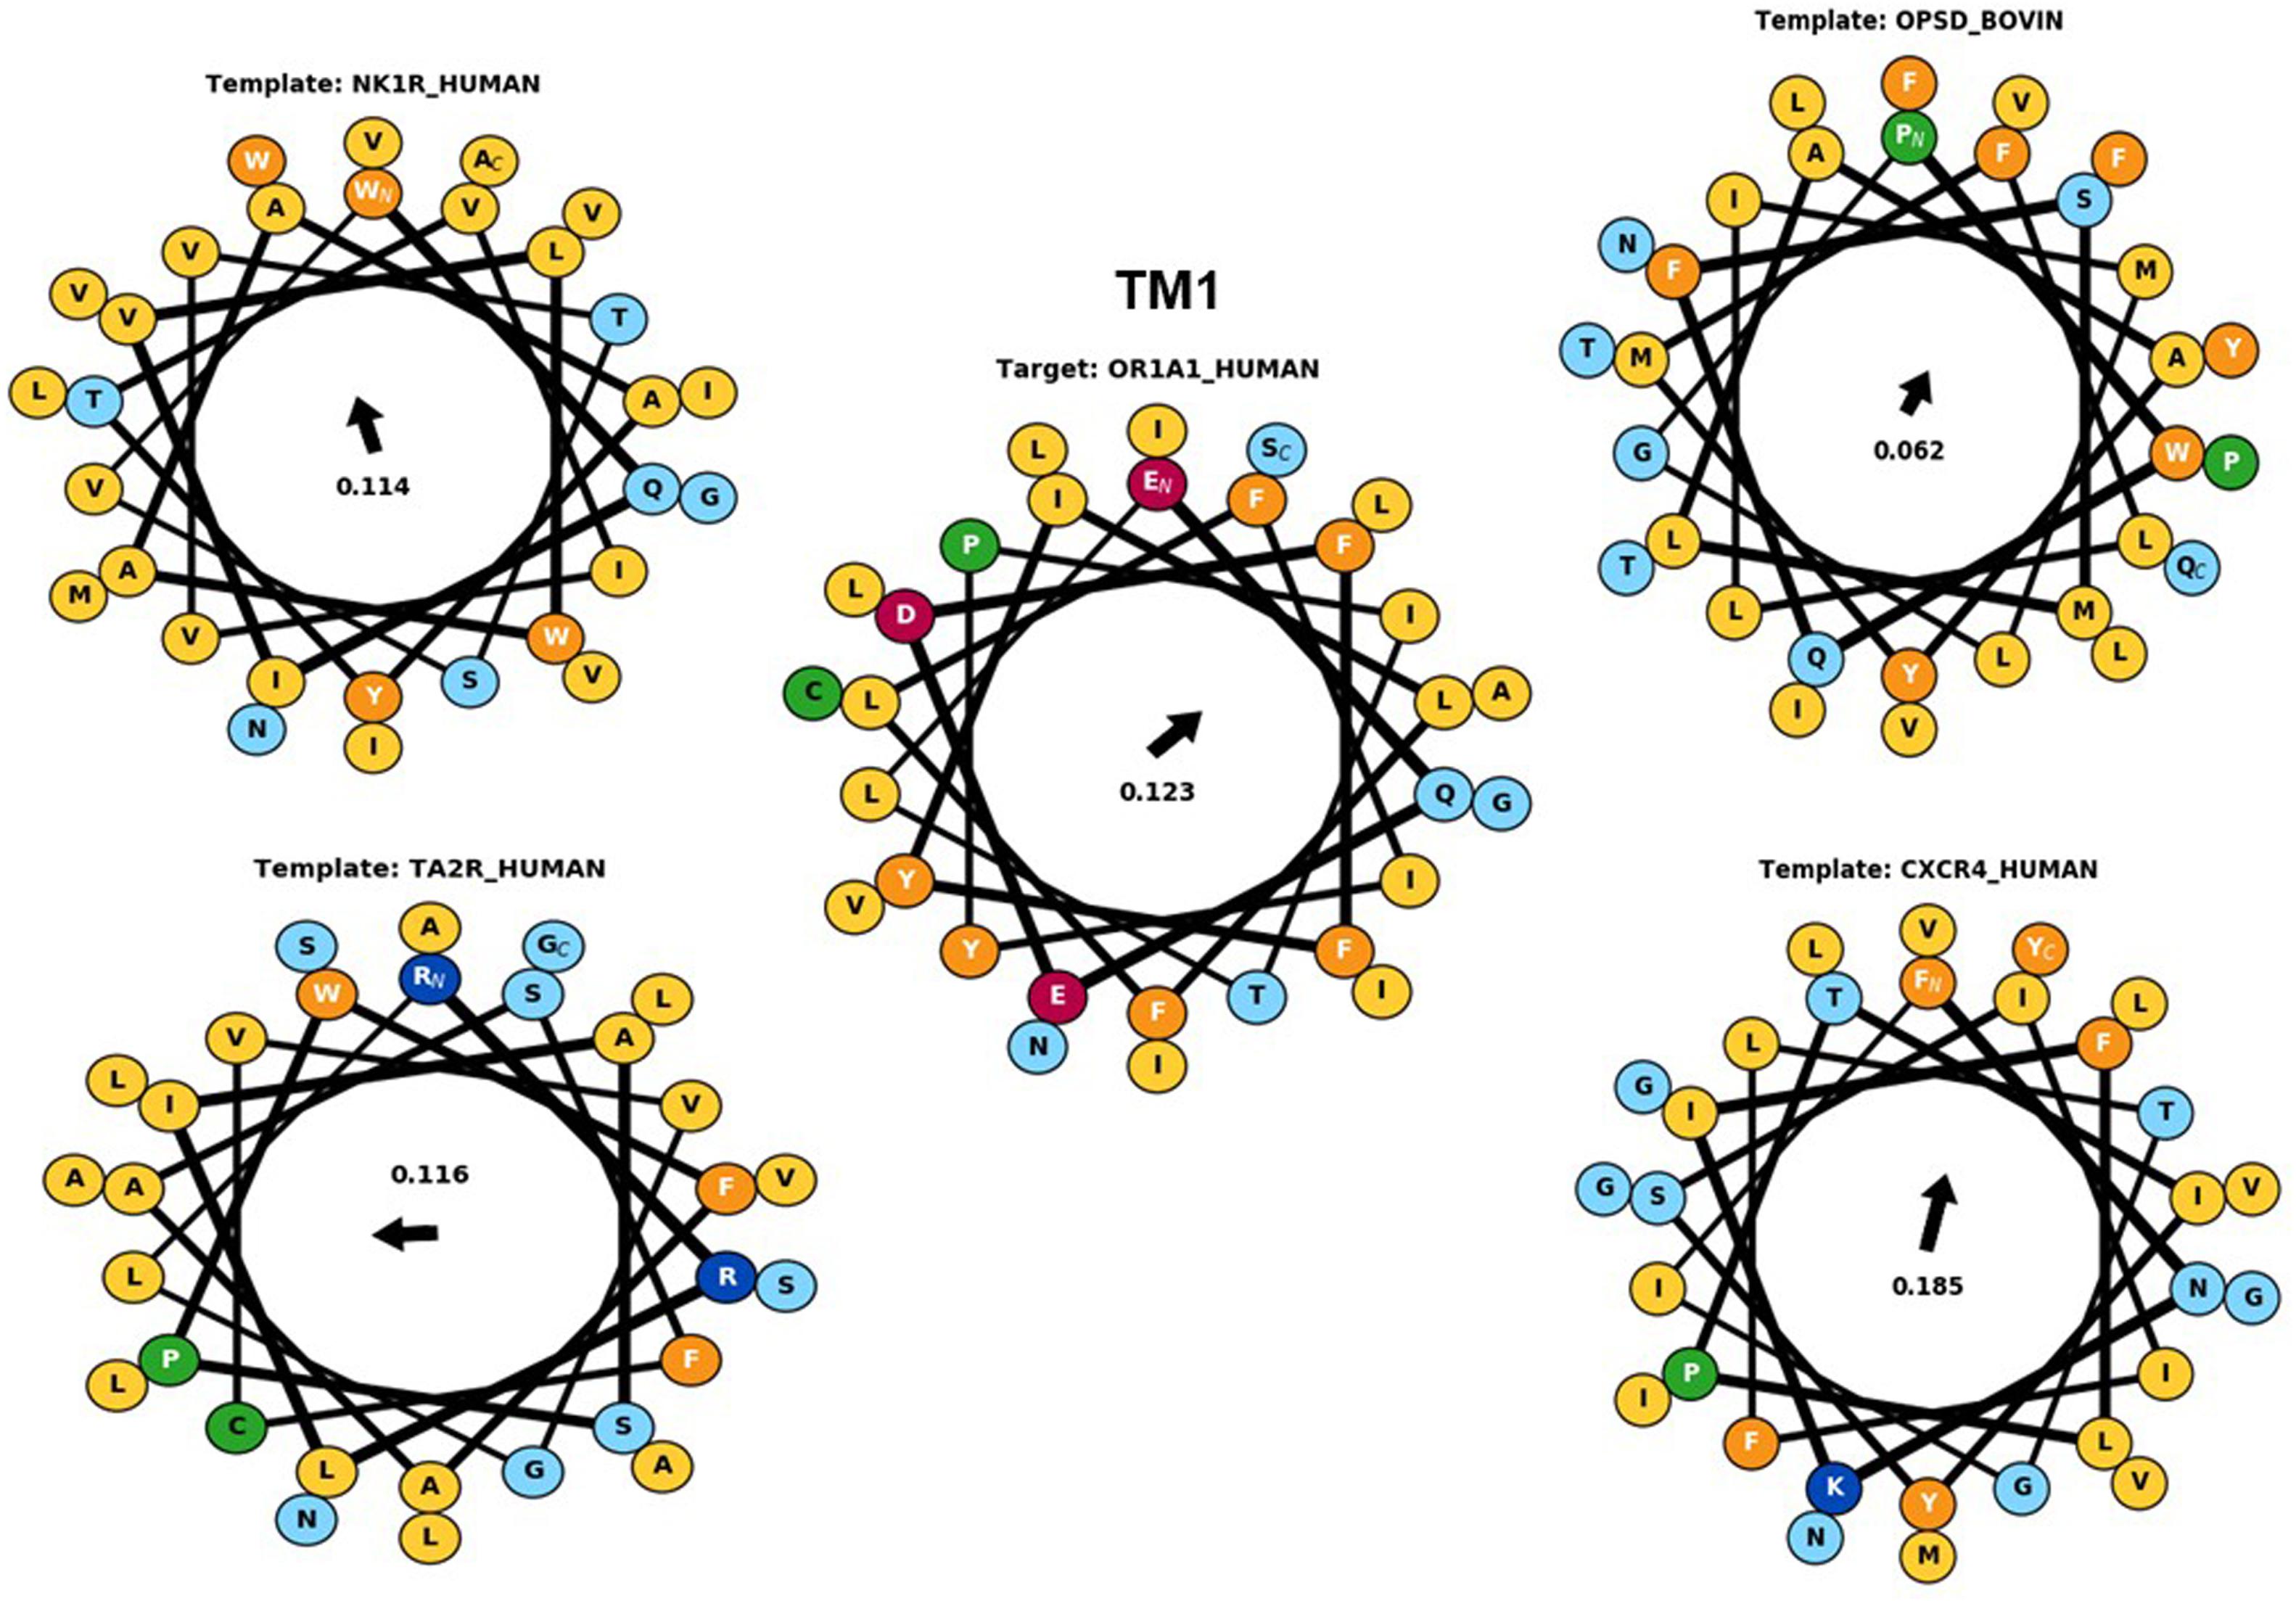
Figure 4. The helical wheel plots are taken from Bio-GATS for the TM1 of the target sequence (OR1A1) and the templates [NK1R_Human (6HLP), OPSD_BOVIN (1U19), TA2R_Human (6IIU), and CXCR4_Human (3ODU)]. The hydrophobic moment for OR1A1 and 1U19 are pointing in similar directions.
An example of the downloadable Bio-GATS summary file, with details of helix-wise alignment, HC comparison and hydrophobic moment results, along with the overall GRoSS alignment, is provided for the OR1A1-1U19 target-template pair in Supplementary Note 1.
For most queries, there best scoring template can be selected for analysis, and the Bio-GATS alignment can be used directly for model building and SBVS. For OR1A1, the top three templates show very similar Srank scores (Table 3), suggesting that they may all be suitable for the query sequence, due to the evolutionary distance of OR1A1 (and other ORs in general) from available templates (Figure 2). Further analysis such as ligand profiling is required from our previous study on OR1A2 (Jabeen and Ranganathan, 2020), to see if all three templates are equally suitable or one is better than the other two.
We calculated the Tanimoto score between the known OR1A1 ligands and the ligand bound to the template structures, based on PubChem fingerprints computed using Knime (Berthold et al., 2009). Retinal (PubChem CID: 638015), the ligand for 1U19 (Figure 5 in blue) is more similar to the known ligands for OR1A1 followed by ramatroban (PubChem CID: 123879, Figure 4 in green) in 6IIU and netupitant (PubChem CID: 6451149, Figure 5 in gold) in 6HLP. We also compared the ligand profile for the lower scoring 3ODU and OR1A1. An isothiourea derivative, ITD (PubChem CID: 25147749, Figure 5 in pink), the ligand for 3ODU, did not match with any OR1A1 ligand (Figure 5), listed in listed in Supplementary Table 4 and is clearly not suitable for OR1A1.
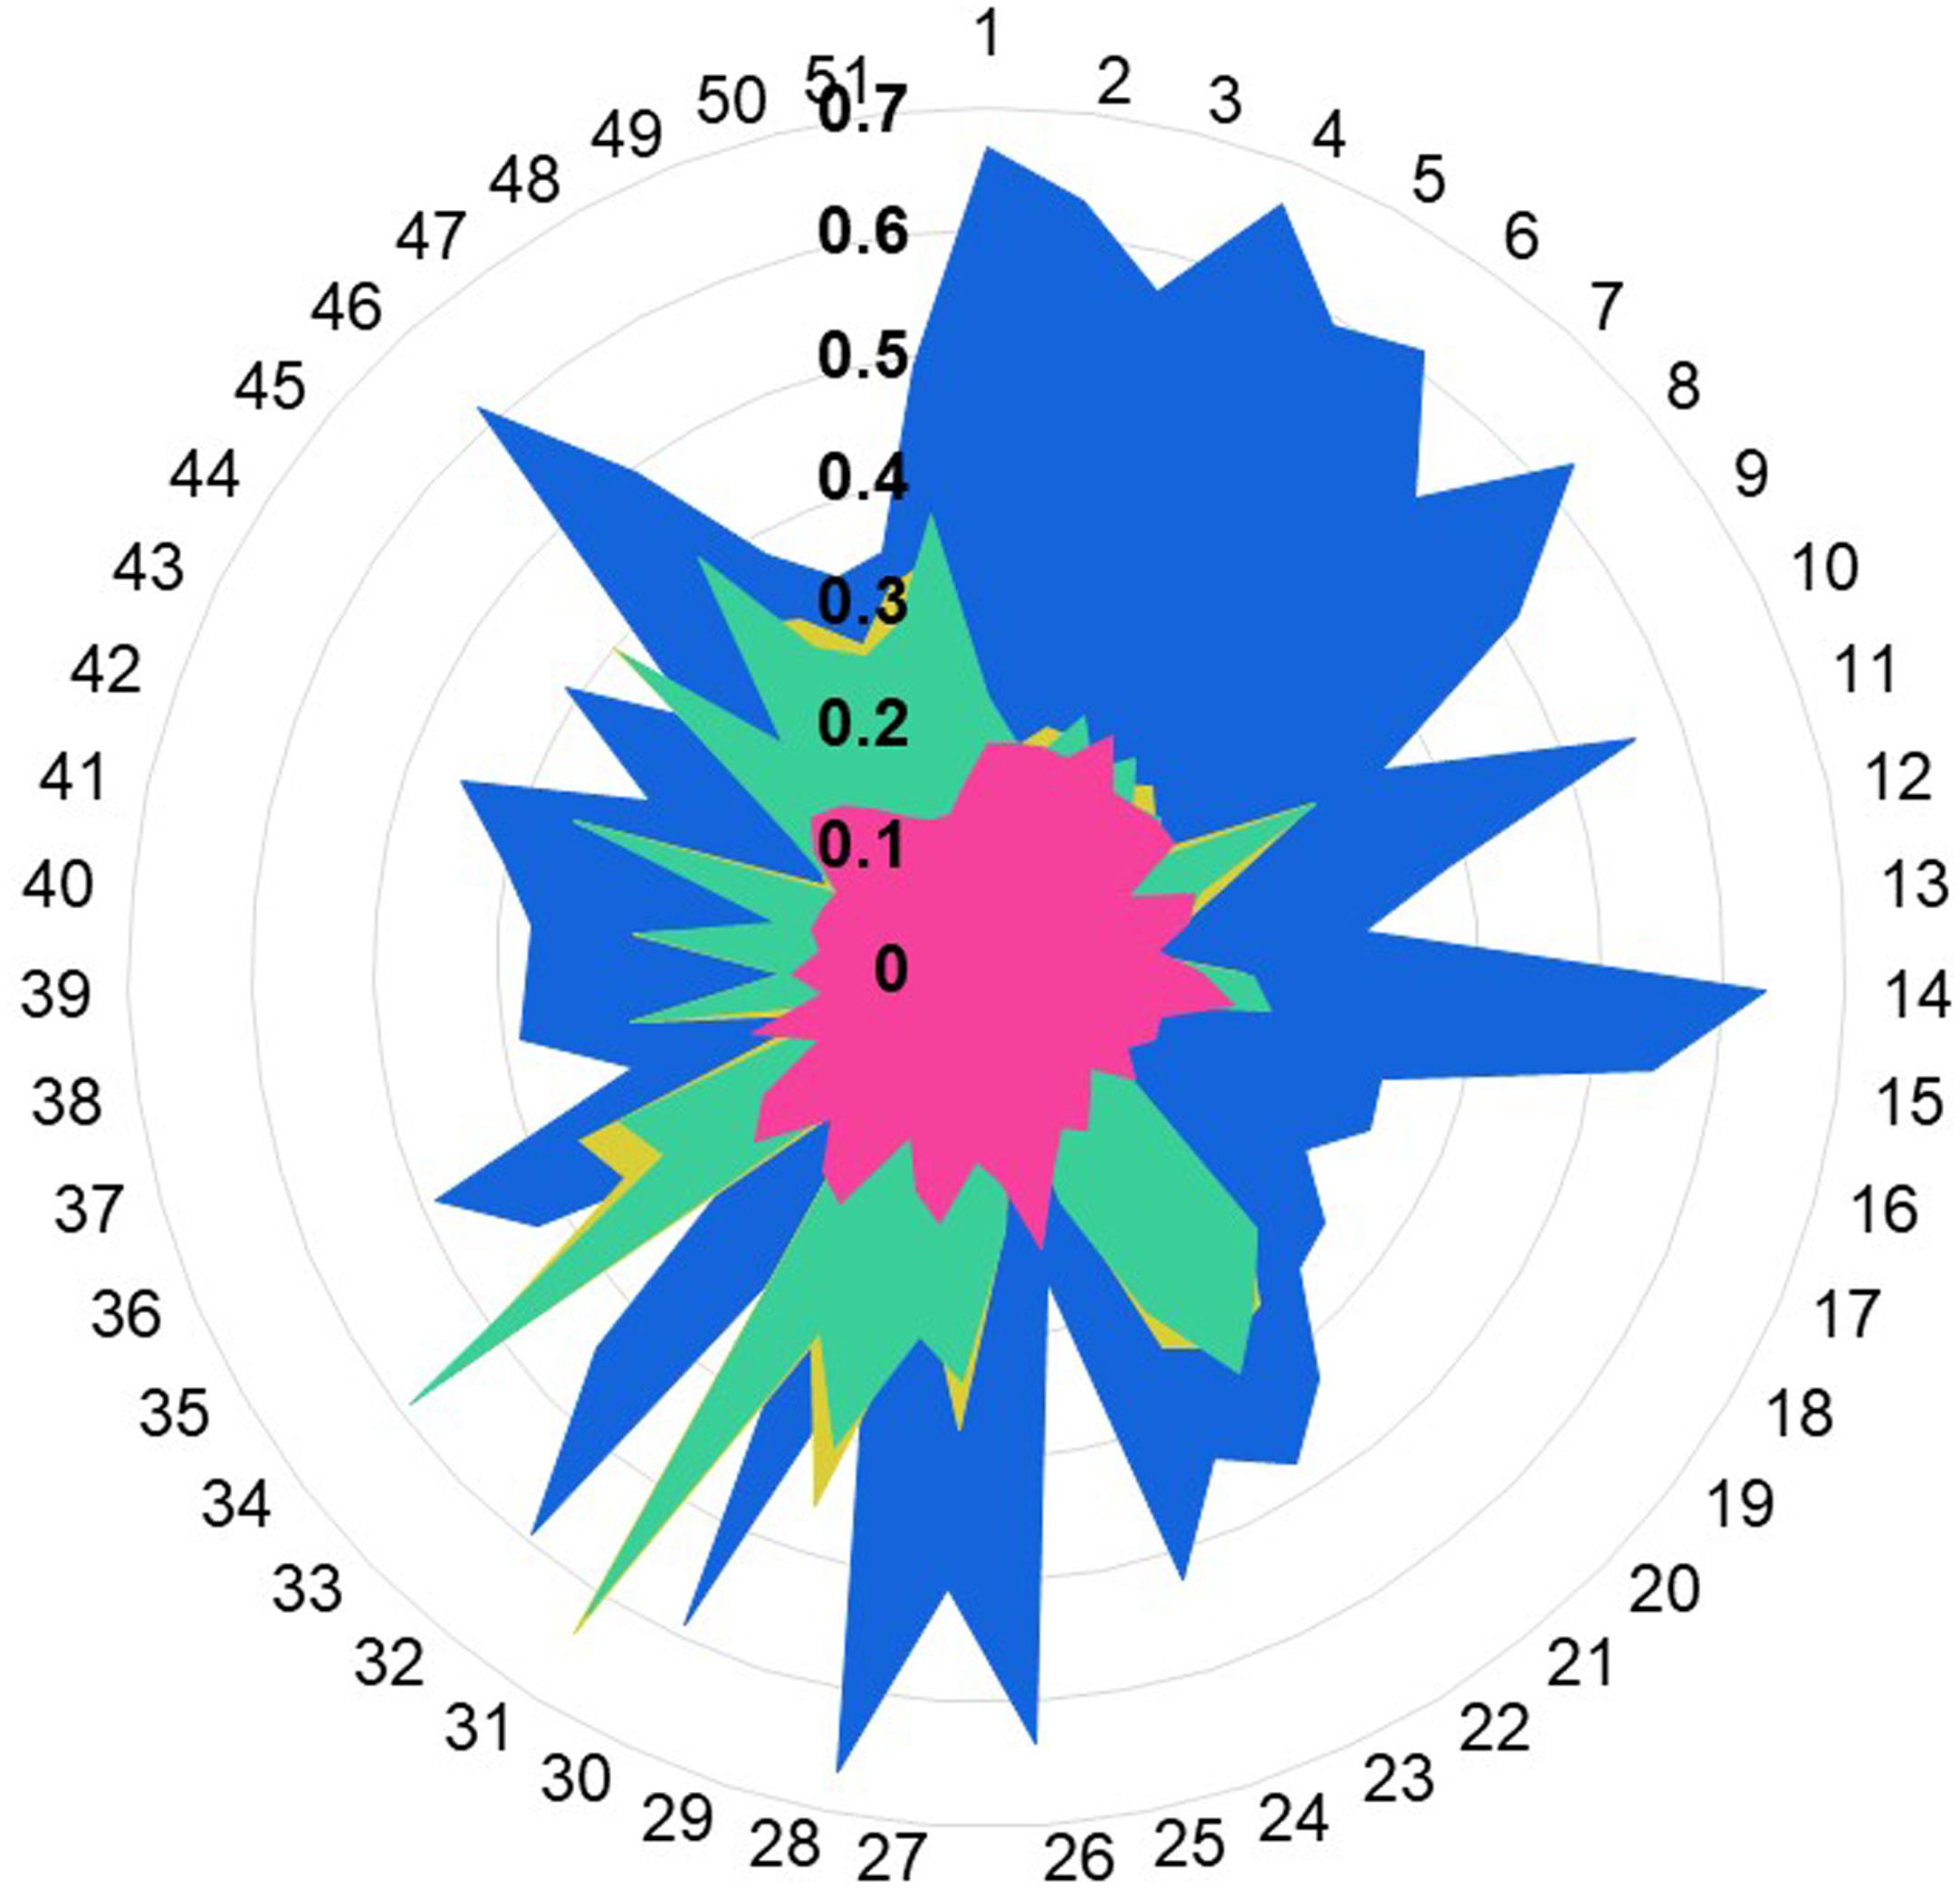
Figure 5. Ligand profile for OR1A1 and selected templates. The similarity of OR1A1 ligands with: retinal (from 1U19) is represented in blue color, netupitant (from 6HLP) is in gold color, ramatroban (from 6IIU) is represented in green color, and ITD (from is represented in pink color). OR1A1 ligands from 1 to 51 are listed in Supplementary Table 4. Tanimoto scores between OR1A1 ligands and the template ligands range from 0.1 to 0.7 (in bold).
The available structure for 6HLP is not complete, also the ligand profile for netupitant does not match with OR1A1 ligands. The 2nd best template 1U19 possesses a complete structure and contain a hydrophobic ligand that matches with OR1A1 ligand profile. It has the same resolution as 6HLP and Sb (8) is also better than that of 6HLP. Therefore, we selected 1U19 as a final template. To validate the Bio-GATS template selection, we built the homology model based on the suggested template (1U19) and performed molecular docking with known OR1A1 ligands having mutagenesis data and inspected whether we are able to recover the mutagenesis residues or not. For comparison, we also built a model with a template showing poor correspondence with OR1A1 in terms of Sh, Sb and ligand profile.
We built models for OR1A1 based on 1U19 and 3ODU (template showing low Srank, and mismatched ligand profile), to differentiate between good and bad templates. We built 50 models using each template. The models with minimum Modeller objective function were selected for mutagenesis data analysis by molecular docking. Currently, OR1A1 has site-directed mutagenesis data for 13 sites for six ligands. Five positions 3.36, 3.37, 3.40, 4.56, and 5.46 are involved in (S)-(-)-citronellol (PubChem ID: 7793) and (S)-(-)-citronellal (PubChem ID: 443157) binding, 11 positions 3.34, 3.36, 3.37, 3.39, 4.53, 4.56, 5.46, 6.47, 6.48, 7.41, and 7.42 are important for (S)-(+)-carvone (PubChem ID: 16724) and (R)-(-)-carvone (PubChem ID: 439570) binding, and positions 6.48 and 6.55 are crucial for musk tibetene (PubChem ID: 67350) and musk xylene (PubChem ID: 62329) binding to OR1A1. Overall, seven positions 3.36, 3.37, 6.48, 6.55, 7.41, and 7.42 are part of the orthosteric binding site of GPCRs.
We downloaded the structures for these six ligands from PubChem and docked them to the predicted binding pocket of OR1A1, selected on available mutagenesis data. After docking (S)-(-)-citronellol and (S)-(-)-citronellal, we recovered 5/5 sites with the 1U19-based OR1A1 model but only 2/5 sites with the 3ODU-based OR1A1 model. Upon docking (S)-(+)-carvone and (R)-(-)-carvone, we were able to recover 6/11 sites with a 1U19-based model but only 3/11 sites with a 3ODU-based model. Docking musk xylene and musk tibetene into the binding pockets of OR1A1 models resulted in the recovery of both sites with a 1U19-based model and just one site using a 3ODU-model. In summary, we were able to recover maximum mutagenesis sites with the 1U19-based OR1A1 model (Supplementary Table 5). Thus, comparing the ligand profile of the target and candidate templates might be a useful measure in validating an appropriate template, in addition to the other measures. Mutagenesis data might also help in refining the predicted binding pocket of the model and has previously been incorporated to improve GPCR homology models in the literature (Ivanov et al., 2009; Perry et al., 2015).
We also used GPCR modeling servers to select the templates for OR1A1 and downloaded the generated alignment. Unfortunately, GOMoDo, and GPCR-ModSim servers did not permit submission of the query sequence therefore, results from these two servers are not included in the current study. GPCR-SSFE did not work for OR1A1 as the sequence did not match with the HMMER2 generated profile. Both GPCRM and GPCR-I-TASSER suggested AA2AR (PDBID: 3EML, resolution: 2.6 Å) as the top template. 3EML has resolution >2.5 Å and is not considered by Bio-GATS, although the high resolution AA2AR template, 5IU4 was identified as the 5th ranking template (in the result summary table, available from Bio-GATS Github page). The alignment generated by the two servers and Bio-GATS are shown in Supplementary Figures 10–12. The TM6 center residues were not aligned within the GPCRM and GPCR-I-TASSER server generated alignments but it was aligned properly by Bio-GATS. The Bio-GATS generated alignment needs manual adjustment within loop regions before proceeding to the model building step (Supplementary Figure 12).
Bio-GATS Features
Bio-GATS is connected to a local data file which contains manually curated 814 GPCR sequences, their TM definitions, PDBIDs of currently available 443 GPCR structures, their conformation, resolution, and query coverage in terms of completeness of the structure. Bio-GATS provides three main features to the users. Firstly, the user can retrieve the top three templates for the queried sequence by clicking on the search button (Figure 6).
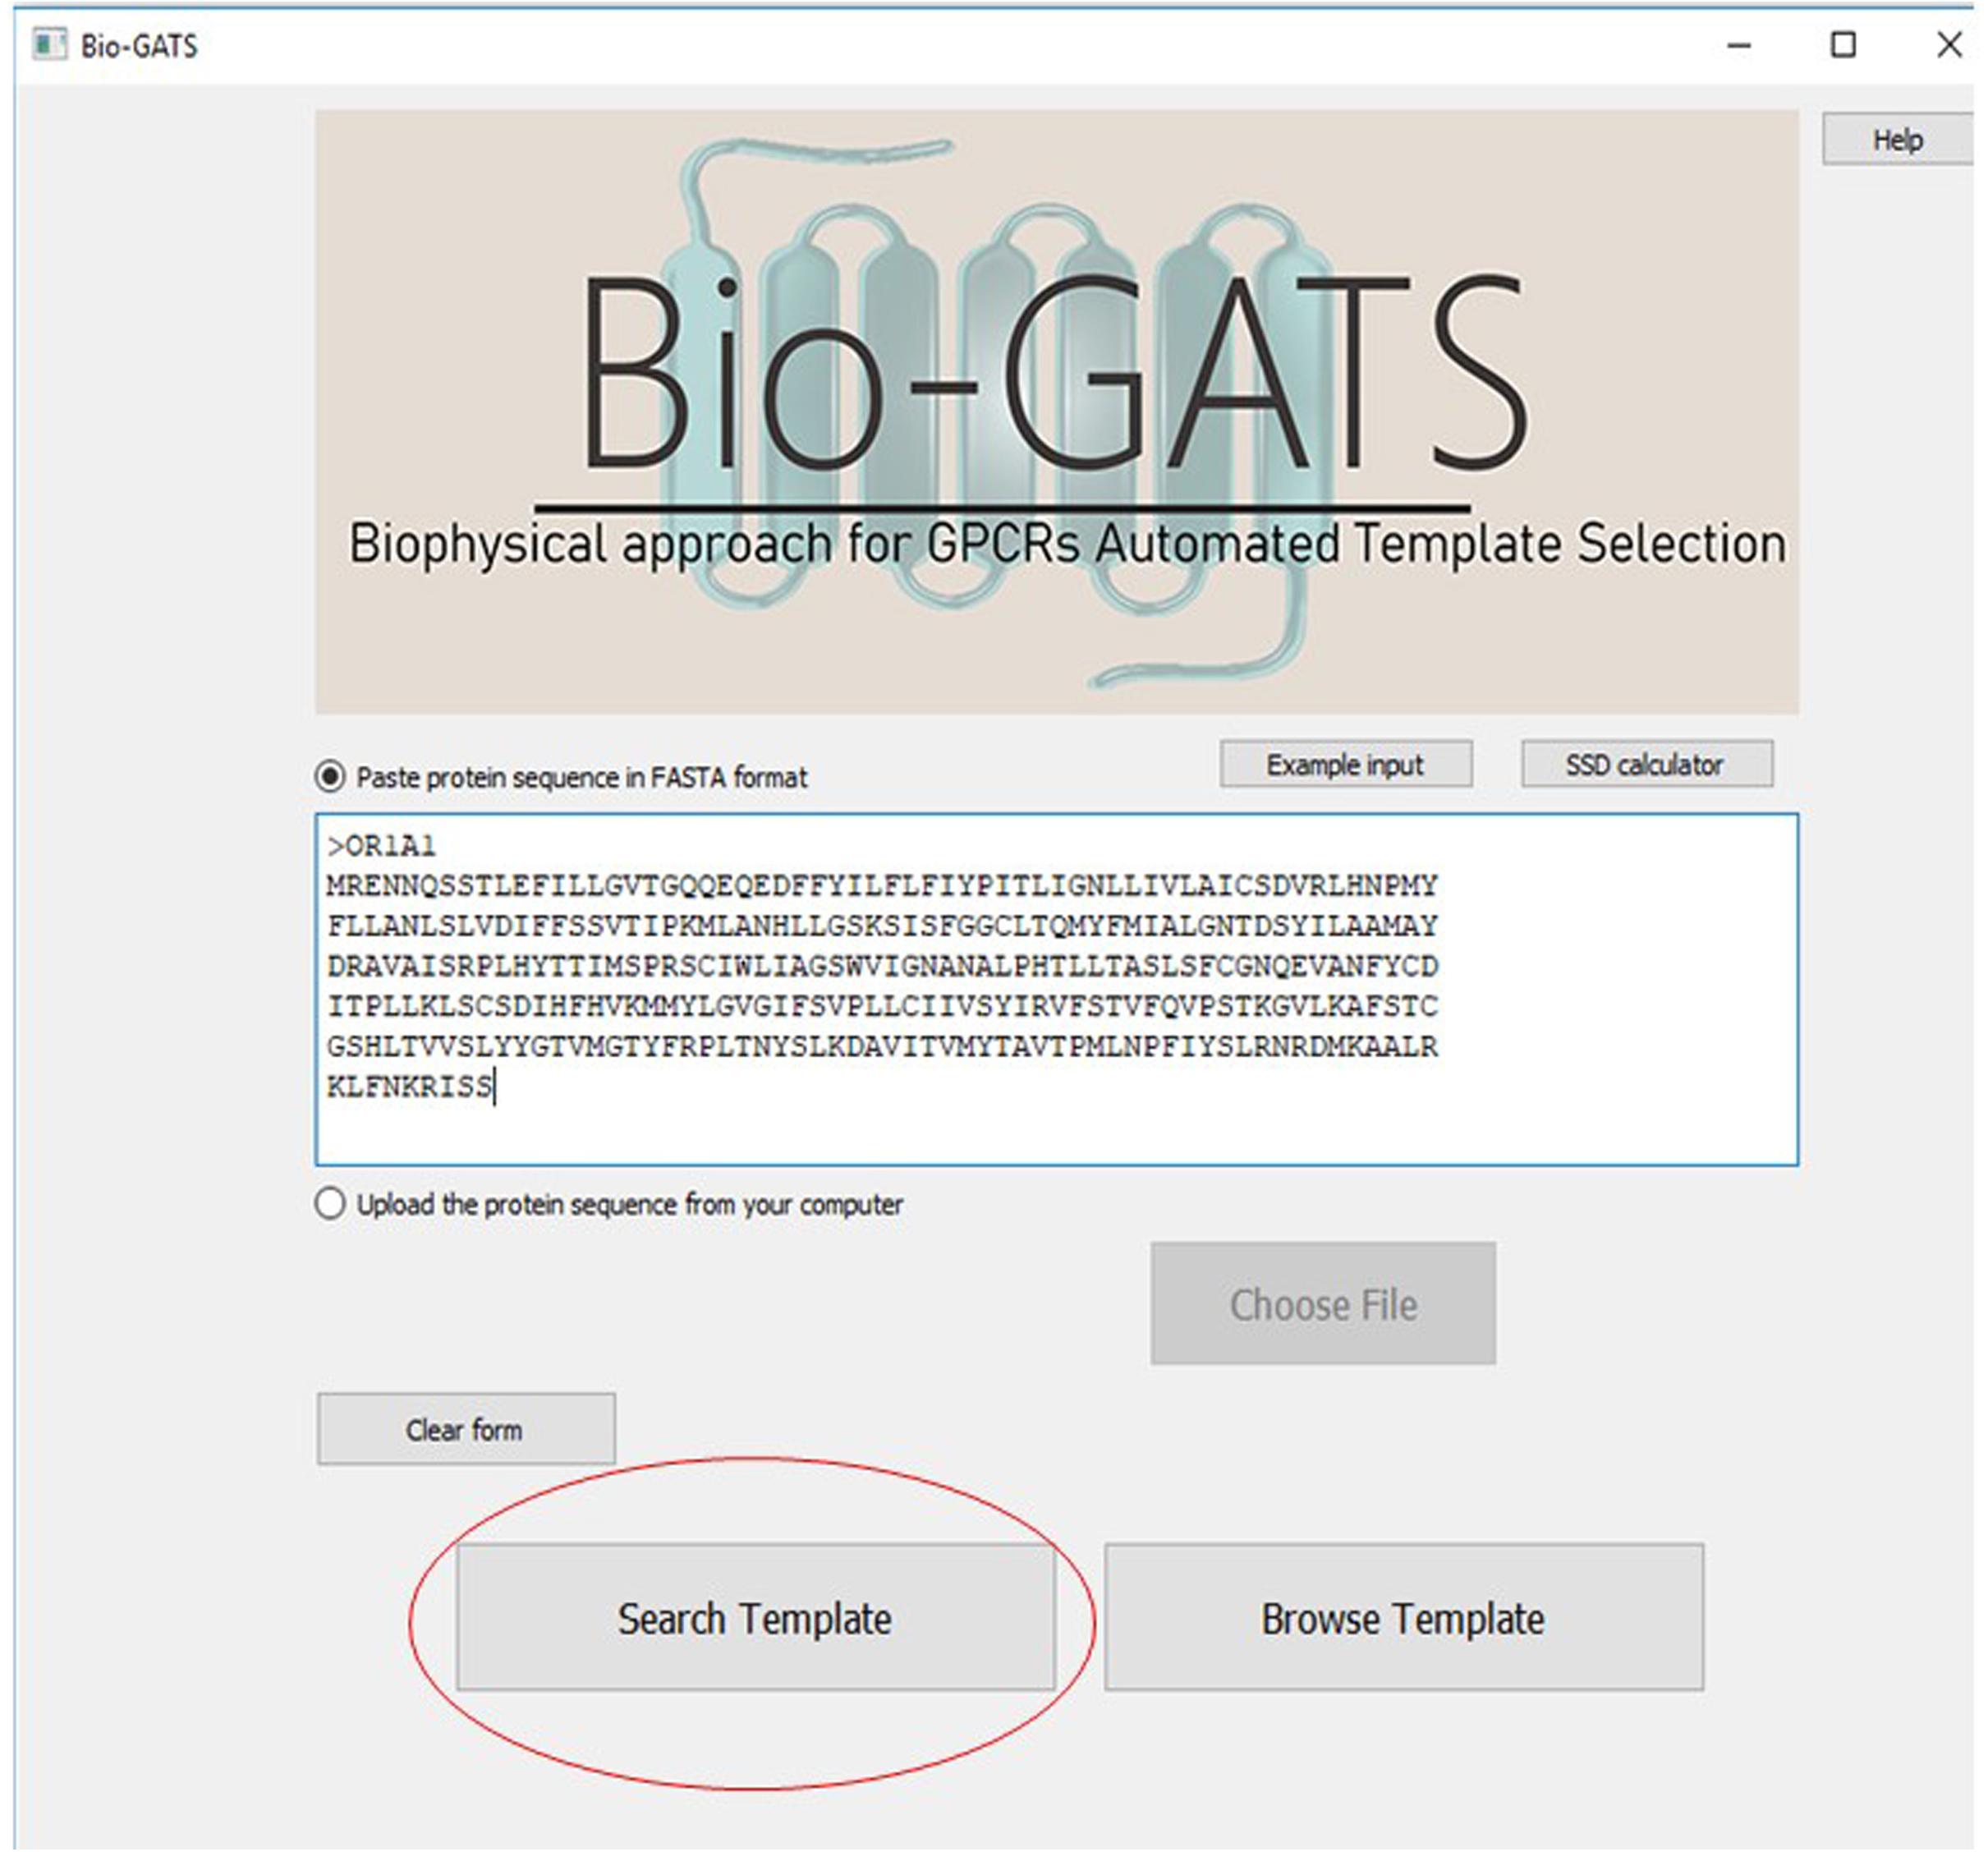
Figure 6. The main interface of Bio-GATS. Automated selection of templates can be done by clicking on the search template button.
The top three templates are retrieved on the basis of three biophysical parameters, namely the resolution, hydrophobicity profile, and BRS score. The user can navigate among inactive, active, and intermediate conformational states as indicated in GPCRdb. The choice for selecting from a list of high resolution (≤ 2.5 Å) structures is also provided (Figure 7). For some receptors, there exist multiple PDBs as in the case of OPSD_BOVIN, with 44 PDBs available. For such a scenario, only high-quality structures were shortlisted. The quality of the structure was determined on the basis of resolution and completeness of the structure (query coverage >75%). Hence, for the search template option, high-quality structures for 54 receptors in inactive, 34 receptors in active, and 19 receptors in intermediate conformations were considered. A detailed report (shown in Supplementary Note 1) with alignments and helix-wise HC and hydrophobicity moment of each target-template pair can be downloaded for comparison and data/figure extraction. A comprehensive data table with all scoring parameters for all templates considered is also available for further analysis (examples available from Bio-GATS Github page).
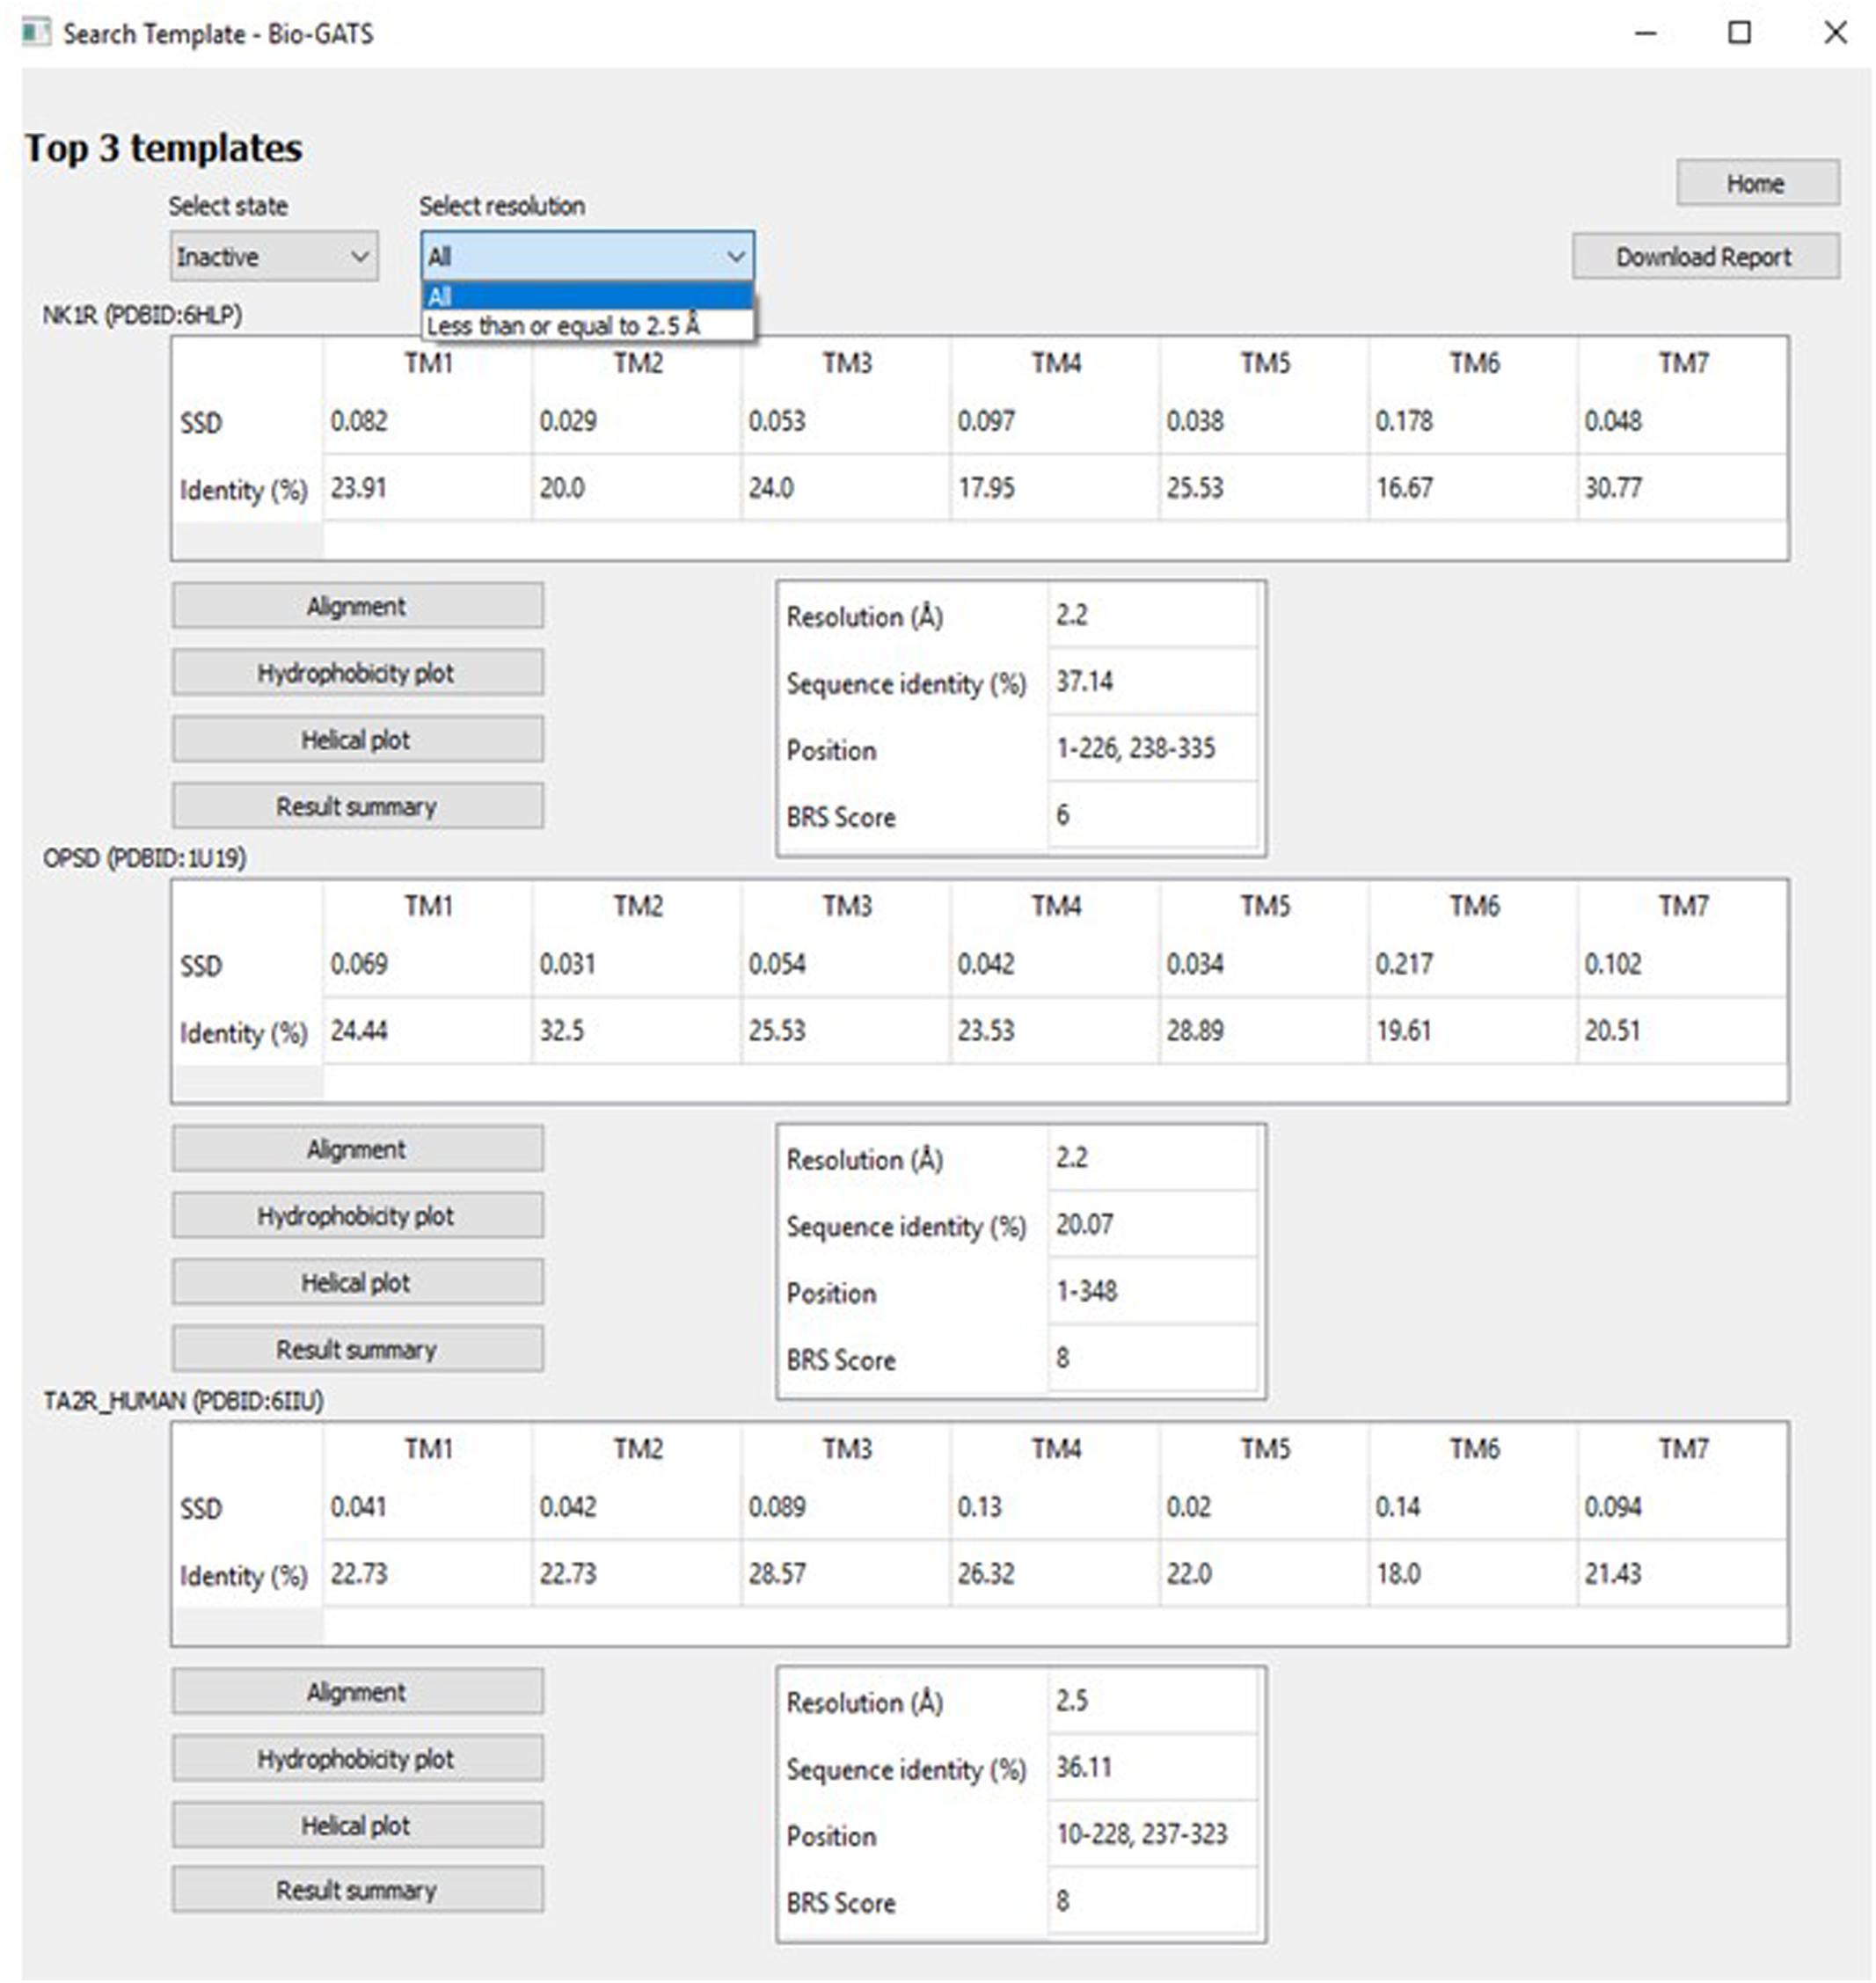
Figure 7. The Search template window with options including GPCR conformation (state) and resolution.
For consideration of options other than resolution, HC, and BRS score for template selection, the browse functionality is available, as an advanced feature in Bio-GATS. Within this feature, the expert user might browse for the best template among the complete list of 76 receptors with 443 available PDBs. In addition to the parameters considered earlier, the browse template page provides sequence identity and TM-wise sequence identity for each template (Supplementary Figure 13). The sequence identity is calculated through a locally installed BLAST alignment. Also, all the available PDB entries, their resolution, and query coverage for each receptor can be displayed for comparison purposes (Supplementary Figure 14). The Browse template feature thus lists comprehensive biophysical parameters comparing the query sequence to all available templates, which might also help the user in selecting multiple templates. HC between the target and the template within the search and browse template features are based on TM definitions derived from the GRoSS alignment (Cvicek et al., 2016). For customized TM definition, a third feature, the SSD calculator, has been added to Bio-GATS, where HC is calculated based on user-defined TM definitions for both the target and the template (Supplementary Figure 15). This feature is also useful for GPCR sequences that are not present within the curated data.
The hydrophobicity plots can be visualized and downloaded for each selected target-template pair (Supplementary Figure 3). The helical wheel plots can also be shown which might help the user in identifying the helical amphiphilicities (Figure 3). Also, the center residue-based TM alignment between the target and the template can be visualized and downloaded (Supplementary Figure 16). The full-length alignment between the target and the selected template can also be downloaded in FASTA format for editing using available programs such as MEGA (Kumar et al., 2016), and AliView (Larsson, 2014), or directly building homology models through online servers such as GOMoDo (Sandal et al., 2013) or locally installed independent programs, for instance, Modeller (Webb and Sali, 2017). All these options are available from the different Bio-GATS windows. Further, a summary report (Supplementary Note 1) with the full-length alignment, TM-wise alignment, HC plots, and helical wheel plots of the target-template pair can be downloaded for detailed analysis and for use in reports and publications.
Conclusion
The existence of low sequence identity among available GPCR structures and sequences particularly OR sequences demands additional parameters for template selection. HC, similarities within the GPCR hotspot residues and matching the target-template ligand profile might serve as additional local parameters for GPCR template selection. Further, the incorporation of mutagenesis data might be helpful in refining GPCR homology models. Bio-GATS provides a convenient and user interactive way of selecting an appropriate template for a target GPCR, based on hydrophobicity profile and hotspot residue similarity while displaying global sequence identity as well as TM sequence identity for more advanced usage. The tool provides a comprehensive biophysical comparison between a target sequence and all the available templates which might assist in selecting more than one templates, commemorating Chothia’s pioneering work in structural bioinformatics.
Data Availability Statement
The datasets presented in this study can be found in online repositories. The names of the repository/repositories and accession number(s) can be found below: https://github.com/amara86/Bio-GATS.
Author Contributions
AJ and SR designed the study and wrote the manuscript. AJ acquired the data. AJ and RV implemented the interface. All authors read and approved the final manuscript.
Funding
This work was partially supported by the award of an Australian Research Council grant (DP180102727) to SR.
Conflict of Interest
The authors declare that the research was conducted in the absence of any commercial or financial relationships that could be construed as a potential conflict of interest.
Acknowledgments
AJ is grateful to Macquarie University for the award of an International Macquarie University Research Excellence Scholarship (iMQRES).
Supplementary Material
The Supplementary Material for this article can be found online at: https://www.frontiersin.org/articles/10.3389/fmolb.2021.617176/full#supplementary-material
References
Abaffy, T., Bain, J. R., Muehlbauer, M. J., Spasojevic, I., Lodha, S., and Bruguera, E. (2018). A testosterone metabolite 19-hydroxyandrostenedione induces neuroendocrine trans-differentiation of prostate cancer cells via an ectopic olfactory receptor. Front. Oncol. 8:162.
Abagyan, R., Totrov, M., and Kuznetsov, D. (1994). ICM—a new method for protein modeling and design: applications to docking and structure prediction from the distorted native conformation. J. Comput. Chem. 15, 488–506. doi: 10.1002/jcc.540150503
Alfonso-Prieto, M., Navarini, L., and Carloni, P. (2019). Understanding ligand binding to G-protein coupled receptors using multiscale simulations. Front. Mol. Biosci. 6:29.
Altschul, S. F., Gish, W., Miller, W., Myers, E. W., and Lipman, D. J. (1990). Basic local alignment search tool. J. Mol. Biol. 215, 403–410.
An, J., Totrov, M., and Abagyan, R. (2005). Pocketome via comprehensive identification and classification of ligand binding envelopes. Mol. Cell Proteom. 4, 752–761. doi: 10.1074/mcp.m400159-mcp200
Baker, M. S., Ahn, S. B., Mohamedali, A., Islam, M. T., Cantor, D., et al. (2017). Accelerating the search for the missing proteins in the human proteome. Nat. Commun. 8:14271.
Ballesteros, J. A., and Weinstein, H. (1995). [19] Integrated methods for the construction of three-dimensional models and computational probing of structure-function relations in G protein-coupled receptors. Methods Neurosci. 25, 366–428. doi: 10.1016/s1043-9471(05)80049-7
Basith, S., Cui, M., Macalino, S. J. Y., Park, J., Clavio, N. A. B., Kang, S., et al. (2018). Exploring G protein-coupled receptors (GPCRs) ligand space via cheminformatics approaches: impact on rational drug design. Front. Pharmacol. 9:128.
Berman, H. M., Westbrook, J., Feng, Z., Gilliland, G., Bhat, T. N., Weissig, H., et al. (2000). The protein data bank. Nucleic Acids Res. 28, 235–242.
Berthold, M. R., Cebron, N., Dill, F., Gabriel, T. R., Kötter, T., Meinl, T., et al. (2009). KNIME-the Konstanz information miner: version 2.0 and beyond. AcM SIGKDD Explor. Newslet. 11, 26–31. doi: 10.1145/1656274.1656280
Braun, T., Voland, P., Kunz, L., Prinz, C., and Gratzl, M. (2007). Enterochromaffin cells of the human gut: sensors for spices and odorants. Gastroenterology 132, 1890–1901. doi: 10.1053/j.gastro.2007.02.036
Butkiewicz, M., Rodriguez, A. L., Rainey, S. E., Joshua, W., Luscombe, V. B., Stauffer, S. R., et al. (2019). Identification of novel allosteric modulators of metabotropic glutamate receptor subtype 5 Acting at site distinct from 2-Methyl-6-(phenylethynyl)-pyridine Binding. ACS Chem. Neurosci. 10, 3427–3436. doi: 10.1021/acschemneuro.8b00227
Carlsson, J., Coleman, R. G., Setola, V., Irwin, J. J., Fan, H., Schlessinger, A., et al. (2011). Ligand discovery from a dopamine D3 receptor homology model and crystal structure. Nat. Chem. Biol. 7, 769–778. doi: 10.1038/nchembio.662
Castleman, P. N., Sears, C. K., Cole, J. A., Baker, D. L., and Parrill, A. L. (2019). GPCR homology model template selection benchmarking: global versus local similarity measures. J. Mol. Graph. Model 86, 235–246. doi: 10.1016/j.jmgm.2018.10.016
Chan, H. C. S., Li, Y., Dahoun, T., Vogel, H., and Yuan, S. (2019). New Binding sites, new opportunities for GPCR drug discovery. Trends Biochem. Sci. 44, 312–330. doi: 10.1016/j.tibs.2018.11.011
Chothia, C. (1976). The nature of the accessible and buried surfaces in proteins. J. Mol. Biol. 105, 1–12. doi: 10.1016/0022-2836(76)90191-1
Cock, P. J., Antao, T., Chang, J. T., Chapman, B. A., Cox, C. J., Cox, C. J., et al. (2009). Biopython: freely available Python tools for computational molecular biology and bioinformatics. Bioinformatics 25, 1422–1423. doi: 10.1093/bioinformatics/btp163
Congreve, M., de Graaf, C., Swain, N. A., and Tate, C. G. (2020). Impact of GPCR structures on drug discovery. Cell 181, 81–91. doi: 10.1016/j.cell.2020.03.003
Crasto, C. J. (2010). Hydrophobicity profiles in G protein-coupled receptor transmembrane helical domains. J. Receptor. Ligand. Channel Res. 2010, 123–133. doi: 10.2147/jrlcr.s14437
Cvicek, V., Goddard, W. A. III, and Abrol, R. (2016). Structure-based sequence alignment of the transmembrane domains of all human GPCRs: phylogenetic, structural and functional implications. PLoS Comput. Biol. 12:e1004805. doi: 10.1371/journal.pcbi.1004805
Eisenberg, D., Schwarz, E., Komaromy, M., and Wall, R. (1984). Analysis of membrane and surface protein sequences with the hydrophobic moment plot. J. Mol. Biol. 179, 125–142. doi: 10.1016/0022-2836(84)90309-7
Eisenberg, D., Weiss, R. M., and Terwilliger, T. C. (1982). The helical hydrophobic moment: a measure of the amphiphilicity of a helix. Nature 299, 371–374. doi: 10.1038/299371a0
Esguerra, M., Siretskiy, A., Bello, X., Sallander, J., and Gutiérrez-de-Terán, H. (2016). GPCR-ModSim: A comprehensive web based solution for modeling G-protein coupled receptors. Nucleic Acids Res. 44, W455–W462.
Haddad, Y., Adam, V., and Heger, Z. (2020). Ten quick tips for homology modeling of high-resolution protein 3D structures. PLoS Comput. Biol. 16:e1007449. doi: 10.1371/journal.pcbi.1007449
Hu, G. M., Mai, T. L., and Chen, C. M. (2017). Visualizing the GPCR network: classification and evolution. Sci. Rep. 7:15495.
Insel, P. A., Sriram, K., Gorr, M. W., Wiley, S. Z., Michkov, A., Salmerón, C., et al. (2019). GPCRomics: An approach to discover GPCR drug targets. Trends Pharmacol. Sci. 40, 378–387. doi: 10.1016/j.tips.2019.04.001
Ivanov, A. A., Barak, D., and Jacobson, K. A. (2009). Evaluation of homology modeling of G-protein-coupled receptors in light of the A(2A) adenosine receptor crystallographic structure. J. Med. Chem. 52, 3284–3292. doi: 10.1021/jm801533x
Jabeen, A. V., and Ranganathan, S. (2020). A two-stage computational approach to predict ligands for a chemosensory receptor. Curr. Res. Struct. Biol. 2, 213–221. doi: 10.1016/j.crstbi.2020.10.001
Jabeen, A., and Ranganathan, S. (2019). Applications of machine learning in GPCR bioactive ligand discovery. Curr. Opin. Struct. Biol. 55, 66–76. doi: 10.1016/j.sbi.2019.03.022
Jabeen, A., Mohamedali, A., and Ranganathan, S. (2019a). Looking for Missing Proteins, Reference Module in Life Sciences. Amsterdam: Elsevier.
Jabeen, A., Mohamedali, A., and Ranganathan, S. (2019b). “Protocol for protein structure modelling,” in Encyclopedia of Bioinformatics and Computational Biology, ed. S. Ranganathan et al. (Oxford: Academic Press), 252–272. doi: 10.1016/b978-0-12-809633-8.20477-9
Jaiteh, M., Rodríguez-Espigares, I., Selent, J., and Carlsson, J. (2020). Performance of virtual screening against GPCR homology models: Impact of template selection and treatment of binding site plasticity. PLoS Comput. Biol. 16:e1007680. doi: 10.1371/journal.pcbi.1007680
Kosinski, J., Barbato, A., and Tramontano, A. (2013). MODexplorer: an integrated tool for exploring protein sequence, structure and function relationships. Bioinformatics 29, 953–954. doi: 10.1093/bioinformatics/btt062
Kufareva, I., Katritch, V., Participants of Gpcr Dock 2013, Stevens, R. C., and Abagyan, R. (2014). Advances in GPCR modeling evaluated by the GPCR Dock 2013 assessment: meeting new challenges. Structure 22, 1120–1139. doi: 10.1016/j.str.2014.06.012
Kumar, S., Stecher, G., and Tamura, K. (2016). MEGA7: Molecular evolutionary genetics analysis version 7.0 for bigger datasets. Mol. Biol. Evol. 33, 1870–1874. doi: 10.1093/molbev/msw054
Larsson, A. (2014). AliView: a fast and lightweight alignment viewer and editor for large datasets. Bioinformatics 30, 3276–3278. doi: 10.1093/bioinformatics/btu531
Liu, W., Eilers, M., Patel, A. B., and Smith, S. O. (2004). Helix packing moments reveal diversity and conservation in membrane protein structure. J. Mol. Biol. 337, 713–729. doi: 10.1016/j.jmb.2004.02.001
Lo Conte, L., Bart, A., Hubbard, T. J. P., Brenner, S. E., Murzin, A. G., Chothia, C., et al. (2000). SCOP: a structural classification of proteins database. Nucleic Acids Res. 28, 257–259. doi: 10.1093/nar/28.1.257
Lolkema, J. S., and Slotboom, D. J. (1998). Hydropathy profile alignment: a tool to search for structural homologues of membrane proteins. FEMS Microbiol. Rev. 22, 305–322. doi: 10.1111/j.1574-6976.1998.tb00372.x
Loo, J. S., Emtage, A. L., Ng, K. W., Yong, A. S. J., and Doughty, S. W. (2018). Assessing GPCR homology models constructed from templates of various transmembrane sequence identities: Binding mode prediction and docking enrichment. J. Mol. Graph. Model. 80, 38–47. doi: 10.1016/j.jmgm.2017.12.017
Miszta, P., Pasznik, P., Jakowiecki, J., Sztyler, A., Latek, D., and Filipek, S. (2018). GPCRM: a homology modeling web service with triple membrane-fitted quality assessment of GPCR models. Nucleic Acids Res. 46, W387–W395.
Miyagi, H., Asada, H., Suzuki, M., Takahashi, Y., Yasunaga, M., Suno, C., et al. (2020). The discovery of a new antibody for BRIL-fused GPCR structure determination. Sci. Rep. 10:11669.
Müller, A. T., Gabernet, G., Hiss, J. A., and Schneider, G. (2017). modlAMP: python for antimicrobial peptides. Bioinformatics 33, 2753–2755. doi: 10.1093/bioinformatics/btx285
Munk, C., Mutt, E., Isberg, V., Nikolajsen, L. F., Bibbe, J. M., Flock, T., et al. (2019). An online resource for GPCR structure determination and analysis. Nat. Methods 16, 151–162. doi: 10.1038/s41592-018-0302-x
Nikolaev, D. M., Shtyrov, A. A., Panov, M. S., Jamal, A., Chakchir, O. B., Kochemirovsky, V. A., et al. (2018). A comparative Study of modern homology modeling algorithms for rhodopsin structure prediction. ACS Omega 3, 7555–7566. doi: 10.1021/acsomega.8b00721
Palczewski, K., Kumasaka, T., Hori, T., Behnke, C. A., Motoshima, H., Fox, B. A., et al. (2000). Crystal structure of rhodopsin: a G protein-coupled receptor. Science 289, 739–745. doi: 10.1126/science.289.5480.739
Perry, S. R., Xu, W., Wirija, A., Lim, J., Yau, M-K., Stoermer, M. J., et al. (2015). Three homology models of PAR2 derived from different templates: application to antagonist discovery. J. Chem. Inf. Model 55, 1181–1191. doi: 10.1021/acs.jcim.5b00087
Rataj, K., Witek, J., Mordalski, S., Kosciolek, T., and Bojarski, A. J. (2014). Impact of template choice on homology model efficiency in virtual screening. J. Chem. Inf. Model 54, 1661–1668. doi: 10.1021/ci500001f
Redfern, O. C., Dessailly, B., and Orengo, C. A. (2008). Exploring the structure and function paradigm. Curr. Opin. Struct. Biol. 18, 394–402. doi: 10.1016/j.sbi.2008.05.007
Rios, S., Fernandez, M. F., Caltabiano, G., Campillo, M., Pardo, L., and Gonzalez, A. (2015). GPCRtm: an amino acid substitution matrix for the transmembrane region of class A G protein-coupled receptors. BMC Bioinformatics 16:206.
Saikia, S., Bordoloi, M., and Sarmah, R. (2019). Established and In-trial GPCR Families in clinical trials: a review for target selection. Curr. Drug Targets 20, 522–539. doi: 10.2174/1389450120666181105152439
Sandal, M., Tran, P. D., Cona, M., Zung, H., Carloni, P., Musiani, F., et al. (2013). GOMoDo: A GPCRs online modeling and docking webserver. PLoS One 8:e74092. doi: 10.1371/journal.pone.0074092
Shahaf, N., Pappalardo, M., Basile, L., Guccione, S., and Rayan, A. (2016). How to choose the suitable template for homology modelling of GPCRs: 5-HT7 receptor as a test case. Mol. Inform. 35, 414–423. doi: 10.1002/minf.201501029
Silva, P. J. (2008). Assessing the reliability of sequence similarities detected through hydrophobic cluster analysis. Proteins 70, 1588–1594. doi: 10.1002/prot.21803
Szwabowski, G. L., Castleman, P. N., Sears, C. K., Wink, L. H., Cole, J. A., and Baker, D. L. (2020). Benchmarking GPCR homology model template selection in combination with de novo loop generation. J. Comput. Aided Mol. Des. 34, 1027–1044. doi: 10.1007/s10822-020-00325-x
Van Rossum, G., and Drake, F. L. (2011). The Python Language Reference Manual. Surrey, UK: Network Theory Ltd.
Wacker, D., Stevens, R. C., and Roth, B. L. (2017). How ligands illuminate GPCR molecular pharmacology. Cell 170, 414–427. doi: 10.1016/j.cell.2017.07.009
Wallace, J., Onkabetse, A. D., Harris, F., and Phoenix, D. A. (2004). Investigation of hydrophobic moment and hydrophobicity properties for transmembrane alpha-helices. Theor. Biol. Med. Model 1:5.
Wallner, B., and Elofsson, A. (2005). All are not equal: a benchmark of different homology modeling programs. Protein Sci. 14, 1315–1327. doi: 10.1110/ps.041253405
Webb, B., and Sali, A. (2017). Protein Structure Modeling with MODELLER. Methods Mol. Biol. 1654, 39–54. doi: 10.1007/978-1-4939-7231-9_4
Wolf, S., Nikolina, J., Gelis, L., Pietsch, S., Hatt, H., and Gerwert, K. (2017). Dynamical binding modes determine agonistic and antagonistic ligand effects in the prostate-specific G-protein coupled receptor (PSGR). Sci. Rep. 7:16007.
Worth, C. L., Kreuchwig, F., Tiemann, J. K. S., Kreuchwig, A., Ritschel, M., Kleinau, G., et al. (2017). GPCR-SSFE 2.0-a fragment-based molecular modeling web tool for Class A G-protein coupled receptors. Nucleic Acids Res. 45, W408–W415.
Wu, C., Jia, Y., Lee, J. H., Kim, Y., Sekharan, S., Batista, V. S., et al. (2015). Activation of OR1A1 suppresses PPAR-γ expression by inducing HES-1 in cultured hepatocytes. Int. J. Biochem. Cell Biol. 64, 75–80. doi: 10.1016/j.biocel.2015.03.008
Keywords: biophysical approach, hydrophobicity correspondence, template selection, homology modeling, GPCR, olfactory receptor, automated tool
Citation: Jabeen A, Vijayram R and Ranganathan S (2021) BIO-GATS: A Tool for Automated GPCR Template Selection Through a Biophysical Approach for Homology Modeling. Front. Mol. Biosci. 8:617176. doi: 10.3389/fmolb.2021.617176
Received: 14 October 2020; Accepted: 24 February 2021;
Published: 07 April 2021.
Edited by:
Alfredo Iacoangeli, King’s College London, United KingdomReviewed by:
Tomasz Stepniewski, Institute of Metallurgy and Materials Science (PAN), PolandTommaso Biagini, Casa Sollievo della Sofferenza (IRCCS), Italy
Copyright © 2021 Jabeen, Vijayram and Ranganathan. This is an open-access article distributed under the terms of the Creative Commons Attribution License (CC BY). The use, distribution or reproduction in other forums is permitted, provided the original author(s) and the copyright owner(s) are credited and that the original publication in this journal is cited, in accordance with accepted academic practice. No use, distribution or reproduction is permitted which does not comply with these terms.
*Correspondence: Shoba Ranganathan, c2hvYmEucmFuZ2FuYXRoYW5AbXEuZWR1LmF1; c2hvYmEucmFuZ2FuYXRoYW4xQGdtYWlsLmNvbQ==