
95% of researchers rate our articles as excellent or good
Learn more about the work of our research integrity team to safeguard the quality of each article we publish.
Find out more
ORIGINAL RESEARCH article
Front. Mol. Biosci. , 10 December 2020
Sec. Biological Modeling and Simulation
Volume 7 - 2020 | https://doi.org/10.3389/fmolb.2020.562416
This article is part of the Research Topic Computational Approaches to Study the Impact of Mutations on Disease and Drug Resistance View all 13 articles
The mutation of phosphatase and tensin homolog (PTEN) genes frequently occur in low-grade gliomas (LGGs) and are deeply associated with a poor prognosis and survival rate. In order to identify the crucial signaling pathways and genes associated with the PTEN mutation, we performed bioinformatics analysis on the RNA sequencing results, which were obtained from The Cancer Genome Atlas database. A total of 352 genes were identified as differentially expressed genes (DEGs). The gene ontology (GO) and Kyoto Encyclopedia of Genes and Genomes (KEGG) analysis suggested that the DEGs were significantly enriched in categories associated with cell division and multiple metabolic progressions. The histological stage was significantly associated with PTEN expression levels. In addition, the PTEN mutation was associated with an abundance of B cells, neutrophils, macrophages, dendritic cells, and CD8+ T cells during tumor infiltration. The results showed that patients with LGGs harboring the PTEN mutation had a poor prognosis and more serious immune cell infiltration occurred depending on the mRNA expression level. These results demonstrated that multiple genes and signaling pathways play a key role in LGG from low grade to high grade, and are associated with PTEN mutations. In this study, we outlined an approach to assess the influence of PTEN mutations on prognosis, overall survival, and messenger RNA (mRNA) expression. Our results provided alternative strategies for the personalized treatment of patients with LGGs harboring the PTEN mutation.
Gliomas, as a kind of common craniocerebral tumor, can be divided into four grades based on the 2007 World Health Organization classification of tumors. Grade I and II are low-grade gliomas (LGGs), while Grade III and IV are high-grade gliomas (Louis et al., 2007). A clinical investigation into malignant LGGs found that the overall survival of LGGs is significantly higher (2–4 years) than high-grade gliomas (∼15 months), which are highly aggressive tumors and exhibit significant aggression (Buckner et al., 2016). Reported by a variety of literature, too many genes anticipate the signal pathway of a drug resistance response (Andersson et al., 2004; Calatozzolo et al., 2012). To precisely treat LGGs patients, it is of importance to provide personalized genetic information and expression correlations, because personnel treatments can provide precise therapeutic strategies based on specific genetic conditions. Consequently, the identification of the underlying biomarkers of disease progression and the underlying target gene are the prerequisite for personalized treatments.
The phosphatase and tensin homolog (PTEN) gene is a multifunctional tumor suppressor, which contains a catalytic domain and a tensin-like domain (Li et al., 1997; Helseth et al., 2010). Owing to the tumor suppressing functions of the PTEN gene, it has been found to mutate with high frequency in several types of carcinomas, including LGGs (Helseth et al., 2010; Johnson and O’Neill, 2012). To promote the cell proliferation of cancer, the key node target is Akt, in which the PTEN protein inhibits PI3K/Akt signaling and then activates the P21 protein (Mu et al., 2020). Although the variation in PTEN expression levels may correlate with the LGG tumorigenesis (Wiencke et al., 2007), these expression levels have clinical significance and can be used as prognostic biomarkers. Some studies have reported that PTEN is activated through AKT-independent (protein kinase B) mechanisms (McGirt et al., 2005). Patients harboring the PTEN mutation exhibit increasing alterations of multiple signaling pathways and cellular metabolism compared with those harboring the wild-type PTEN gene (Steck et al., 1997). Thus, a variation in the PTEN status may affect the tumor progression by regulating the immune microenvironment (Best et al., 2018; Wu et al., 2018). And, the disease prognosis and immune cell infiltration are highly associated with the immune microenvironment (Ino et al., 2013), as well as resistance or sensitivity to treatment measures (Norton et al., 2019). However, the importance of PTEN status in LGG progression and the molecular mechanism is still unclear.
In this study, we analyzed the RNA sequencing data of LGG patients, obtained from The Cancer Genome Atlas (TCGA) database. By performing the identification of differentially expressed genes, the molecular functions and correlation with LGG progression were analyzed using GSEA analysis. After the enrichment of differentially expressed genes, the association between differentially expressed genes and immune cell infiltration was further analyzed using the TIMER database, which elucidated the effect of the PTEN mutation on the tumor-related genes and signaling pathways.
The RNA-seq database of LGG patients was obtained from The Cancer Genome Atlas (TCGA) database1, which included 516 cases. After the classification of differentially expressed genes, gene set enrichment analysis (GSEA) was used to identify the biological functions of the differentially expressed genes (DEGs) based on their biological status. Furthermore, the enriched signal pathways of LGG patients with or without the PTEN mutation were obtained. Enrichment results with a cut-off value of false discovery rate (FDR) < 0.25 and a p-value < 0.05 were identified to be as significant. The hazard ratio of LGG patients, including age, gender, PTEN status, and grade, were performed using the Cox proportional-hazards model of the R software.
In this study, the R software (version 3.5.2) containing the bioconductor software package (EdgeR) was used to identify the differential gene expression in LGG patients harboring various PTEN mutations compared with wild-type patients (Robinson et al., 2010; McCarthy et al., 2012). The identification criteria for the DEGs were as follows: P-value and FDR < 0.05; |log2FoldChange| ≥ 1.0.
GSEA analysis was performed to ascertain the effect of differentially expressed genes on signaling utilizing the Hallmark gene sets2. Gene oncology (GO) annotations are the collaborative effort of developing and using ontologies to support biologically meaningful annotations of genes and their products, which include the biological process (BP), cellular component (CC), and molecular function (MF). Commonly, GO can be used to describe the annotation of the enriched genes in related signaling pathways and confirm the biological characteristics at the transcriptomic level. DEGs were classified using the clusterProfiler package. GO and KEGG were enriched based on the hypergeometric distribution of the GO concepts and KEGG pathways. To avoid high FDRs in multiple tests, the q-values of FDR control were also calculated.
The Search Tool for the Retrieval of Interacting Genes (STRING)3 (Bader and Hogue, 2003) was used for creating the protein-protein interaction (PPI) network of the DEGs and further attribute these genes to their specific biological functions, e.g., cellular component, biological process, and molecular function annotations (Dennis et al., 2003; Szklarczyk et al., 2015). Then the Cytoscape software (v3.0)4 was used to visualize the PPI network and identify the core DEGs in the biological regulating process. Then the KEGG pathway was analyzed for the enrichment of DEGs in the top-ranked three modules.
Immune cell infiltration analysis was performed using TIMER 2.05 (Li et al., 2020). The association between the PTEN status of different cancers and the abundance of immune cell infiltrations were analyzed using the TIMER database to conclude the abundance of tumor-infiltrating immune cells, including B cells, CD8+ T cells, macrophages, dendritic cells, CD4+ T cells, and neutrophils.
All statistical analyses were conducted using Graphpad and R 3.3.0. Student’s t-test was used to analyze PTEN mRNA expression levels in cancer tissues with different PTEN statuses. The Benjamini-Hochberg procedure was used to adjust FDR in limma and GSEA (Mootha et al., 2003; Subramanian et al., 2005). A p-value < 0.05 was considered as significant. The survival curve was obtained using the cBioPortal website6.
Clinical patient information of LGGs, including the cancer tissue RNA-seq database and complete follow-up profiles, were obtained from the TCGA database. The LGG cases were divided into two groups, LGG with PTEN mutation (18 patients) and LGG without PTEN mutation (as shown in Figure 1A). Among these patients, 6% of LGG patients had mutated genes, which included missense mutations, nonsense mutations, amplifications, and deep deletions. For the PTEN mutation (Figure 1B), there were 13 amino acid sites of the PTEN protein that were identified as the commonly mutated sites, located at the DSPc and PTEN_C2 domains.
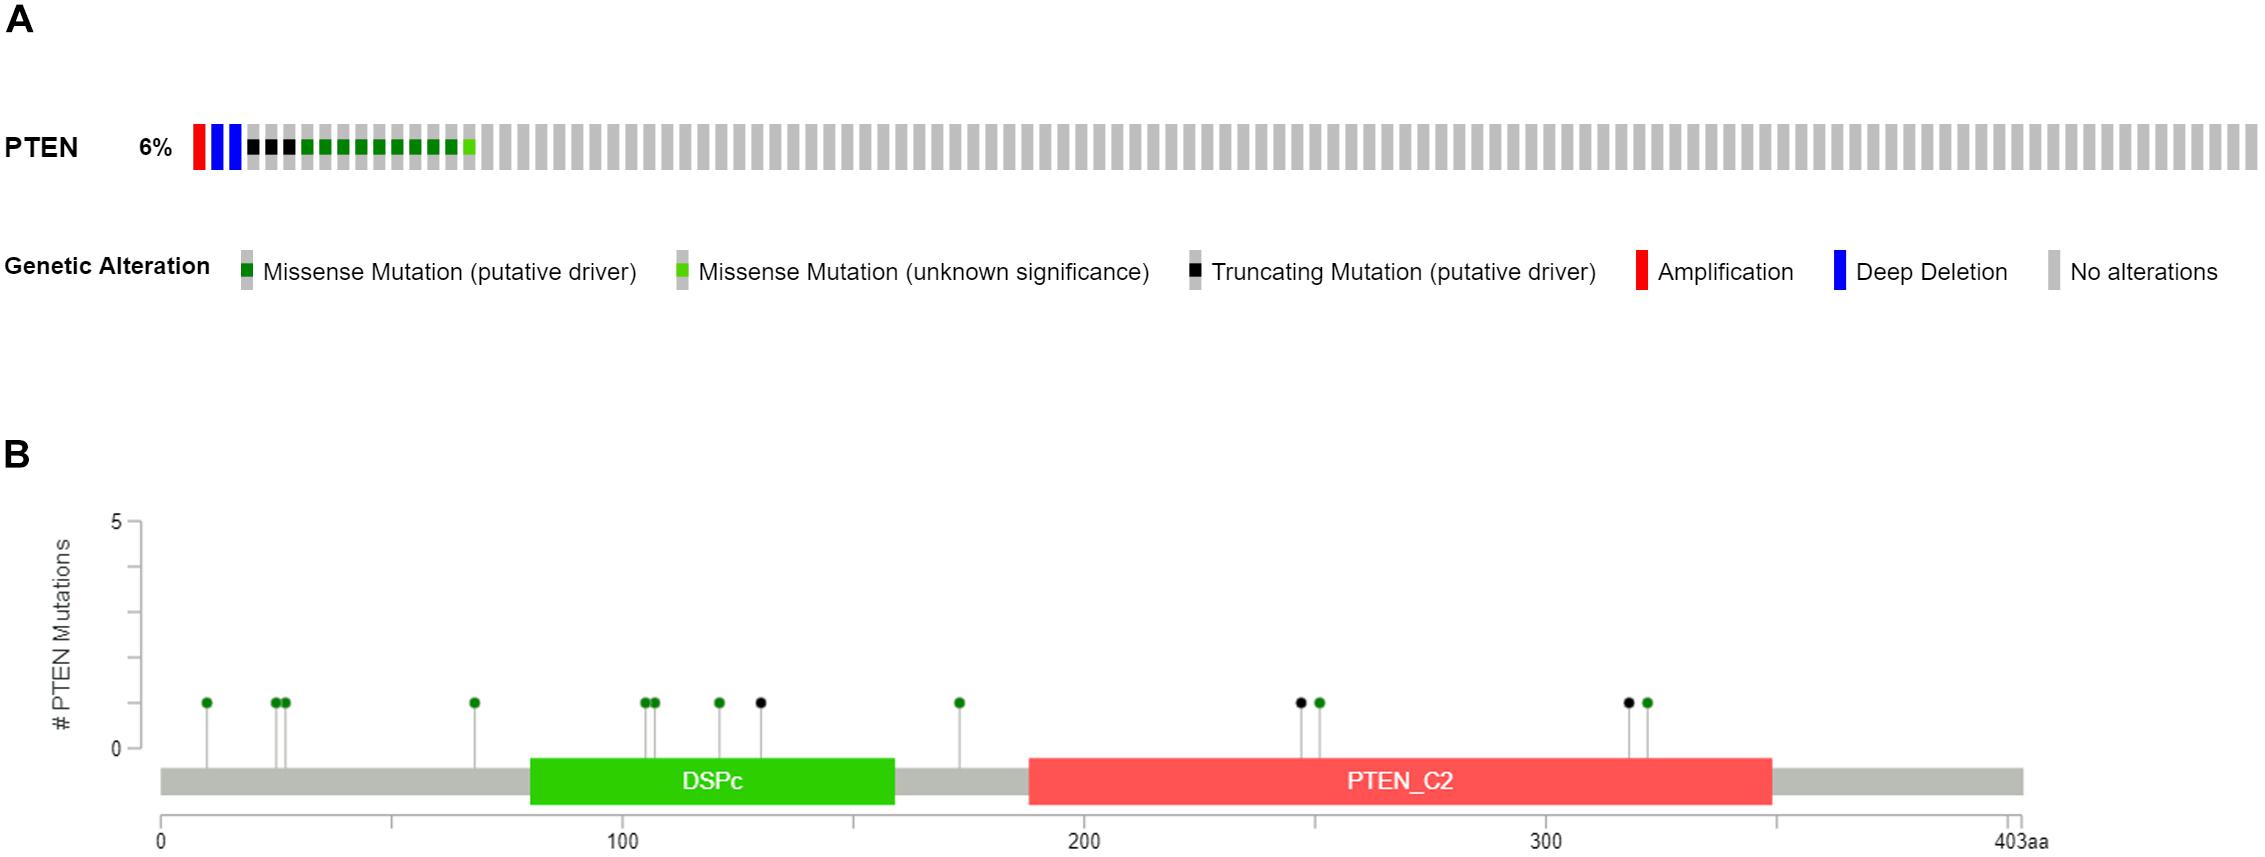
Figure 1. Mutation frequency (A) and types (B) of PTEN mutations in patients with LGG obtained from The Cancer Genome Atlas (TCGA) database.
Clinical information for the LGG patients can provide a profile of related characteristics. Before further bioinformatics analysis, we studied the clinical information of the included patients, as shown in Table 1. The average age (54.44, 35–74 years old) of patients with the PTEN mutation was higher than the wild-type patient (42.52, 14–87 years old), indicating that age may promote the mutation of the PTEN gene. Moreover, the histological grade (G4:G3 = 16:2) of LGG patients harboring the PTEN mutation was higher than the wild-type group (G4:G3 = 247:250), indicating that LGG with a PTEN mutation is more serious.
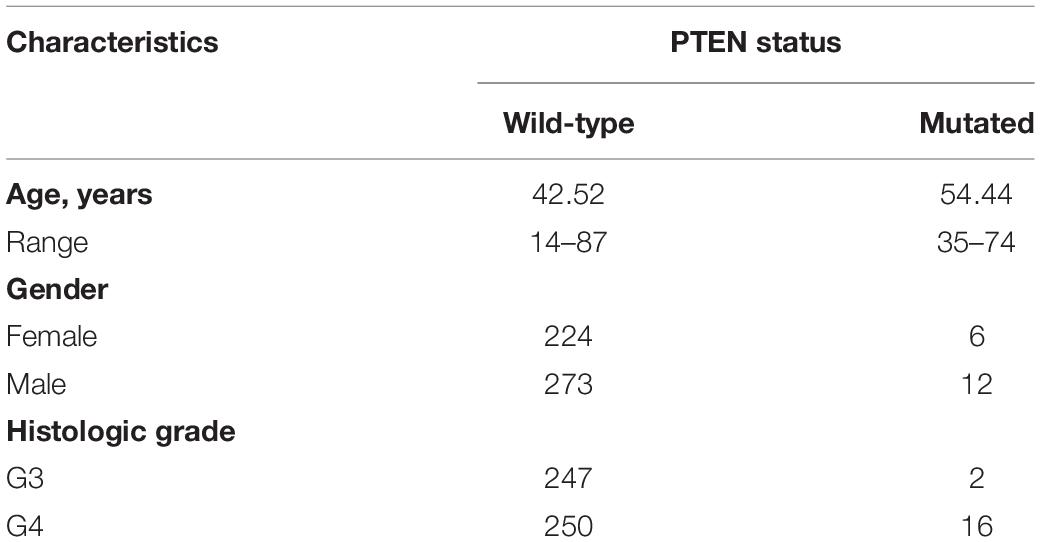
Table 1. Clinical characteristics of patients with low-grade glioma and their PTEN status obtained from the Cancer Genome Atlas database.
Initially, the PTEN mRNA expression level of the wild-type PTEN and PTEN mutation groups were identified. As shown in Figure 2A, the PTEN expression level of the PTEN wild-type group was significantly higher than the PTEN mutated group. Meanwhile, the PTEN expression dependence on the PTEN status (as shown in Figure 2B) showed that the expression level of shallow deletion and diploid was significantly higher than the gain and deep deletion status.
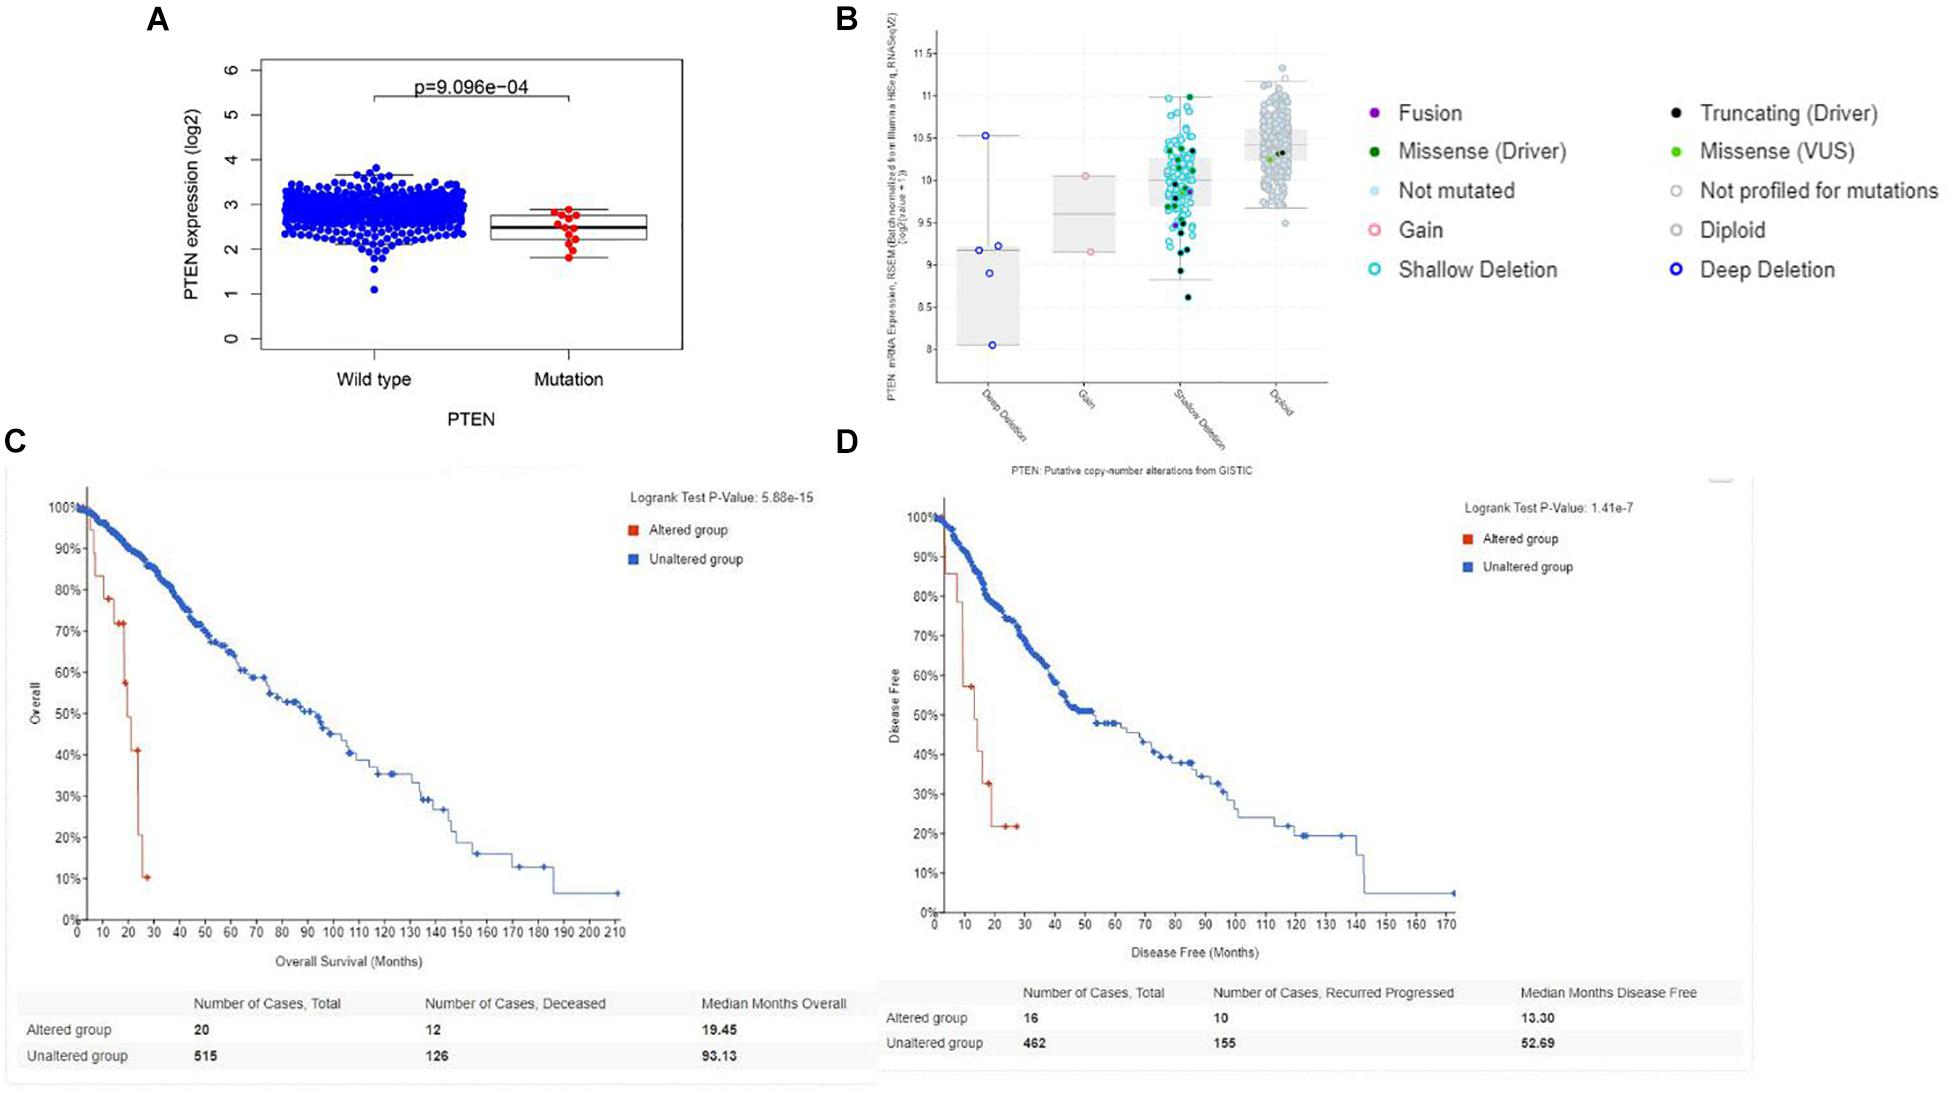
Figure 2. (A) Correlation between the PTEN mutation and mRNA expression; (B) transcriptional expression of PTEN dependence on the PTEN status. (C) Overall survival of LGG patient dependence on the PTEN status (alteration and wild-type). (D) Disease-free survival of LGG patient dependence on the PTEN status (alteration and wild-type).
The PTEN gene is known as the tumor suppressor gene, while PTEN mutation can decrease the inhibition of tumorigenesis. In a previous investigation, a patient with LGG recurrence suffered a poor prognosis (Liu et al., 2020). Thus, early treatment may be helpful for precise therapy in LGG patients harboring the PTEN mutation. To perform the Cox regression analysis of multiple factors and PTEN mRNA expression including tumor grade and patient age, the static results revealed that PTEN mRNA expression levels may affect the prognosis of LGG patients, which is independent of tumor grade, patient age, and gender (Figure 3).
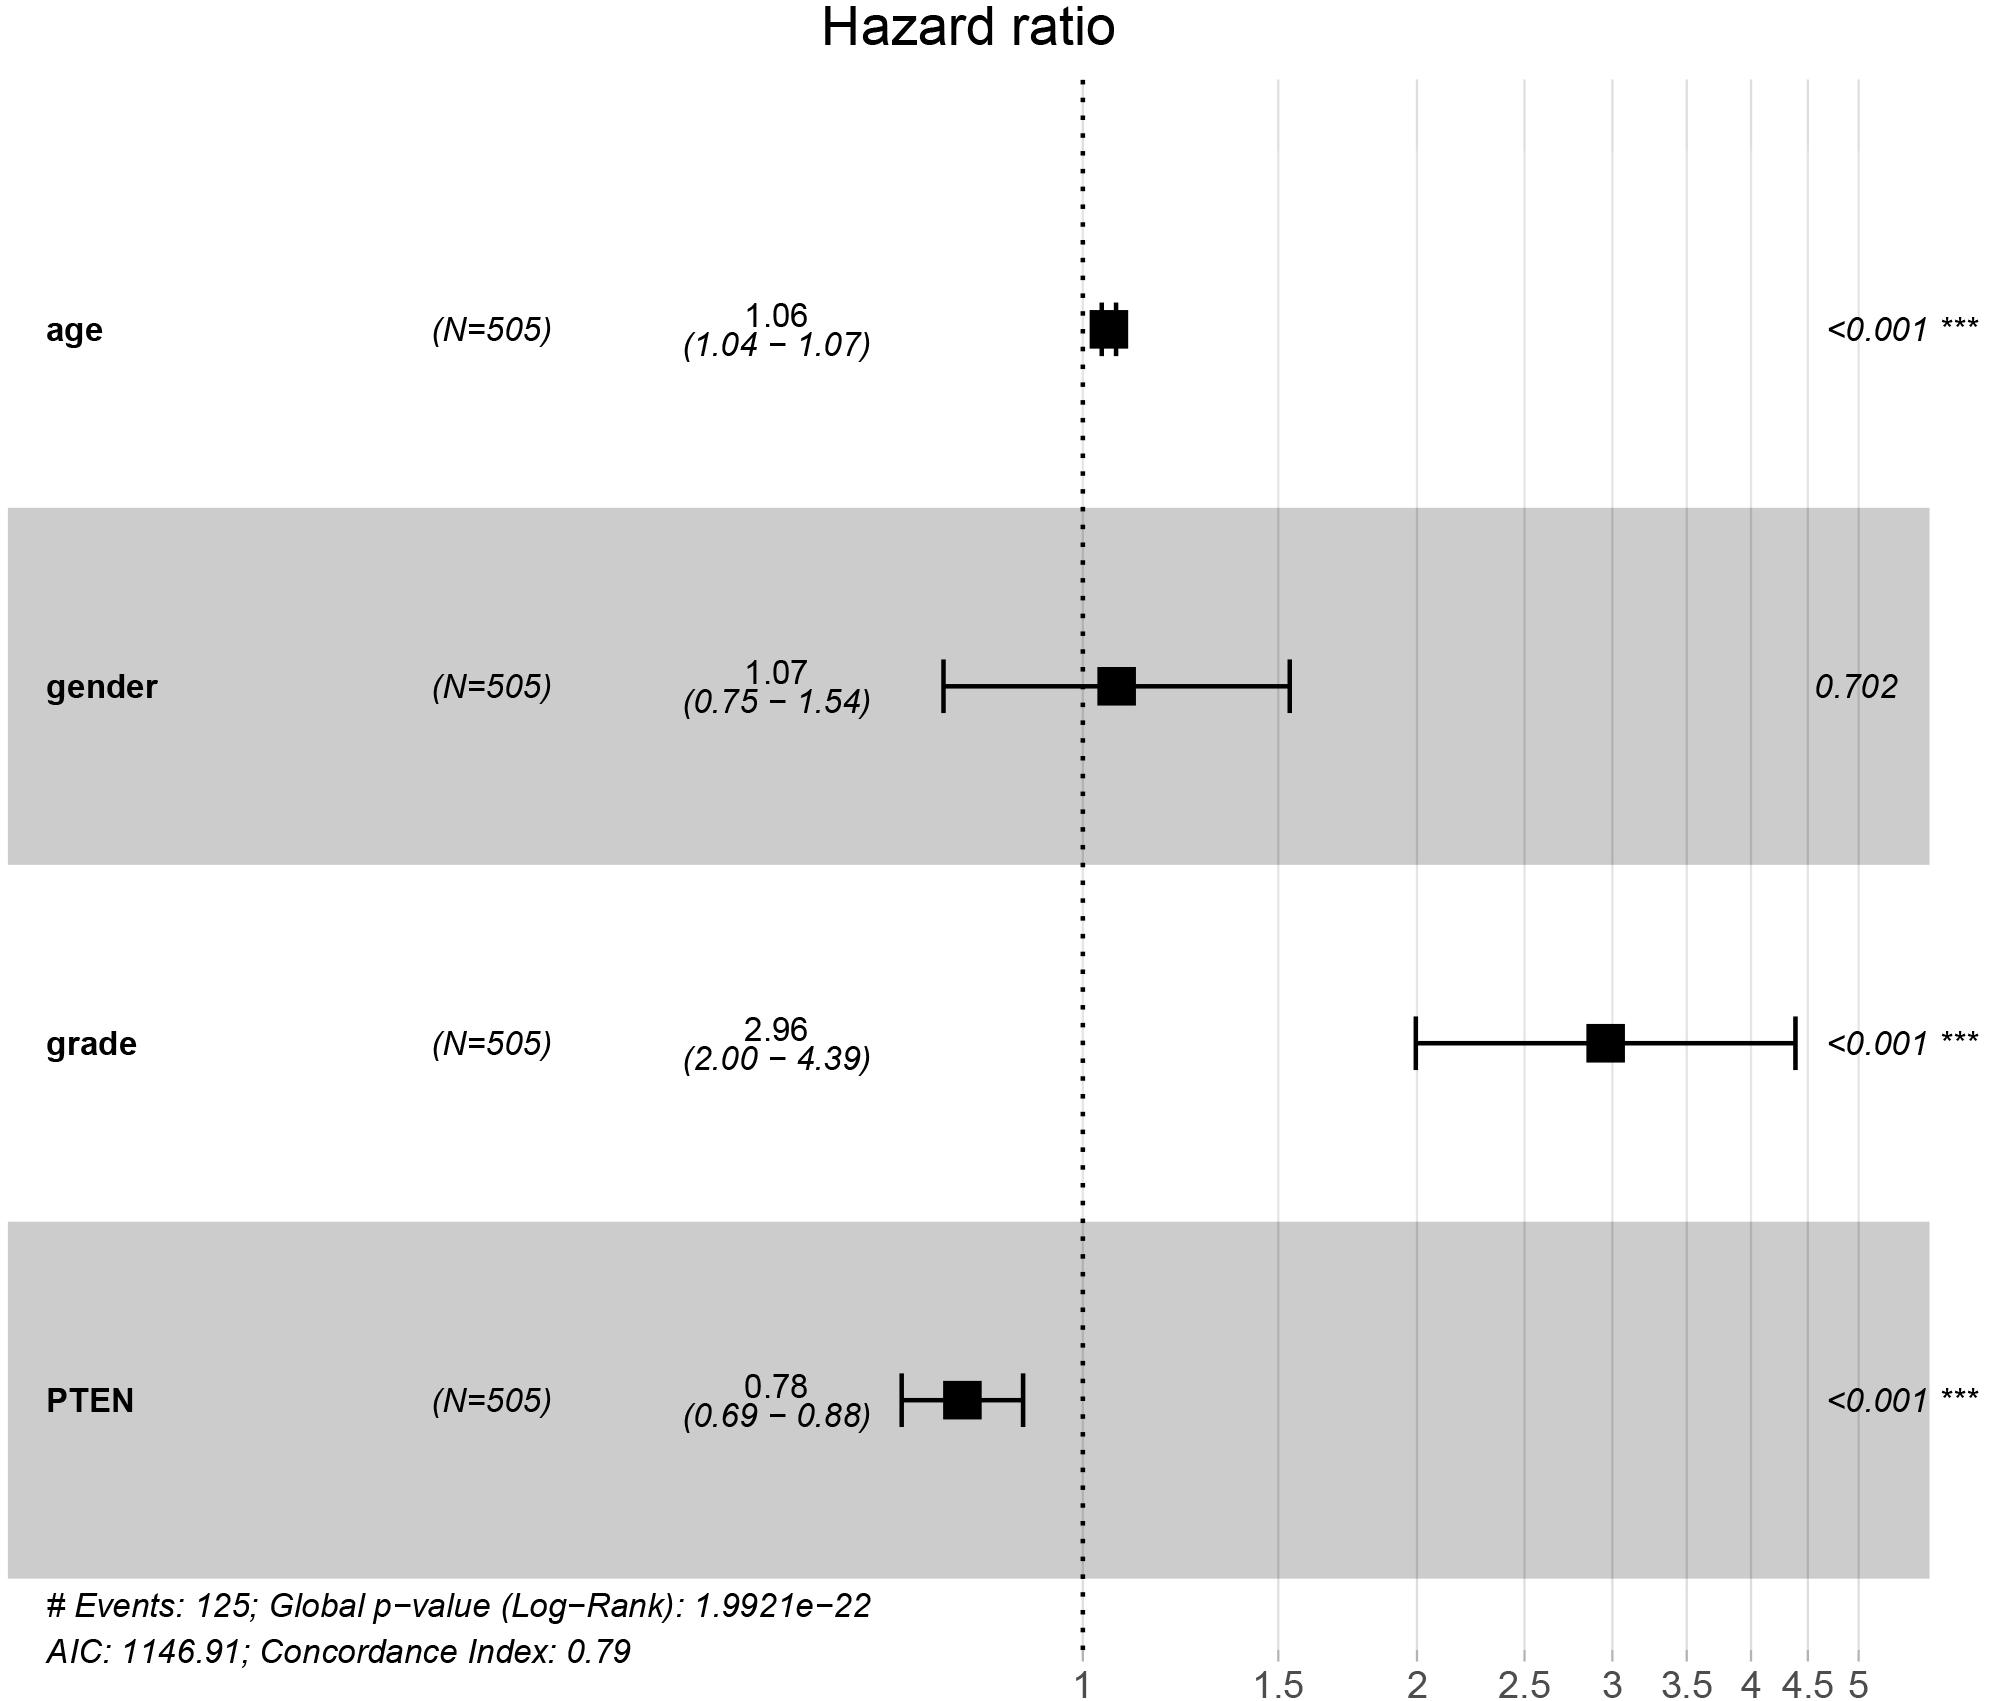
Figure 3. PTEN expression levels affected the prognosis of patients with low-grade glioma independently of tumor stage and patient age and gender.
The correlation between PTEN status and immune cell infiltration (including B cells, CD8+ T cells, CD4+ T cells, macrophages, neutrophils, and dendritic cells) in LGG patients were evaluated using the TIMER database. The results showed that the PTEN mutation is significantly and positively correlated with the infiltration of B cells, macrophages, neutrophils, CD8+ T cells, and dendritic cells in LGG patients (Figure 4), but not CD4+ T cells. Among these differential groups, the immune cell infiltration of PTEN mutation was significantly higher than the wild-type group.
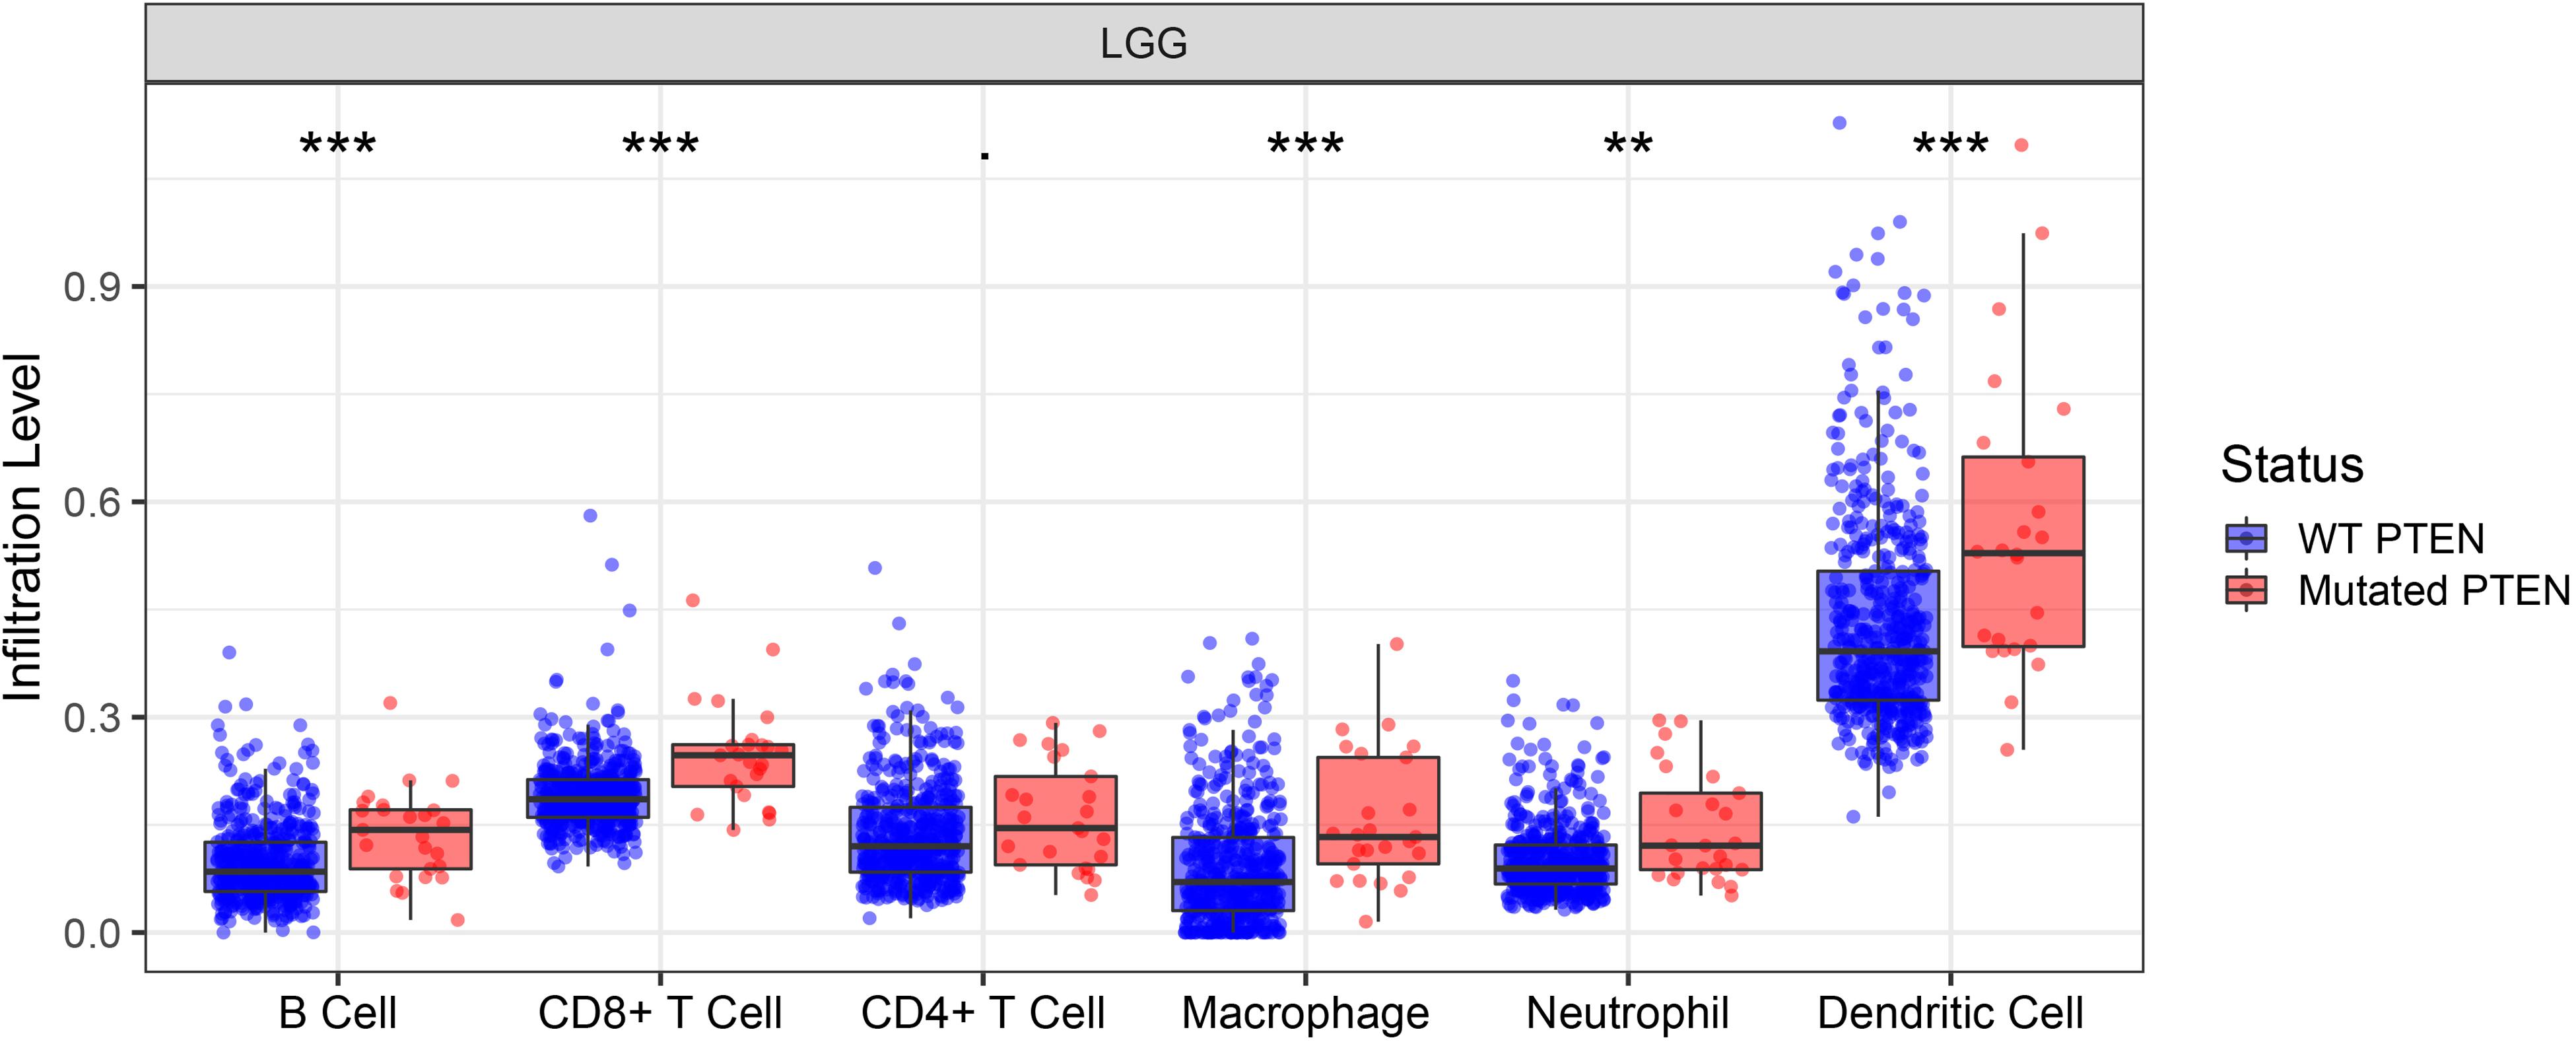
Figure 4. PTEN mutation significantly correlates with immune cell infiltration. **p ≤ 0.01, ***p ≤ 0.001.
To explore the effect of the DEGs on molecular function signaling, the GSEA analysis was employed. By performing the GSEA analysis, we identified eight significant biological function annotations, e.g., unfolded protein response, cholesterol homeostasis, epithelial mesenchymal transition, interferon alpha response, interferon gamma response, and angiogenesis (Figure 5). These annotations are the critical components in cancer cell proliferation. The enrichment results indicated that the PTEN mutation may play a pivotal role in various pathways involved in cancer cell migration, metabolism, and immune response regulation.
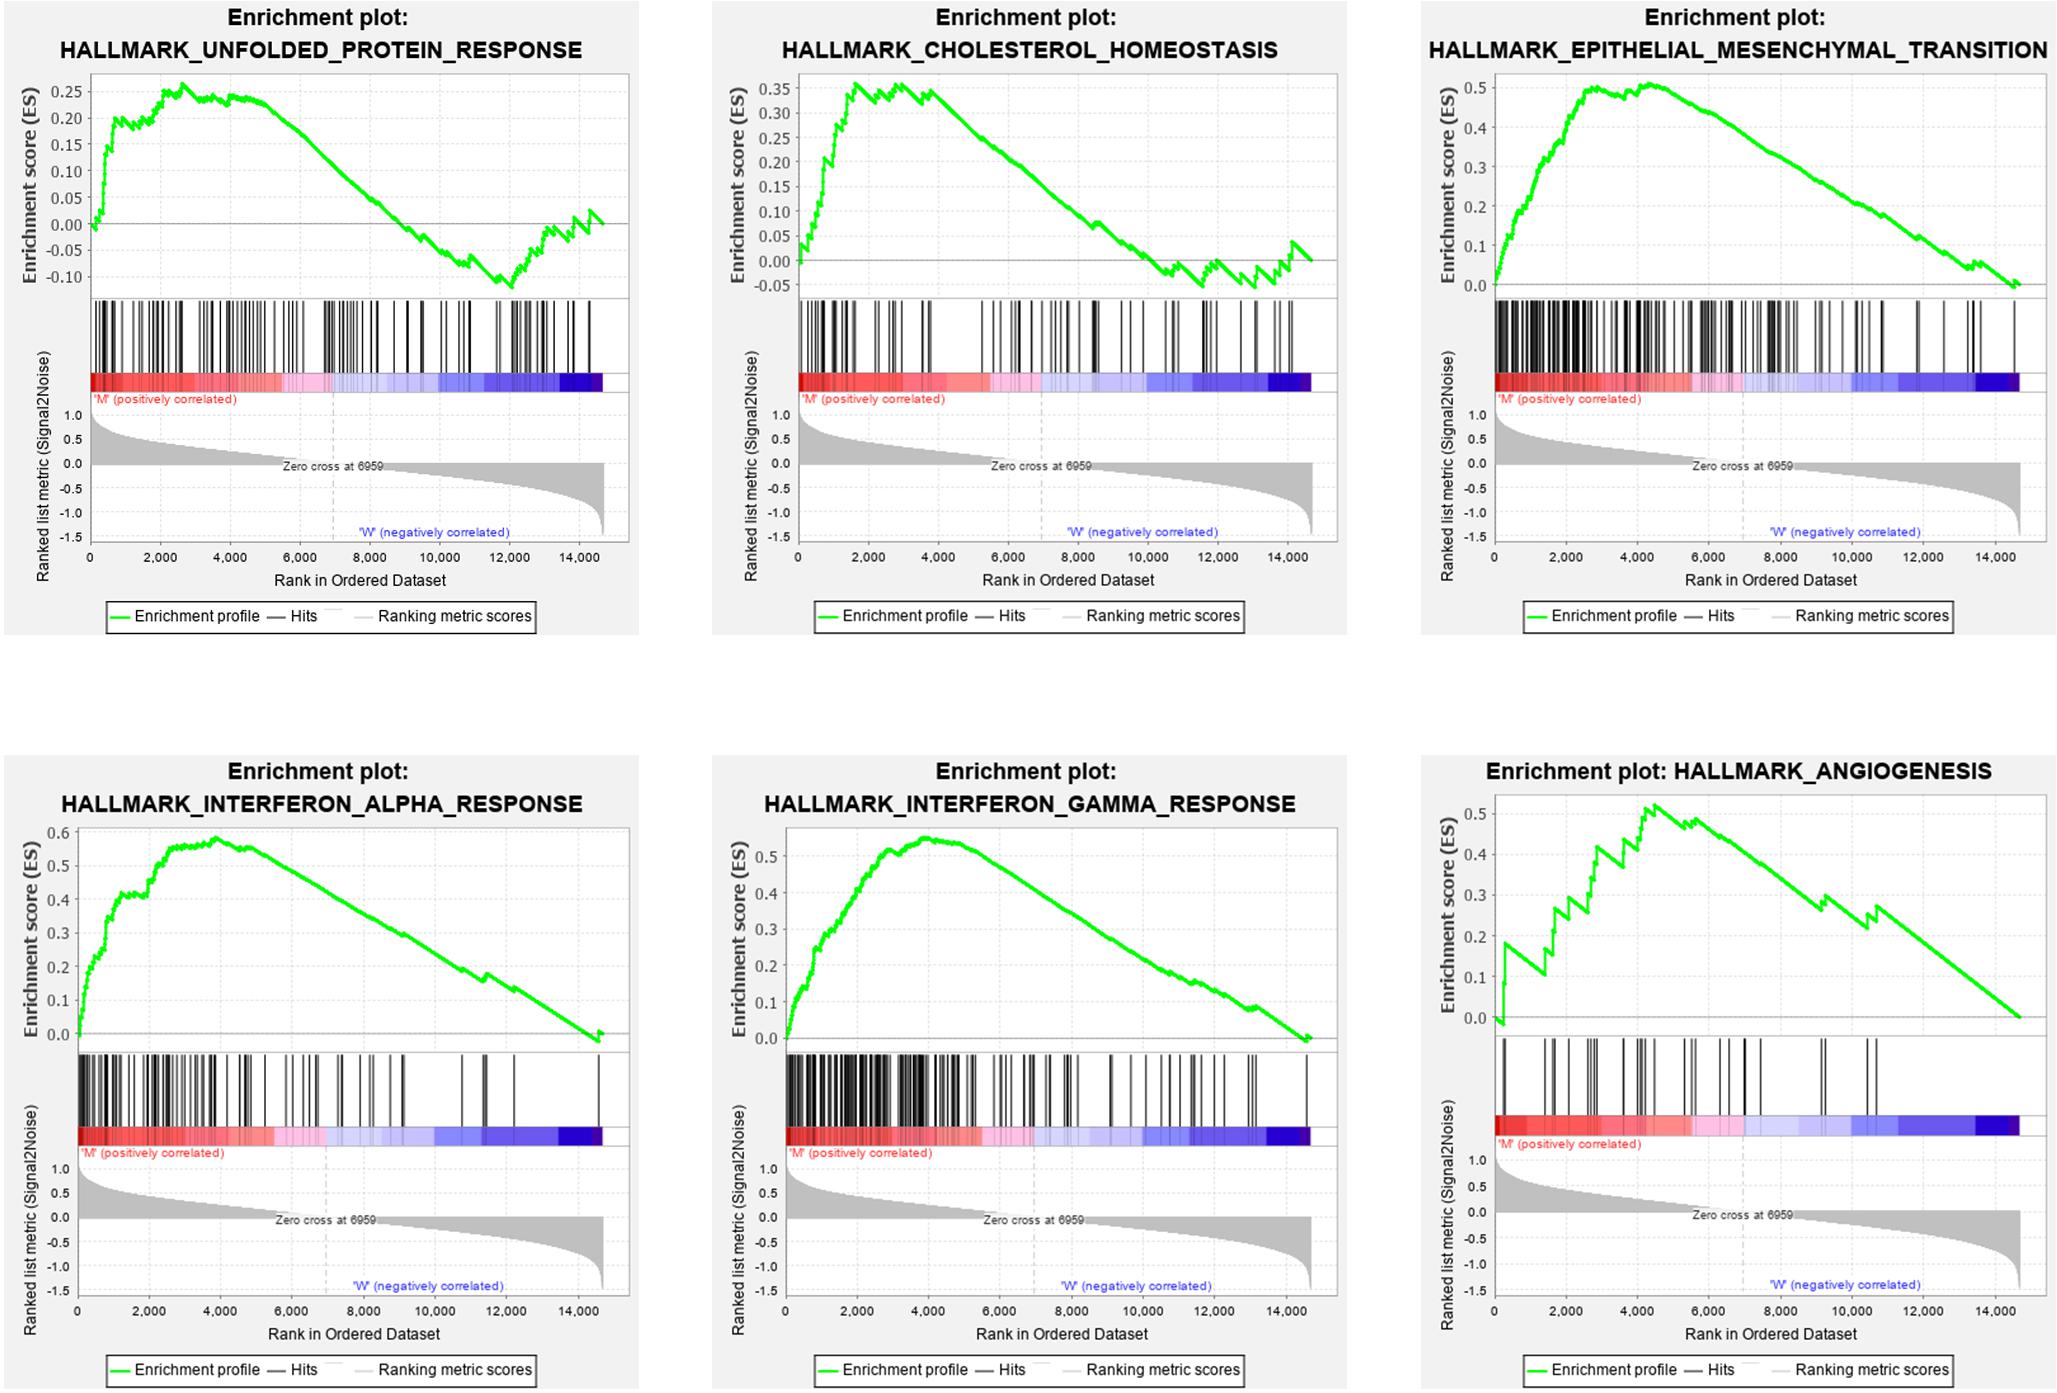
Figure 5. Gene set enrichment analysis results for high PTEN expression levels in patients with low-grade glioma.
DEGs were identified by querying the RNA-seq datasets from the PTEN mutation (n = 18) or wild-type PTEN groups (n = 498). Here, 352 genes were identified as DEGs based on the criteria of | log2FoldChange | ≥ 1.0 and P < 0.05 (as shown in Figure 6A). Among these DEGs, 91 genes were upregulated and 261 genes were downregulated. Meanwhile, we also explored the correlation between PTEN expression and tumor-related biomarker expression (including Nf1, H3F3A, CDKN2A, IDH1, and FGFR1/2) as shown in Table 2. The NF1 expression level was highly positively correlated with PTEN expression (Spearman’s efficiency R = 0.405).
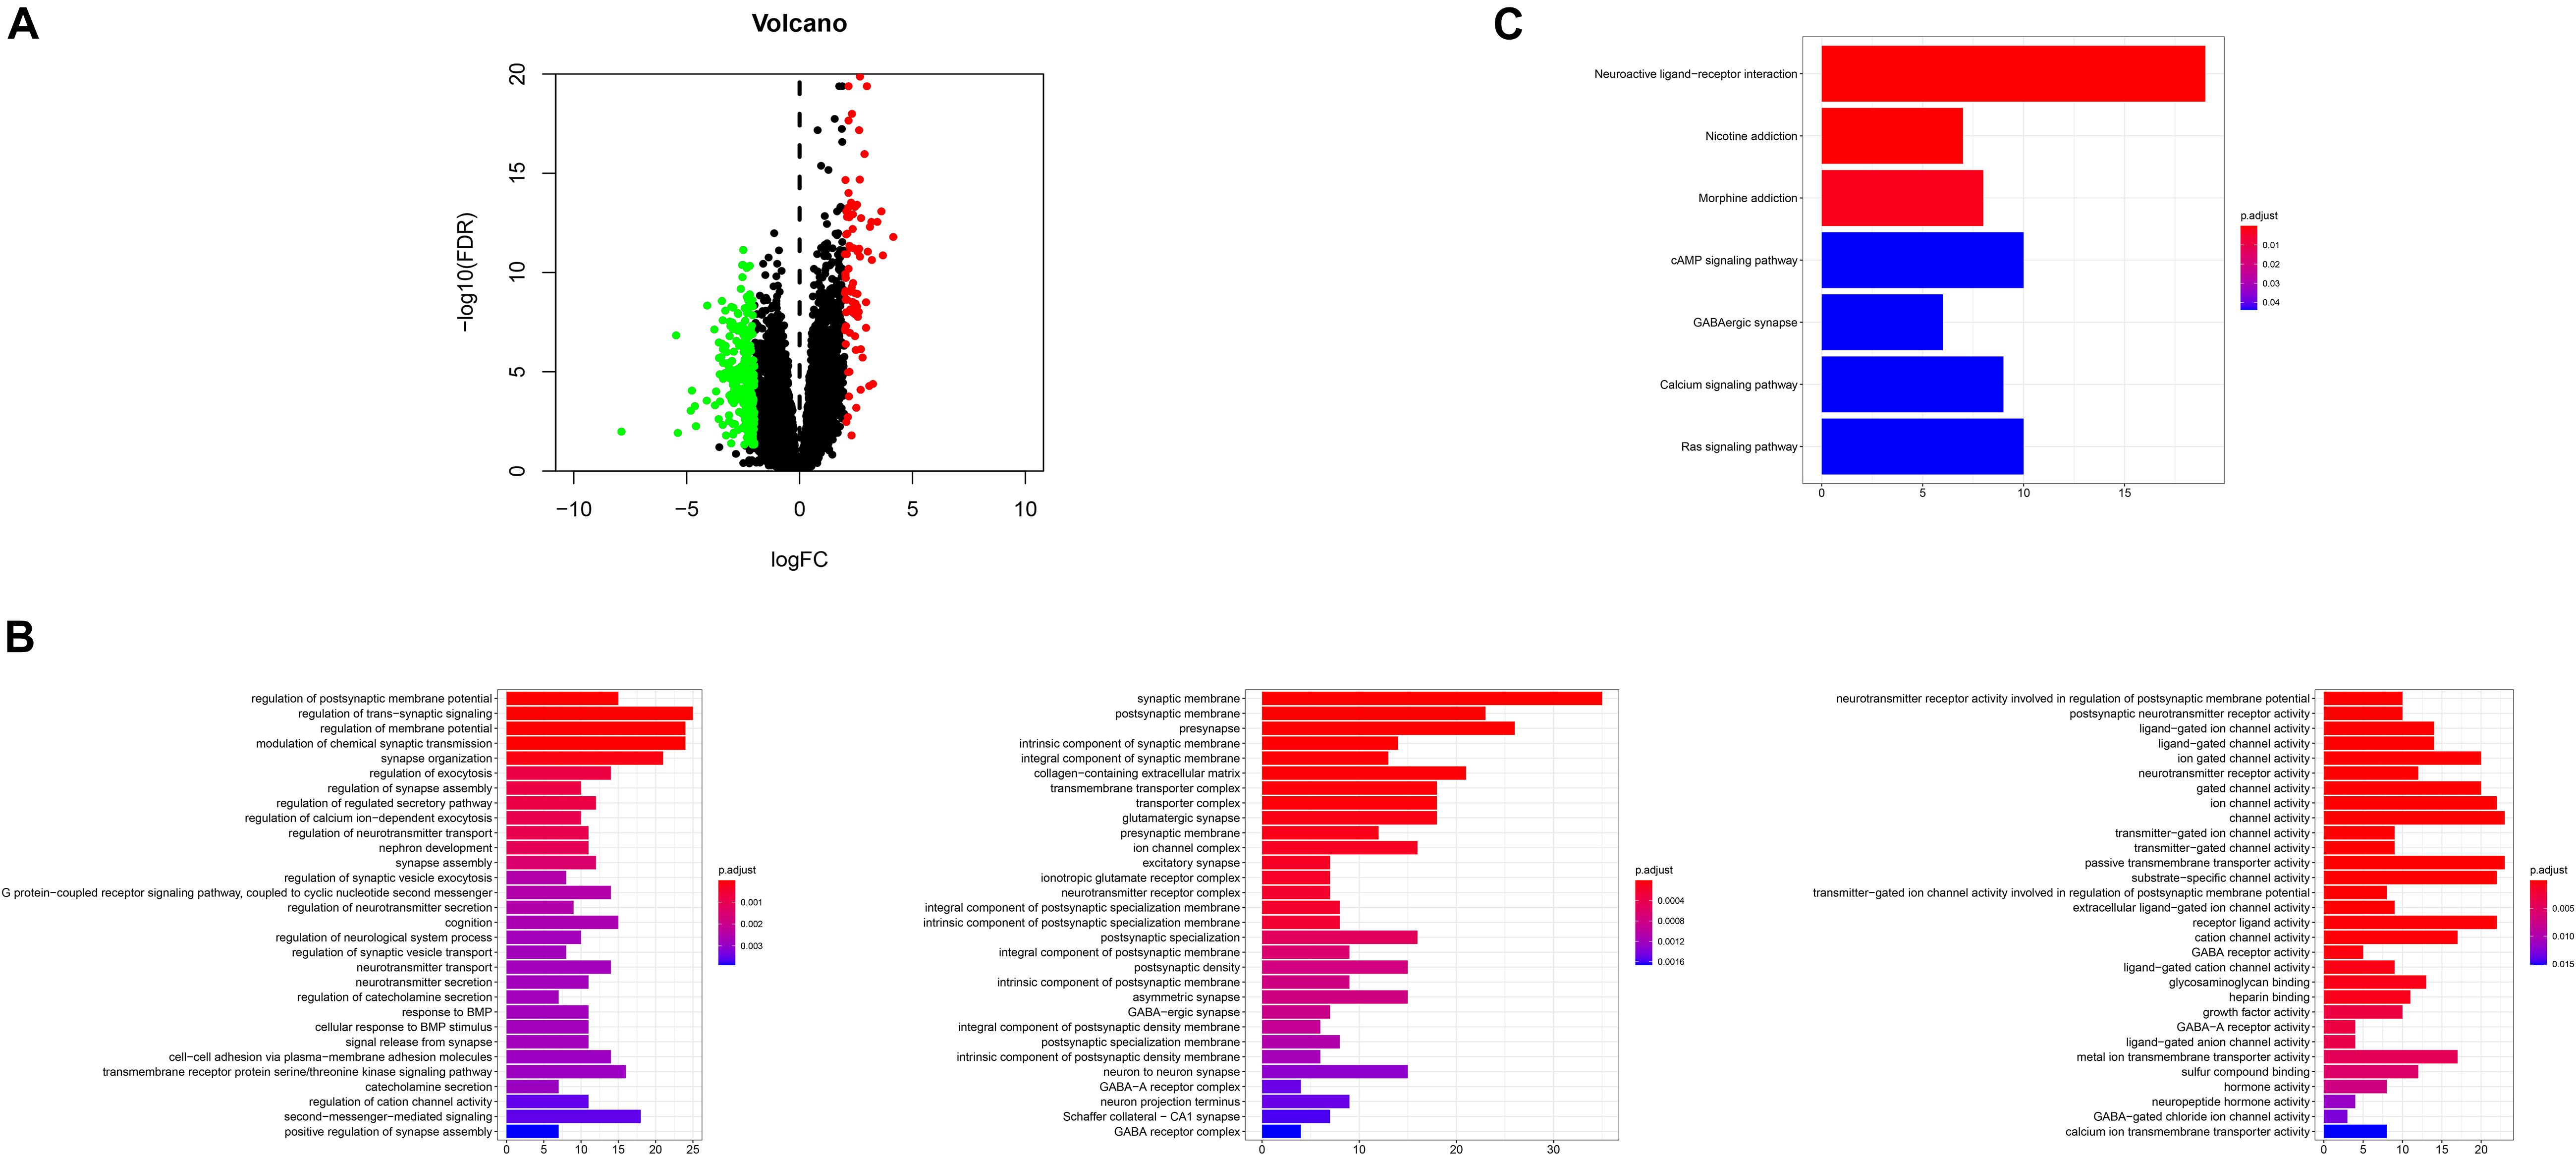
Figure 6. (A) Volcano plot for the differentially expressed genes (DEGs); (B) GO enrichment terms of the DEGs, (C) KEGG pathway analysis of the DEGs.
In order to explore the biological effect of the dependence of these 352 DEGs on PTEN status, we performed GO and KEGG pathway analyses. The GO analysis of the DEGs (Figure 6B) suggested that they were enriched during the regulation of the postsynaptic membrane potential, transsynaptic signaling, the regulation of membrane potential, modulation of the chemical synaptic transmission, synapse organization, synaptic membrane, postsynaptic membrane, pre-synapse, integral components of the synaptic membrane, regulation of the neurotransmitter receptor activity involved in the regulation of the postsynaptic membrane potential, postsynaptic neurotransmitter receptor activity, and ligand-gated ion channel activity. Moreover, the DEGs of the KEGG analysis were enriched in nicotine addiction, morphine addiction, the cyclic adenosine monophosphate (cAMP) signaling pathway, and neuroactive ligand-receptor interaction (Figure 6C).
Data created by the STRING database were filtered, and the mutual effect and central genes within the DEGs were studied. The top 10 genes were confirmed to be central genes. These were confirmed as hub genes and included PSSTR2, GABBR1, SSTR1, CXCL10, CCL4, ANXA1, SAA1, CCL4L1, and HRH3. SSTR2 exhibited the highest degree of nodes among those genes with nine. In the PPI network, the modules of genes were confirmed using the MCODE plug-in in Cytoscape. The top three modules of the GO and KEGG pathways were chosen for analysis (Figure 7). The enrichment results suggested that the genes in modules 1–3 were predominantly associated with the G protein-coupled receptor signaling pathway, coupled to the cyclic nucleotide second messenger, endothelial cell activation, gamma-aminobutyric acid (GABA) receptor activity, cAMP signaling pathway, phospholipase C-activating G protein-coupled receptor signaling pathway, neuroactive ligand-receptor interaction, and post-translational protein modification.
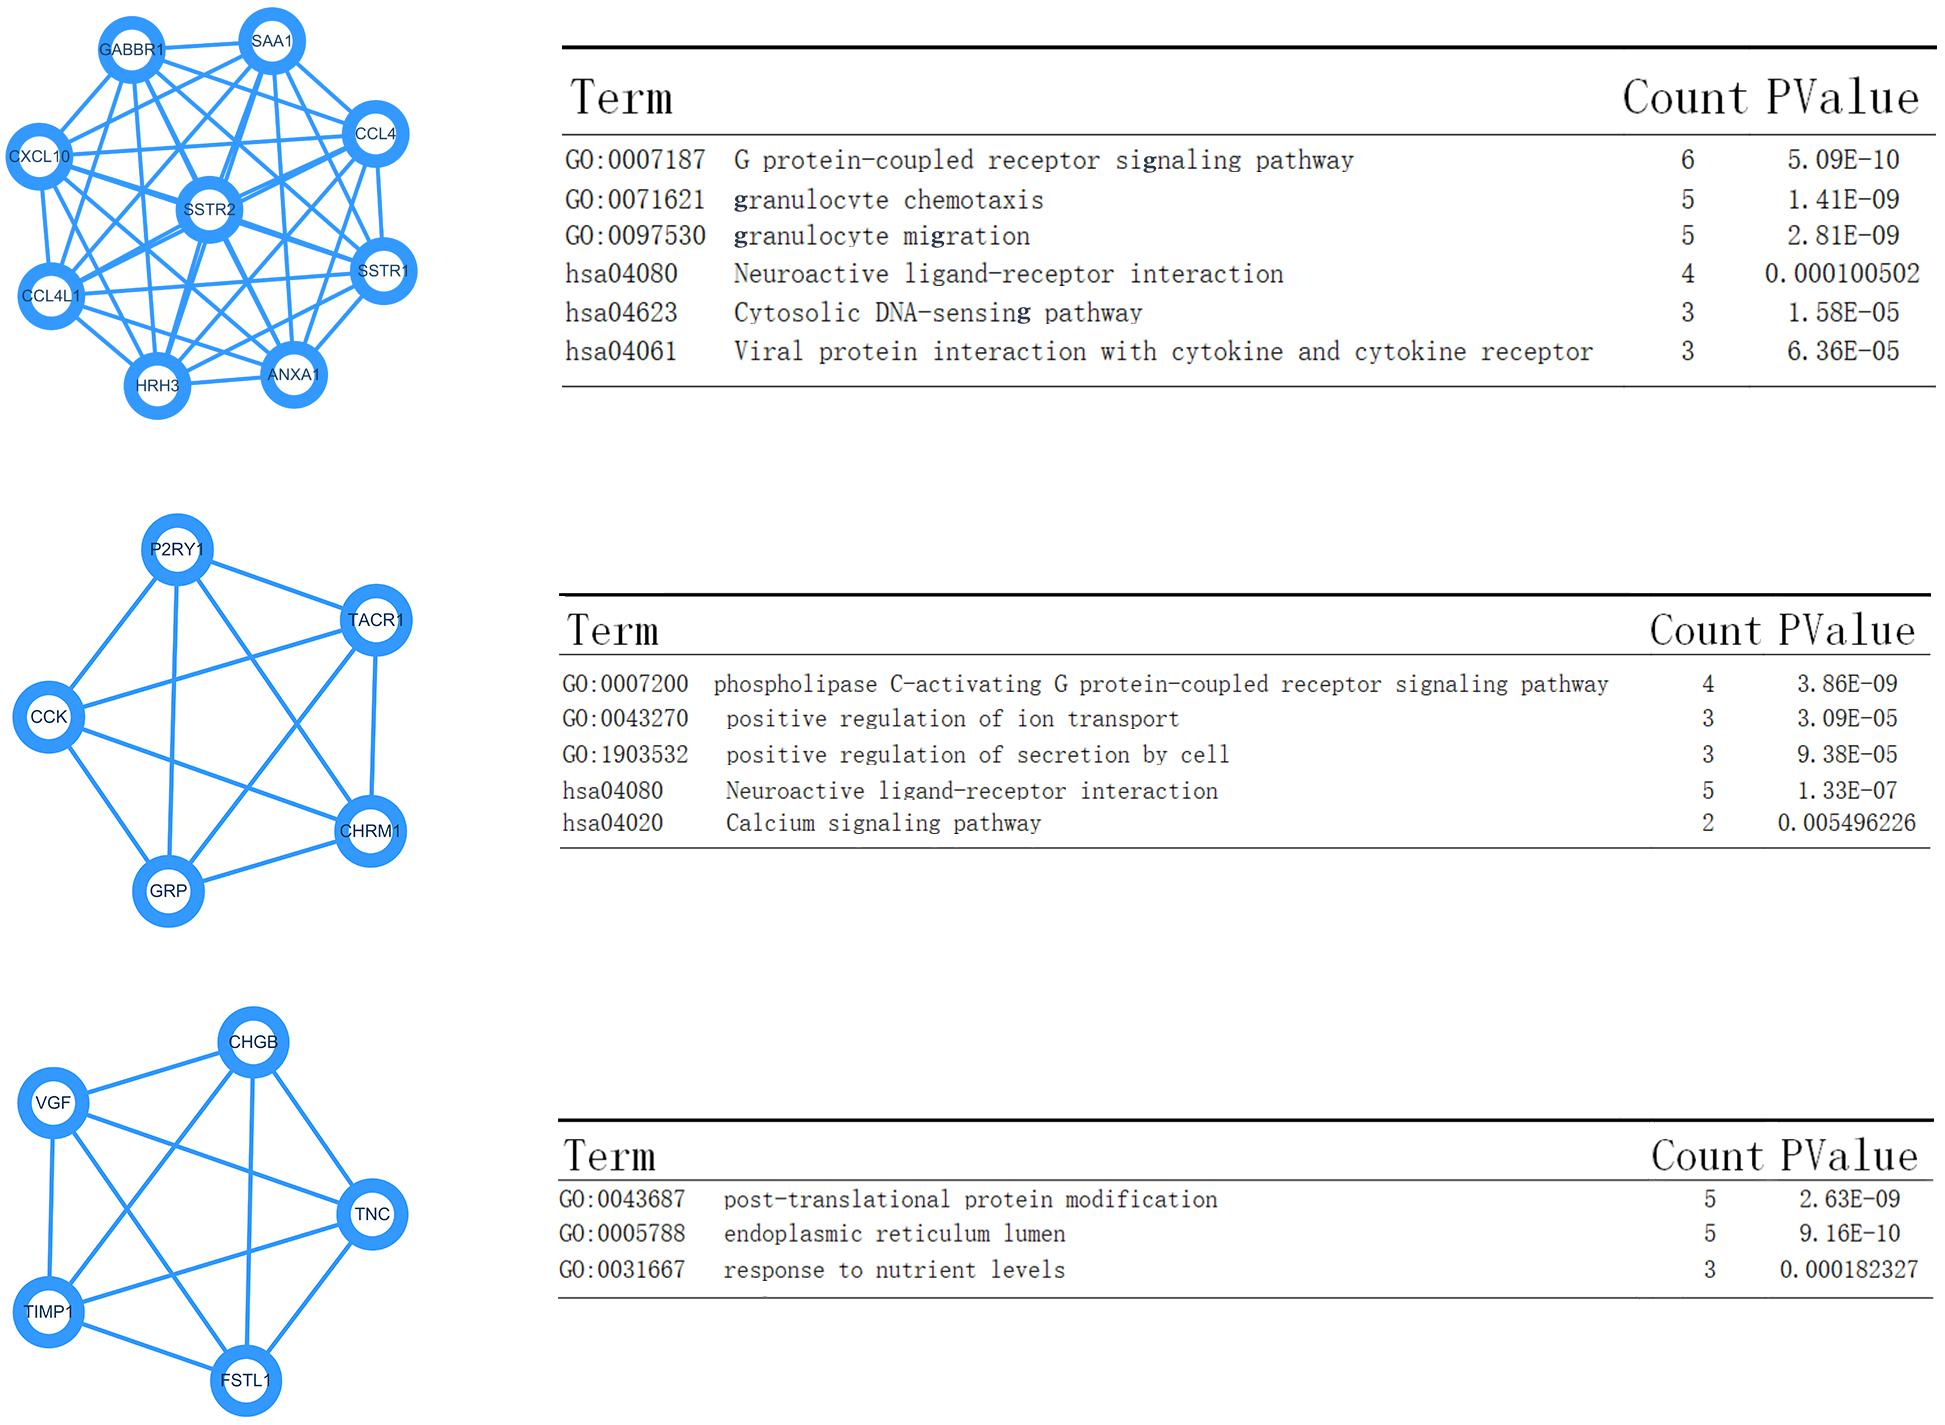
Figure 7. Top three modules from the Pixels Per Inch (PPI) network—(A,B) PPI network and GO and KEGG analyses of module 1; (C,D) PPI network and GO and KEGG analyses of module 2; (E,F) PPI network and GO and KEGG analyses of module 3.
The PTEN protein acts as a tumor suppressor, which inhibits the down-stream proteins when performing its suppressing function (Maehama et al., 2001; McGirt et al., 2005). The bioactivity of the PTEN protein is highly dependent on the subsequent antagonism of the PI3K/AKT pathway. However, some literature has reported that PTEN can function through AKT-independence (Freeman et al., 2003). Consequently, it is necessary to explore the biological functions associated with the PTEN status. In this study, we carefully evaluated the critical role of PTEN mutation in LGG progression and prognosis, which may provide therapeutic scope for precise LGG therapy.
Firstly, the clinical analysis (Figure 1A) results showed that 6% of patients with LGG harbored PTEN mutations, including four types of mutations (missense mutations, nonsense mutations, amplifications, and deep deletions). Furthermore, the survival curve clearly revealed that patients with the PTEN mutation suffered a poorer prognosis, a lower survival rate, and greater disease recurrence than the wild-type group (Figures 2C,D). On the basis of the clinical results, early clinical intervention for LGG PTEN mutation groups would be helpful for improving the patient survival period.
Second, the Cox analysis revealed that the mRNA expression level of the PTEN mutation group was lower than the wild-type group (P < 0.01). And shallow deletion and normal diploid types of PTEN mRNA level were also higher than the deep deletion and gain status (Figure 2B). Considering the PTEN mutation types (missense), a mutation of PTEN led to the dysfunction of tumorigenesis suppression. Meanwhile, we also found that the PTEN expression level was related with some tumor-related biomarkers (Table 2).
Immune cell infiltration can affect the tumor occurrence, progression, and prognosis, owing to the effect of the tumor microenvironment (Chaffer and Weinberg, 2011; Deng et al., 2020). The tumor microenvironment is highly associated with immune cell infiltration. Consequently, exploring the immune cell infiltration level may provide more scope on the tumor progression and immune status. Here, we identified the role of immune cell infiltration in PTEN status using the TIMER database (Figure 4). By further analysis, B cells, neutrophils, CD4+ T cells, macrophages, CD8+ T cells, and dendritic cells were more significantly abundant in the PTEN mutation group than the wild-type PTEN group. Higher immune cell infiltration meant that the complex immune microenvironment may induce a serious progression status. Therefore, these results revealed that some specific genes or signaling may lead to immune cell infiltration in the PTEN mutation group.
Finally, we explored the role of critical molecular annotations that led to the poor prognosis of PTEN mutation LGG patients (Figures 5, 6). The top six annotations of GSEA were associated with various cancer-related pathways, e.g., epithelial mesenchymal transition, interferon gamma response, interferon alpha response, cholesterol homeostasis, unfolded protein response, and angiogenesis. These molecular functions promoted tumorigenesis (epithelial mesenchymal transition) and enhanced drug resistance (unfolded protein response). By deeply affecting these signal pathways, LGGs with PTEN mutations can lead to a higher tumor grade and poor survival (Figures 2C,D).
After the identification of DEGs (Figure 6A), the GSEA analysis on the biological function levels were carefully studied (Figures 6B,C). The GO annotations showed that the top five ranking annotations were mostly associated with the signal transduction process, for example, the regulation of postsynaptic membrane potential, synaptic membrane, and ligand-gated ion channel activity. These annotations were “neuron”-related signaling and these molecular functions may affect cell metastasis. Among them, epithelial mesenchymal transition, a complex biological process, contributed to metastasis, wherein the genetic and epigenetic events caused the epithelial cells to acquire a mesenchymal gene activity signature and phenotype (Subramanian et al., 2005; Li et al., 2020). The GO analysis results showed that 352 DEGs could be attributed to the top three GO annotations: growth factor activity, GABA receptor activity, and neurotransmitter secretion. The enriched annotations of growth factor activity and neurotransmitter secretion were consistent with immune cell infiltration.
Moreover, the KEGG enrichment results confirmed the GO analysis, because the top ranking pathways were neuron-related molecular functions and tumor-related pathways (Ras signaling pathway). The PPI network analysis also provided four key nodes by STRING analysis (Figure 7). These node networks were highly associated with the protein modification process.
In summary, we systematically investigated the PTEN mutation condition with LGG poor prognosis and immune cell infiltration. These results revealed that a PTEN mutation can promote the tumorigenesis process and lead to more immune cell infiltration. Thus, our results showed the importance of PTEN status in disease progression and revealed that it may become a useful biomarker for diagnosing LGGs.
Publicly available datasets were analyzed in this study. This data can be found here: TCGA.
All authors contributed to the literature investigation, data collection, writing the manuscript, providing useful discussion of its content, and undertaking reviews or revising the manuscript before submission.
This study was supported by a grant (No. 2018ZDXM-SF-040) from the Key Project of Shaanxi Province-the field of Social Development.
The authors declare that the research was conducted in the absence of any commercial or financial relationships that could be construed as a potential conflict of interest.
DEG, Differentially expressed genes; FDR, False discovery rate; GABA, Gamma-aminobutyric acid; GSEA, Gene set enrichment analysis; LGG, Low-grade gliomas; mRNA, messenger ribonucleic acid; PPI, Protein-protein interaction; STRING, Search Tool for the Retrieval of Interacting Genes; TCGA, The Cancer Genome Atlas.
Andersson, U., Malmer, B., Bergenheim, A. T., Brannstrom, T., and Roger, H. (2004). Heterogeneity in the expression of markers for drug resistance in brain tumors. Clin. Neuropathol. 23, 21–27.
Bader, G. D., and Hogue, C. W. (2003). An automated method for finding molecular complexes in large protein interaction networks. BMC Bioinformatics 4:2. doi: 10.1186/1471-2105-4-2
Best, S. A., De Souza, D. P., Kersbergen, A., Antonia, N. P., Saravanan, D., and Dedreia, T. (2018). Synergy between the KEAP1/NRF2 and PI3K pathways drives non-small-cell lung cancer with an altered immune microenvironment. Cell Metab. 27, 935–943.e4.
Buckner, J. C., Shaw, E. G., Pugh, S. L., Arnab, C., Mark, G. R., and Geoffrey, R. B. (2016). Radiation plus procarbazine, CCNU, and vincristine in low-grade glioma. N. Engl. J. Med. 374, 1344–1355.
Calatozzolo, C., Pollo, B., Botturi, A., Loredana, D., Mariantonia, C., and Andrea, S. (2012). Multidrug resistance proteins expression in glioma patients with epilepsy. J. Neurooncol. 110, 129–135. doi: 10.1007/s11060-012-0946-9
Chaffer, C. L., and Weinberg, R. A. (2011). A perspective on cancer cell metastasis. Science 331, 1559–1564. doi: 10.1126/science.1203543
Deng, X., Lin, D., Zhang, X., Xuchao, S., Zelin, Y., and Liang, Y. (2020). Profiles of immune-related genes and immune cell infiltration in the tumor microenvironment of diffuse lower-grade gliomas. J. Cell. Physiol. 235, 7321–7331. doi: 10.1002/jcp.29633
Dennis, G. Jr., Sherman, B. T., Hosack, D. A., Yang, J., Gao, W., Lane, H. C., et al. (2003). DAVID: database for annotation, visualization, and integrated discovery. Genome Biol. 4:R60. doi: 10.1186/gb-2003-4-9-r60
Freeman, D. J., Li, A. G., Wei, G., Li, H. H., Kertesz, N., Lesche, R., et al. (2003). TEN tumor suppressor regulates p53 protein levels and activity through phosphatase-dependent and independent mechanisms. Cancer Cell 3, 117–130. doi: 10.1016/S1535-6108(03)00021-7
Helseth, R., Helseth, E., Johannesen, T. B., Langberg, C. W., Lote, K., Rønning, P., et al. (2010). Overall survival, prognostic factors, and repeated surgery in a consecutive series of 516 patients with glioblastoma multiforme. Acta Neurol. Scand. 122, 159–167. doi: 10.1111/j.1600-0404.2010.01350.x
Ino, Y., Yamazaki-Itoh, R., Shimada, K., Iwasaki, M., Kosuge, T., and Kanai, Y. (2013). Immune cell infiltration as an indicator of the immune microenvironment of pancreatic cancer. Br. J. Cancer 108, 914–923. doi: 10.1038/bjc.2013.32
Johnson, D. R., and O’Neill, B. P. (2012). Glioblastoma survival in the United States before and during the temozolomide era. J. Neurooncol. 107, 359–364. doi: 10.1007/s11060-011-0749-4
Li, J., Yen, C., Liaw, D., Podsypanina, K., Bose, S., Wang, S. I., et al. (1997). PTEN, a putative protein tyrosine phosphatase gene mutated in human brain, breast, and prostate cancer. Science 275, 1943–1947. doi: 10.1126/science.275.5308.1943
Li, T., Fu, J., Zeng, Z., David, C., Jing, L., and Qianming, C. (2020). TIMER2.0 for analysis of tumor-infiltrating immune cells. Nucleic Acids Res. 48, W509–W514.
Liu, W., Xu, Z., Zhou, J., Xing, S., Li, Z., Gao, X., et al. (2020). High levels of HIST1H2BK in low-grade glioma predicts poor prognosis: a study using CGGA and TCGA Data. Front. Oncol. 10:627. doi: 10.3389/fonc.2020.00627
Louis, D. N., Ohgaki, H., Wiestler, O. D., Cavenee, W. K., Burger, P. C., Jouvet, A., et al. (2007). The 2007 WHO classification of tumours of the central nervous system. Acta Neuropathol. 114, 97–109. doi: 10.1007/978-94-007-1399-4_10
Maehama, T., Taylor, G. S., and Dixon, J. E. (2001). PTEN and myotubularin: novel phosphoinositide phosphatases. Annu. Rev. Biochem. 70, 247–279. doi: 10.1146/annurev.biochem.70.1.247
McCarthy, D. J., Chen, Y., and Smyth, G. K. (2012). Differential expression analysis of multifactor RNA-Seq experiments with respect to biological variation. Nucleic Acids Res. 40, 4288–4297. doi: 10.1093/nar/gks042
McGirt, M. J., Woodworth, G. F., Coon, A. L., Frazier, J. M., Amundson, E., Garonzik, I., et al. (2005). Independent predictors of morbidity after image-guided stereotactic brain biopsy: a risk assessment of 270 cases. J. Neurosurg. 102, 897–901. doi: 10.3171/jns.2005.102.5.0897
Mootha, V. K., Lindgren, C. M., Eriksson, K. F., Subramanian, A., Sihag, S., Lehar, J., et al. (2003). PGC-1alpha-responsive genes involved in oxidative phosphorylation are coordinately downregulated in human diabetes. Nat. Genet. 34, 267–273. doi: 10.1038/ng1180
Mu, M., Niu, W., Zhang, X., Hu, S., and Niu, C. (2020). LncRNA BCYRN1 inhibits glioma tumorigenesis by competitively binding with miR-619-5p to regulate CUEDC2 expression and the PTEN/AKT/p21 pathway. Oncogene 39, 6879–6892. doi: 10.1038/s41388-020-01466-x
Norton, K. A., Gong, C., Jamalian, S., and Popel, A. S. (2019). Multiscale agent-based and hybrid modeling of the tumor immune microenvironment. Processes 7, 37. doi: 10.3390/pr7010037
Robinson, M. D., McCarthy, D. J., and Smyth, G. K. (2010). edgeR: a Bioconductor package for differential expression analysis of digital gene expression data. Bioinformatics 26, 139–140. doi: 10.1093/bioinformatics/btp616
Steck, P. A., Pershouse, M. A., Jasser, S. A., Yung, W. K., Lin, H., Ligon, A. H., et al. (1997). Identification of a candidate tumour suppressor gene, MMAC1, at chromosome 10q23.3 that is mutated in multiple advanced cancers. Nat. Genet. 15, 356–362. doi: 10.1038/ng0497-356
Subramanian, A., Tamayo, P., Mootha, V. K., Mukherjee, S., Ebert, B. L., Gillette, M. A., et al. (2005). Gene set enrichment analysis: a knowledge-based approach for interpreting genome-wide expression profiles. Proc. Natl. Acad. Sci. U.S.A. 102, 15545–15550. doi: 10.1073/pnas.0506580102
Szklarczyk, D., Franceschini, A., Wyder, S., Forslund, K., Heller, D., Huerta-Cepas, J., et al. (2015). STRING v10: protein-protein interaction networks, integrated over the tree of life. Nucleic Acids Res. 43, D447–D452. doi: 10.1093/nar/gku1003
Wiencke, J. K., Zheng, S., Jelluma, N., Tarik, T., Scott, V., Tanja, T., et al. (2007). Methylation of the PTEN promoter defines low-grade gliomas and secondary glioblastoma. Neuro Oncol. 9, 271–279. doi: 10.1215/15228517-2007-003
Keywords: phosphatase and tensin homolog, prognosis, mutation, low-grade gliomas, gene
Citation: Feng P, Li Z, Li Y and Zhang Y (2020) Phosphatase and Tensin Homolog Mutation in Immune Cell Infiltration and Clinicopathological Features of Low-Grade Gliomas. Front. Mol. Biosci. 7:562416. doi: 10.3389/fmolb.2020.562416
Received: 21 May 2020; Accepted: 20 November 2020;
Published: 10 December 2020.
Edited by:
Arun Prasad Pandurangan, University of Cambridge, United KingdomReviewed by:
Antonella Di Pizio, Technical University of Munich, GermanyCopyright © 2020 Feng, Li, Li and Zhang. This is an open-access article distributed under the terms of the Creative Commons Attribution License (CC BY). The use, distribution or reproduction in other forums is permitted, provided the original author(s) and the copyright owner(s) are credited and that the original publication in this journal is cited, in accordance with accepted academic practice. No use, distribution or reproduction is permitted which does not comply with these terms.
*Correspondence: Yuelin Zhang, eHl5eHlmcEAxNjMuY29t
Disclaimer: All claims expressed in this article are solely those of the authors and do not necessarily represent those of their affiliated organizations, or those of the publisher, the editors and the reviewers. Any product that may be evaluated in this article or claim that may be made by its manufacturer is not guaranteed or endorsed by the publisher.
Research integrity at Frontiers

Learn more about the work of our research integrity team to safeguard the quality of each article we publish.