 Xiaoqi Ren1,2†
 Liwei Wang1,3†
 Chuanzong Yu1Jianghong An1
 Shaoyin Fu1Hua Sun1Mengran Zhao1Rigele Te1Xiaobo Bai1,3Jingda Yuan1,2Yongbin Liu2,3,4*Jiangfeng He1,2,4*
- 1Research Institute of Biotechnology, Inner Mongolia Academy of Agricultural and Animal Husbandry Sciences, Hohhot, China
- 2College of Animal Science and Technology, Inner Mongolia Minzu University, Tongliao, China
- 3College of Life Sciences, Inner Mongolia University, Hohhot, China
- 4College of Animal Science, Inner Mongolia Agricultural University, Hohhot, China
The intestinal microbiota plays a vital role in animal growth and development. In this study, we explored the impact of oat grain dietary supplementation on growth performance, intestinal microbiota, short-chain fatty acids (SCFAs), and fatty acids (FAs) in Hu sheep. Thirty-two Hu lambs were randomly assigned to a control group (RC) or an oat grain-supplemented group (RO). After 90 days on their respective diets, rumen digesta were collected from six randomly selected Hu lambs per group to assess microbial diversity, SCFAs, and FAs. The RO diet significantly enhanced growth in Hu sheep (p < 0.01) and increased α-diversity, as indicated by Chao1 and Shannon indices. Core phyla in both groups were Firmicutes and Bacteroidota, with predominant genera including Prevotella, Rikenellaceae_RC9_gut_group, and F082. Oat grain supplementation led to significant shifts in microbial composition, increasing the abundance of Acidobacteriota, Proteobacteria, Chloroflexi, Actinobacteriota, and Subgroup_2, while decreasing Bacteroidota and Oscillospiraceae (p < 0.05). The RO group also exhibited lower levels of isobutyric and citraconic acids but higher levels of azelaic acid (p < 0.05). These results indicate that oat grain supplementation enhances beneficial rumen microbes and optimizes FAs and SCFAs composition, thereby promoting weight gain in Hu sheep.
1 Introduction
The rising demand for mutton has spurred research focused on enhancing the growth performance, meat quality, and nutritional value of mutton sheep. In recent years, China’s livestock industry has shifted from traditional free grazing to large-scale, intensive breeding. This shift has significantly improved production efficiency and product quality while reducing costs and environmental impact. Concentrate feeds are a pivotal nutrient source in intensive mutton breeding, relying on high-calorie grains like corn. However, corn protein has an imbalanced amino acid profile, particularly low in lysine (Liu et al., 2020). Lysine, the first-limiting amino acid for sheep, is crucial for development and immune function. This deficiency hampers protein synthesis, fails to meet essential amino acid needs, and must be supplemented by other dietary components, reducing feed conversion and affecting yield and meat quality. Oat grain, with a superior amino acid profile and higher lysine content than other cereals (Nieto-Nieto et al., 2014), has shown high yield, palatability, and nutrient richness as livestock feed (Andrzejewska et al., 2019). It positively affects ruminant performance, meat quality (Salgado et al., 2013; Schulmeister et al., 2020), and gastrointestinal health (An et al., 2020). Due to its high nutritional value, low cost, and ease of storage, oat grain has gained attention as a feedstuff. Rich in protein, fiber, and nutrients, especially β-glucan with immunomodulatory functions, oat can reduce colonic inflammation, enhance barrier function, and elevate intestinal SCFAs levels (Cheng et al., 2021). Oat also exhibits probiotic properties, stimulating beneficial gut bacteria growth, particularly Lactobacillus, and Bacteroidetes, increasing SCFAs (Metzler-Zebeli et al., 2011; Murphy et al., 2012), supporting healthy gut microbiota (Tosh and Bordenave, 2020). Furthermore, oats contain bioactive compounds like polyphenols and antioxidants, benefiting gut health. Flavonoids in oats can modulate microbial population, increasing Akkermansia, which has antihyperlipidaemic effects (Duan et al., 2021). Oats improve lipid metabolism and balance gut microflora, significantly boosting SCFAs, including butyric acid, in the colon (Wang et al., 2022). Dietary fiber and phytonutrients in oats can increase milk production in dairy cows while reducing CH4 emissions (Ramin et al., 2021).
Currently, the impact of oat grain on sheep gut microbiota, particularly in regulating microbiota diversity and function, remains poorly understood. Oat grain processing generates significant residues, often seen as having limited economic value. In this experiment, we used this portion of unsalable oat grain. These oat grains include small and broken grains, which are usually unsalable in the market due to their uneven texture. Although these parts may not meet consumer preferences in appearance, they still have good quality in terms of nutritional content. To optimize resource utilization, minimize waste, and enhance agricultural sustainability, unsalable oat grains were used to substitute for corn in concentrate feed. This study aimed to investigate the effects of an oat grain-based diet on growth performance, intestinal microbiota, FAs, and SCFAs in Hu sheep, focusing on microbiota composition changes. Understanding how oat grains influence Hu sheep gut microbiota can provide insights into dietary strategies promoting gut health and productivity in sheep farming.
2 Materials and methods
2.1 Animals, diets, and experimental design
Thirty-two Hu sheep with similar nutritional status (average body weight of 27.28 ± 0.83 kg, approximately 120 days old) were selected and divided into two groups. The control group (RC) received corn grain as the primary concentrate feed. The experimental group (RO) was fed a mixed concentrate diet with oat grain, maintaining a ratio of 35:65 (DM basis). In the RO group, unsalable oat grain partially replaced maize, resulting in an oat grain content of 35% (DM basis). The nutrient composition of the diets is detailed in Table 1. Throughout the experiment, sheep had ad libitum to roughage and water. And they were raised under the same environmental conditions. During the experiment, both groups of sheep were kept under the same temperature and humidity conditions to ensure consistency in the experimental conditions. The study spanned 100 days, comprising a 10-day adaptation period followed by a 90-day experimental phase. After the end of the experiment, six Hu lambs from each group were randomly selected for slaughter. The experimental protocol was approved by the professional committee of the Academy of Agricultural and Animal Husbandry Sciences of Inner Mongolia Autonomous Region and the Animal Welfare Association (No. IMAAAHS-2023-21).
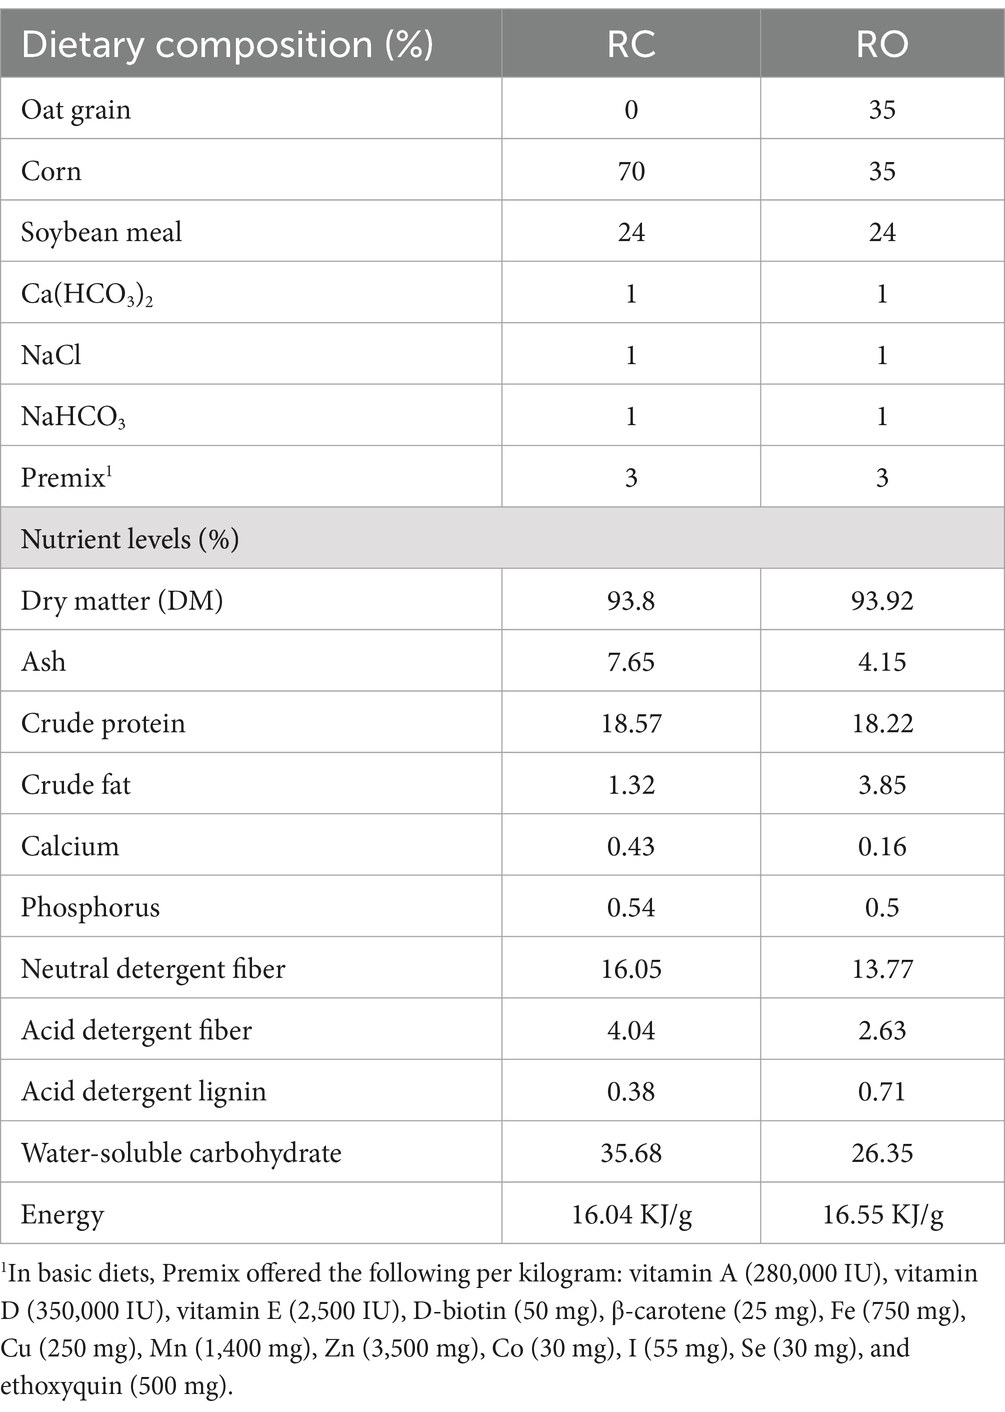
Table 1. The dietary nutrition levels of RC and RO groups.
2.2 Growth performance measurement
Each lamb was weighed every 30 days before morning feeding to calculate the average daily gain (ADG). Throughout the experiment, both the feed offered and any surplus feed were precisely weighed and recorded daily to estimate the average daily feed intake (ADFI).
2.3 Sample collection
Prior to slaughter, veterinary examinations confirmed the lamb’s good health. Post-slaughter, rumen contents were collected consistently from all lambs, ensuring uniform sampling locations. To minimize contamination, samples were handled aseptically whenever possible. Rumen contents were placed in 50 ml aseptic, enzyme-free centrifuge tubes for subsequent analysis of the gut microbiota, SCFAs, and FAs composition. Samples from both the RC group (RC1-RC6) and the RO group (RO1-RO6) were immediately frozen in liquid nitrogen and stored at −80°C.
2.4 Extraction of microbiota DNA
The hexadecyl trimethyl ammonium bromide (CTAB) method was used to extract total microbial DNA from the samples. The concentration and purity of the extracted DNA were assessed using electrophoresis on 1% agarose gels. The DNA was then diluted to a concentration of 1 ng/μl with sterile water.
2.5 Amplicon generation and 16S rRNA gene sequencing
Specific regions of the 16S rRNA genes, including 16S V4, 16S V3, 16S V3-V4, and 16S V4-V5, were amplified using designated primers (16S V4, 515F-806R) with barcodes. Each PCR reaction included 15 μl of Phusion® High-Fidelity PCR Master Mix (New England Biolabs), 0.2 μM of each primer, and 10 ng of target DNA. The PCR involved 30 cycles of denaturation at 98°C for 10 s, annealing at 50°C for 30 s, and extension at 72°C for 30 s, followed by a final extension at 72°C for 5 min. For DNA detection, an equal volume of 1 × loading buffer (containing SYB green) was combined with the PCR products and subjected to electrophoresis on a 2% agarose gel. The PCR products were then mixed in equal proportions and purified using a Qiagen Gel Extraction Kit (Qiagen, Germany). Libraries for sequencing were constructed with NEBNext® Ultra™ IIDNA Library Prep Kit (Cat No. E7645). Library quality was assessed using the Qubit@2.0 Fluorometer (Thermo Scientific) and Agilent Bioanalyzer 2100 system. Sequencing was performed on the Illumina NovaSeq platform, generating 250 bp paired-end reads.
2.6 Bioinformatics and statistical analysis
Paired-end reads were assigned to samples based on their unique barcodes and truncated to remove the barcodes and primer sequences. Reads were merged using FLASH (Version 1.2.11), and splicing sequences were termed Raw Tags. Fastp (Version 0.20.0) ensured high-quality data and clean tags were aligned against the Silva database via Vsearch (Version 2.15.0) to identify and remove chimeric sequences, yielding effective tags. We conducted α-diversity analysis on normalized amplicon sequence variants (ASVs) using five indices (observed ASVs, Chao1, Simpson, Shannon, and Good’s coverage) in QIIME2 to evaluate species diversity complexity. Also, β-diversity analysis involved calculating unweighted unifrac distances in QIIME2. Principal coordinate analysis (PCoA) was performed using the ade4 and ggplot2 packages in R (version 2.15.3) to reduce dimensionality. A T-test analysis in Version 3.5.3 identifies species with significant differences at each taxonomic level (Phylum, Class, Order, Family, Genus). LEfSe analysis, using LEfSe software (Version 1.0) with an LDA score threshold of 4, identified potential biomarkers. Tax4Fun software was used for function annotation analysis. Spearman correlation analysis in R (Version 2.15.3) was conducted using the psych and pheatmap packages. SPSS software (IBM SPSS 26.0) analyzed growth performance and FAs data, with significance reported at p < 0.05. T-tests assessed significant differences.
2.7 Determination of fatty acids
Rumen content samples were thawed on ice to minimize degradation. A 20 μl of rumen content samples were added to a 96-well plate and transferred to the Eppendorf epMotion Workstation. Then, 120 μl of ice-cold methanol containing internal standards was automatically added to each sample and vortexed for 5 min. The plate was centrifuged at 4,000 g for 30 min. After centrifugation, 30 μl of supernatant was transferred to a clean 96-well plate, and 20 μl of freshly prepared derivatization reagent was added to each well. Derivatization was performed at 30°C for 60 min. Following this, 330 μl of ice-cold 50% methanol solution was added to dilute the samples. The plate was stored at −20°C for 20 min and then centrifuged at 4,000 g for 30 min at 4°C. Finally, 135 μl of supernatant was transferred to a new 96-well plate, ensuring each well contained 10 μl of internal standard. Serial dilutions of derivatized stock standards were added to the left wells. The plate was sealed for LC–MS analysis.
An ultra-performance liquid chromatography coupled to tandem mass spectrometry (UPLC-MS/MS) system (ACQUITY UPLC-Xevo TQ-S, Waters Corp., Milford, MA, USA) was utilized to quantitate all targeted metabolites in Novogene Co., Ltd. (Beijing, China). Samples were injected onto an ACQUITY UPLC BEH C18 1.7 μM VanGuard pre-column (2.1 × 5 mm) and an ACQUITY UPLC BEH C18 1.7 μM analytical column (2.1 × 100 mm) using an 18-min linear gradient at a flow rate of 0.4 ml/min for the positive/negative polarity mode. The mobile phases consisted of eluent A (0.1% Formic acid in water) and eluent B (acetonitrile: IPA = 70:30). The gradient program was as follows: 0–1 min (5% B), 1-11 min (5–78% B), 11–13.5 min (78–95% B), 13.5–14 min (95–100% B), 14–16 min (100% B), 16–16.1 min (100–5% B), and 16.1–18 min (5% B). The Xevo TQ-S mass spectrometer was operated in positive (negative) polarity mode with the following settings: capillary voltage of 1.5 (2.0) KV, source temperature of 150°C, desolvation temperature of 550°C, and desolvation gas flow of 1,000 L/Hr.
The detection of the experimental samples via MRM (Multiple Reaction Monitoring) was based on the novogene self-built method. The Q1, Q3, RT (retention time), DP (declustering potential), and CE (collision energy) were used for the metabolite identification. The ratio of the Q3 peak area of the compound to that of the internal standard was brought into the standard curve. The concentration of the compound was calculated from the known internal standard concentration. The data files generated by UPLC-MS/MS were processed using the MassLynx Version 4.1 for peak integration and correction.
2.8 Determination of short-chain fatty acids
The rumen content samples were thawed on ice, and 200 μl was pipetted into 2 ml glass centrifuge tubes. Subsequently, 900 μl of 0.5% phosphoric acid was added, and the mixture was shaken and vortexed for 2 min. The tubes were centrifuged at 14,000 g for 10 min. Afterward, 800 μl of the supernatant was transferred to a new tube, and an equal volume of ethyl acetate was added. This mixture was again shaken and centrifuged at 14,000 g for 10 min. Then, 600 μl of the resulting supernatant was collected, and 4-methylpentanoic acid was added to achieve a final concentration of 500 μM as an internal standard. The solution was mixed and transferred to a sample vial for Gas chromatography–mass spectrometry (GC–MS) analysis. The injection volume was set at 1 μl with a split ratio of 10:1. Standard substances of acetic acid, propionic acid, butyric acid, isobutyric acid, valeric acid, isovaleric acid, and hexanoic acid were prepared with concentration gradients ranging from 0.1 to 100 μg/ml in ethyl acetate. Specifically, the concentrations were set at 0.1, 0.5, 1, 5, 10, 20, 50, and 100 μg/ml. A volume of 600 μl of each standard solution was combined with 25 μl of 4-methylpentanoic acid as the internal standard. The mixture was then transferred into a sample vial for subsequent analysis by GC–MS.
The samples were separated on an Agilent DB-WAX capillary column (30 m × 0.25 mm ID × 0.25 μm) within a GC system. The heating process started at 90°C and increased to 120°C at a rate of 10°C/min. Subsequently, the temperature rose to 150°C at 5°C/min. Finally, it escalated to 250°C at 25°C/min and remained for 2 min. The carrier gas (helium) flow rate was 1.0 ml/min. Quality control (QC) samples were interspersed within the sample queue at regular intervals to ensure system stability and repeatability. Mass spectrometry analysis was performed using the Agilent 7890A/5975C GC–MS system.
3 Results
3.1 Growth performance
The initial body weights of Hu sheep were not significantly different between the RC and RO groups. However, the RO group exhibited higher final body weights compared to the RC group. The average final weight of Hu sheep in the RC group was 38.83 kg, whereas that in the RO group was 42.97 kg, making a 10.66% increase over the control group (p < 0.001). Additionally, the average daily gain (ADG) was greater in the RO group (0.2 kg/d) compared to the RC group (0.14 kg/d; p < 0.001). Although the average daily feed intake (ADFI) of Hu sheep in the RO group tended to be higher than in the RC group, this difference was not statistically significant (p > 0.05; Figure 1A).
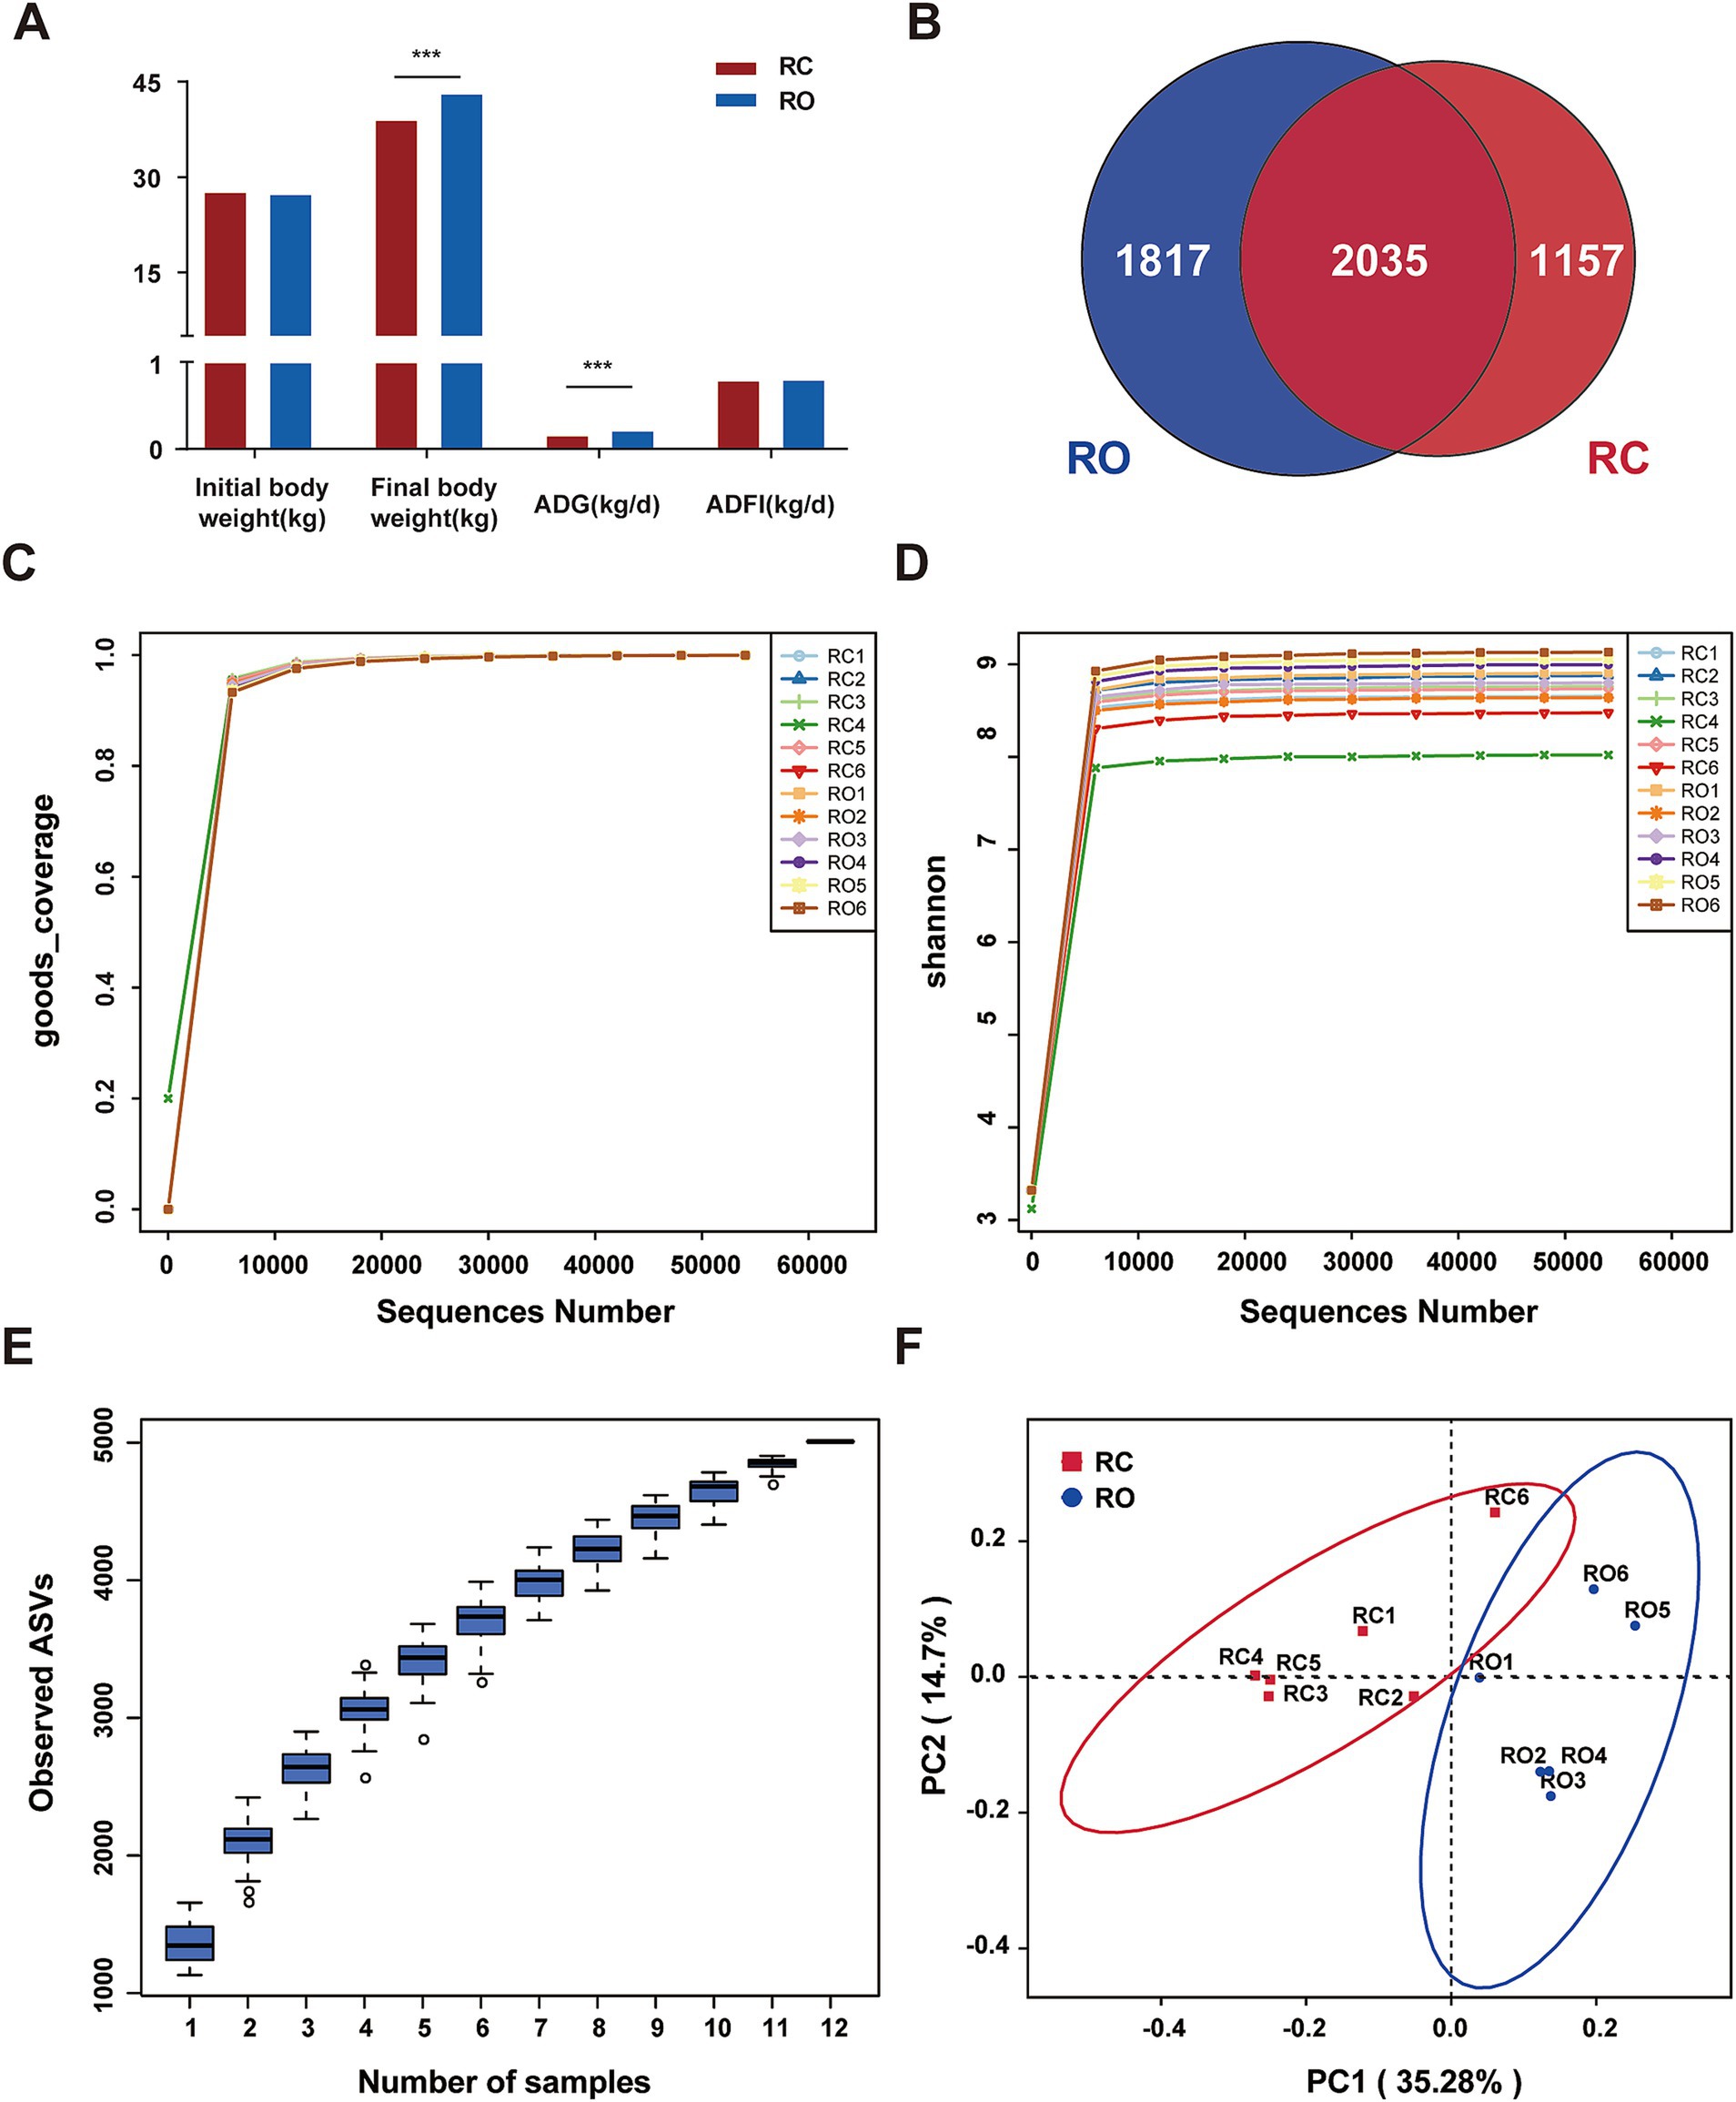
Figure 1. (A) Effects of oat grain diet supplementation on growth performance of Hu sheep. DNA sequence data analysis, (B) Venn diagram, the numbers in the figure show the unique or shared ASVs of each group; (C) It shows the sequencing depth of the RC and RO groups; (D) Rarefaction of the different samples; (E) The species accumulation curves of each group of samples; (F) Differences in Principal Coordinate Analysis (PCoA) of intestinal microbiome RC and RO groups. The red dots represent the samples of the RC group and the blue dots represent the samples of the RO group. The distance between the two points represents the difference in the intestinal microbiota.
3.2 DNA sequences analysis
In this study, 16S rRNA gene sequencing was conducted on 12 Hu sheep samples, generating a total of 964,519 sequences. After chimera checks and filtering, we obtained 776,482 high-quality sequences across all samples, averaging 64,706 sequences per sample. Additional details are provided in Supplementary Table S1. Taxonomic assignment revealed 5,009 ASVs at 100% nucleotide sequence similarity. Specifically, the RC and RO groups produced 3,192 and 3,852 ASVs, respectively (Figure 1B). Notably, all samples in both groups exhibited Good’s Coverage index values of 1 (Figure 1C). The rarefaction curves stabilized when the number of effective sequences exceeded 5,000, indicating adequate sequencing depth and quantity (Figure 1D). Furthermore, the species accumulation curves for each sample group displayed a relatively flat trend at the extremity, suggesting an adequate sample size (Figure 1E). These findings collectively validate the comprehensiveness and representativeness of our sequencing data.
3.3 Microbial diversity index analysis
To evaluate the α-diversity of the microbial community, we used the Chao1, Shannon, and Simpson indices to assess species richness and community diversity. The average Chao1 and Shannon indices for the RC group were 1,257.09 and 8.59, respectively, while the RO group showed significantly higher values at 1476.63 and 8.92 (p < 0.05, Table 2). Specifically, both indices were markedly higher in the RO group compared to the RC group. Although the Simpson index averaged 0.991 in the RC group and 0.994 in the RO group, this difference was not statistically significant. Additional details are provided in Supplementary Table S2. The PCoA (Figure 1F), based on unweighted Unifrac distances, reflected the species composition and relative abundances of ASVs in the samples. A clear separation between the RC and RO groups was observed, suggesting that incorporating oat grain into the diet led to a significant divergence in the structure of the gut microbiota.
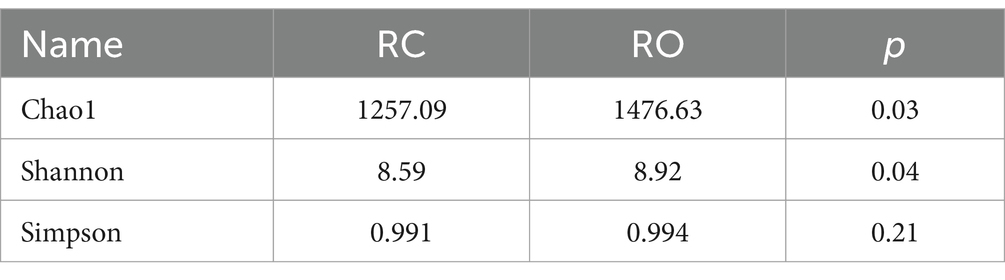
Table 2. The alpha diversity index between the RC and RO groups.
3.4 Bacterial community composition at different taxonomical levels
We quantified the relative proportions of predominant taxa at both the phylum and genus levels based on the distribution of microbial taxa in different groups. As shown in Figure 2, the top 10 phyla were Bacteroidota, Firmicutes, Acidobacteriota, Proteobacteria, Fibrobacterota, Siprochaetota, Chloroflexi, Patescibacteria, Actinobacteriota, and Euryarchaeota. Notably, Bacteroidota were the most abundant phylum across all samples, with Firmicutes being the second most abundant. In the RC group, Bacteroidota and Firmicutes accounted for 91.43% of the relative abundance, with Bacteroidota at 57.40% and Firmicutes at 34.03%. Similarly, these two phyla retained the highest relative abundance in the RO group, comprising 46.90% (Bacteroidota) and 33.76% (Firmicutes; Supplementary Table S3). Compared to the RC group, the RO group exhibited a significant increase in the abundance of Acidobacteriota, Proteobacteria, Chloroflexi, and Actinobacteriota (p < 0.05). The abundance of Patescibacteria increased, but the difference was not statistically significant (p = 0.287). In contrast, the abundance of Bacteroidota significantly decreased (p < 0.05), while the abundance of Siprochaetota also decreased, though not significantly (p = 0.25).
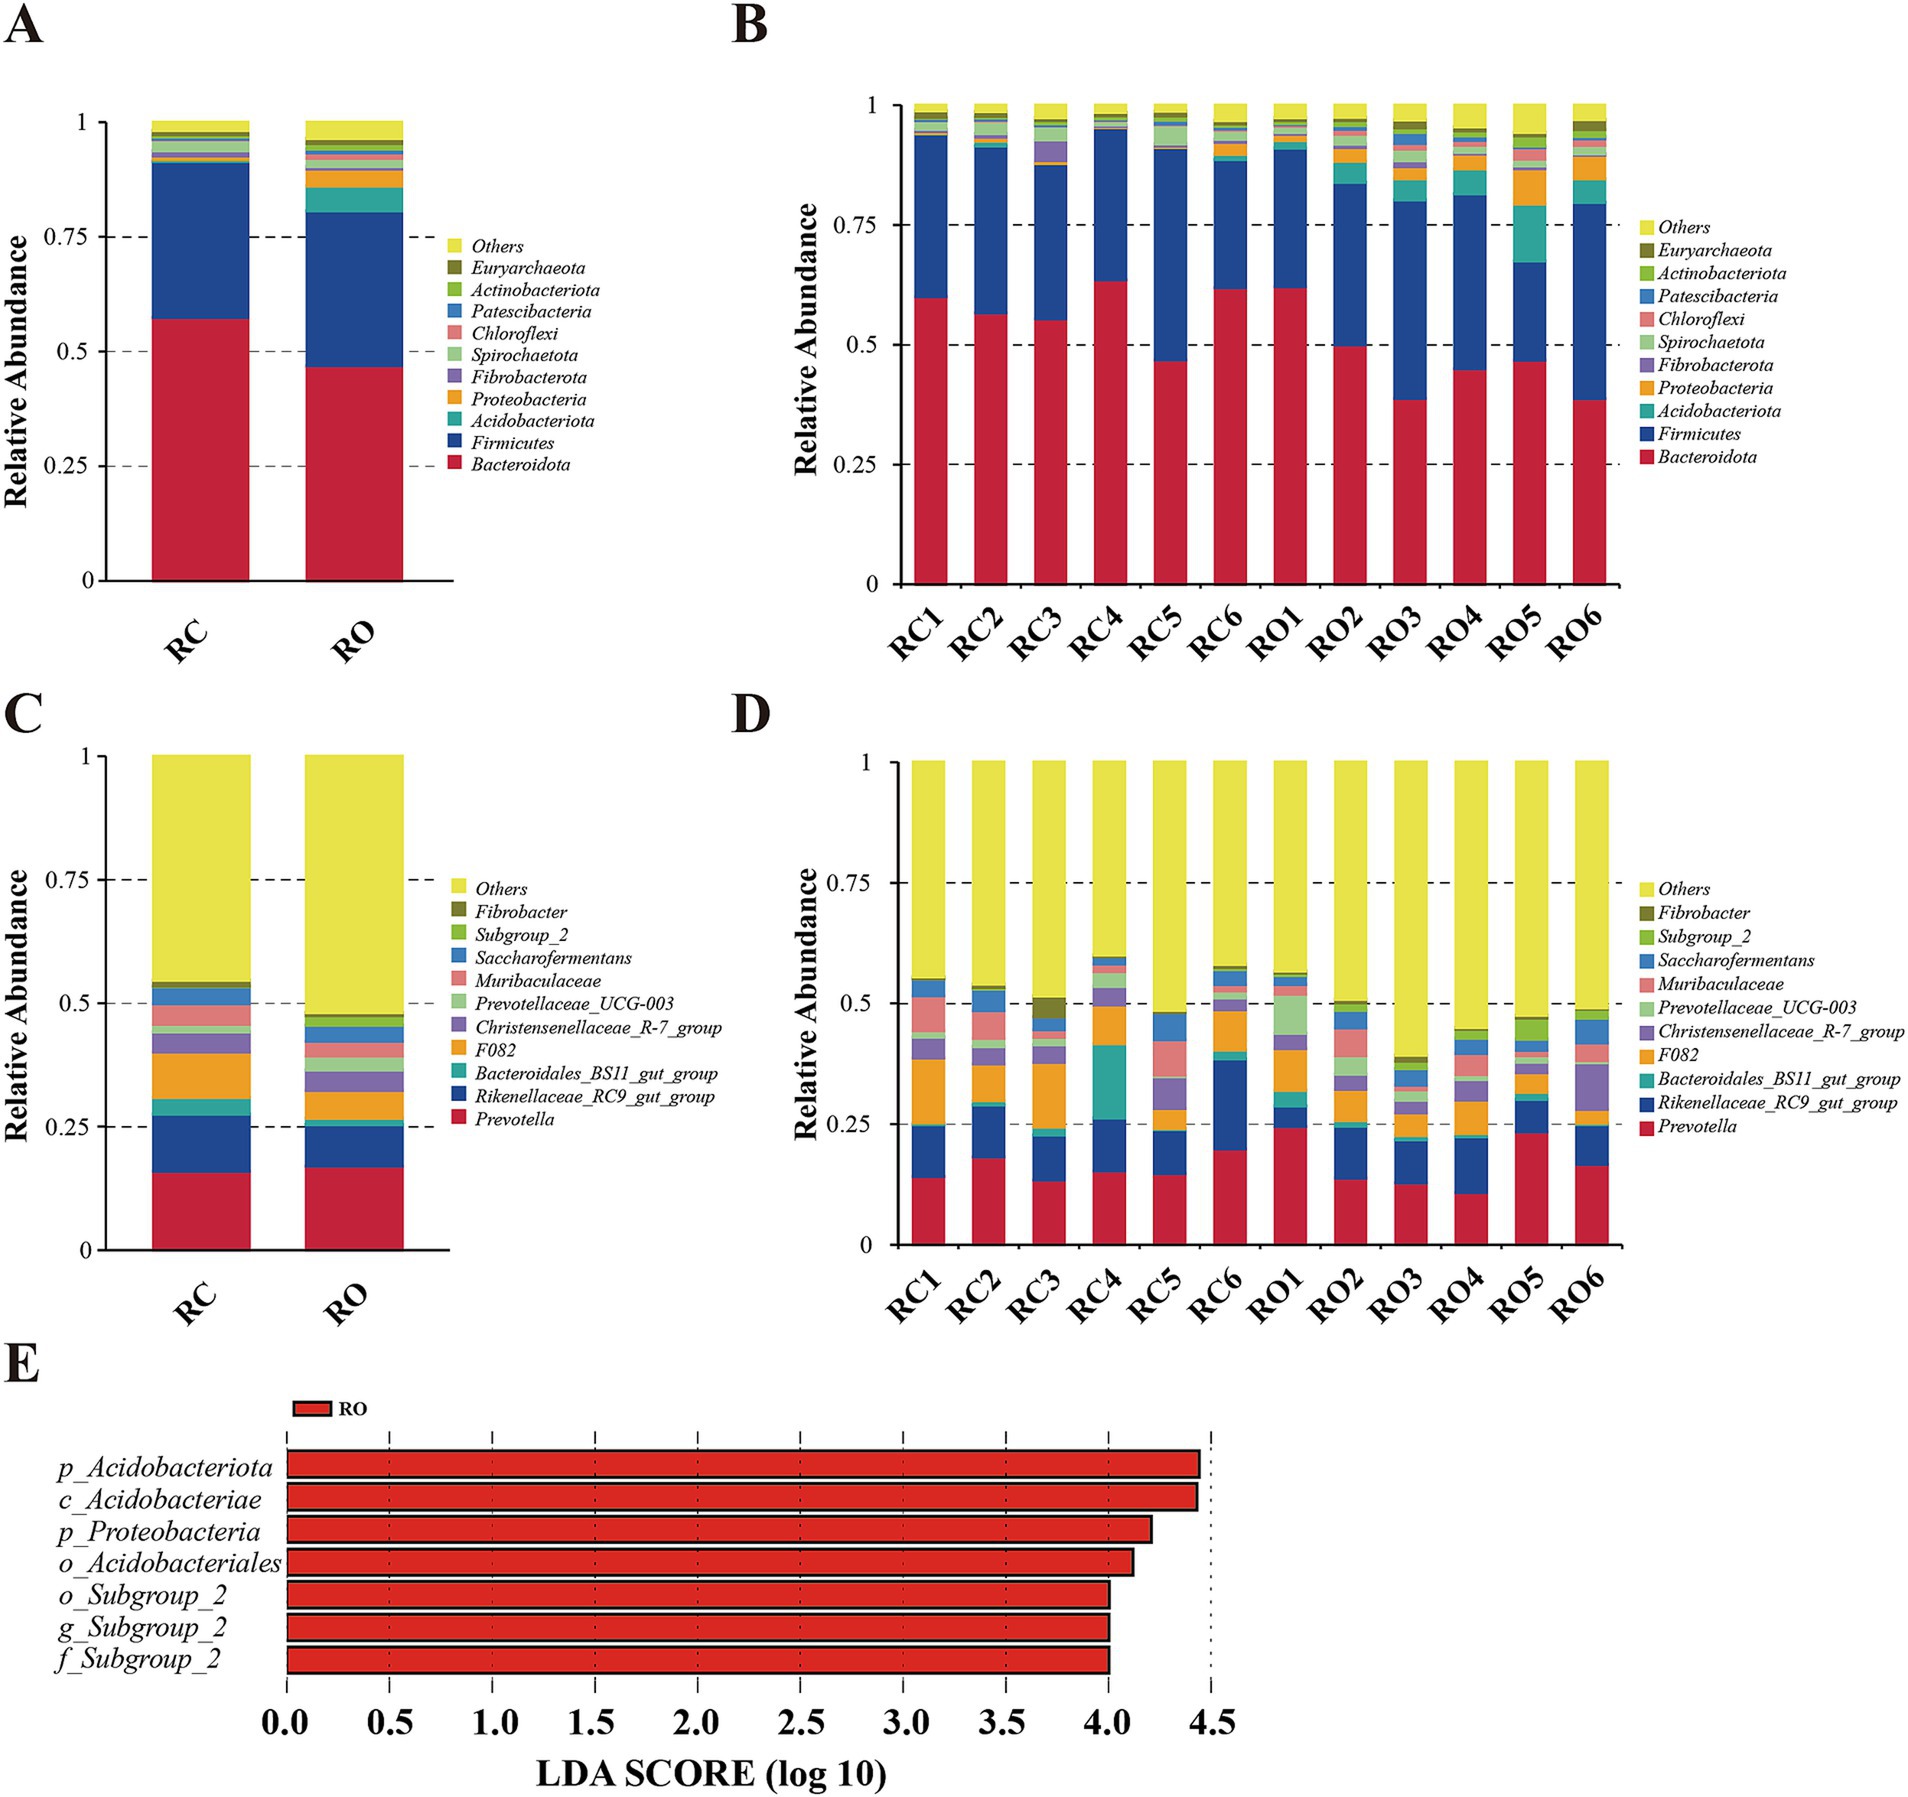
Figure 2. The taxonomic distribution between RC group and RO group samples (each color represents the relative abundance of a taxonomic bacterium). (A) at phylum level (top 10). (B) Between-group at the phylum level (top 10). (C) at genus level (top 10). (D) Between-group at the genus level (top 10). (E) A significant differentiation of bacterial tax between RC and RO groups was determined by LEfSe. LDA scores were calculated for bacterial tax that were differentially enriched between different groups.
At the genus level, the top 10 genera were Prevotella, Rikenellaceae_RC9_gut_group, Bacteroidales_BS11_gut_group, F082, Christensenellaceae_R-7_group, Prevotellaceae_UCG-003, Muribaculaceae, Saccharofermentans, Subgroup_2, and Fibrobacter. The core genera of the RC group included Prevotella (15.94%), Rikenellaceae_RC9_gut_group (11.61%), F082 (9.16%), Muribaculaceae (4.13%), Christensenellaceae_R-7_group (4.07%), Saccharofermentans (3.48%), and Bacteroidales_BS11_gut_group (3.41%). In the RO group, the genera with high relative abundance were Prevotella (16.99%), Rikenellaceae_RC9_gut_group (8.42%), F082 (5.61%), Christensenellaceae_R7_group (4.18%), and Saccharofermentans (3.26%; Supplementary Table S4). Compared to the RC group, the RO group exhibited a significant increase in the abundance of Subgroup_2 (p < 0.05). Although the abundances of Prevotella, Bacteroidales_BS11_gut_group, Christensenellaceae_R-7_group, and Prevotellaceae_UCG-003 also increased, these differences were not statistically significant. On the other hand, the abundance of Rikenelaceae_RC9_gut_group, F082, Muribaculaceae, Saccharofermentans, and Fibrobacter was reduced in the RO group, although the difference was not significant.
Differences between the RC and RO groups were examined using LEfSe analysis (LDA > 2) across all taxonomic levels. Seven significant differences were identified, with the RO group showing enrichment in two phyla (Acidobacteriota and Proteobacteria), one class (Acidobacteriae), two orders (Acidobacteriales and Subgroup_2), one family (Subgroup_2), and one genus (Subgroup_2).
3.5 Microbial function prediction
In this study, Tax4fun was used to predict and investigate the molecular functions of microbial communities in two sample sets. As shown in Figure 3A, 44 functional genes are associated with various biological pathways, including cellular processes, environmental processing, genetic processing, human diseases, metabolism, and organismal systems pathways. At the Kyoto Encyclopedia of Genes and Genomes (KEGG) level 2, we identified 44 functional genes across the RC and RO groups. These genes predominantly pertained to carbohydrate metabolism, replication and repair, translation, membrane transport, amino acid metabolism, and energy metabolism. Further analysis revealed that the gut microbiota in the RO group mainly focused on metabolic pathways such as cofactor and vitamin metabolism, terpenoid and polyketide metabolism, other amino acid metabolism, the endocrine system, lipid metabolism, and enzyme families. In contrast, intestinal microbes in the RC group primarily focused on nucleotide metabolism, replication and repair, transport and catabolism, drug resistance, and translation (Figures 3B,D).
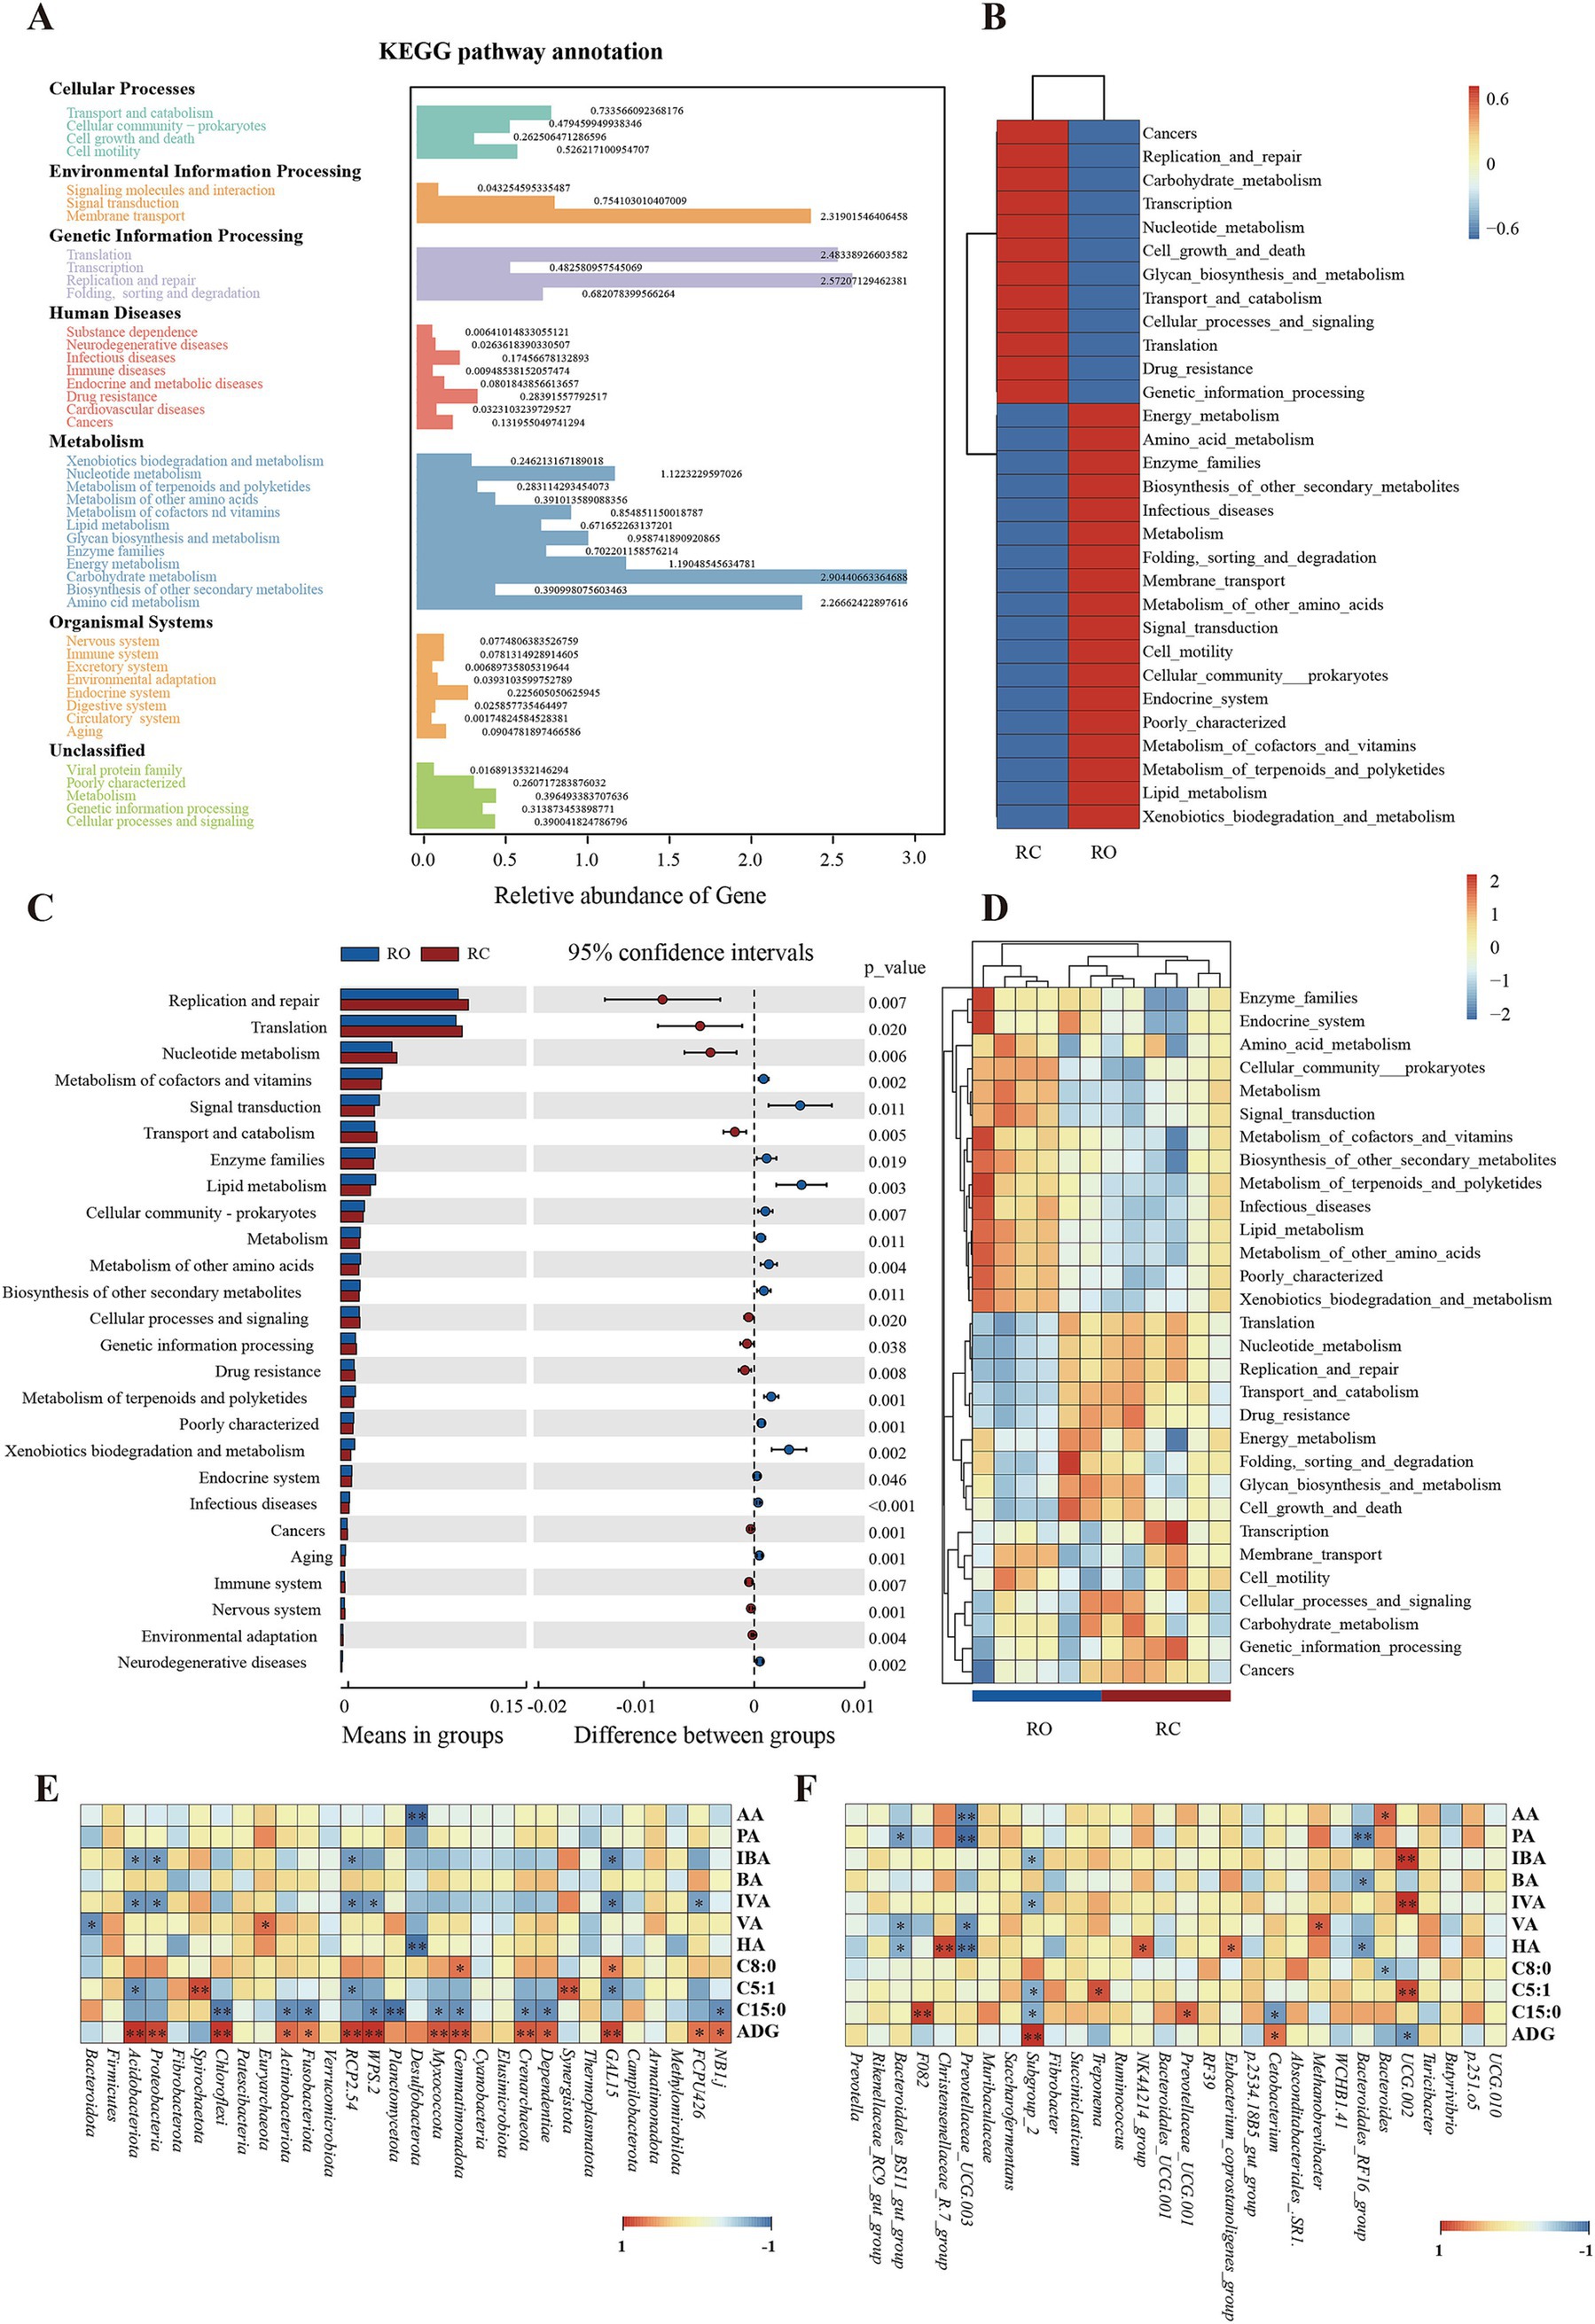
Figure 3. Genomic functional predictions. (A) KEGG pathway annotation. (B) Heatmap clustered based on functional predictions of the different groups in the level 2 pathway. (C) Comparison of RC and RO groups in differential metabolic pathways. (D) Heatmap clustered based on functional predictions of each sample in the level 2 KEGG pathway. The results of Spearman’s analysis show SCFAs FAs and ADG in the longitudinal direction and each bacterial information in the transverse direction. (E) at the phylum level. (F) at the genus level. The value corresponding to the intermediate heatmap is the Spearman correlation coefficient r, which is between −1 and 1, r < 0 is a negative correlation, r > 0 is a positive correlation, and marked * indicates significance test p < 0.05.
We identified significant changes in KEGG pathways in the gut microbiota between the two groups using the T-test. Specifically, the RO group exhibited a higher abundance of genes related to cofactor and vitamin metabolism, lipid metabolism, amino acid metabolism, terpenoids, and polyketide metabolism compared to the RC group (p < 0.05). However, the RO group had significantly fewer genes involved in replication and repair, cellular processes, and signaling (p < 0.05; Figure 3C).
3.6 Fatty acids composition
Table 3 details the impact of oat grain on the fatty acids composition in the rumen of Hu lambs. A total of 25 FAs were identified, including 24 saturated fatty acids (SFAs), 10 monounsaturated fatty acids (MUFAs), and one polyunsaturated fatty acids (PUFAs). The predominant FAs were azelaic acid (C9:0), oleic acid (C18:1), and caprylic acid (C8:0). The RO group showed lower levels of SFAs and MUFAs compared to the RC group, while the PUFAs content was higher, though the difference was not statistically significant. Among SFAs, azelaic acid (C9:0) was significantly different between the two groups (p < 0.05), with concentrations of 38.94 μmol/L in the RC group and 54.28 μmol/L in the RO group. Indicating a significantly higher level in the RO group. For MUFAs, citraconic acid (C5:1) showed a significant difference (p < 0.05), with concentrations of 0.02 μmol/L in the RC group and 0.01 μmol/L in the RO group, indicating a significantly lower level in the RO group. Additionally, pentadecanoic acid (C15:0) was significantly lower in the RO group compared to the RC group. Further details are provided in Supplementary Table S5.
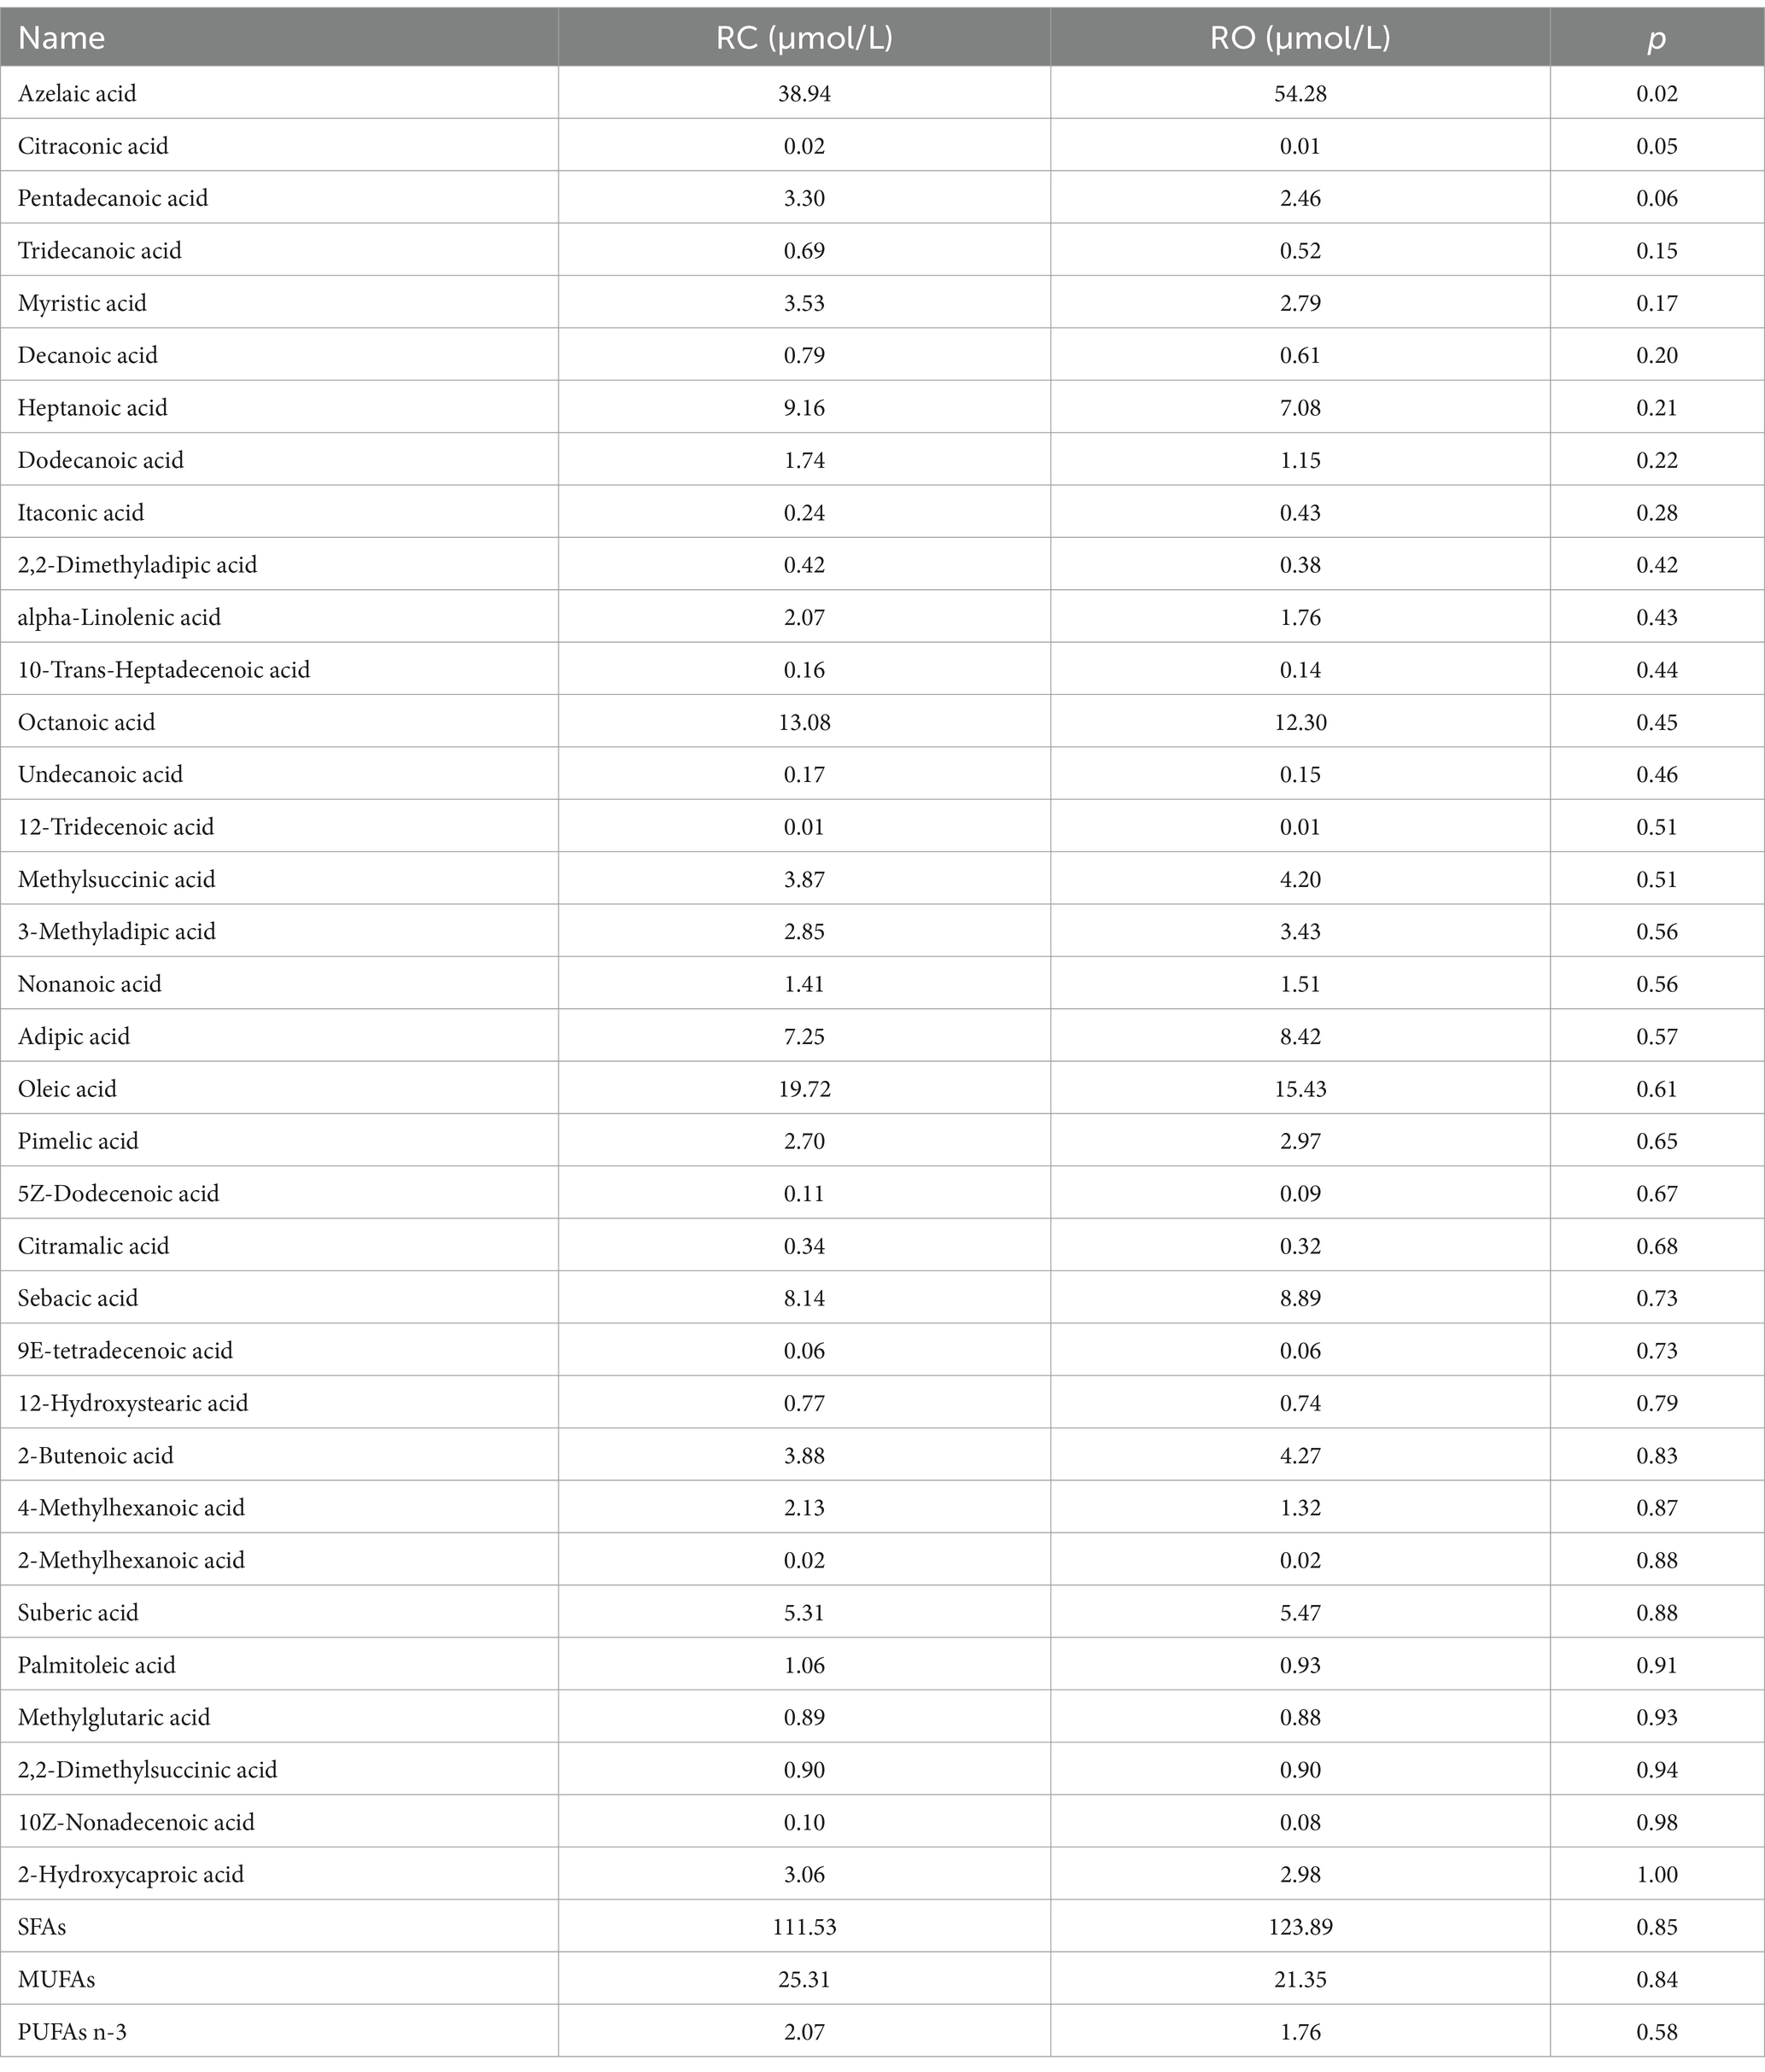
Table 3. Effects of oat grain diet supplementation on fatty acid contents in the rumen of Hu sheep.
3.7 Short-chain fatty acids composition
The concentration of isobutyric acid was significantly lower in the RO group (35.88 μg/ml) compared to the RC group (47.80 μg/ml; p < 0.05). In contrast, the levels of butyric acid and valeric acid were higher in the RO group, although the differences were not statistically significant (p > 0.05). Additionally, the levels of acetic acid, propionic acid, isovaleric acid, and hexanoic acid were lower in the RO group compared to the RC group, but these differences were not significant (Table 4). Further details are provided in Supplementary Table S5.
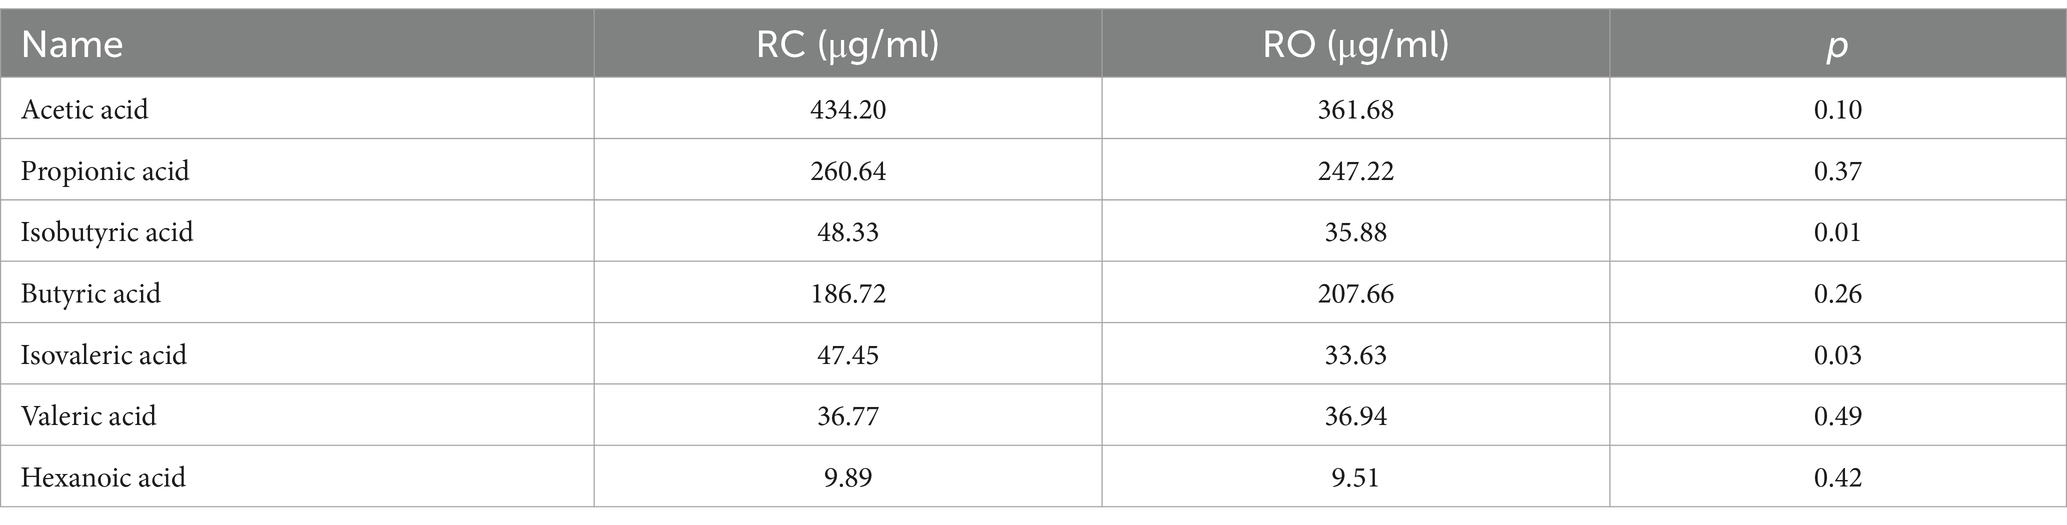
Table 4. Effects of oat grain diet supplementation on SCFAs contents in the rumen of Hu sheep.
3.8 Correlations between microbial communities, short-chain fatty acids, fatty acids, and average daily gain
Diets containing oat grain positively influenced growth performance, SCFAs, FAs metabolism, and the gut microbiota of lambs. We conducted a Spearman’s rank correlation analysis to investigate the microbiota potentially linked to SCFAs, FAs, and growth performance. At the phylum level (Figure 3E), Bacteroidota exhibited a negative correlation with valeric acid (p < 0.05).
Acidobacteriota and Proteobacteria were positively correlated with propionic, butyric, valeric, and hexanoic acids but negatively correlated with isobutyric and isovaleric acids (p < 0.05). Acidobacteriota also showed a negative correlation with C5:1 (p < 0.05). Euryarchaeota was positively associated with acetic, propionic, isobutyric, butyric, isovaleric, and hexanoic acids, and positively correlated with valeric acid (p < 0.05). Gemmatimonadota and GAL15 were positively correlated with C9:0 (p < 0.05). Spirochaetota and Synergistota showed the strongest positive correlation with C5:1 (p < 0.01). Acidobacteriota, Proteobacteria, and Chloroflexi had the strongest positive correlation with ADG (p < 0.01), while Actinobacteriota was also positively correlated with ADG (p < 0.05). At the genus level (Figure 3F), Bacteroidales_BS11_gut_group was negatively correlated with propionic, valeric, and hexanoic acids (p < 0.05), whereas Christensenellaceae_R.7_group was positively correlated with hexanoic acid (p < 0.01). Prevotellaceae_UCG.003 was negatively correlated with acetic, propionic, and hexanoic acids (p < 0.05) and had a highly significant negative correlation with valeric acid (p < 0.01). Bacteroides was negatively correlated with C9:0 (p < 0.05). Lastly, Subgroup_2 was negatively correlated with C5:1 and C15:0 (p < 0.05) and positively correlated with ADG (p < 0.01).
4 Discussion
The intestine functions as the largest immune organ in an organism, serving as the primary site for nutrient digestion, absorption, and secretion (Vighi et al., 2008). The intestinal microbiota plays a pivotal role in maintaining homeostasis and overall health by modulating nutrient digestion and enhancing immune function (Lynch and Hsiao, 2019). The intestinal microbiota plays a crucial role in the host’s physiological, metabolic, and immunological processes, significantly influencing health and performance (Elmhadi et al., 2022). In ruminants, the ruminal bacterial community composition changes with dietary intake (Song et al., 2019). Investigating microbial communities and ruminal characteristics is essential for managing animal health and performance. The rumen microbiota is a complex ecosystem including bacteria, archaea, fungi, and protozoa, which convert plant materials into nutrients accessible to ruminants (Fu et al., 2022). These microbes facilitate the efficient utilization of starch and other non-fiber carbohydrates from grains and forages, allowing ruminants to extract more energy from fibrous feeds than monogastric animals (Zebeli and Metzler-Zebeli, 2012; Zhang R. et al., 2021). SCFAs, primarily acetate, propionate, and butyrate, are the main end products of feed digestion by rumen microorganisms. SCFAs serve as the principal energy source for ruminants and substrates for glucose and fat synthesis, supplying up to 70–80% of a ruminant’s total energy needs (Zhang J. et al., 2017). Moreover, fatty acids (FAs) are vital for various biochemical processes, with almost all FAs precursors in ruminant products produced in the rumen. As feed enters the rumen, dry matter is broken down into small molecules like SCFAs and peptides. Microorganisms utilize these substances to synthesize FAs, which are transported via the bloodstream and deposited in animal tissues. Thus, regulating the rumen environment can optimize FAs hydrogenation, increasing FAs content in products. The rumen microbiota is crucial in regulating nutrition and maintaining a stable rumen environment. Disruption of this microbiota balance can significantly impact nutrient digestion and utilization, affecting overall health and performance. The rumen microbiota’s adaptability to dietary changes makes it an ideal model for examining diet impacts on ruminant performance (Sun et al., 2022). Previous studies have highlighted the significant impact of diet on intestinal microbiota composition (Sun et al., 2022). Consequently, the gut microbiota is a vital link in the complex relationship between diet and the host’s health.
In this study, the body weight of the RO group of Hu sheep with added oat grain is significantly higher than that of the RC group, which warrants further investigation. According to the data in Table 1, the dietary energy of the two groups is almost identical, ruling out the possibility that uneven energy supply caused the weight difference. However, the water-soluble carbohydrate content in the RC group was higher than that in the RO group. Generally, water-soluble carbohydrate is an important energy source for animal growth, but our experimental results indicate that the RO group of Hu sheep did not experience growth inhibition due to the reduced water-soluble carbohydrate content, instead, their weight significantly increased. This phenomenon may be related to the higher fat content in the RO group. Fat, as another important energy source, may to some extent compensate for the deficiency in carbohydrate content. Additionally, as shown in Figure 1A, the feed intake of both groups of Hu sheep was almost the same, but the body weight of the RO group was significantly higher than that of the control group. This further indicates that the RO group with added oat grain exhibits higher efficiency in feed conversion. In summary, although the RO group has lower carbohydrate content, its higher fat content, and better feed conversion rate may be key factors contributing to its weight gain.
We employed 16S rRNA gene sequencing to analyze the intestinal microbiota of Hu lambs following dietary supplementation with oat grain. Consistent with prior research, the predominant phyla in the RO and RC groups were Bacteroidota and Firmicutes, respectively (Ye et al., 2016; Zhang R. et al., 2017). These phyla are crucial components of the rumen microbiota and are known for SCFAs production, such as acetate (Magne et al., 2020; Yue et al., 2021). Our Spearman correlation analysis revealed a negative association between Bacteroidota and acetic, propionic, and butyric acids. The observed decrease in Bacteroidota following oat grain supplementation contributed to an increase in SCFAs, which act as signaling molecules regulating lipid metabolism. An elevated Firmicutes/Bacteroidota ratio is associated with increased body weight. The inclusion of oat grain resulted in a significant reduction in microbial abundance, particularly Bacteroides, leading to an elevated Firmicutes/Bacteroidota ratio and increased final body weight in the RO group. This finding aligns with existing literature indicating that Firmicutes are linked to obesity, whereas Bacteroidota is associated with leanness (Ley et al., 2006).
Spearman’s analysis further confirmed that oat grain supplementation promotes weight gain in Hu lambs, as evidenced by the negative correlation of Firmicutes and Bacteroidota with ADG. Oat grain reduced the levels of both Firmicutes and Bacteroidota while simultaneously increasing lamb’s weight. Firmicutes are particularly important for protein degradation, starch digestion, and SCFAs synthesis, which are crucial for cellulose breakdown in ruminants (Shin et al., 2019). Conversely, Bacteroidota is involved in carbohydrate fermentation, nitrogen utilization, and bile acid biotransformation, thereby maintaining gut homeostasis (Backhed et al., 2004; Hooper et al., 2001).
Previous research has demonstrated a negative correlation between Bacteroidota abundance and both body fat and weight (Ley et al., 2005; Turnbaugh et al., 2008), consistent with our findings. Oat grain supplementation decreased Bacteroidota abundance while increasing body weight. Additionally, oat grain increased the abundance of Acidobacteriota and Proteobacteria, which were positively correlated with ADG and negatively correlated with isobutyric acid. Acidobacteriota also showed a significant negative correlation with citraconic acid, an indicator of undigested protein. The RO group exhibited lower isobutyric acid levels, suggesting improved protein digestion.
Actinobacteriota plays a crucial role in maintaining intestinal homeostasis and organic matter degradation, enhancing immune defense (Binda et al., 2018). Bifidobacteria, a member of Actinobacteriota, improve polysaccharide breakdown and hinder cholesterol absorption (Pereira and Gibson, 2002; Sonnenburg et al., 2006), positively correlating with body weight (Collado et al., 2008; Kalliomaki et al., 2008; Schwiertz et al., 2010). Oat grain supplementation increased Actinobacteriota abundance, consistent with the observed weight gain in Hu sheep. Spearman analysis revealed a positive correlation between Actinobacteriota and ADG, indicating its role in enhancing growth. Actinobacteriota can produce SCFAs, such as butyric acid and valeric acids, which enhance nutrient digestion and absorption.
Changes in the abundance of Actinobacteriota led to increased concentrations of SCFAs, such as butyric and valeric acids (Rodrigues et al., 2012). In our study, Spearman analysis revealed a positive correlation between Actinobacteriota and butyric, valeric, and hexanoic acids, while a negative correlation was observed with citraconic acid and pentadecanoic acid. Butyric acid is known to enhance levels of reactive oxygen species and mitochondria in muscle, thereby inhibiting muscle atrophy (Ley et al., 2006). The inclusion of oat grain in the diet promoted an increase in Actinobacteriota in Hu sheep, which subsequently enhanced body weight and SCFAs concentrations, such as valeric acid butyrate. These SCFAs facilitate nutrient digestion and absorption, maintain intestinal health, and improve overall productivity in animals.
The Oscillospiraceae family, capable of producing SCFAs, decreased significantly in the RO group (Supplementary Table S6). This family is prevalent in both human and animal intestines and is linked to obesity, weight loss, and gallstones, with a positive correlation to lean body mass index(Goodrich et al., 2014). In our study, oat grain supplementation in Hu lambs reduced Oscillospiraceae abundance, leading to decreased SCFAs, including acetic acid, and consequently, weight gain. There was an increase in Prevotella in the RO group (Supplementary Table S4). Conversely, Prevotella increased in the RO group. Known for its ability to break down cellulose and xylan, Prevotella ferments sugars to produce propionate, aiding starch, cellulose, and protein digestion. It synergizes with other bacteria to enhance nutrient degradation, improving fiber digestion and absorption.
To understand metabolic pathway differences in the intestinal microbiota of Hu sheep after oat grain dietary supplementation, we performed functional predictions and recorded microbial abundance. The results showed a significantly higher number of genes associated with lipid and amino acid metabolism for the RO group than the RC group. Lipid metabolism is crucial as it supplies animals with large amounts of energy, and facilitates energy acquisition and nutrient utilization. Meanwhile, amino acid metabolism enhances the production of SCFAs, such as acetic acid, which provides energy to the host (Neis et al., 2015). The metabolic pathways enriched in the intestinal tract of Hu sheep after incorporating oat grain are essential for growth and development. Therefore, the RO group has a greater capacity for nutrient absorption and utilization compared to the RC group.
Our study observed a higher content of SFAs in the RO group, though the difference was not statistically significant. This suggests that oat grain may influence the gastrointestinal microbiota in Hu sheep, leading to increased SFAs deposition in the rumen, which is then transported and deposited in tissues, potentially improving meat quality. Notably, azelaic acid, a type of SFAs, was significantly higher in the RO group. Azelaic acid is known to enhance intestinal permeability and reduce inflammation by activating the ectopic olfactory receptor 544 and stimulating GLP-1 secretion (Wu et al., 2021). The RO group also showed lower MUFAs levels, such as oleic acid, compared to the control group. This could be due to oat grain inhibiting the activity of butyivibrio and others partially involved in PUFAs hydrogenation, thereby reducing MUFAs content (Bhattacharjee et al., 2020). Adding probiotics to the diet may further regulate gut flora, inhibit hydrogenating bacteria, increase SFAs content, and reduce MUFAs deposition.
5 Conclusion
In summary, incorporating oat grain into Hu lamb’s diet significantly enhances their body weight and enriches microbiota diversity, particularly increasing the abundance of Acidobacteriota, Proteobacteria, Chloroflexi, and Actinobacteriota. It also reduces isobutyric acid and citraconic acid levels while increasing azelaic acid. Additionally, oat grain supplementation decreases the abundance of Bacteroides and Oscillospiraceae. These alterations are closely related to the growth performance of Hu sheep. Overall, incorporating oat grain into the diet affects microbiota composition, SCFAs, and FAs, ultimately impacting lamb’s growth.
Data availability statement
The original contributions presented in the study are included in the article/Supplementary material, further inquiries can be directed to the corresponding authors.
Ethics statement
The animal study was approved by the Academy of Agricultural and Animal Husbandry Sciences of Inner Mongolia Autonomous Region and the Animal Welfare Association approved the experimental protocol (No. IMAAAHS-2023-21). The study was conducted in accordance with the local legislation and institutional requirements.
Author contributions
XR: Data curation, Formal analysis, Writing – original draft. LW: Conceptualization, Methodology, Writing – review & editing. CY: Writing – review & editing. JA: Formal analysis, Writing – review & editing. SF: Formal analysis, Investigation, Writing – review & editing. HS: Software, Writing – review & editing. MZ: Writing – review & editing. RT: Writing – review & editing. XB: Visualization, Writing – review & editing. JY: Visualization, Writing – review & editing. YL: Funding acquisition, Project administration, Writing – review & editing. JH: Project administration, Supervision, Writing – review & editing.
Funding
The author(s) declare that financial support was received for the research, authorship, and/or publication of this article. This work was supported by Erdos Major Project of Science and Technology (ZD20232314), Inner Mongolia Autonomous Region Mutton Sheep Modern Agriculture and Animal Husbandry Industry Technology System, National Technical System of Mutton Sheep Production (CARS-38), National Natural Science Foundation of Inner Mongolia (2023QN03019), Inner Mongolia Autonomous Region Science and Technology Plan Project (2021GG0030), Scientific Research Funding Project for Introduced High-level Talents of Inner Mongolia Autonomous Region, Technological Project of Inner Mongolia Autonomous Region “the Open Competition Mechanism to Select the Best Candidates” (2022JBGS0012 and 2022JBGS0024), and Joint Breeding Research Project of Inner Mongolia Autonomous Region (YZ2023011).
Acknowledgments
We thank Bin Liu for his help in visualization.
Conflict of interest
The authors declare that the research was conducted in the absence of any commercial or financial relationships that could be construed as a potential conflict of interest.
Generative AI statement
The author(s) declare that no Generative AI was used in the creation of this manuscript.
Publisher’s note
All claims expressed in this article are solely those of the authors and do not necessarily represent those of their affiliated organizations, or those of the publisher, the editors and the reviewers. Any product that may be evaluated in this article, or claim that may be made by its manufacturer, is not guaranteed or endorsed by the publisher.
Supplementary material
The Supplementary material for this article can be found online at: https://www.frontiersin.org/articles/10.3389/fmicb.2025.1528298/full#supplementary-material
References
An, X., Zhang, L., Luo, J., Zhao, S., and Jiao, T. (2020). Effects of oat hay content in diets on nutrient metabolism and the rumen microflora in sheep. Animals 10:2341. doi: 10.3390/ani10122341
Andrzejewska, J., Govea, F. E. C., Pastuszka, A., Kotwica, K., and Albrecht, K. A. (2019). Performance of oat (Avena sativa L.) sown in late summer for autumn forage production in central europe. Grass Forage Sci. 74, 97–103. doi: 10.1111/gfs.12400
Backhed, F., Ding, H., Wang, T., Hooper, L. V., Koh, G. Y., Nagy, A., et al. (2004). The gut microbiota as an environmental factor that regulates fat storage. Proc. Natl. Acad. Sci. USA 101, 15718–15723. doi: 10.1073/pnas.0407076101
Bhattacharjee, B., Pal, P. K., Chattopadhyay, A., and Bandyopadhyay, D. (2020). Oleic acid protects against cadmium induced cardiac and hepatic tissue injury in male wistar rats: a mechanistic study. Life Sci. 244:117324. doi: 10.1016/j.lfs.2020.117324
Binda, C., Lopetuso, L. R., Rizzatti, G., Gibiino, G., Cennamo, V., and Gasbarrini, A. (2018). Actinobacteria: a relevant minority for the maintenance of gut homeostasis. Dig. Liver Dis. 50, 421–428. doi: 10.1016/j.dld.2018.02.012
Cheng, W. Y., Lam, K. L., Li, X., Kong, A. P., and Cheung, P. C. (2021). Circadian disruption-induced metabolic syndrome in mice is ameliorated by oat beta-glucan mediated by gut microbiota. Carbohydr. Polym. 267:118216. doi: 10.1016/j.carbpol.2021.118216
Collado, M. C., Isolauri, E., Laitinen, K., and Salminen, S. (2008). Distinct composition of gut microbiota during pregnancy in overweight and normal-weight women. Am. J. Clin. Nutr. 88, 894–899. doi: 10.1093/ajcn/88.4.894
Duan, R., Guan, X., Huang, K., Zhang, Y., Li, S., Xia, J., et al. (2021). Flavonoids from whole-grain oat alleviated high-fat diet-induced hyperlipidemia via regulating bile acid metabolism and gut microbiota in mice. J. Agric. Food Chem. 69, 7629–7640. doi: 10.1021/acs.jafc.1c01813
Elmhadi, M. E., Ali, D. K., Khogali, M. K., and Wang, H. (2022). Subacute ruminal acidosis in dairy herds: microbiological and nutritional causes, consequences, and prevention strategies. Anim. Nutr. 10, 148–155. doi: 10.1016/j.aninu.2021.12.008
Fu, Y., He, Y., Xiang, K., Zhao, C., He, Z., Qiu, M., et al. (2022). The role of rumen microbiota and its metabolites in subacute ruminal acidosis (sara)-induced inflammatory diseases of ruminants. Microorganisms. 10:1495. doi: 10.3390/microorganisms10081495
Goodrich, J. K., Waters, J. L., Poole, A. C., Sutter, J. L., Koren, O., Blekhman, R., et al. (2014). Human genetics shape the gut microbiome. Cell 159, 789–799. doi: 10.1016/j.cell.2014.09.053
Hooper, L. V., Wong, M. H., Thelin, A., Hansson, L., Falk, P. G., and Gordon, J. I. (2001). Molecular analysis of commensal host-microbial relationships in the intestine. Science 291, 881–884. doi: 10.1126/science.291.5505.881
Kalliomaki, M., Collado, M. C., Salminen, S., and Isolauri, E. (2008). Early differences in fecal microbiota composition in children may predict overweight. Am. J. Clin. Nutr. 87, 534–538. doi: 10.1093/ajcn/87.3.534
Ley, R. E., Backhed, F., Turnbaugh, P., Lozupone, C. A., Knight, R. D., and Gordon, J. I. (2005). Obesity alters gut microbial ecology. Proc. Natl. Acad. Sci. USA 102, 11070–11075. doi: 10.1073/pnas.0504978102
Ley, R. E., Turnbaugh, P. J., Klein, S., and Gordon, J. I. (2006). Microbial ecology: human gut microbes associated with obesity. Nature 444, 1022–1023. doi: 10.1038/4441022a
Liu, J., Fernie, A. R., and Yan, J. (2020). The past, present, and future of maize improvement: domestication, genomics, and functional genomic routes toward crop enhancement. Plant Commun. 1:100010. doi: 10.1016/j.xplc.2019.100010
Lynch, J. B., and Hsiao, E. Y. (2019). Microbiomes as sources of emergent host phenotypes. Science 365, 1405–1409. doi: 10.1126/science.aay0240
Magne, F., Gotteland, M., Gauthier, L., Zazueta, A., Pesoa, S., Navarrete, P., et al. (2020). The firmicutes/bacteroidetes ratio: a relevant marker of gut dysbiosis in obese patients? Nutrients 12:1474. doi: 10.3390/nu12051474
Metzler-Zebeli, B. U., Zijlstra, R. T., Mosenthin, R., and Ganzle, M. G. (2011). Dietary calcium phosphate content and oat beta-glucan influence gastrointestinal microbiota, butyrate-producing bacteria and butyrate fermentation in weaned pigs. FEMS Microbiol. Ecol. 75, 402–413. doi: 10.1111/j.1574-6941.2010.01017.x
Murphy, P., Bello, F. D., O'Doherty, J. V., Arendt, E. K., Sweeney, T., and Coffey, A. (2012). Effects of cereal beta-glucans and enzyme inclusion on the porcine gastrointestinal tract microbiota. Anaerobe 18, 557–565. doi: 10.1016/j.anaerobe.2012.09.005
Neis, E. P., Dejong, C. H., and Rensen, S. S. (2015). The role of microbial amino acid metabolism in host metabolism. Nutrients 7, 2930–2946. doi: 10.3390/nu7042930
Nieto-Nieto, T. V., Wang, Y. X., Ozimek, L., and Chen, L. (2014). Effects of partial hydrolysis on structure and gelling properties of oat globular proteins. Food Res. Int. 55, 418–425. doi: 10.1016/j.foodres.2013.11.038
Pereira, D. I., and Gibson, G. R. (2002). Effects of consumption of probiotics and prebiotics on serum lipid levels in humans. Crit. Rev. Biochem. Mol. Biol. 37, 259–281. doi: 10.1080/10409230290771519
Ramin, M., Fant, P., and Huhtanen, P. (2021). The effects of gradual replacement of barley with oats on enteric methane emissions, rumen fermentation, milk production, and energy utilization in dairy cows. J. Dairy Sci. 104, 5617–5630. doi: 10.3168/jds.2020-19644
Rodrigues, F. C., Castro, A. S., Rodrigues, V. C., Fernandes, S. A., Fontes, E. A., de Oliveira, T. T., et al. (2012). Yacon flour and Bifidobacterium longum modulate bone health in rats. J. Med. Food 15, 664–670. doi: 10.1089/jmf.2011.0296
Salgado, P., Thang, V. Q., Thu, T. V., Trach, N. X., Cuong, V. C., Lecomte, P., et al. (2013). Oats (Avena strigosa) as winter forage for dairy cows in Vietnam: an on-farm study. Trop. Anim. Health Prod. 45, 561–568. doi: 10.1007/s11250-012-0260-8
Schulmeister, T. M., Ruiz-Moreno, M., Garcia-Ascolani, M. E., Ciriaco, F. M., Henry, D. D., Benitez, J., et al. (2020). Apparent total tract digestibility, ruminal fermentation, and blood metabolites in beef steers fed green-chopped cool-season forages. J. Anim. Sci. 98:175. doi: 10.1093/jas/skaa175
Schwiertz, A., Taras, D., Schafer, K., Beijer, S., Bos, N. A., Donus, C., et al. (2010). Microbiota and scfa in lean and overweight healthy subjects. Obesity 18, 190–195. doi: 10.1038/oby.2009.167
Shin, D., Chang, S. Y., Bogere, P., Won, K., Choi, J. Y., Choi, Y. J., et al. (2019). Beneficial roles of probiotics on the modulation of gut microbiota and immune response in pigs. PLoS One 14:e0220843. doi: 10.1371/journal.pone.0220843
Song, Y., Malmuthuge, N., Li, F., and Guan, L. L. (2019). Colostrum feeding shapes the hindgut microbiota of dairy calves during the first 12 h of life. FEMS Microbiol. Ecol. 95:203. doi: 10.1093/femsec/fiy203
Sonnenburg, J. L., Chen, C. T., and Gordon, J. I. (2006). Genomic and metabolic studies of the impact of probiotics on a model gut symbiont and host. PLoS Biol. 4:e413. doi: 10.1371/journal.pbio.0040413
Sun, Y., Hou, T., Yu, Q., Zhang, C., Zhang, Y., and Xu, L. (2022). Mixed oats and alfalfa improved the antioxidant activity of mutton and the performance of goats by affecting intestinal microbiota. Front. Microbiol. 13:1056315. doi: 10.3389/fmicb.2022.1056315
Tosh, S. M., and Bordenave, N. (2020). Emerging science on benefits of whole grain oat and barley and their soluble dietary fibers for heart health, glycemic response, and gut microbiota. Nut. Rev. 78, 13–20. doi: 10.1093/nutrit/nuz085
Turnbaugh, P. J., Backhed, F., Fulton, L., and Gordon, J. I. (2008). Diet-induced obesity is linked to marked but reversible alterations in the mouse distal gut microbiome. Cell Host Microbe 3, 213–223. doi: 10.1016/j.chom.2008.02.015
Vighi, G., Marcucci, F., Sensi, L., Di Cara, G., and Frati, F. (2008). Allergy and the gastrointestinal system. Clin. Exp. Immunol. 153, 3–6. doi: 10.1111/j.1365-2249.2008.03713.x
Wang, Y., Qi, W., Guo, X., Song, G., Pang, S., Fang, W., et al. (2022). Effects of oats, tartary buckwheat, and foxtail millet supplementation on lipid metabolism, oxido-inflammatory responses, gut microbiota, and colonic scfa composition in high-fat diet fed rats. Nutrients 14:2760. doi: 10.3390/nu14132760
Wu, C., Jeong, M. Y., Kim, J. Y., Lee, G., Kim, J. S., Cheong, Y. E., et al. (2021). Activation of ectopic olfactory receptor 544 induces glp-1 secretion and regulates gut inflammation. Gut Microbes 13:1987782. doi: 10.1080/19490976.2021.1987782
Ye, H., Liu, J., Feng, P., Zhu, W., and Mao, S. (2016). Grain-rich diets altered the colonic fermentation and mucosa-associated bacterial communities and induced mucosal injuries in goats. Sci. Rep. 6:20329. doi: 10.1038/srep20329
Yue, Y., Wang, J., Wu, X., Zhang, J., Chen, Z., Kang, X., et al. (2021). The fate of anaerobic syntrophy in anaerobic digestion facing propionate and acetate accumulation. Waste Manag. 124, 128–135. doi: 10.1016/j.wasman.2021.01.038
Zebeli, Q., and Metzler-Zebeli, B. U. (2012). Interplay between rumen digestive disorders and diet-induced inflammation in dairy cattle. Res. Vet. Sci. 93, 1099–1108. doi: 10.1016/j.rvsc.2012.02.004
Zhang, R., Liu, J., Jiang, L., Wang, X., and Mao, S. (2021). The remodeling effects of high-concentrate diets on microbial composition and function in the hindgut of dairy cows. Front. Nutr. 8:809406. doi: 10.3389/fnut.2021.809406
Zhang, J., Shi, H., Wang, Y., Li, S., Cao, Z., Ji, S., et al. (2017). Effect of dietary forage to concentrate ratios on dynamic profile changes and interactions of ruminal microbiota and metabolites in Holstein heifers. Front. Microbiol. 8:2206. doi: 10.3389/fmicb.2017.02206
Zhang, R., Ye, H., Liu, J., and Mao, S. (2017). High-grain diets altered rumen fermentation and epithelial bacterial community and resulted in rumen epithelial injuries of goats. Appl. Microbiol. Biotechnol. 101, 6981–6992. doi: 10.1007/s00253-017-8427-x
Glossary
RC - Control group
RO - Oat-supplemented group
SCFAs - Short-chain fatty acids
FAs - Fatty acids
PUFAs - Polyunsaturated fatty acids
MUFAs - Monounsaturated fatty acids
DM - Dry matter
ADG - Average daily gain
ADFI - Average daily feed intake
CTAB - Hexadecyl trimethyl ammonium bromide
ASVs - Amplicon sequence variants
PCoA - Principal coordinate analysis
AA - Acetic acid
PA - Propionic acid
BA - Butyric acid
IBA - Isobutyric acid
VA - Valeric acid
IVA - Isovaleric acid
HA - Hexanoic acid
KEGG - Kyoto Encyclopedia of Genes and Genomes
C9:0 - Azelaic acid
C18:1 - Oleic acid
C8:0 - Caprylic acid
C5:1 - Citraconic acid
C15:0 - Pentadecanoic acid
Keywords: oat grain, Hu sheep, growth performance, intestinal microbiota, SCFAs, FAs
Citation: Ren X, Wang L, Yu C, An J, Fu S, Sun H, Zhao M, Te R, Bai X, Yuan J, Liu Y and He J (2025) Impact of oat grain supplementation on growth performance, rumen microbiota, and fatty acid profiles in Hu sheep. Front. Microbiol. 16:1528298. doi: 10.3389/fmicb.2025.1528298
Edited by:
Grzegorz Bełżecki, Polish Academy of Sciences, PolandReviewed by:
Shaobin Li, Gansu Agricultural University, ChinaYushan Jia, Inner Mongolia Agricultural University, China
Copyright © 2025 Ren, Wang, Yu, An, Fu, Sun, Zhao, Te, Bai, Yuan, Liu and He. This is an open-access article distributed under the terms of the Creative Commons Attribution License (CC BY). The use, distribution or reproduction in other forums is permitted, provided the original author(s) and the copyright owner(s) are credited and that the original publication in this journal is cited, in accordance with accepted academic practice. No use, distribution or reproduction is permitted which does not comply with these terms.
*Correspondence: Yongbin Liu, eWJsaXUxMTdAMTI2LmNvbQ==; Jiangfeng He, MTM3MDQ3ODEwMzJAMTYzLmNvbQ==
†These authors have contributed equally to this work and share first authorship