
95% of researchers rate our articles as excellent or good
Learn more about the work of our research integrity team to safeguard the quality of each article we publish.
Find out more
ORIGINAL RESEARCH article
Front. Microbiol. , 05 February 2025
Sec. Infectious Agents and Disease
Volume 16 - 2025 | https://doi.org/10.3389/fmicb.2025.1514388
This article is part of the Research Topic Diagnosis and Treatment Strategies of Tick-borne Diseases View all 8 articles
 Qian Zhang1,2
 Zhengyi Jiang1Nan Jiang1Luchen Shi1
 Jiaying Zhao1
 Jie Zhao1,3Ke Ouyang1,4Huaying Huang1,5
 Yaqin Zhang1
 Yan Dai1Nannan Hu1Ping Shi1Yaping Han1Ke Jin1*Jun Li1*
Background: Severe fever with thrombocytopenia syndrome (SFTS) is a newly emerging infectious disease. Given its rapid disease progression and high mortality rate, early warning is crucial in improving the outcomes, However, to date, relevant comprehensive predictors or an effective prediction model are still poorly explored.
Methods: A plasma proteomic profile was performed at early stages in patients with SFTS. Functional clustering analysis was used to select the candidate proteins and then validate their expression by ELISA. A cohort consisting of 190 patients with SFTS was used to develop the predictive model for severe illness and subsequently validate it in a new cohort consisting of 93 patients with SFTS.
Results: A significant increase in plasma proteins associated with various functional clusters, such as the proteasomal protein catabolic process, phagocytosis, and humoral immune response, was observed in severe SFTS patients. High levels of four proteins including NID1, HSP90α, PSMA1, and VCAM1 were strongly correlated with multi-organ damage and disease progression. A prediction model was developed at the early stage to accurately predict severe conditions with the area under the curve of 0.931 (95% CI, 0.885, 0.963).
Conclusion: The proteomic signatures identified in this study provide insights into the potential pathogenesis of SFTS. The predictive models have substantial clinical implications for the early identification of SFTS patients who may progress to severe conditions.
Severe fever with thrombocytopenia syndrome (SFTS) is a newly emerging infectious disease first reported in China in 2009 (Yu et al., 2011), with a 5–45% fatality rate (Cui et al., 2015; Chen et al., 2022b). The causative agent was identified as a novel Phlebovirus in the Bunyaviridae family, previously named SFTS virus, newly named Dabie bandavirus (DBV) (Walker et al., 2019). SFTS was subsequently reported in other Asian countries, including South Korea, Japan, Vietnam, Myanmar, and Thailand (Nam et al., 2023). DBV is primarily transmitted by tick-to-human, and can also be transmitted from person to person via contact with infected blood (Chen et al., 2022a). Because of its high case fatality rate, multiple transmission routes, and extensive geographical distribution, SFTS has become a significant global infectious disease.
SFTS manifests with abrupt onset of high fever, lymphadenopathy, and respiratory or gastrointestinal symptoms. Severe cases might develop encephalopathy, hemorrhaging, sepsis, and multiple organ failure (Li H. et al., 2018). Laboratory extreme abnormalities include progressive thrombocytopenia and leukopenia and elevated serum levels of aspartate aminotransferase (AST), lactate dehydrogenase (LDH), creatine kinase (CK), and serum creatinine (sCr) (Yu, 2018; Zhao et al., 2022). Hyper-viremia-induced pathophysiological changes such as cytokine storm, reduction and functional impairment of immune cells, endothelial damage as well as disseminated intravascular coagulation played important roles in the disease progress (Peng et al., 2016; Yamada et al., 2018; Wang Y. N. et al., 2022). It is imperative to identify predictors associated with disease progression for optimal clinical management. However, to date, relevant comprehensive predictors or effective prediction models are still poorly explored.
Alterations of patients’ plasma proteins are informative and have been well-recognized as indicators of pathophysiological changes during the disease progression in various epidemic infectious diseases, including coronavirus disease 2019 (Shu et al., 2020), severe acute respiratory syndrome (Ren et al., 2004), and Zika virus infection (Wee et al., 2019). Similarly, serum proteomic changes related to pathophysiological changes such as thrombocytopenia, abnormal immune response, and inflammatory activation were documented in SFTS patients (Lee et al., 2022). Some proteins were identified as biomarkers for predicting SFTS prognosis (Zhang et al., 2024). Therefore, to find more accurate biomarkers for disease progression of SFTS, we performed quantitative proteomics analysis to identify several early proteins that displayed significant alterations in the plasma of severe SFTS patients. The plasma proteins were further validated by enzyme-linked immunosorbent assay (ELISA) in a large-scale cohort. Furthermore, we developed a combination of biomarkers based on these proteins that could accurately predict the patients who are at risk of developing severe conditions. These findings provided valuable knowledge about plasma biomarkers correlated with disease progression in SFTS, potentially shedding light on the underlying pathogenesis of SFTS and facilitating early identification of severe cases to enhance disease prognosis.
We performed quantitative proteomics in plasma samples from 7 mild (M) and 10 severe (S) cases who were diagnosed with SFTS at the First Affiliated Hospital of Nanjing Medical University from April 2021 to July 2021. Five age- and gender-matched healthy (H) subjects were enrolled as controls (Cohort 1). To develop a better early severe prediction model, a total of 190 SFTS patients were enrolled in the same center from June 2015 to February 2021 (Cohort 2). Additionally, to validate its efficacy, 93 SFTS patients were prospectively recruited from March 2022 to November 2022 (Cohort 3). Plasma samples were obtained from all patients during the fever stage at the time of enrollment (Figure 1). Among the patients, plasma samples were collected from 86 cases at different stages of the disease for dynamic analysis of protein markers. In addition, 20 healthy subjects, whose serological tests were negative for DBV, were enrolled for comparison.
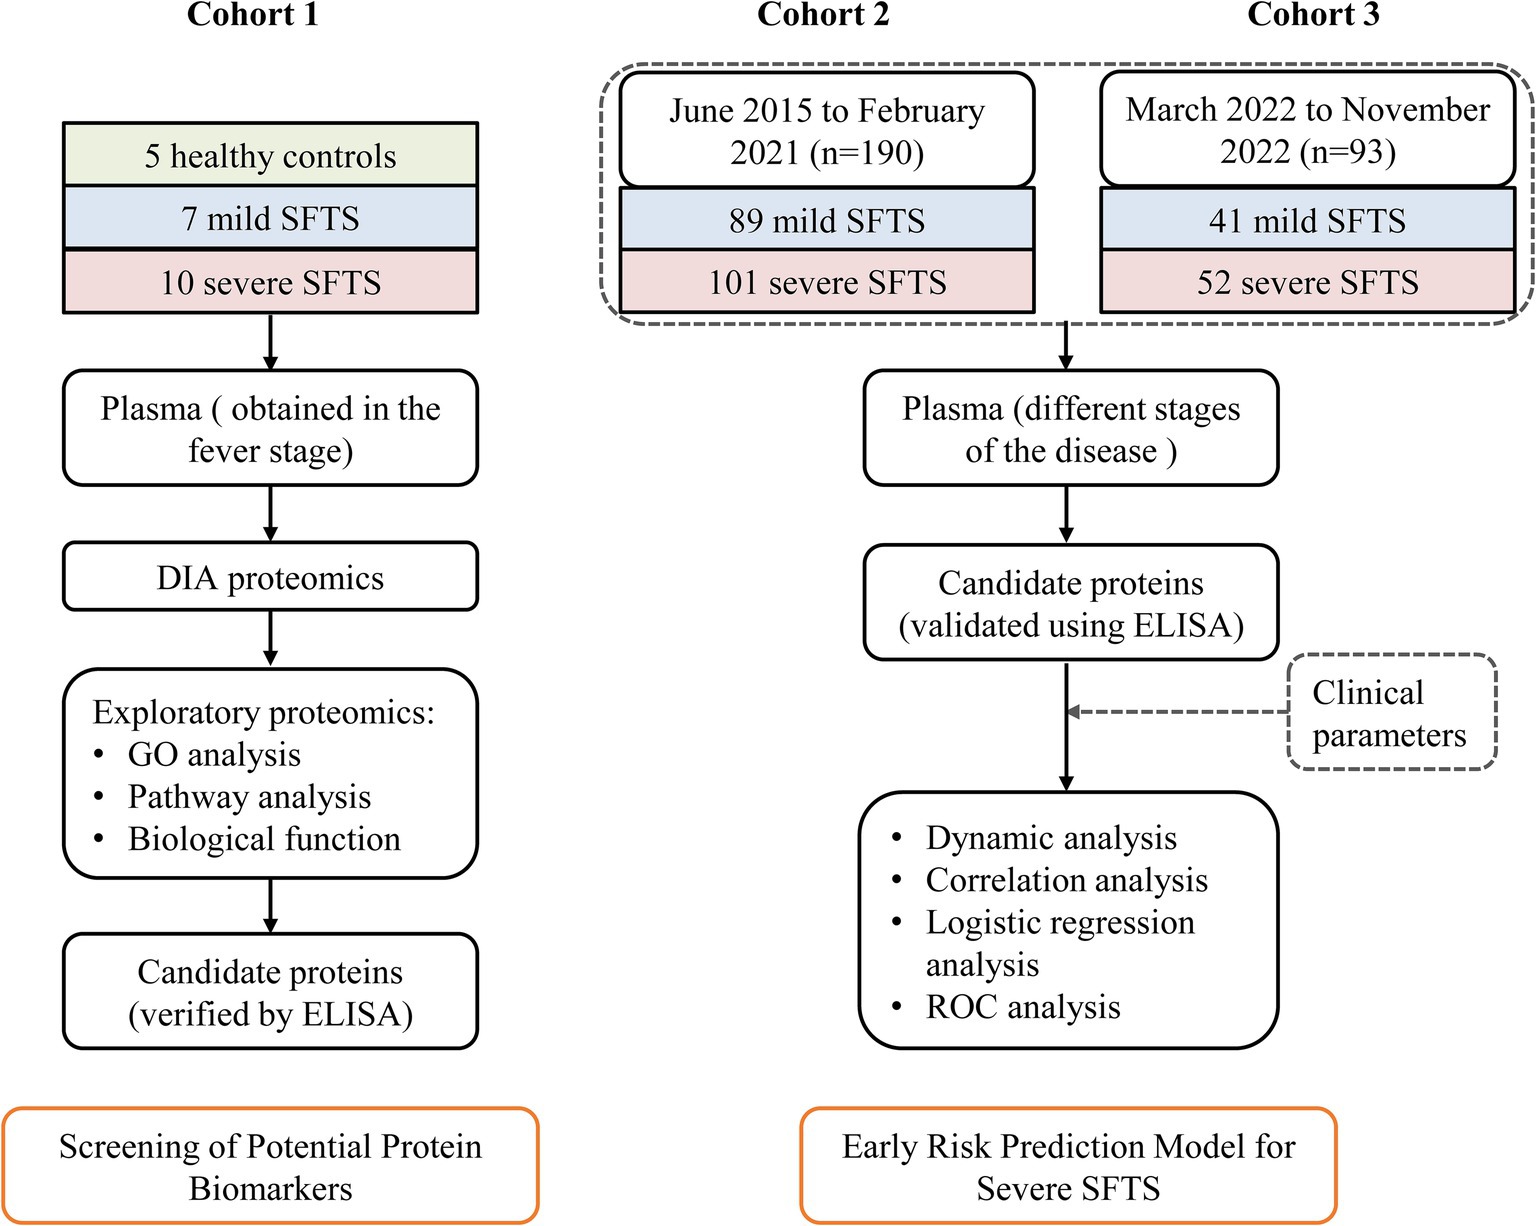
Figure 1. Study design overview for severe SFTS prediction model development. Cohort 1, including 5 healthy controls, 7 mild SFTS patients and 10 severe patients, was used to identify potential plasma protein biomarkers associated with severe illness. Cohort 2, composed of 89 mild SFTS and 101 severe patients, was used to establish a prediction model for severe SFTS based on these biomarkers and clinical parameters. Cohort 3, consisting of 41 mild SFTS and 52 severe SFTS, was used to validate the efficacy of the prediction model.
Diagnostic criteria of SFTS were as follows: (1) possibility of tick bite history; (2) acute fever, fatigue with thrombocytopenia; and (3) positive DBV ribonucleic acid (RNA) confirmed by real-time quantitative reverse-transcription polymerase chain reaction in plasma.
According to previous reports (Chen G. et al., 2022; Li and Wang, 2022), cases that met any one of the following criteria were classified as severe: (1) presenting with severe neurological symptoms, (2) multiple organ failure, (3) severe bleeding, (4) severe secondary infection, (5) platelet count <30 × 109/L, (6) AST, LDH, CK >10 × ULN (upper limit of normal) or (7) death. Exclusive criteria were as follows: (1) laboratory-confirmed other pathogen infections, (2) underlying serious systemic diseases, or (3) severe immune deficiency. Demographic and laboratory data were obtained from all the patients. The survival status of all patients was followed for 28 days post-disease onset.
Written informed consent was obtained from each patient following the principles of the Declaration of Helsinki. The study was approved by the Research and Ethics Committee of the First Affiliated Hospital of Nanjing Medical University, Nanjing, China (Ethics approval number, 2022-SR-366).
Blood samples from all patients were collected in K2-EDTA tubes at the indicated time points. The blood was processed immediately to centrifuge at 670 g for 10 min at 20°C and the plasma was aliquoted and stored at −80°C until at the time of assays.
Viral RNA was extracted from plasma samples with a commercial kit (Daan Gene, Guangzhou, China) by a trained specialist. The extracted RNA was amplified using specific primers and probes by one-step real-time fluorescence qRT-PCR for the detection of a novel bunyavirus in all specimens according to the manufacturer’s instructions. Real-time qRT-PCR cycling was performed as follows: after reverse transcription at 50°C for 15 min, polymerase was activated at 95°C for 15 min, and amplification was undertaken for 45 cycles consisting of a denaturing step at 94°C for 15 s and an annealing-extension step at 55°C for 45 s. The fluorogenic signal emitted was collected during the extension step, and a cycle threshold was acquired for quantifying the viral load of the sample.
The samples were fractionated using a high pH reversed-phase fractionator, peptide fractions were subsequently analyzed by LC-MS/MS using the Thermo Scientific Orbitrap Exploris™ 480 platform (Thermo Fisher Scientific) via data-independent acquisition (DIA) scan mode. Mass spectrometry data were used to generate a hybrid library in the Spectronaut software (Biognosys, version 15.7) for final protein identification and quantitation. All searches were performed against the human UniProt proteome sequences, LianChuan Biotechnology Company (Hangzhou, China) provides related technical support. Detailed procedures can be found in the Supplementary material.
Acquired data were analyzed by Excel 2021 and R (Version 4.2.0). Proteins with missing values in more than 60% of samples were excluded. The remaining missing values were interpolated by the median. Principal component analysis (PCA) and Clustering heatmaps of proteins using “ggplot2” and “pheatmap” packages, respectively. Differentially expressed proteins (DEPs) were defined as average ratio-fold change (FC) >1.5 as well as p-value <0.05. The DEPs were subjected to Gene Ontology (GO) functional clustering analyses.
Human protein ELISA kits were used to quantify plasma levels of proteins according to manufacturers’ instructions. Briefly, plasma samples were diluted according to the manufacturer’s dilution guidelines. Then, 100 μL of fixed dilution plasma sample was added to the plates and incubated for 90 min at 37°C. After washing, 100 μL biotinylated-specific antibody was immediately added to each well, and the plates were incubated for 60 min at 37°C. Followed by washing, 100 μL Avidin-horseradish peroxidase was added and incubated for 30 min at 37°C. Finally, the optical density (OD) value at 450 nm was determined after the addition of 90 μL tetramethyl-benzidine reagent and stop solution. The standard curve of each protein was generated by the determination of OD values from serial dilutions of the standard samples with known protein concentrations. Detailed information on ELISA kits can be found in Supplementary Table 1.
Statistical analyses were performed using SPSS 25.0 (IBM, Armonk, NY) or otherwise specified. Values are expressed as the mean ± standard deviation for normally distributed or as the median (p25, p75) for nonnormally distributed, whereas categorical variables are expressed as percentages. The independent Student t-test, nonparametric Mann–Whitney U test, or χ2 test was used to determine differences among groups. Correlations were analyzed using Spearman’s correlation analysis. Logistic regression analysis was used to identify variables for predicting severe SFTS patients. The area under the receiver operating characteristic curve (auROC) was calculated and compared by the Z test (Delong’s method). Differences with a p < 0.05 were considered statistically significant.
To identify the potential protein biomarkers, we performed quantitative proteomics in plasma samples from Cohort 1 (5 H, 7 M, and 10 S). The clinical baseline characteristics of Cohort 1 were described in Table 1. A total of 583 proteins were identified by proteomics analysis. PCA showed that the protein profiles of the severe and mild patients were visibly distinct from the healthy control, and protein distribution in the severe group was segregated from the mild group (Figure 2A). Similarly, the heatmap clustering analysis also demonstrated differences in protein expression profiles among the three groups (Figure 2B), indicating unique proteomic features in severe cases for further exploration.

Table 1. Comparison of clinical characteristics in SFTS patients from Cohort 1.
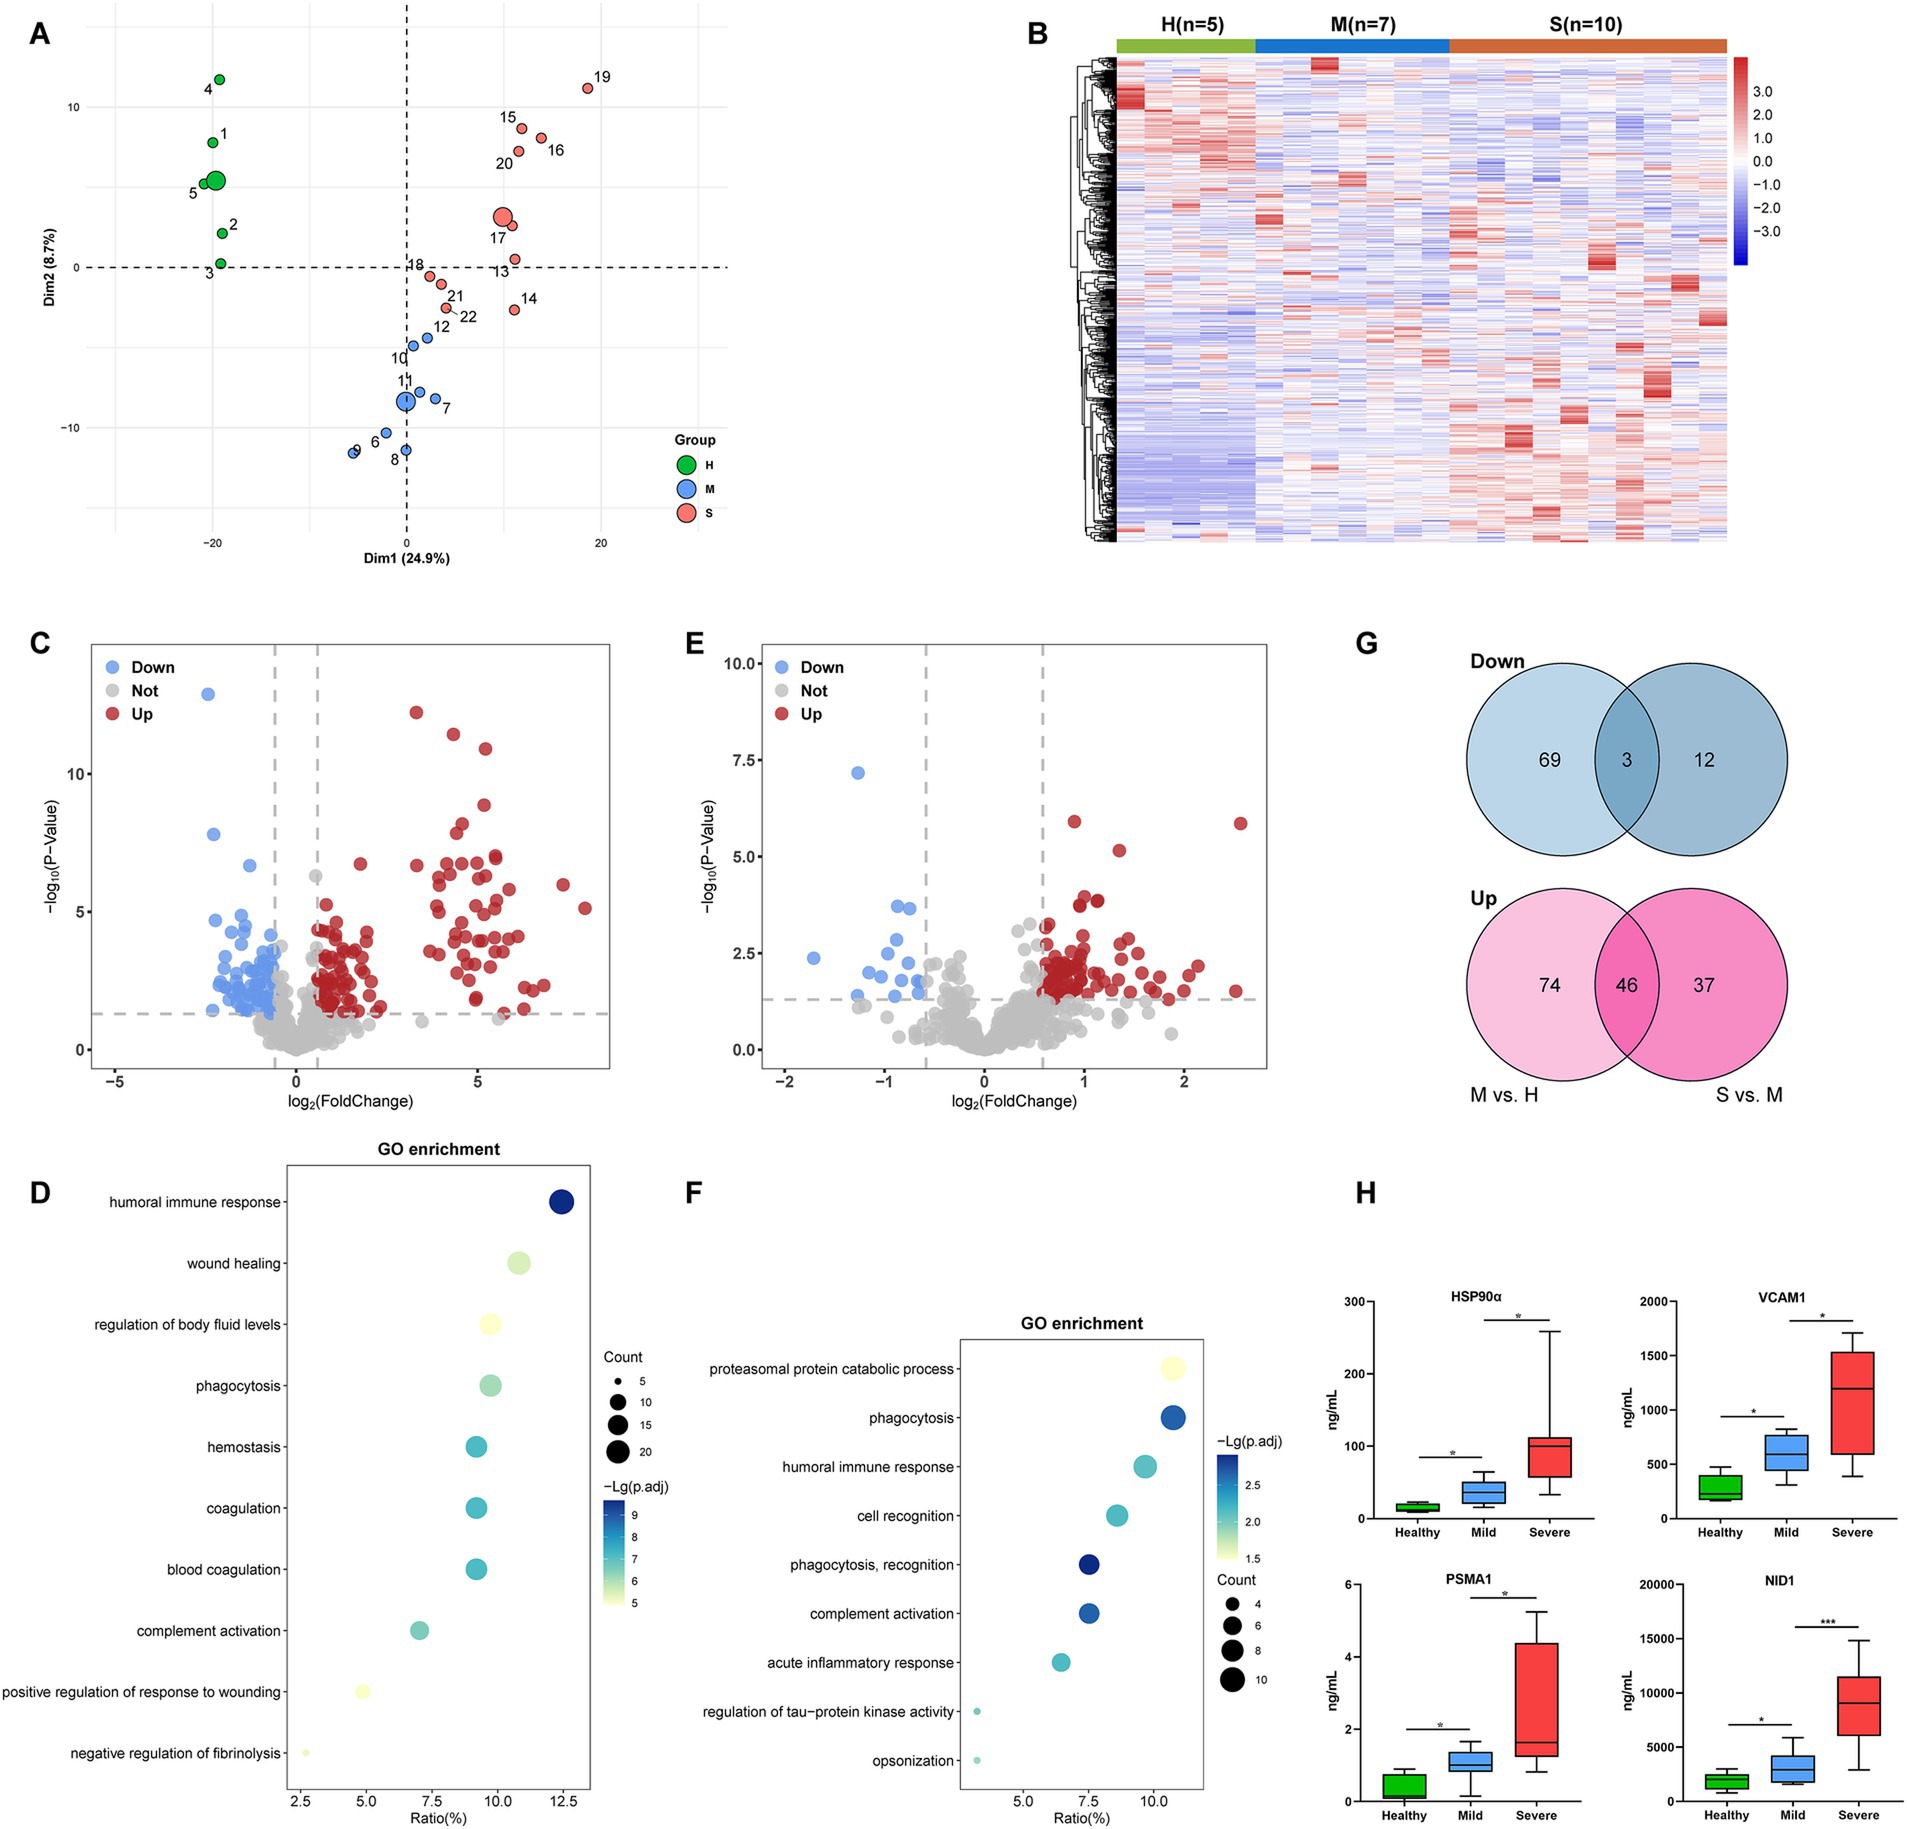
Figure 2. Identification of candidate proteins associated with severe SFTS patients in Cohort 1. (A) PCA plot of the proteomics data (583 quantified proteins). Green, blue, and red points represent healthy control, mild, and severe SFTS patients, respectively. The subject ID numbers were also displayed. The centroid of each sample group was marked by a larger solid circle. (B) A clustering heatmap of the protein expression levels. Red colors represent high expression levels and blue colors represent low expression levels. The color intensity was proportional to the expression levels. H, healthy control; M, mild cases; S, severe cases. (C) Volcano plot visualizing the identified DEPs of the M group compared with the H group. The red dots represent upregulated DEPs, while the blue dots represent downregulated DEPs (Fold change >1.5 and p < 0.05), and the gray dots represent no significance. (D) Dot-plot visualization of GO biological process terms for DEPs between the M group versus the H group. The dot size was proportional to the number of proteins annotated to the corresponding GO term. The color-scale was proportional to −log10 (adjusted p-value). (E) Volcano plot visualizing the identified DEPs of the S group compared with the M group. The red dots represent upregulated DEPs, while the blue dots represent downregulated DEPs (Fold change >1.5 and p < 0.05), and the gray dots represent no significance. (F) Dot-plot visualization of GO biological process terms for DEPs between the S group versus the M group. The dot size was proportional to the number of proteins annotated to the corresponding GO term. The color-scale was proportional to −log10 (adjusted p-value). (G) Venn diagram visualization of DEPs abundance trends among the H, M, and S groups. (H) ELISA was performed to validate the expression levels of four candidate proteins (HSP90α, VCAM1, PSMA1, and NID1) in the plasma of subjects from cohort1. *, **, and *** represent p < 0.05, p < 0.01, and p < 0.001, respectively.
Next, we picked out several plasma proteins related to severe cases from proteomic results. The volcano plot showed that, Compared to healthy controls, a total of 120 significantly upregulated and 72 significantly downregulated DEPs were identified in mild patients (Figure 2C). GO enrichment analysis showed that DEPs were highly enriched in biological processes involved in humoral immune response, phagocytosis, hemostasis, and coagulation (Figure 2D). Compared to mild patients, a total of 83 significantly upregulated and 15 significantly downregulated DEPs were identified in severe patients (Figure 2E). The GO-terms pathways of the DEPs were highly enriched in processes related to proteasomal protein catabolic process, phagocytosis, and humoral immune response (Figure 2F). We further found that 46 DEPs exhibited an increasing trend, while three DEPs exhibited a decreasing trend among the H, M, and S groups (Figure 2G). Then, based on their abundance and biological functions primarily involved in processes such as inflammation, immunity response, metabolism, or coagulation which were related to pathological and physiological changes in the disease, 18 DEPs were finally selected for validation in plasma using ELISA (Table 2). Finally, consistent with proteomics results, four proteins, namely heat shock protein 90α (HSP90α), vascular cell adhesion protein 1 (VCAM1), proteasome subunit alpha type 1 (PSMA1), and nidogen 1 (NID1) were elevated in the early-stage plasma of severe SFTS patients (Figure 2H). Thus, we choose those four proteins to serve as candidate biomarkers for further research.
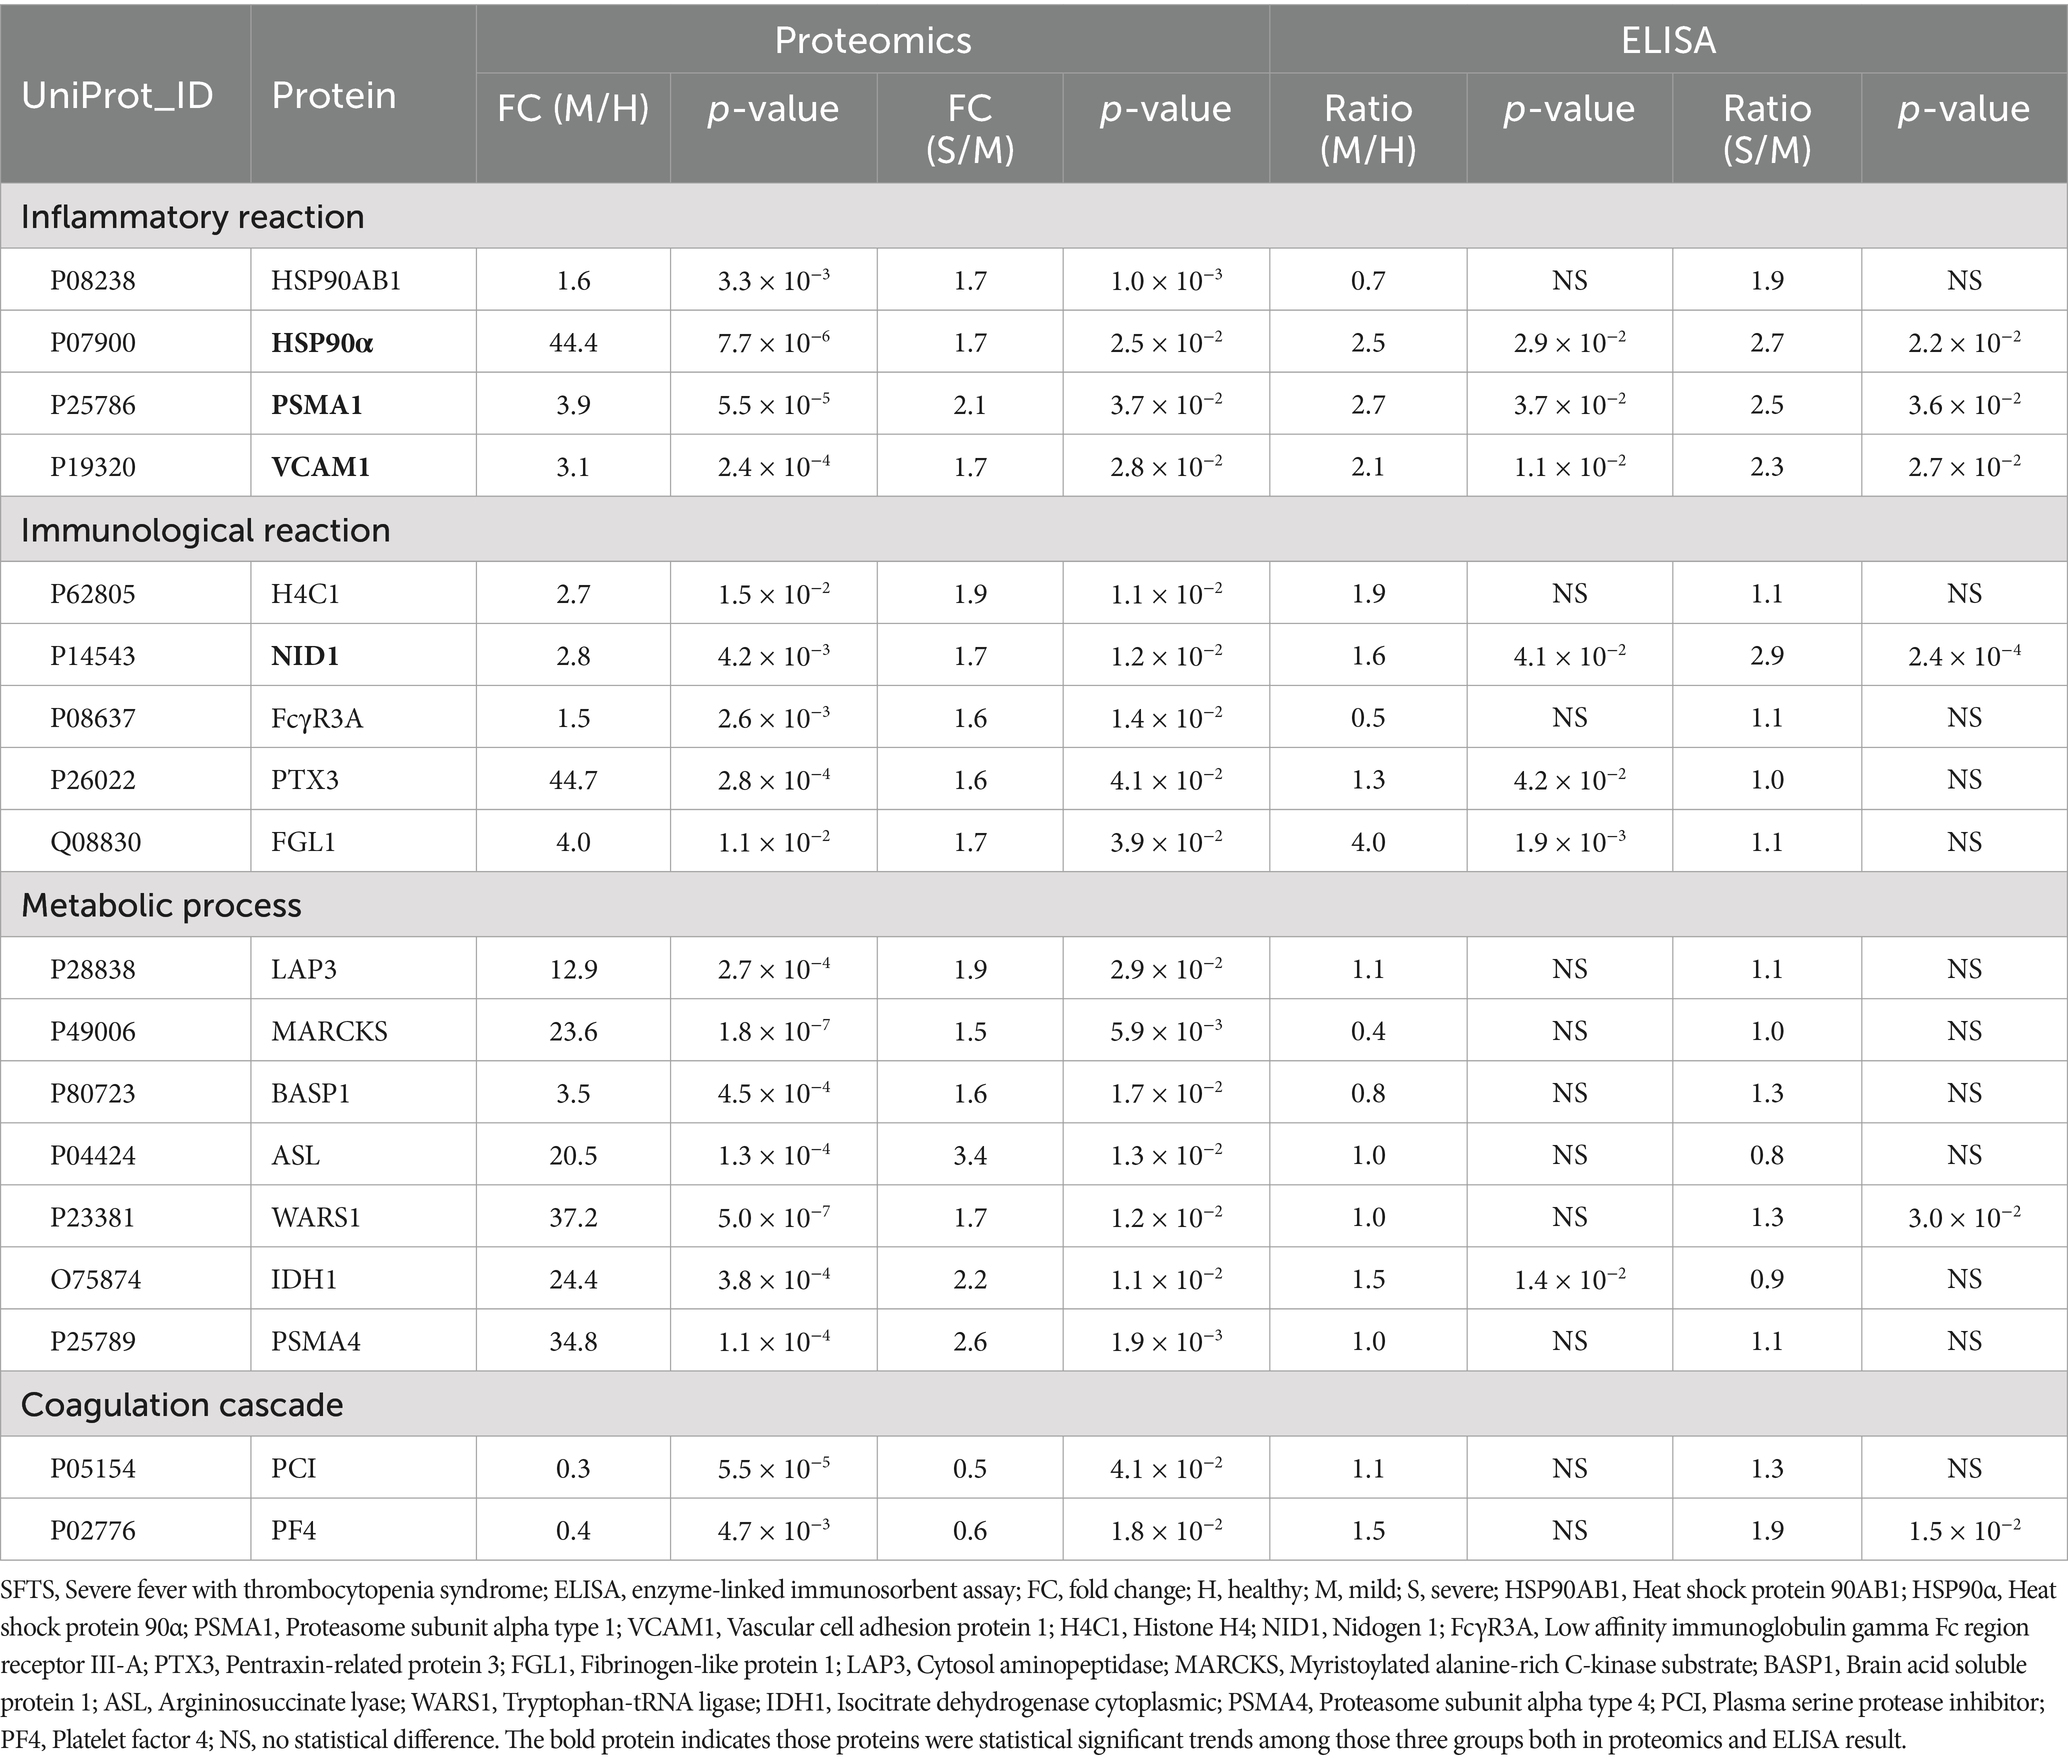
Table 2. Information of 18-candidate proteins in plasma of SFTS patients.
According to the typical clinical features, the course of SFTS has the following phases: the fever stage (1–7 days after onset, early-stage), the MOD stage (8–14 days), and the convalescent stage (>14 days). We analyzed the alternations of candidate protein expression in plasma from 86 cases in these three phases (20 H, 26 M, and 60 S). Results showed that the levels of candidate proteins including HSP90α, VCAM1, PSMA1, and NID1 were higher in the fever stage of SFTS patients compared with healthy controls, almost reaching plateaus in the MOD stage, and the concentrations were decreased in the convalescent stage (Figures 3A–D). Furthermore, the candidate protein levels were all higher in the severe cases compared to the mild cases both in the fever and MOD stages (Figures 3E–H). It was particularly noteworthy that the candidate protein levels were significantly higher in the non-survivors compared to the survivors in both the MOD and convalescence stages (Figures 3I–L).
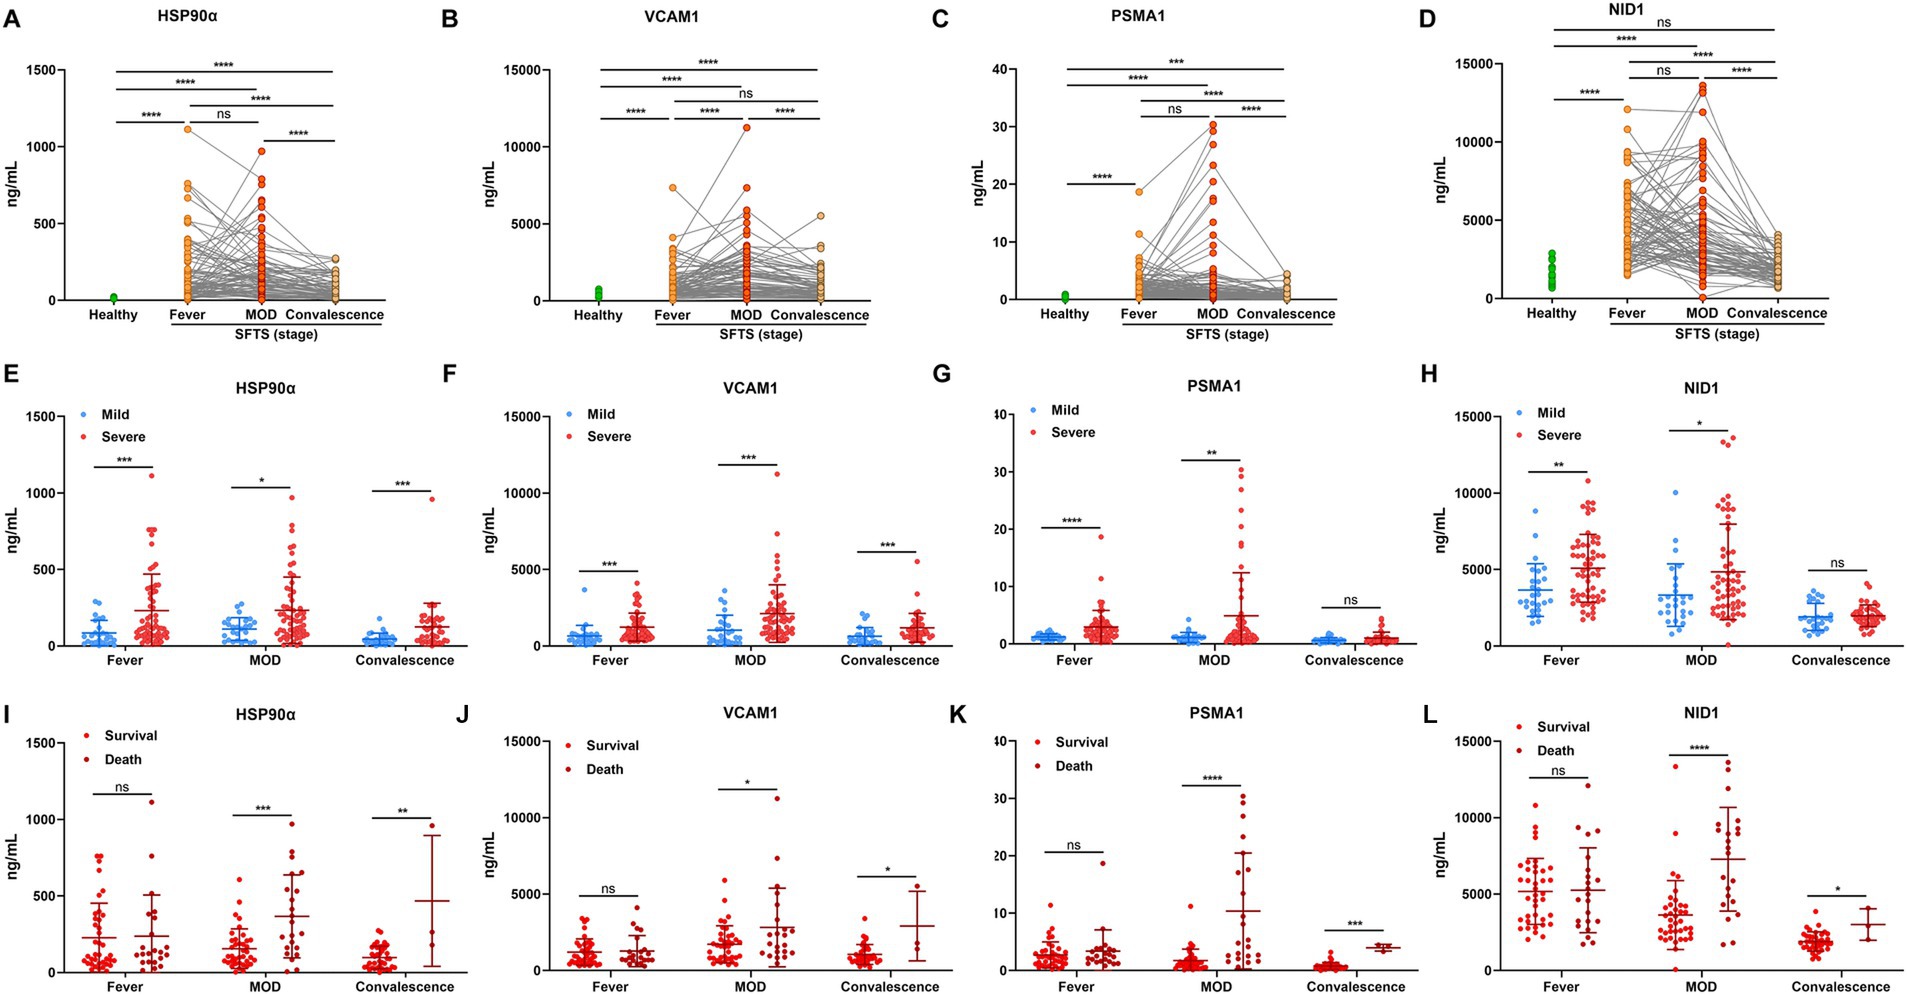
Figure 3. The dynamic alterations of plasma HSP90α, VCAM1, PSMA1, and NID1 levels in patients with SFTS. The concentration of HSP90α (A), VCAM1 (B), PSMA1 (C), and NID1 (D) in SFTS patients (n = 86) and healthy controls (n = 20). The green and red (orange) dots represent the healthy and the SFTS patients, respectively. The expression of HSP90α (E), VCAM1 (F), PSMA1 (G), and NID1 (H) in mild SFTS patients (n = 26) compared with severe SFTS patients (n = 60) SFTS patients. The blue and red dots represent the mild cases and the severe cases, respectively. The levels of HSP90α (I), VCAM1 (J), PSMA1 (K) and NID1 (L) in survival (n = 38) and death outcome (n = 22) from severe SFTS patients. The red and dark red dots represent the survivors and the deceased patients, respectively. ns, *, **, ***, and **** represent no statistical difference, p < 0.05, p < 0.01, p < 0.001, and p < 0.0001, respectively.
Plasma samples in early-stage and clinical parameters were further obtained from 283 SFTS patients, then, we used ELISA to detect the candidate protein concentrations. A correlation analysis revealed that HSP90α, VCAM1, PSMA1, and NID1 were correlated with the levels of severity-related indicators such as PLT, APTT, AST, LDH, CK, and sCr (Figure 4A), suggesting these proteins can serve as markers reflecting the multi-organ damage in patients with SFTS.
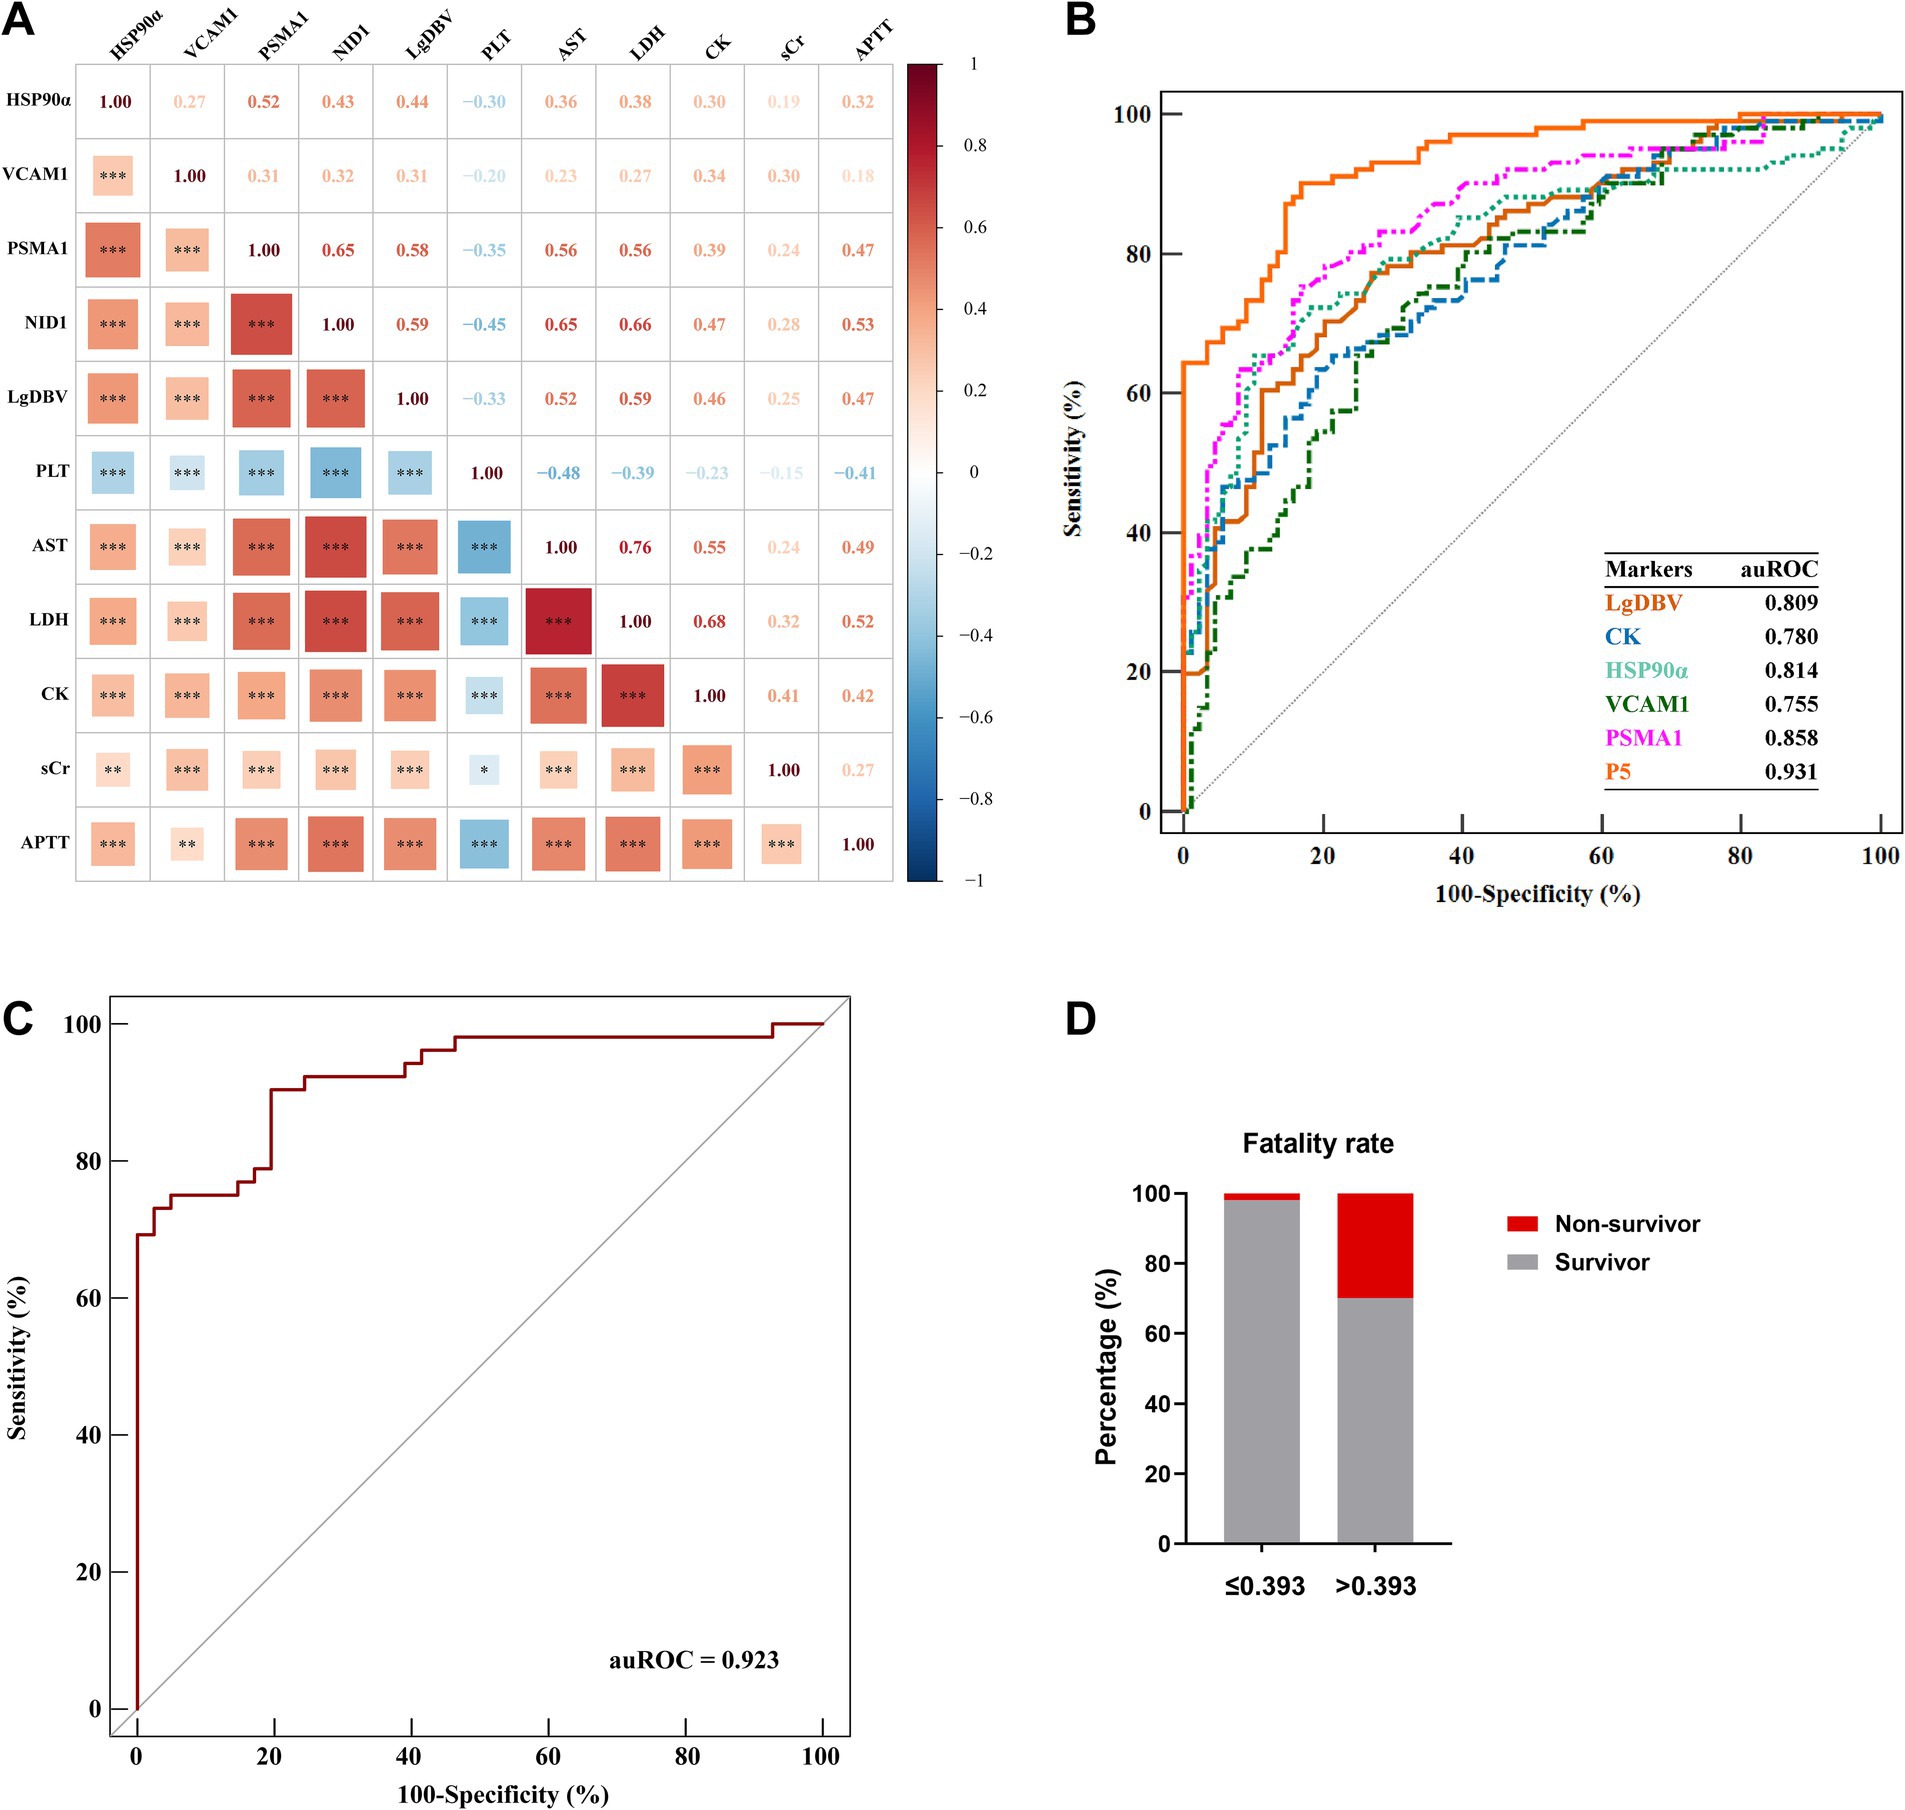
Figure 4. Development of the P5 model in the early stage for prediction of severe illness. (A) Spearman correlation heatmap showed that HSP90α, VCAM1, PSMA1, and NID1 were significantly associated with the severity-related indicators. Red represents positive correlations; blue represents negative correlations; and color depth and square size represent the intensity of the correlation. Significant correlations are marked by asterisks; *, **, and *** represent p < 0.05, p < 0.01, and p < 0.001, respectively. (B) Comparison of the predictive efficiency of P5, LgDBV, CK, HSP90α, VCAM1, and PSMA1 for identifying severe illness in SFTS patients using ROC plots in the evaluation group (Cohort 2). (C) Validation of the prediction efficacy of P5 using ROC curve analysis in the validation cohort (Cohort 3). (D) Comparison between the fatality rates of patients with P5 levels greater than 0.393 (n = 177) and patients with P5 levels lower than 0.393 (n = 106); red and grey represent the rate of non-survivor and survivor, respectively. Data were collected at the time of initial diagnosis within the early stage in each patient. Data are presented as medians with interquartile ranges. p-values were obtained by the Mann–Whitney test.
These results indicated those four candidate proteins had a close association with the disease progression, and higher concentrations of those protein markers indicate a more severe state of illness.
In order to develop an early prediction model for severe illness, protein markers were detected in plasma by ELISA and clinical data were collected in the early stage from 190 patients with SFTS from June 2015 to February 2021 (Cohort 2). The clinical characteristics and the concentration of four protein markers were summarized in Table 3. We performed univariate logistic regression analysis to identify variables with p-values less than 0.001. Subsequently, we constructed an optimal model using the stepwise method, where a variable was included if its p-value was less than 0.05 and removed if its p-value exceeded 0.1. This process resulted in a model comprised of five predictor variables including LgDBV, CK, HSP90α, VCAM1, and PSMA1 (P5, all with auROC >0.75), named LCHVP. The model can be expressed as follows:
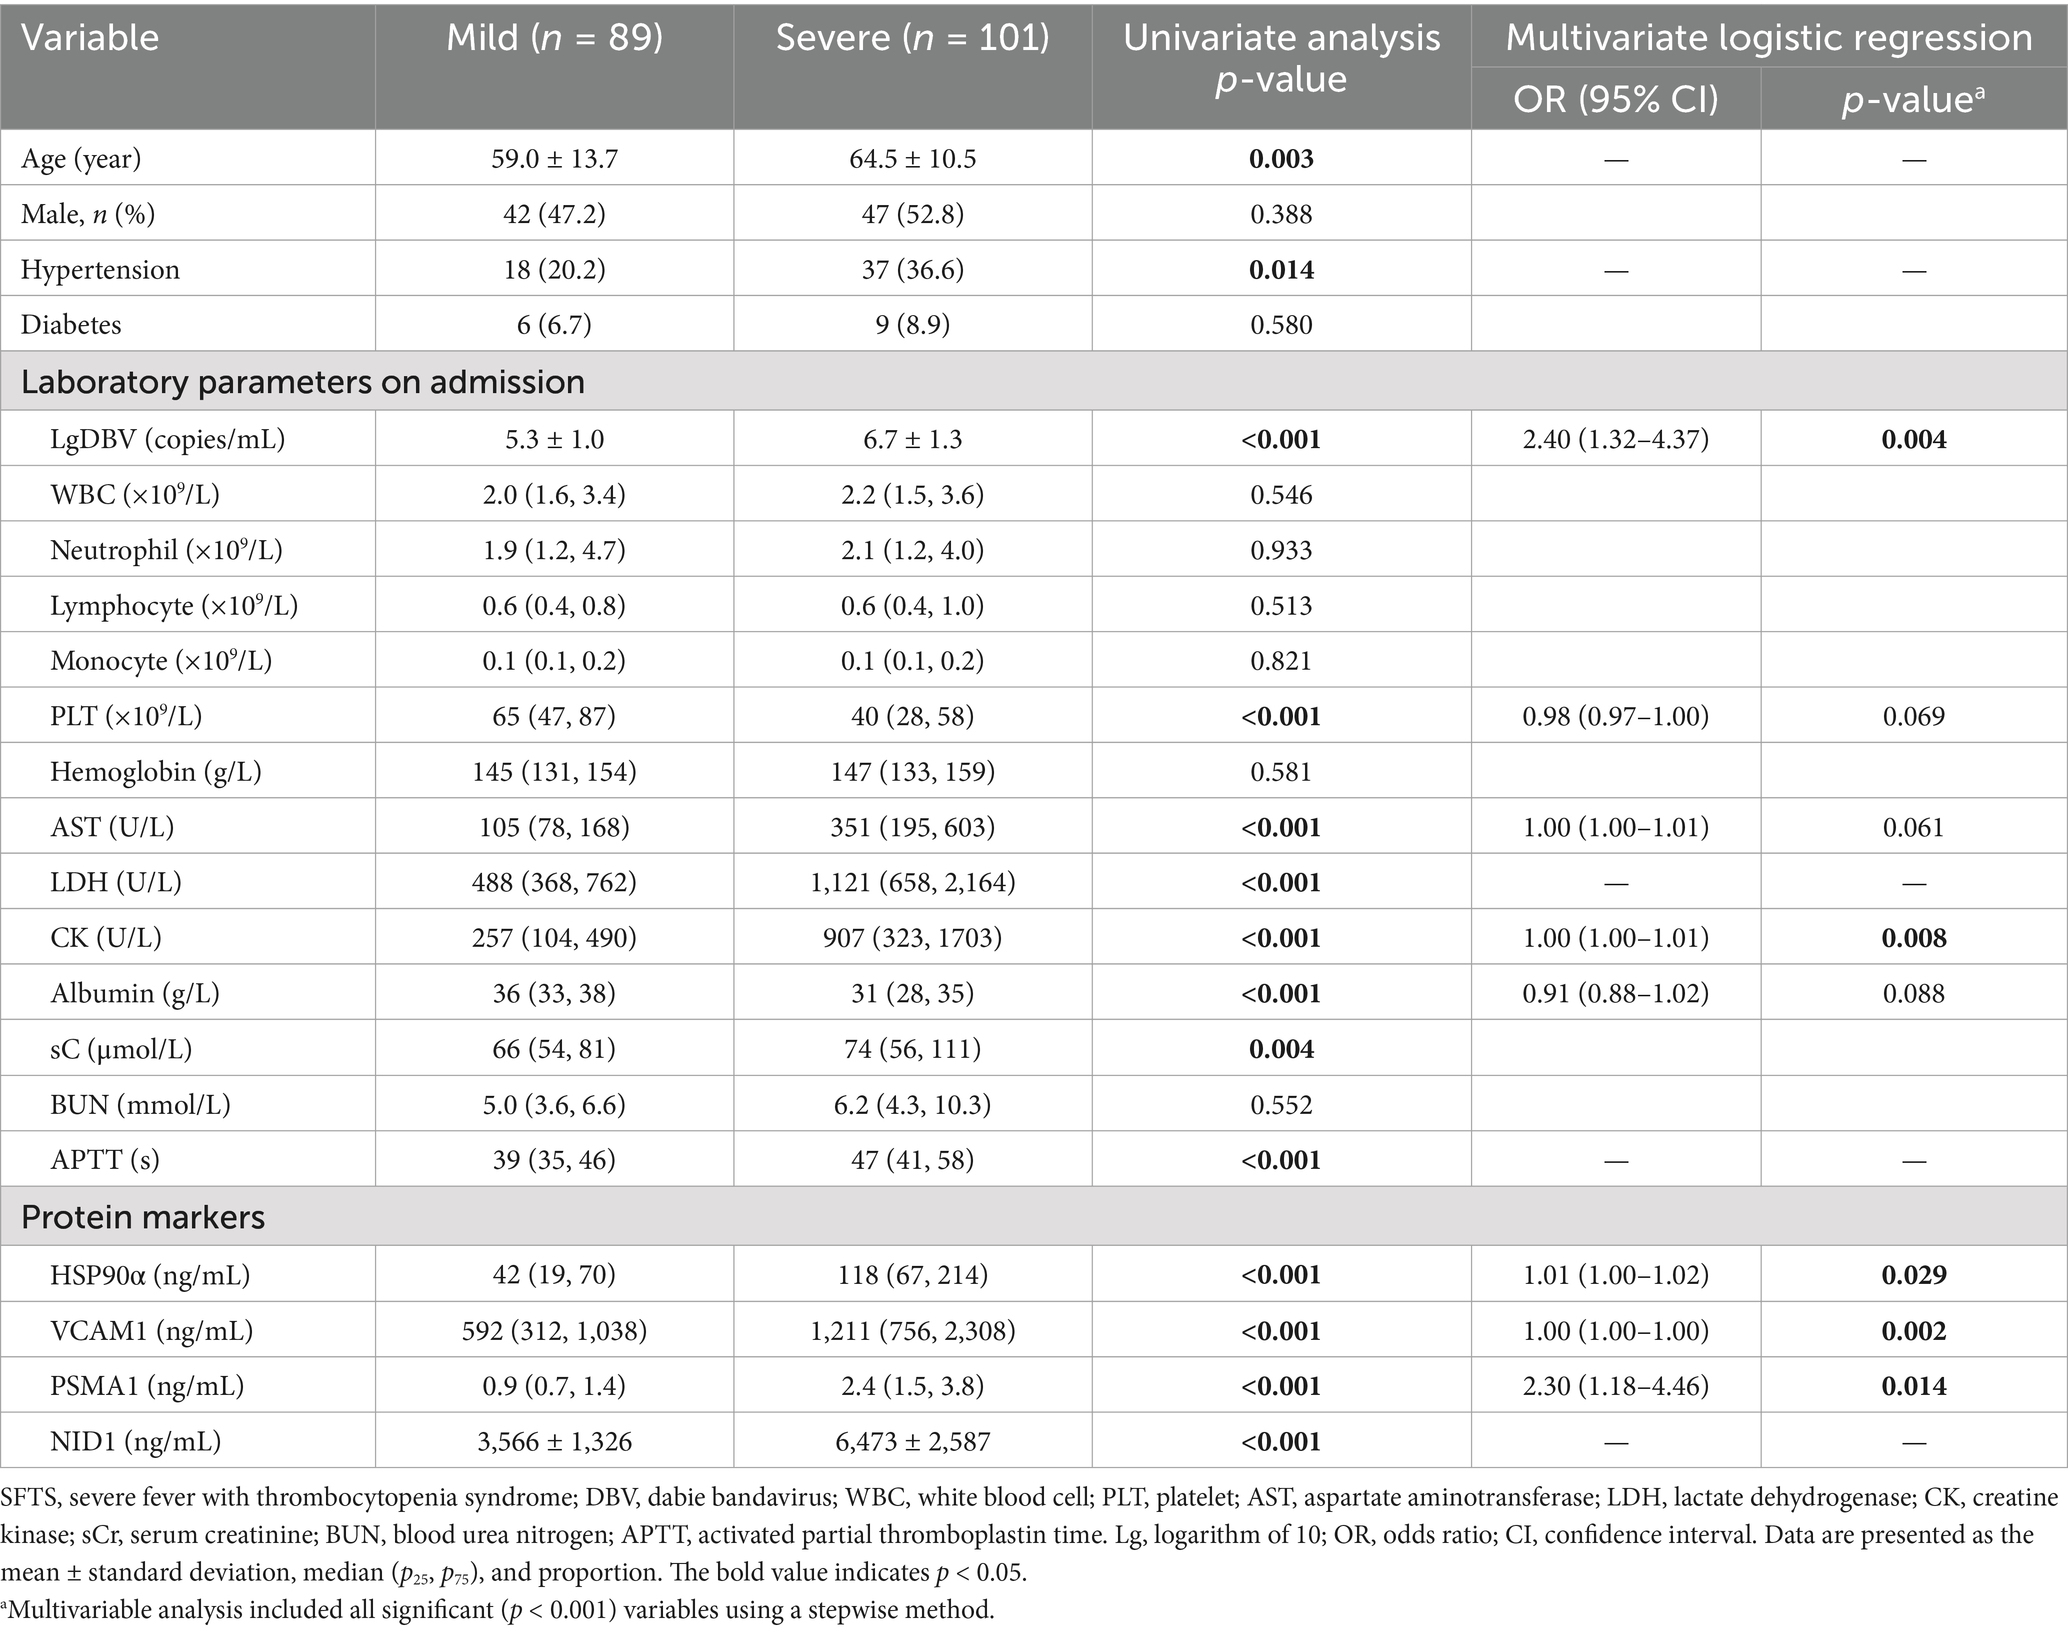
Table 3. Comparisons of the clinical characteristics and protein markers between mild and severe patients with SFTS.
ROC curve analysis revealed that P5 had the highest auROC of 0.931 (95% CI, 0.885, 0.963) at the optimal cut-off value of 0.393. The sensitivity and specificity of P5 for predicting severe SFTS were 90.1 and 83.2%, respectively (Figure 4B and Table 4). Subsequently, we performed external validation in Cohort 3, which consisted of 93 patients from March 2022 to November 2022. There were no differences in age, death rate or any laboratory values between Cohort 2 and Cohort 3 (Table 5), and the results showed that the auROC in the validation group was 0.923 (Figure 4C). Moreover, we found that patients with a P5 value greater than 0.393 had a fatality rate of 29.9% (95% CI, 23.3–37.3%), which was significantly higher than the fatality rate in patients with lower P5 levels [1.9% (95% CI, 0.2–6.5%), p <0.001; Figure 4D].
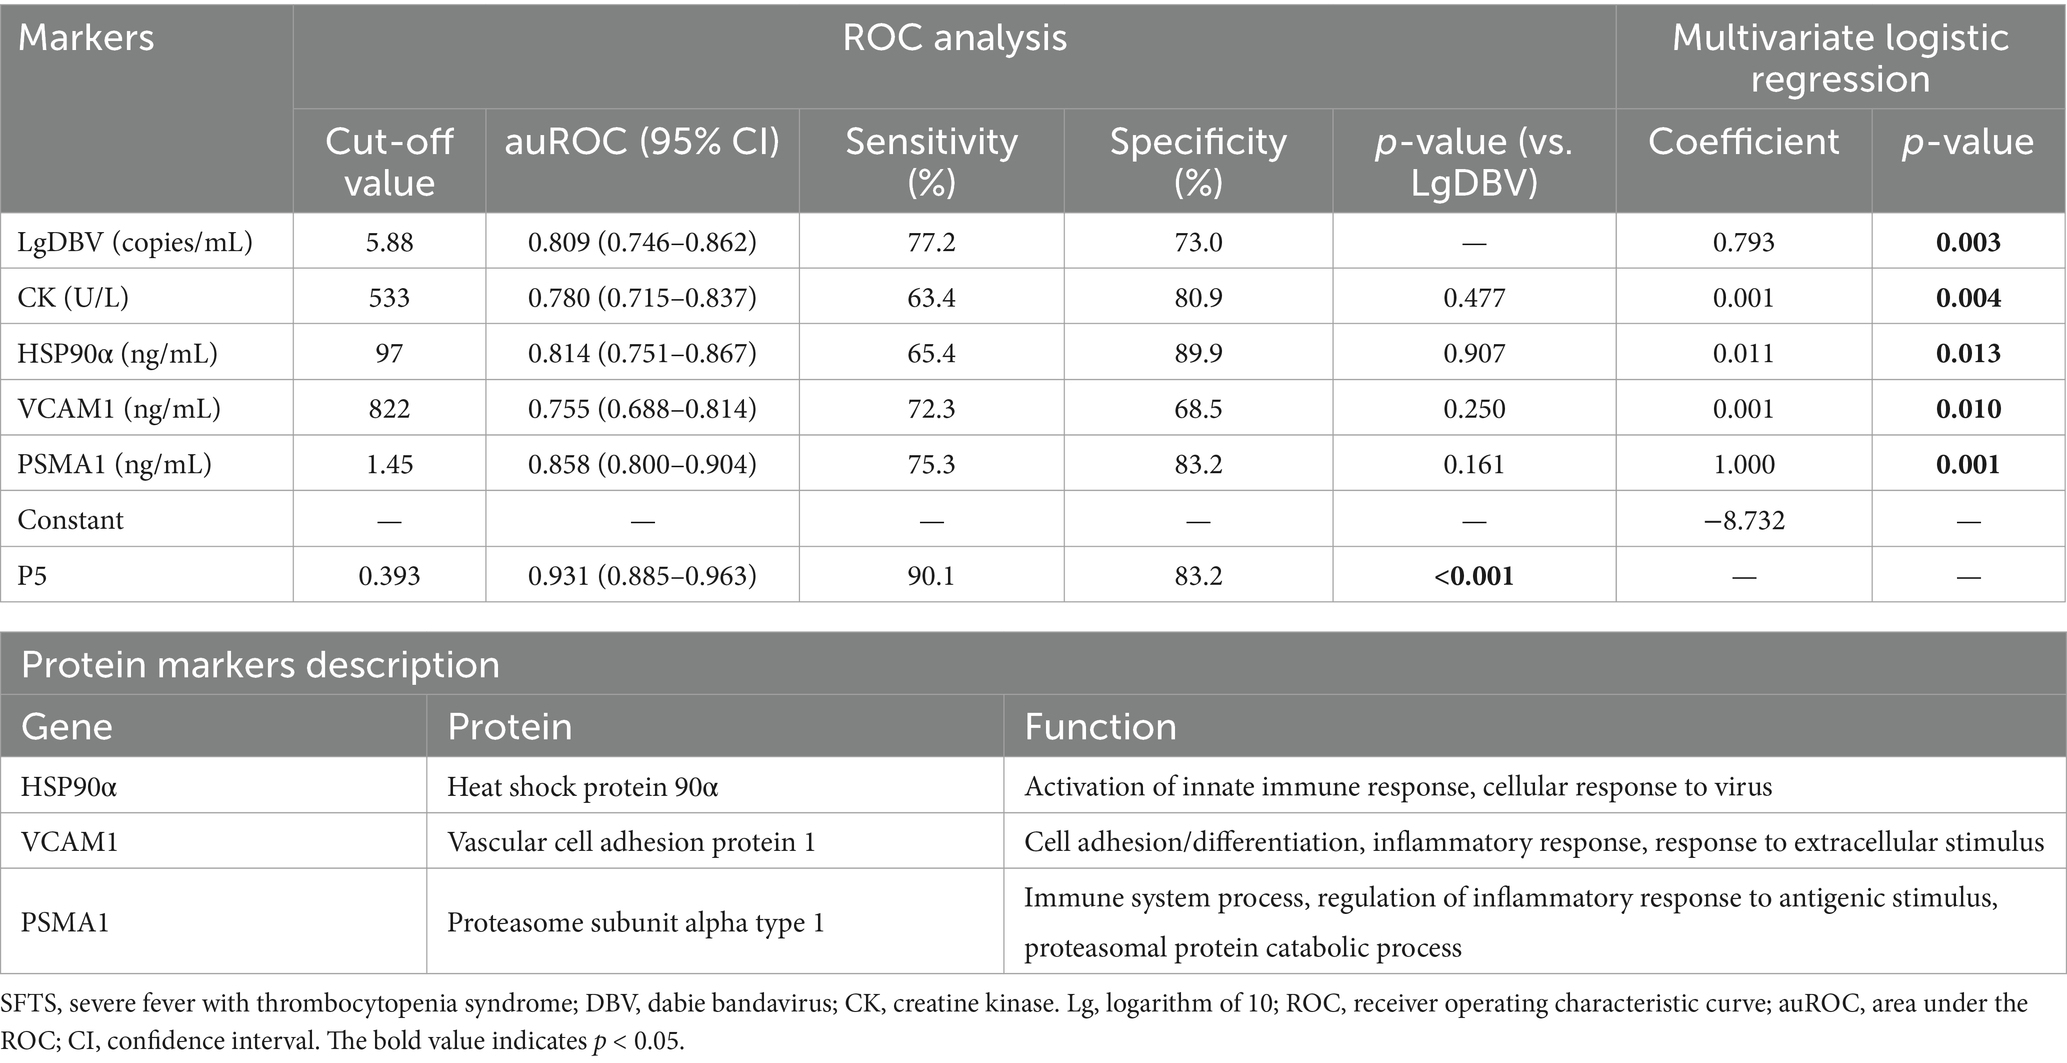
Table 4. The five-biomarker combination (P5) for classifying SFTS patients and predicting progression from mild to severe conditions.
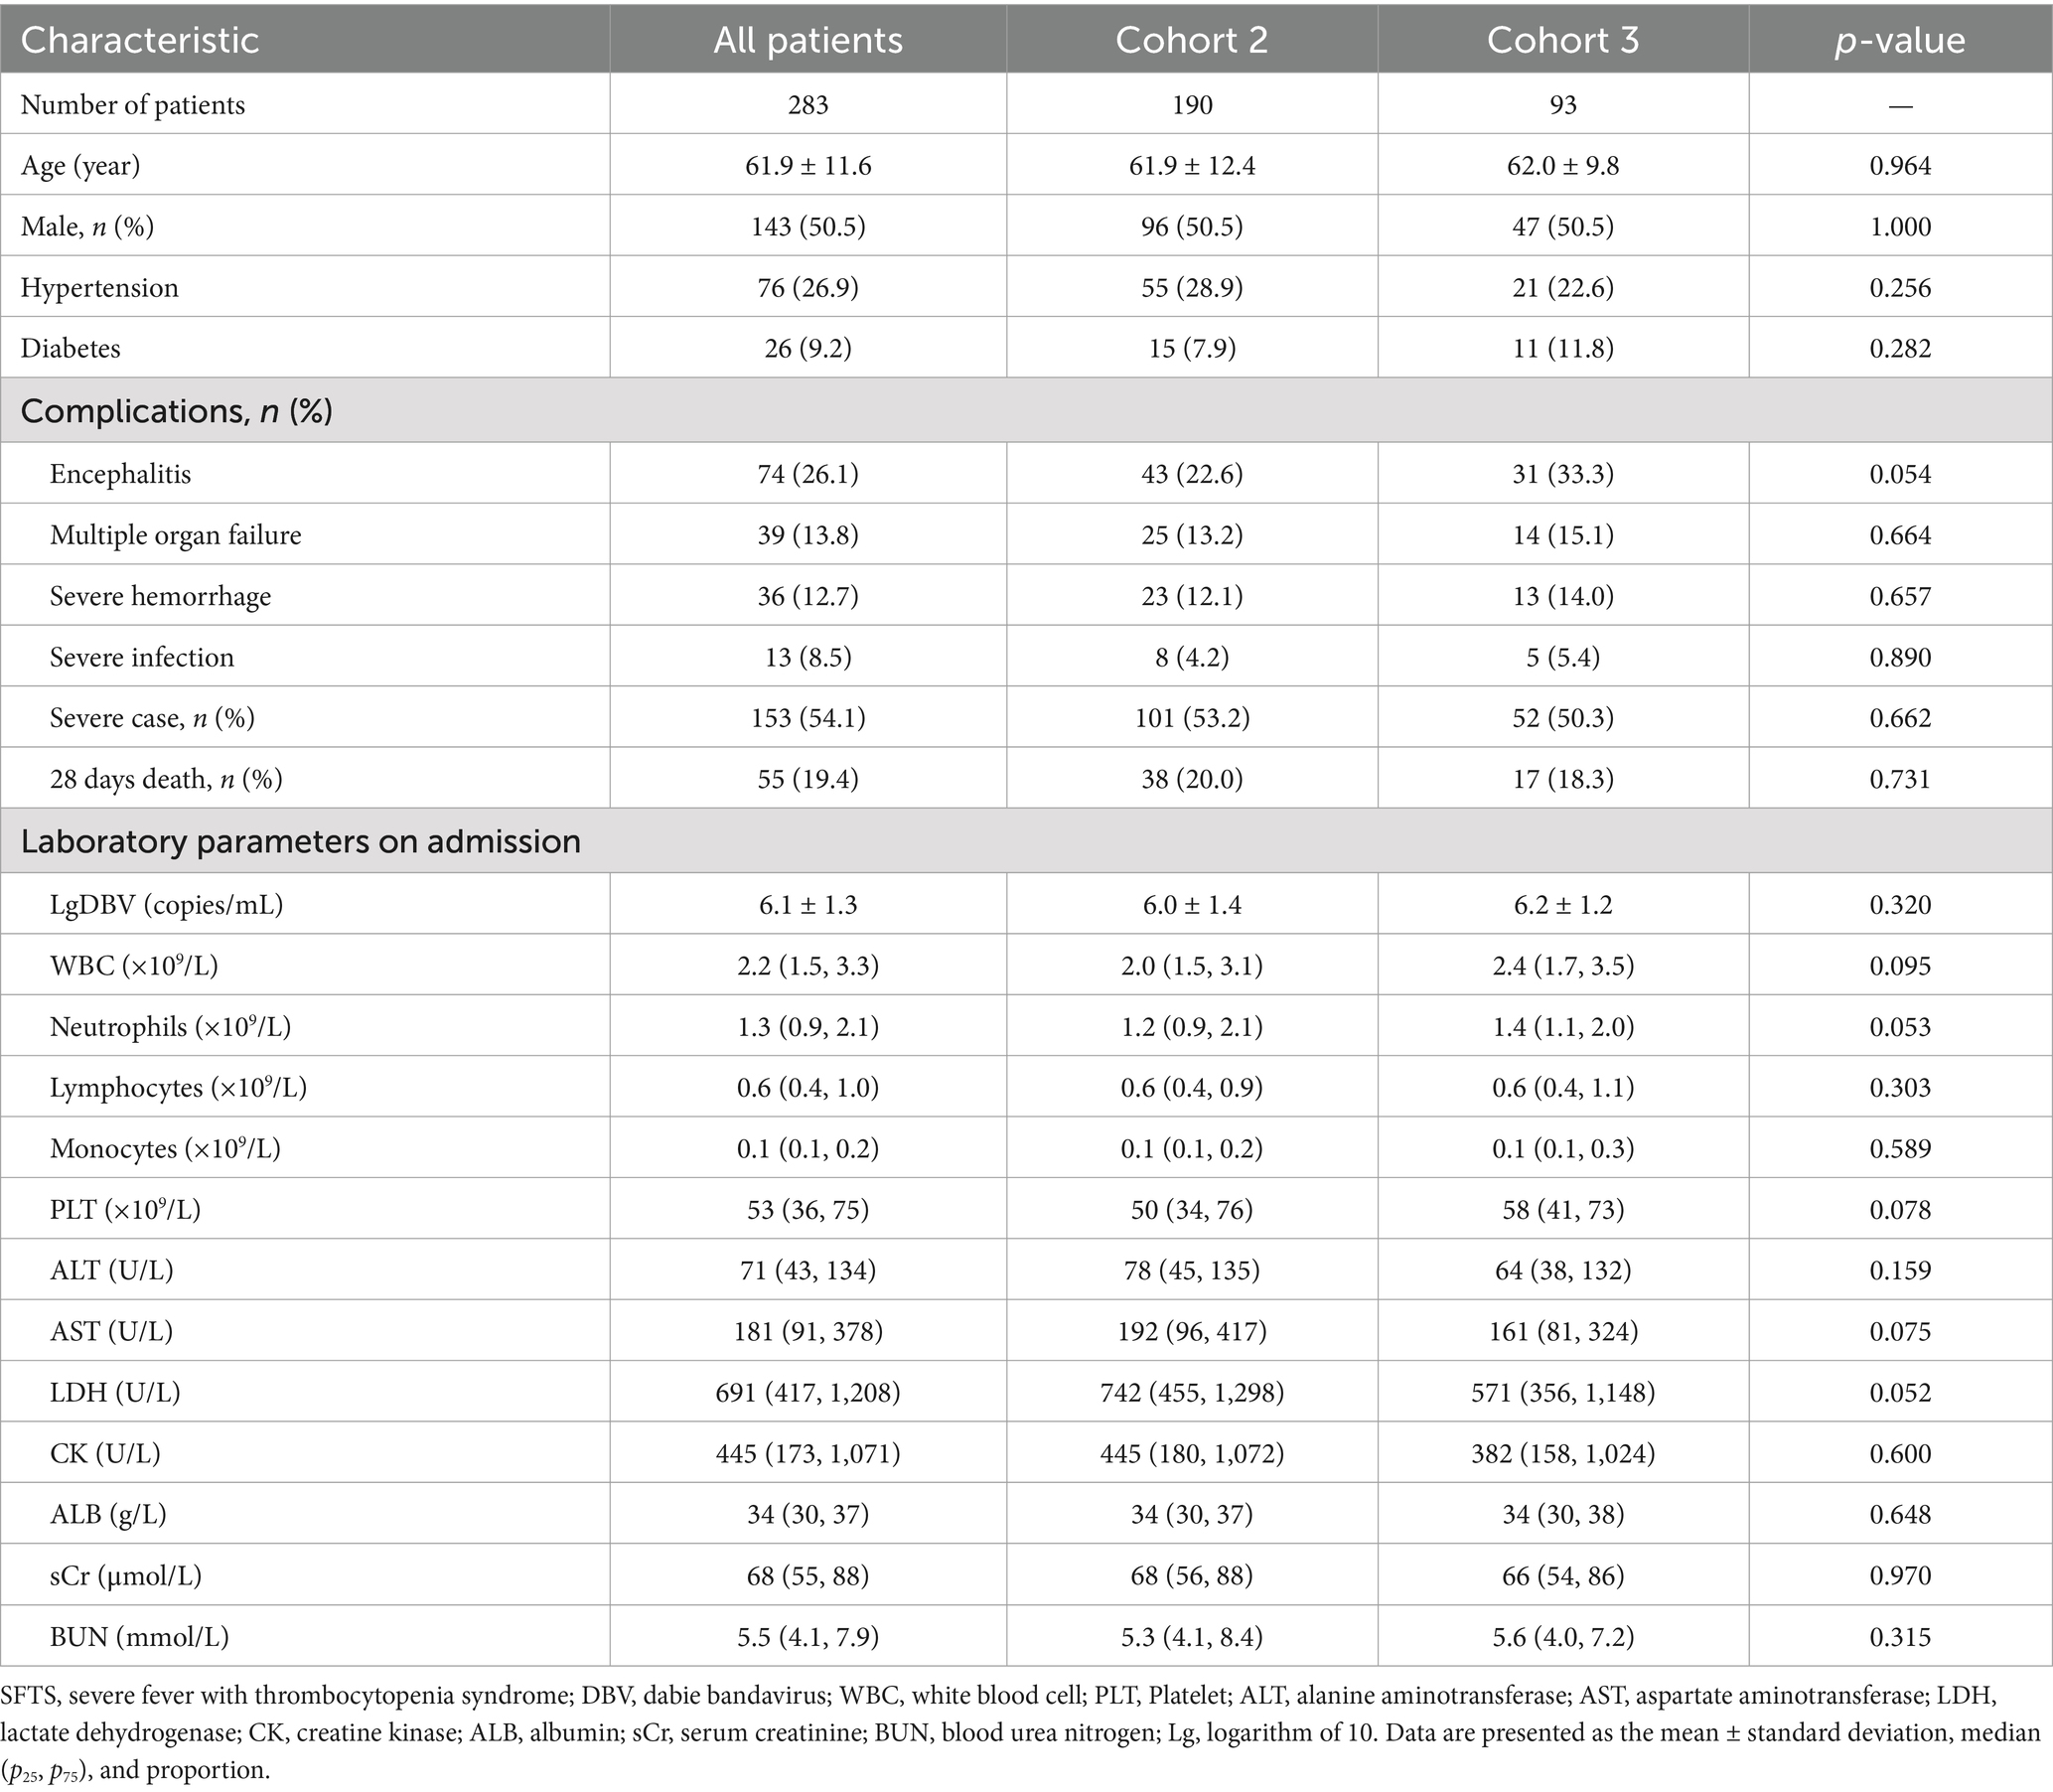
Table 5. Comparison of baseline clinical characteristics in SFTS patients between Cohort 2 and Cohort 3.
SFTS was considered one of the most challenging conditions in the realm of newly emerging infectious diseases with high mortality rate. It is of high priority to identify biomarkers that can monitor and predict disease progression. Therefore, our study recruited a large sample of SFTS patients to validate the potential biomarkers discovered by plasma DIA proteomics and observed its dynamic changes at different stages of the disease course. Finally, we observed that elevated levels of HSP90α, VCAM1, PSMA1, and NID1 were positively associated with multi-organ dysfunction and disease deterioration. More importantly, the prediction model of P5 developed based on plasma protein biomarkers and clinic data had an effective predictive efficacy for severe illness. SFTS patients in the early stage with P5 score greater than 0.393 had a high risk of death within 28-days after onset. Our findings provide clinicians with an assessment method to early identify SFTS patients at high risk of developing severe or fatal outcomes, enabling timely guidance for optimal clinical management of SFTS and improving its prognosis.
The previously identified biomarkers and risk factors for the progress of SFTS were almost all clinical or laboratory indicators, and each single biomarker could only indicate damage to one or two specific organs. However, SFTS is characterized by damage in multiple tissues and organs. Thus, although many indicators have been discovered to be associated with severe conditions, such as PLT, LDH, CK, or encephalopathy (Yu, 2018; Wang et al., 2019; Zhao et al., 2022), it still lacks indicators that could indicate multiple tissue damage together. Here, we identified the alterations of plasma proteins including HSP90α, VCAM1, PSMA1, and NID1 well correspond to the severity and progress of patients with SFTS. Those protein biomarkers indeed reflected multiple organ impairment including coagulation disorder, and myocardial, liver, or renal, might serve as valuable predictors for severe patients with SFTS.
It is well known that DBV-mediated excessive inflammation of the host played an important role in the progression of the disease (Sun et al., 2012; Liu Q. et al., 2014). The host’s intense inflammatory response after DBV infection leads to extensive pathological lesions in multiple organs, ultimately causing extreme abnormalities in biochemical parameters and clinical symptoms in SFTS patients (Ding et al., 2014). However, the identified biomarkers initially elevated in plasma and are closely associated with this inflammatory damage in hosts after DBV infection. Among them, HSP90α was demonstrated to participate in the activation and regulation of innate immune responses in pathogen infections (Calderwood et al., 2016; Hoter et al., 2018). It also has been reported that HSP90α could be maintaining the stability of rubella virus proteins that facilitate viral replication in vivo (Sakata et al., 2019). Similarly, another member of the heat shock protein family has also been associated with the severity of SFTS in the early stage (Ding et al., 2014). For VCAM1, a cell adhesion glycoprotein primarily expressed on the surface of vascular endothelial cells, acts as a critical regulator of leukocyte adhesion to the endothelium and transendothelial migration (Ou et al., 2008). Previous studies have revealed both DBV virus and host cytokines can induce vascular endothelial injury and barrier dysfunction (Li et al., 2017; Li X. K. et al., 2018). Thus, elevated VCAM1 might indicate excessive immune responses and vascular endothelial injury in patients with SFTS. NID1 is a sulfated glycoprotein that is widely distributed in basement membranes. It plays a crucial role in stabilizing the basement membrane and inducing immune cells chemotaxis (Timpl and Brown, 1996). Certain viruses, such as cytomegalovirus, have been observed to impact the structure and function of the cell basement membrane by altering NID1 expression to facilitate virus dissemination and disease progress (Kuan et al., 2022). Additionally, multiple RNA viruses have been found to modulate the ubiquitin-proteasome system in various mechanisms, including immune evasion, virus entry and release, transcriptional regulation, and inhibition of cell apoptosis (Choi et al., 2013). PSMA1, a subunit of the 20S proteasome involved in the proteasome metabolic pathway, is probably involved in the mechanism mentioned above. Therefore, those proteins, which are primarily involved in immunity, not only can serve as effective predictors in severe patients with SFTS but also might provide insights into potential severe-related pathological mechanisms.
Consistent with previous reports (Gai et al., 2012; Wang Y. et al., 2022), viral load was also the most vital predictor for severe illness in our study. High viremia triggers the activation of immune cells, leading to excessive cytokine storm, resulting in immune imbalance and extensive organ damage that promotes disease progression (Kwon et al., 2018; Yang et al., 2022). Our study also found that the myocardial cell injury parameter CK was an important indicator for predicting severe SFTS. In the multiple organ dysfunction caused by DBV infection, the myocardial serves as the primary target tissue, early deterioration of the cardiac usually indicates a more severe condition, which has been confirmed in many previous studies (Cui et al., 2012; Cui et al., 2015; Yu, 2018; He et al., 2021; Wang et al., 2021; Song et al., 2022). The possible reasons were linked to dramatic inflammatory damage caused by the pathogens. Additionally, the direct replication of the virus in organs might be another contributing factor. DBV virus replication in the heart was observed in pathological tissues of deceased patients with SFTS, as well as in animal models (Hiraki et al., 2014; Liu Y. et al., 2014).
It should be noted that our prediction model was developed based on proteomic and clinical parameters at the time of early stage, some clinical symptoms that cannot be fully confirmed to occur at this time were excluded from this study. However, although the patients were not all admitted at an early stage in actual clinical practice, the correlation of protein markers alternation with the change of the state of illness, we believe that sequential measurements of these protein biomarkers in SFTS patients also provide molecular trajectories toward convalescence or deterioration, thus to broaden the utilization of the current early-stage-based model. We also emphasize that our study has produced a wealth of potential biomarkers highly correlated with SFTS, only a few were included in the final model. However, we should not underestimate the potential value and biological effects of the rest candidates that were not integrated into our predictive model. We anticipate that further exploratory basic research based on proteomics by our team will thoroughly reveal the specific molecular mechanisms of these protein markers. Furthermore, our study sample was exclusively from a single center in a tertiary hospital and may not be fully representative of the overall population. Therefore, although our study systematically revealed the proteomic alternations and developed an early effective prediction model for severe cases, a multicenter approach to subject recruitment for validating the value of the model would be preferable.
In summary, the proteomics discovered in our research sheds light on the potential pathogenesis of patients with SFTS. The prediction model developed based on protein biomarkers has demonstrated outstanding predictive performance in predicting the occurrence of severe illness. This model aids physicians in the early identification of high-risk patients and merits more attention on them, and in formulating optimal clinical strategies to avoid adverse outcomes.
The datasets presented in this study can be found in online repositories. The names of the repository/repositories and accession number(s) can be found in the article/Supplementary material.
The studies involving humans were approved by Research and Ethics Committee of the First Affiliated Hospital of Nanjing Medical University, Nanjing, China. The studies were conducted in accordance with the local legislation and institutional requirements. Written informed consent for participation in this study was provided by the participants’ legal guardians/next of kin.
QZ: Formal analysis, Investigation, Methodology, Project administration, Software, Validation, Visualization, Writing – original draft, Writing – review & editing. ZJ: Writing – review & editing, Formal analysis, Validation. NJ: Writing – review & editing, Data curation, Methodology. LS: Writing – review & editing. JgZ: Writing – review & editing. JeZ: Writing – review & editing. KO: Writing – review & editing. HH: Writing – review & editing. YZ: Writing – review & editing. YD: Writing – review & editing. NH: Writing – review & editing. PS: Writing – review & editing. YH: Writing – review & editing. KJ: Writing – review & editing. JL: Writing – review & editing, Funding acquisition.
The author(s) declare that financial support was received for the research, authorship, and/or publication of this article. This work was supported by grants from the National Natural Science Foundation of China (81871242).
The authors declare that the research was conducted in the absence of any commercial or financial relationships that could be construed as a potential conflict of interest.
The authors declare that no Gen AI was used in the creation of this manuscript.
All claims expressed in this article are solely those of the authors and do not necessarily represent those of their affiliated organizations, or those of the publisher, the editors and the reviewers. Any product that may be evaluated in this article, or claim that may be made by its manufacturer, is not guaranteed or endorsed by the publisher.
The Supplementary material for this article can be found online at: https://www.frontiersin.org/articles/10.3389/fmicb.2025.1514388/full#supplementary-material
Calderwood, S. K., Gong, J., and Murshid, A. (2016). Extracellular HSPs: the complicated roles of extracellular HSPs in immunity. Front. Immunol. 7:159. doi: 10.3389/fimmu.2016.00159
Chen, G., Chen, T., Shu, S., Ma, K., Xiaojing, W., Wu, D., et al. (2022). Expert consensus on diagnosis and treatment of severe fever with thrombocytopenia syndrome. Infect. Dis. Inform. 35, 385–393. doi: 10.3969/j.issn.1007-8134.2022.05.001
Chen, Q., Yang, D., Zhang, Y., Zhu, M., Chen, N., and Yushan, Z. (2022a). Transmission and mortality risk assessment of severe fever with thrombocytopenia syndrome in China: results from 11-years’ study. Infect. Dis. Poverty 11:93. doi: 10.1186/s40249-022-01017-4
Chen, Q., Zhu, M., Chen, N., Yang, D., Wen, W., Mu, D., et al. (2022b). Epidemiological characteristics of severe fever with thtrombocytopenia syndrome in China, 2011–2021. Chin. J. Epidemiol. 43, 852–859. doi: 10.3760/cma.j.cn112338-20220325-00228
Choi, A. G., Wong, J., Marchant, D., and Luo, H. (2013). The ubiquitin-proteasome system in positive-strand RNA virus infection. Rev. Med. Virol. 23, 85–96. doi: 10.1002/rmv.1725
Cui, N., Liu, R., Lu, Q. B., Wang, L. Y., Qin, S. L., Yang, Z. D., et al. (2015). Severe fever with thrombocytopenia syndrome bunyavirus-related human encephalitis. J. Infect. 70, 52–59. doi: 10.1016/j.jinf.2014.08.001
Cui, N., Yang, Z. D., Wang, B. J., Fan, X. J., and Yuan, C. (2012). The clinical characteristics of 169 cases of severe fever with thrombocytopenia syndrome. Zhonghua Nei Ke Za Zhi 51, 755–758. doi: 10.3760/cma.j.issn.0578-1426.2012.10.005
Ding, Y. P., Liang, M. F., Ye, J. B., Liu, Q. H., Xiong, C. H., Long, B., et al. (2014). Prognostic value of clinical and immunological markers in acute phase of SFTS virus infection. Clin. Microbiol. Infect. 20, O870–O878. doi: 10.1111/1469-0691.12636
Gai, Z. T., Zhang, Y., Liang, M. F., Jin, C., Zhang, S., Zhu, C. B., et al. (2012). Clinical progress and risk factors for death in severe fever with thrombocytopenia syndrome patients. J. Infect. Dis. 206, 1095–1102. doi: 10.1093/infdis/jis472
He, F., Zheng, X., and Zhang, Z. (2021). Clinical features of severe fever with thrombocytopenia syndrome and analysis of risk factors for mortality. BMC Infect. Dis. 21:1253. doi: 10.1186/s12879-021-06946-3
Hiraki, T., Yoshimitsu, M., Suzuki, T., Goto, Y., Higashi, M., Yokoyama, S., et al. (2014). Two autopsy cases of severe fever with thrombocytopenia syndrome (SFTS) in Japan: a pathognomonic histological feature and unique complication of SFTS. Pathol. Int. 64, 569–575. doi: 10.1111/pin.12207
Hoter, A., El-Sabban, M. E., and Naim, H. Y. (2018). The HSP90 family: structure, regulation, function, and implications in health and disease. Int. J. Mol. Sci. 19:2560. doi: 10.3390/ijms19092560
Kuan, M. I., Caruso, L. B., Zavala, A. G., Rana, P., O'Dowd, J. M., Tempera, I., et al. (2022). Human cytomegalovirus utilizes multiple viral proteins to regulate the basement membrane protein nidogen 1. J. Virol. 96:e0133622. doi: 10.1128/jvi.01336-22
Kwon, J. S., Kim, M. C., Kim, J. Y., Jeon, N. Y., Ryu, B. H., Hong, J., et al. (2018). Kinetics of viral load and cytokines in severe fever with thrombocytopenia syndrome. J. Clin. Virol. 101, 57–62. doi: 10.1016/j.jcv.2018.01.017
Lee, S. Y., Yun, S. H., Lee, H., Lee, Y. G., Seo, G., Kim, N. H., et al. (2022). Serum proteomics of severe fever with thrombocytopenia syndrome patients. Clin. Proteomics 19:32. doi: 10.1186/s12014-022-09368-8
Li, H., Lu, Q. B., Xing, B., Zhang, S. F., Liu, K., Du, J., et al. (2018). Epidemiological and clinical features of laboratory-diagnosed severe fever with thrombocytopenia syndrome in China, 2011–2017: a prospective observational study. Lancet Infect. Dis. 18, 1127–1137. doi: 10.1016/S1473-3099(18)30293-7
Li, J., and Wang, G. (2022). Consensus on the diagnosis and treatment of severe fever with thrombocytopenia syndrome. Chin. J. Infect. Dis. 40, 711–721. doi: 10.3760/cma.j.cn311365-20221017-00425
Li, X. K., Yang, Z. D., Du, J., Xing, B., Cui, N., Zhang, P. H., et al. (2017). Endothelial activation and dysfunction in severe fever with thrombocytopenia syndrome. PLoS Negl. Trop. Dis. 11:e0005746. doi: 10.1371/journal.pntd.0005746
Li, X. K., Zhang, S. F., Xu, W., Xing, B., Lu, Q. B., Zhang, P. H., et al. (2018). Vascular endothelial injury in severe fever with thrombocytopenia syndrome caused by the novel bunyavirus. Virology 520, 11–20. doi: 10.1016/j.virol.2018.05.001
Liu, Q., He, B., Huang, S. Y., Wei, F., and Zhu, X. Q. (2014). Severe fever with thrombocytopenia syndrome, an emerging tick-borne zoonosis. Lancet Infect. Dis. 14, 763–772. doi: 10.1016/S1473-3099(14)70718-2
Liu, Y., Wu, B., Paessler, S., Walker, D. H., Tesh, R. B., and Yu, X. J. (2014). The pathogenesis of severe fever with thrombocytopenia syndrome virus infection in alpha/beta interferon knockout mice: insights into the pathologic mechanisms of a new viral hemorrhagic fever. J. Virol. 88, 1781–1786. doi: 10.1128/JVI.02277-13
Nam, H.-K., Min, K.-D., Jo, S., and Cho, S.-I. (2023). Association of deforestation with severe fever with thrombocytopenia syndrome. J. Infect. Dis. 228, 1730–1738. doi: 10.1093/infdis/jiad196
Ou, R., Zhang, M., Huang, L., Flavell, R. A., Koni, P. A., and Moskophidis, D. (2008). Regulation of immune response and inflammatory reactions against viral infection by VCAM-1. J. Virol. 82, 2952–2965. doi: 10.1128/JVI.02191-07
Peng, C., Wang, H., Zhang, W., Zheng, X., Tong, Q., Jie, S., et al. (2016). Decreased monocyte subsets and TLR4-mediated functions in patients with acute severe fever with thrombocytopenia syndrome (SFTS). Int. J. Infect. Dis. 43, 37–42. doi: 10.1016/j.ijid.2015.12.009
Ren, Y., He, Q.-Y., Fan, J., Jones, B., Zhou, Y., Xie, Y., et al. (2004). The use of proteomics in the discovery of serum biomarkers from patients with severe acute respiratory syndrome. Proteomics 4, 3477–3484. doi: 10.1002/pmic.200400897
Sakata, M., Katoh, H., Otsuki, N., Okamoto, K., Nakatsu, Y., Lim, C. K., et al. (2019). Heat shock protein 90 ensures the integrity of rubella virus p150 protein and supports viral replication. J. Virol. 93:e0114219. doi: 10.1128/JVI.01142-19
Shu, T., Ning, W., Wu, D., Xu, J., Han, Q., Huang, M., et al. (2020). Plasma proteomics identify biomarkers and pathogenesis of COVID-19. Immunity 53, 1108–1122.e5. doi: 10.1016/j.immuni.2020.10.008
Song, L., Zhao, Y., Wang, G., Huang, D., and Sai, L. (2022). Analysis of risk factors associated with fatal outcome among severe fever with thrombocytopenia syndrome patients from 2015 to 2019 in Shandong, China. Eur. J. Clin. Microbiol. Infect. Dis. 41, 1415–1420. doi: 10.1007/s10096-022-04506-4
Sun, Y., Jin, C., Zhan, F., Wang, X., Liang, M., Zhang, Q., et al. (2012). Host cytokine storm is associated with disease severity of severe fever with thrombocytopenia syndrome. J. Infect. Dis. 206, 1085–1094. doi: 10.1093/infdis/jis452
Timpl, R., and Brown, J. C. (1996). Supramolecular assembly of basement membranes. BioEssays 18, 123–132. doi: 10.1002/bies.950180208
Walker, P. J., Siddell, S. G., Lefkowitz, E. J., Mushegian, A. R., Dempsey, D. M., Dutilh, B. E., et al. (2019). Changes to virus taxonomy and the international code of virus classification and nomenclature ratified by the international committee on taxonomy of viruses (2019). Arch. Virol. 164, 2417–2429. doi: 10.1007/s00705-019-04306-w
Wang, B., He, Z., Yi, Z., Yuan, C., Suo, W., Pei, S., et al. (2021). Application of a decision tree model in the early identification of severe patients with severe fever with thrombocytopenia syndrome. PLoS One 16:e0255033. doi: 10.1371/journal.pone.0255033
Wang, Y., Song, Z., Wei, X., Yuan, H., Xu, X., Liang, H., et al. (2022). Clinical laboratory parameters and fatality of severe fever with thrombocytopenia syndrome patients: a systematic review and meta-analysis. PLoS Negl. Trop. Dis. 16:e0010489. doi: 10.1371/journal.pntd.0010489
Wang, L., Wan, G., Shen, Y., Zhao, Z., Lin, L., Zhang, W., et al. (2019). A nomogram to predict mortality in patients with severe fever with thrombocytopenia syndrome at the early stage-a multicenter study in China. PLoS Negl. Trop. Dis. 13:e0007829. doi: 10.1371/journal.pntd.0007829
Wang, Y. N., Zhang, Y. F., Peng, X. F., Ge, H. H., Wang, G., Ding, H., et al. (2022). Mast cell-derived proteases induce endothelial permeability and vascular damage in severe fever with thrombocytopenia syndrome. Microbiol. Spectr. 10:e0129422. doi: 10.1128/spectrum.01294-22
Wee, S., Alli-Shaik, A., Kek, R., Swa, H. L. F., Tien, W. P., Lim, V. W., et al. (2019). Multiplex targeted mass spectrometry assay for one-shot flavivirus diagnosis. Proc. Natl. Acad. Sci. U.S.A. 116, 6754–6759. doi: 10.1073/pnas.1817867116
Yamada, S., Shimojima, M., Narita, R., Tsukamoto, Y., Kato, H., Saijo, M., et al. (2018). RIG-I-like receptor and Toll-like receptor signaling pathways cause aberrant production of inflammatory cytokines/chemokines in a severe fever with thrombocytopenia syndrome virus infection mouse model. J. Virol. 92, e02246–e02217. doi: 10.1128/JVI.02246-17
Yang, T., Huang, H., Jiang, L., and Li, J. (2022). Overview of the immunological mechanism underlying severe fever with thrombocytopenia syndrome (review). Int. J. Mol. Med. 50:118. doi: 10.3892/ijmm.2022.5174
Yu, X. J. (2018). Risk factors for death in severe fever with thrombocytopenia syndrome. Lancet Infect. Dis. 18, 1056–1057. doi: 10.1016/S1473-3099(18)30312-8
Yu, X. J., Liang, M. F., Zhang, S. Y., Liu, Y., Li, J. D., Sun, Y. L., et al. (2011). Fever with thrombocytopenia associated with a novel bunyavirus in China. N. Engl. J. Med. 364, 1523–1532. doi: 10.1056/NEJMoa1010095
Zhang, Y., Li, L., Liu, Y., Zhang, W., Peng, W., Zhang, S., et al. (2024). Identification of CCL20 as a prognostic predictor for severe fever with thrombocytopenia syndrome based on plasma proteomics. J. Infect. Dis. 230, 741–753. doi: 10.1093/infdis/jiae039
Keywords: severe fever with thrombocytopenia syndrome, proteomics, biomarker, prediction, prognosis
Citation: Zhang Q, Jiang Z, Jiang N, Shi L, Zhao J, Zhao J, Ouyang K, Huang H, Zhang Y, Dai Y, Hu N, Shi P, Han Y, Jin K and Li J (2025) Identification of early prediction biomarkers of severity in patients with severe fever with thrombocytopenia syndrome based on plasma proteomics. Front. Microbiol. 16:1514388. doi: 10.3389/fmicb.2025.1514388
Edited by:
John Shearer Lambert, University College Dublin, IrelandReviewed by:
Keun Hwa Lee, Hanyang University, Republic of KoreaCopyright © 2025 Zhang, Jiang, Jiang, Shi, Zhao, Zhao, Ouyang, Huang, Zhang, Dai, Hu, Shi, Han, Jin and Li. This is an open-access article distributed under the terms of the Creative Commons Attribution License (CC BY). The use, distribution or reproduction in other forums is permitted, provided the original author(s) and the copyright owner(s) are credited and that the original publication in this journal is cited, in accordance with accepted academic practice. No use, distribution or reproduction is permitted which does not comply with these terms.
*Correspondence: Ke Jin, cGVuZ2hhb3JlbjIwMDFAMTI2LmNvbQ==; Jun Li, ZHItbGlqdW5AdmlwLnNpbmEuY29t
Disclaimer: All claims expressed in this article are solely those of the authors and do not necessarily represent those of their affiliated organizations, or those of the publisher, the editors and the reviewers. Any product that may be evaluated in this article or claim that may be made by its manufacturer is not guaranteed or endorsed by the publisher.
Research integrity at Frontiers
Learn more about the work of our research integrity team to safeguard the quality of each article we publish.