 Da Bin Lee
 In Seon Hwang*
- Food and Nutrition Division, Department of Agri-food Resources, National Institute of Agricultural Sciences, Wanju, Republic of Korea
The interactions between macronutrients, the human gut microbiome, and their metabolites (short-chain fatty acids) were comprehensively investigated via an in vitro digestion and fermentation model subjected to eight pulse species. 16S rRNA sequencing and taxonomic analysis of pulse digesta fermented for up to 24 h revealed an increase in the relative abundance of gut health-detrimental genera represented by Escherichia-Shigella in kidney bean, soybean, cowpea, chickpea, and black bean samples. In contrast, the relative abundance of health-positive genera, including Bacteroides, Eubacterium, and Akkermansia, was elevated in red bean, mung bean, and Heunguseul. At the same time, the proportion of the pathogenic Escherichia-Shigella decreased. Concurrently, these three species exhibited an increase in microbial diversity as evidenced by the calculation of α-diversity (Shannon index) and β-diversity (Bray-Curtis distance). Despite the lower nutrient contents in the three pulses, represented by carbohydrates, amino acids, and fatty acids, network analysis revealed that the nutrient contents in the pulse digesta possess complex positive or negative correlations with a variety of bacteria, as well as their metabolites. These correlations were more pronounced in red bean, mung bean, and Heunguseul than in the other pulses. It was postulated that the overall potential to nourish gut environments in these species was due to the balance of their nutritional components. The linear regression analysis demonstrated that there was a negative association between carbohydrate and amino acid contents and the increase in Shannon indices. Furthermore, the ratio of carbohydrates to fatty acids and amino acids to fatty acids displayed negative correlations with the diversity increase. The ratio of carbohydrates to amino acids showed a weak positive correlation. It is noteworthy that a diet comprising foods with a balanced nutritional profile supports the growth of beneficial gut microbes, thereby promoting microbial eubiosis. Consistent work on different ingredients is essential for precise insight into the interplay between food and the human microbiome in complex dietary patterns.
1 Introduction
In response to the growing efforts of various industries to achieve carbon neutrality amidst climate change, the food industry has witnessed a notable surge in demand for plant-based diets as alternatives to conventional animal-derived foods (Sandua, 2024). In comparison to animal-based foods, those derived from plants are rich in phytochemicals, micronutrients, and dietary fibers. Additionally, they contain minimal amounts of saturated fats and trans fats, which have been linked to adverse effects on cardiovascular health (Gong et al., 2020). However, plant-based foods have certain limitations. For instance, they often have restricted amount of micronutrients that are predominantly found in meat or seafood, as well as a lower quantity and quality of protein (Tso and Forde, 2021).
To address these shortcomings, pulses have been employed extensively as a pivotal ingredient in plant-based diets. In addition to their high protein and dietary fiber content, pulses contain beneficial unsaturated fatty acids, such as omega-3, which qualifies them as a nutritionally valuable food source (Karolkowski et al., 2021; Didinger and Thompson, 2022). Globally, pulse products are widely consumed, with notable examples including tofu, natto, tempeh, and soy sauce. Given the recent interest in the gut microbiome as a key factor for maintaining human health, there is a growing recognition of the potential of fermented foods made from pulses to nurture the growth of beneficial bacteria, including Streptococcus sp. and Faecalibacterium sp. (Valentino et al., 2024). This is attributed to the presence of prebiotic components, such as polysaccharides, and probiotic species that are abundant in these foods.
To elucidate the precise relationship between food and the microbiome, it is essential to identify the impacts of each ingredient, before the combinations of foods, on the growth or reduction of gut bacteria. One of the limiting factors of exploiting microbiome-informed precision nutrition strategies is the difficulty of identifying the effect of a single food in our complex dietary intake (Valles-Colomer et al., 2023). As complex individual diets in clinical studies hinder the comprehension of the effects of specific dietary components on the gut microbiota, dietary metadata is needed for the advancement of microbiome-targeted therapies (Ross et al., 2024). However, there is a paucity of knowledge regarding how food ingredients, in addition to a single nutrient or dietary pattern, influence the gut microbiota. A number of recent studies have consistently reported that the intake of dietary fibers and polysaccharides from food consumption (Deehan et al., 2020; Coker et al., 2021) or certain diet types, such as the Mediterranean diet (Meslier et al., 2020; Rinott et al., 2022), can improve the diversity of the human microbiome and support the proliferation of beneficial bacteria, thereby exerting positive health effects.
This approach presents a challenge in current practices due to the inherent limitations of the self-reporting dietary assessment technique, which is dependent on an individual’s memory (Johnson et al., 2020). To overcome these challenges and assess the specific impact of individual ingredients on the human microbiome, an in vitro digestion and colonic fermentation method was developed by multiple researchers (Xavier and Mariutti, 2021). This system simulates the digestive process of food through the human mouth, upper gastrointestinal tract, and colonic fermentation process under controlled conditions, thereby providing standardized results in a time- and cost-effective manner compared to human trials. Consequently, the system allows for the rapid and accurate evaluation of the effects of a variety of daily consumed ingredients on the gut microbiota. As the INFOGEST protocol has been validated for in vitro digestion studies of foods, it has been utilized in current studies examining a range of food items, such as leafy vegetables and pulses (Lee et al., 2019; Kim et al., 2021; Bae et al., 2021). Meanwhile, the final destination of consumed food, gut fermentation, has not been sufficiently investigated in the majority of research, which has been limited to the simulation of the digestion process and the measurement of the bioaccessibility of food ingredients. The combined model of in vitro digestion and gut fermentation system allows for the prediction of the ultimate health effects of food consumption.
This study aimed to investigate the impact of commonly consumed pulses in Korea on the human gut microbiota and metabolite profiles. Pulses constitute a principal component of the Korean diet, with a diverse range of pulses being consumed in Korea. In this study, the following pulses were selected as analytic samples: soybean, kidney bean, cowpea, black bean, red bean, mung bean, Heunguseul, and chickpea. The last one is a non-domestic species whose consumption has recently increased, though it is not cultivated in Korea. The digested products of pulses prepared using an in vitro digestion model were cultured in an in vitro gut fermentation model simulating the human colon environment to observe the effects on gut microbiota. Modifications were made to the INFOGEST protocol in order to accurately simulate the digestion of nutrients. These included the addition of the BBMV (brush border membrane vesicles) enzyme, which was extracted from the porcine small intestine and subjected in the final stage of digestion. Furthermore, given that pulses are a food source that typically contains macronutrients (carbohydrates, proteins, and fats), the study also analyzed the interrelationships between these components in pulses and changes in the gut microbiota, as well as their metabolites. This was done to ascertain the nutritional factors that contribute to the prebiotic effects of pulse samples.
2 Materials and methods
2.1 Preparing pulses in edible form
Eight types of pulses commonly consumed in Korea were selected for analysis as follows: soybeans (Glycine max, SB), kidney beans (Phaseolus vulgarius, KB), cowpeas (Vigna unguiculata, CB), chickpeas (Cicer arietinum, CP), black beans (Rhynchosia nulubilis, BB), mung beans (Vigna radiate, MB), Heunguseul (Vigna anaularis L. Heunguseul, HS), and red beans (Vigna anaularis L., RB). The samples were prepared in a consumable form by applying the most common cooking methods suggested by the National Standard Food Composition Table (provided by the Rural Development Administration, 10th version). Consequently, each sample was subjected to either boiling or stir-frying, with the specific methods outlined as follows: The SBs (Sangju, Gyeongsangbuk-do, Korea) were boiled for 40 min in water at three times their weight after a 4-hour soaking. CBs (Gurye, Jeollanam-do, Korea) were boiled for 50 min in water at 10 times their weight after soaking for 8 h. The KBs (Geochang, Gyeongsangnam-do, Korea), HSs (Wanju, Jeollabuk-do, Korea), MBs (Muan, Jeollanam-do, Korea), and RBs (Muan, Jeollanam-do, Korea) were boiled for 1 h in water at 10 times of their weight without prior soaking. The CP samples (USA) were boiled for 15 min in water at 10 times their weight, following a 6-hour soaking. The roasted BBs (Sangju, Gyeongsangbuk-do, Korea) were obtained from a commercial market.
2.2 Simulated digestion using in vitro gastrointestinal model
A gastrointestinal model was constructed and simulated to examine the alteration of nutrient contents throughout the digestive process, which encompasses the oral, gastric, intestinal, and BBMV phases (Minekus et al., 2014). In the oral phase, cooked pulses were mixed with a 1:1 solution of simulated salivary fluid (KCl (Potassium chloride P9333, Sigma Aldrich Co, Seoul, Korea) 15.1 mmol/L, KH2PO4 (Potassium phosphate monobasic P0662, Sigma Aldrich Co.) 3.7 mmol/L, NaHCO3 (Sodium bicarbonate S5761, Sigma Aldrich Co.) 13.6 mmol/L, MgCl2(H2O)6 (Magnesium chloride hexahydrate 63,068, Sigma Aldrich Co.) 0.15 mmol/L, (NH4)2CO3 (Ammonium carbonate 207,861, Sigma Aldrich Co.) 0.06 mmol/L, pH 7.0) and enzyme (75 U/mL salivary α-amylase solution (α-Amylase from human saliva A0521, Sigma Aldrich Co.), 0.3 M CaCl2 (Calcium chloride C1016, Sigma Aldrich Co.), water). The solution was digested at 37°C for 2 min. The gastric phase entailed the mixture of the oral digested samples and a 1:1 solution of simulated gastric fluid (KCl 6.9 mmol/L, KH2PO4 0.9 mmol/L, NaHCO3 25 mmol/L, NaCl (Sodium chloride S9888, Sigma Aldrich Co.) 47.2 mmol/L, MgCl2(H2O)6 0.1 mmol/L, (NH4)2CO3 0.5 mmol/L, pH 3.0) and enzyme (2000 U/mL porcine pepsin stock solution (Pepsin from porcine gastric mucosa P7000, Sigma Aldrich Co.), 0.3 M CaCl2, 1 M HCl (Hydrochloric acid 4095–3705, Daejung, Seoul, Korea), water). The solution was incubated at 37°C for 120 min. Similarly, the intestinal phase was conducted through the mixing of gastric digested samples with a 1:1 solution of simulated intestinal fluid (KCl 6.8 mmol/L, KH2PO4 0.8 mmol/L, NaHCO3 85 mmol/L, NaCl 38.4 mmol/L, MgCl2(H2O)6 0.33 mmol/L, (NH4)2CO3 0.6 mmol/L, pH 7.0) and enzyme (200 U/mL pancreatin from porcine pancreas [Pancreatin from porcine pancreas P7545, Sigma Aldrich Co.]), 160 mM bile salts (Bile extract porcine B8631, Sigma Aldrich Co.), 0.3 M CaCl2, water and reacting at 37°C for 120 min. As the final digestive phase, 77.3 U/mL of BBMV was added for the digesta to react at 37°C for 180 min (Oku et al., 2011). Subsequently, the mixture was heated at 100°C for 10 min to inhibit further digestion.
2.3 Dialysis process
The samples that underwent in vitro digestion were collected and placed in a 1 kDa molecular weight cut-off cellulose membrane (Spectra/Por® 6 Standard RC Pre-Wetted Dialysis Tubing). They were then soaked in 10 mM NaCl at 37°C for 24 h to remove low-molecular-weight components (Shiowatana et al., 2006; Bouayed et al., 2011; Hettiarachchi et al., 2021). Once the dialysis process was complete, the digested material was transferred to the in vitro gut fermentation model.
2.4 Determination of the nutrient content in digested pulses
The cooked pulses were subjected to oral, gastric, small intestinal digestion, and dialysis phases, and the major nutrient contents of each fully digested pulse sample were analyzed. A total of six types of saccharides, including oligosaccharides, disaccharides, and monosaccharides, were determined. In addition, 22 essential and non-essential amino acids and 6 fatty acids were quantified. These nutrients serve as energy sources for the gut microbiota in the simulated human gut, and the analysis data were used to examine the correlation between nutrient content and microbial growth.
2.4.1 Analysis of free saccharides in digested samples
The levels of six free saccharides were determined for the pulse samples treated by the digestion and dialysis process. All samples were filtered (0.45 μm) and were analyzed using a Dionex Ultimate 3,000 (Thermo Dionex, Germany) and Sugar-pak (Waters, 300 mm × 6.5 mm) column. Standards for glucose (Junsei chem, 98%), galactose (Sigma, 99%), arabinose (Aldrich, 99%), xylose (Aldrich, 99%), fructose (Sigma, 99%), mannose (Sigma, 99%), sucrose (Sigma, 99.5%), maltose monohydrate (Junsei chem, 99%), lactose monohydrate (Junsei chem, 99%), raffinose (Sigma, 99%), and stachyose (Sigma, 99%) were used.
2.4.2 Analysis of free amino acids in digested samples
Twenty-two amino acids were quantified for the digested samples. They were diluted with a buffer (0.1 M perchloric acid, 0.1% meth-phosphoric acid) for ultrasonic extraction for 1 h and were homogenized for 1 h at room temperature. Samples were filtered (0.2 μm) and were analyzed on a Dionex Ultimate 3,000 (Thermo Dionex, Germany) and Inno C18 column (Younjin biochrom, 4.6 mm × 150 mm, 5 μm). Standards for aspartic acid (Asp, Agilent 5061-3330), glutamic acid (Glu, Agilent 5061-3330), serine (Ser, Agilent 5061-3330), histidine (His, Agilent 5061-3330), glycine (Gly, Agilent 5061-3330), threonine (Thr, Agilent 5061-3330), alanine (Ala, Agilent 5061-3330), arginine (Arg, Agilent 5061-3330), GABA (Sigma), taurine (Tau, Sigma), tyrosine (Tyr, Agilent 5061-3330), valine (Val, Agilent 5061-3330), methionine (Met, Agilent 5061-3330), phenylalanine (Phe, Agilent 5061-3330), isoleucine (Ile, Agilent 5061-3330), leucine (Leu, Agilent 5061-3330), lysine (Lys, Agilent 5061-3330), proline (Pro, Agilent 5061-3330), cysteine (Cys, Agilent 5061-3330), glutamine (Gln, Agilent 5062-2478), asparagine (Asn, Agilent 5062-2478), and tryptophan (Trp, Agilent 5062-2478) were used.
2.4.3 Analysis of free fatty acids in digested samples
The amounts of six fatty acids (palmitic acid, stearic acid, arachidic acid, oleic acid, linoleic acid, α-linolenic acid [Supelco 37 Component FAME Mix, Supelco, United States)] were determined. Freeze-dried samples were mixed with 340 μL of methylation mixture (MeOH: benzen: DMP: H2SO4 = 39:20:5:2) and 200 μL of heptane for extraction at 80°C for 2 h. The supernatants were analyzed at room temperature using an Agilent 7890A GC–MS (Agilent, USA) and a DB-23 column (Agilent, 60 mm × 0.25 mm × 0.25 mm). FID (280°C, H2 35, Air 350, He 35 mL/min) was used as the detector.
2.5 Quantification of human microbiome abundance and metabolite contents
2.5.1 In vitro human gut fermentation
The in vitro batch fermentation process was performed according to the method established by Mandalari et al. (2008). The fecal slurry used to simulate the human intestinal environment was the mixture of fresh feces from 10 healthy adults who had not consumed prebiotics or probiotics for 6 months prior to sample collection (approved by the Institutional Review Board of the National Institute of Agricultural Sciences, BR-202307-01). The fecal slurry diluted with 0.1 M PBS at pH 7.0 was left in an anaerobic condition for a period of time, after which the supernatant was injected into the culture medium. The fermentation medium was prepared with peptone water (2 g/L), yeast extract (1 g/L), NaCl (0.1 g/L), K2HPO4 (0.04 g/L), KH2PO4 (0.04 g/L), MgSO4·7H2O (0.01 g/L), CaCl2·2H2O (0.01 g/L), NaHCO3 (2 g/L), bile salts (0.5 g/L), L-cysteine hydrochloride (0.5 g/L), hemin (50 mg/L), vitamin K1(10 μL/L), and Tween 80 (2 mL/L). After 15 mL of the fecal slurry was injected into 135 mL of the medium, pulse digesta was added to make 1% (w/v) of the total mixture, which was fermented under anaerobic conditions maintained by the oxygen-free nitrogen gas (15 mL/min). The fermentation was maintained at pH 6.7 at 37°C, and samples were retrieved every 0, 12, and 24 h. Non-substrate samples were produced as controls in which the pulse digesta was replaced with the distilled water. Additionally, fecal samples collected without the pretreatment process were analyzed for their microbiome abundance to verify that the in vitro model functioned appropriately and reflected the characteristics of the original fecal microbiota.
2.5.2 16S amplicon and shotgun metagenome sequencing for taxonomy analysis
Microbial sequencing and taxonomy profiling were performed by Macrogen, Inc. (Seoul, Korea) and Life Mining Lab., GIST (Gwangju, Korea). DNA was extracted using a DNeasyPowerSoil Kit (Qiagen, Germany) according to the manufacturer’s instructions. The extracted DNA was quantified using Quant-IT PicoGreen (Invitrogen).
For 16S analysis, the sequencing libraries were prepared according to the Illumina 16S Metagenomic Sequencing Library protocols to amplify the V3 and V4 regions. The input gDNA 2 ng was PCR amplified with 5× reaction buffer, 1 mM of dNTP mix, 500 nM each of the universal F/R PCR primer, and Herculase II fusion DNA polymerase (Agilent Technologies, United States). The cycle condition for the first PCR was 3 min at 95°C for heat activation, and 25 cycles of 30 s at 95°C, 30 s at 55°C and 30 s at 72°C, followed by a 5-min final extension at 72°C. The universal primer pair with Illumina adapter overhang sequences used for the first amplifications were as follows: V3-F: 5′-TCGTCGGCAGCGTCAGATGTGTATAAGAGACAGCCTACGGGNGGCWGCAG-3′, V4-R: 5′- GTCTCGTGGGCTCGGAGATGTGTATAAGAGACAGGACTACHVGGGTATCTAATCC-3′. The first PCR product was purified with AMPure beads (Agencourt Bioscience, USA). Following purification, the 2 μL of the first PCR product was PCR amplified for final library construction containing the index using NexteraXT Indexed Primer. The cycle condition for the second PCR was the same as the first except for 10 cycles. The PCR product was purified with AMPure beads. The final purified product was then quantified using qPCR according to the quantification protocol guide (KAPA Library Quantification kits for IlluminaSequencing platforms) and qualified using the TapeStation D1000 ScreenTape (Agilent Technologies, Germany). The paired-end (2 × 300 bp) sequencing was performed by the Macrogen using the MiSeq™ platform (Illumina, USA). After sequencing, Cutadapt (v3.2) was utilized to remove adapter and primer sequences from the raw data, with forward and reverse reads trimmed to 250 bp and 200 bp. To generate Amplicon Sequence Variants (ASV) sequences, the reads were performed error-correction, merging, and denoising processes with DADA2 (v1.18.0). Sequences with expected errors of two or more were excluded. Erroneous reads were denoised based on an established error model. Following error correction, paired-end reads were merged by overlapping. Chimeric sequences were eliminated using the consensus method with the removeBimeraDenovo function in DADA2. ASVs with lengths shorter than 350 bp were filtered out using R (v4.0.3). The resulting ASVs were utilized for downstream analysis using QIIME (v1.9.0). Each ASV was aligned to the organism with the highest similarity in the corresponding Reference Database (NCBI_16S), using algorithms such as Bayesian classifier (DADA2_v1.18.0, confidence value: 50). Alpha and beta diversity metrices were calculated to elucidate the complexity and compositional changes of microbial genus both within and between individual samples. Alpha diversity was employed to quantify the richness and evenness of microbial communities within each sample, while beta diversity was utilized to assess the differences in microbial composition across samples.
For three pulse samples that exhibited a significant increase in genus-level diversity, additional species-level analysis was conducted using Shotgun method. The sequencing libraries were prepared according to the manufacturer’s instructions of TruSeq Nano DNA High Throughput Library Prep Kit (Illumina). Briefly, 100 ng of genomic DNA was sheared using adaptive focused acoustic technology (Covaris) and the fragmented DNA is end-repaired to create 5′-phosphorylated, blunt-ended dsDNA molecules. Following end-repair, DNA was size selected with bead-based method. These DNA fragments go through the addition of a single ‘A’ base, and ligation of the TruSeq DNA UD Indexing adapters. The products are then purified and enriched with PCR to create the final DNA library. The libraries were quantified using qPCR according to the qPCR Quantification Protocol Guide (KAPA Library Quantification kits for Illumina Sequencing platforms) and qualified using the Agilent Technologies 4200 TapeStation D1000 screentape (Agilent technologies). Then we sequenced using the NovaSeq (Illumina). DNA Illumina HiSeq/NovaSeq raw data was demultiplexed by index sequences, and paired-end FASTQ files were generated for each sample after sequencing. Adapter sequences and data with an average phred quality score less than 20 were removed using Trimmomatic (v0.39) of the Kneaddata (v0.10.0) pipeline (option: SLIDINGWINDOW:4:20). Then, bowtie2 (v2.4.5) was used to remove the human genome sequences using the hg37dec_v0.1 reference (Homo sapiens reference genome). The pre-processed data were analyzed using MetaPhlAn4 (v4.0.0) for ~1 million microorganisms composed of NCBI reference genomes and species-level genome bins (SGBs). The reads were mapped to the specific marker genes of the microbial species, and the species abundance was calculated based on the average number of reads mapped to the marker genes. At this time, marker genes that mapped to less than 33% were removed as the species were considered absent. The taxonomic composition derived from the species abundance was presented by Krona (Ondov et al., 2011), a tool for calculating the relative proportions (%) of species within each microbial genus. This analysis served as a reference for the subsequent discussions regarding the potential health implications associated with specific microbial genera.
2.5.3 Analysis of short-chain fatty acids (SCFAs) as microbial metabolites
Acetic acid, butyric acid, and propionic acid in the pulse digesta after intestinal fermentation were determined using HPLC Ultimate3000 (Thermo Dionex, United States) and RI detector (ERC, RefractoMAX520, Japan) at UV 210 nm. 10 μL aliquots of 0, 12, and 24 h fermentation samples were injected onto an ICSep Coregel 87H3 column (7.8 mm × 300 mm, concise separations, United States). The mobile phase was 0.01 N H2SO4 at a flow rate of 0.5 mL/min and an oven temperature of 40°C. Volatile organic acid mixture (AccuStandard FAMQ-004, 10 mM) containing formic, acetic, propionic, isobutyric, butyric, isovaleric, valeric, isocaproic, caproic, and heptanoic acid was the standard material for the analysis.
2.6 Statistical approach
All experiments were conducted in triplicate, and data entry, descriptive statistics, and the construction of bar graphs of the relative abundance of genera for each sample were performed using Microsoft Excel 2016 (Microsoft Corporation, Redmond, Washington, United States). All statistical tests, analyses, and visualizations, except those practiced by Excel were performed using RStudio (2023.12.1. +402 for Windows). To analyze differences in relative microbial abundances during colonic fermentation of digested pulse, a Wilcoxon rank-sum test (at the 95% confidence level) was used. For comparisons of α-diversity and β-diversity, the Shannon index (SI) was calculated for 0, 12, and 24 h fermentation samples of each pulse sample, and Bray-Curtis distances were used for multidimensional scaling (MDS) visualization. Significant differences in the nutrient contents and the SIs between samples were tested by ANOVA and Tukey’s method (p < 0.05) and presented in a box plot. Principal component analysis (PCA) was performed to identify the distribution of nutrient content—carbohydrates, amino acids, and fatty acids—within the digested pulse samples, selecting principal components with an accumulated variance greater than 80% and generating a biplot expressing loadings and scores. Primary variables for the network analysis were chosen from the factor analysis conducted on the carbohydrates, amino acid, and fatty acid content, as well as on the difference in absolute microbial abundance between 0 h and 12 h samples. Variables with a loading of ≥0.5 were selected, and only edges with a correlation >0.5 were included in the positive correlation network, while edges with a correlation < −0.5 were included in the negative correlation network. The centrality of each variable in the network analysis was calculated and represented by the size of the nodes. Communities within the network were identified using the Infomap method and displayed in different colors.
3 Results
3.1 Free carbohydrate, amino acid, and fatty acid contents in digested pulses
The degraded forms of carbohydrates in the pulses subjected to digestion were quantified, followed by the oral, gastric, small intestinal phases, and dialysis phases (Supplementary Table S1). During the digestive process, carbohydrates with high molecular weight were broken down into monosaccharides, and most of the low molecular weight compounds were eliminated by dialysis. However, some undigested oligosaccharides, such as stachyose, remained in the samples. The stachyose content in the digested samples of CB, CP, and BB was 63.84 ± 1.80 μg, 58.56 ± 0.99 μg, and 42.17 ± 0.45 μg, respectively, while 9.14 ± 0.57 μg of raffinose remained only in the digested BB. The monosaccharide glucose was detected in the digested samples of KB, CP, and CB at concentrations of 246.77 ± 1.93 μg, 228.95 ± 1.24 μg, and 206.96 ± 0.77 μg, respectively. Based on the PCA biplot (Figure 1A), samples other than KB, CP, CB, and BB contained relatively lower amounts of free saccharides.
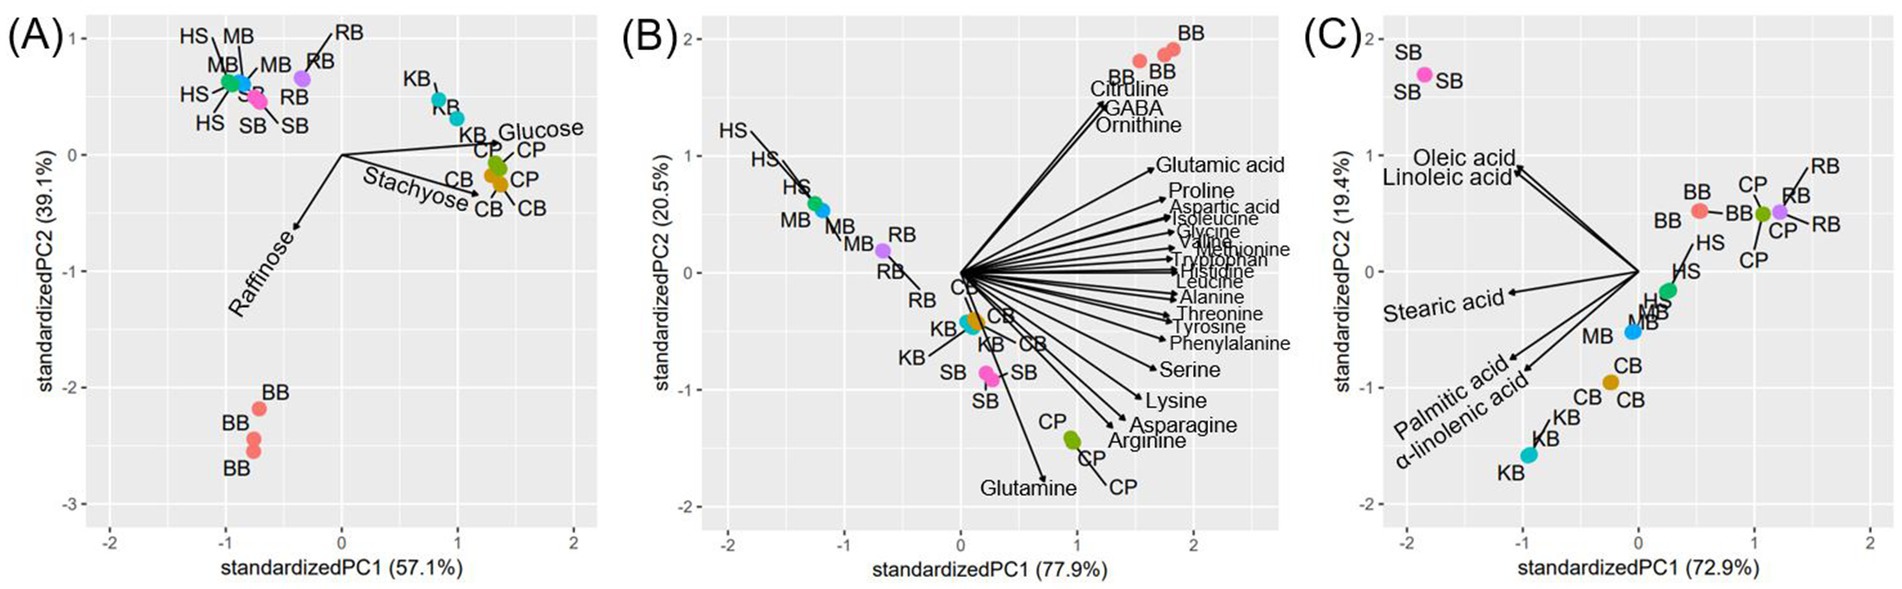
Figure 1. PCA biplot of the content of free saccharides (A), amino acids (B), and fatty acids (C) contents in the digested samples of eight pulses.
Free amino acid content was also examined after proteins were degraded during the digestion process and subsequently filtered through dialysis phases. The consistent directionality of the loading vectors on the PCA biplot (Figure 1B) corresponding to each amino acid suggests a positive correlation in amino acid content across the samples. Notably, the loading vectors for glutamine, ornithine, and citrulline deviated slightly from the direction observed for other amino acids, indicating the possibility of differential levels of these amino acids in some pulses. Overall amino acid levels in eight pulses were high at glutamine, arginine, phenylalanine, and leucine (Supplementary Table S2). Specifically, glutamine showed particularly high levels, with contents of 92.05 ± 3.93 μg, 30.76 ± 0.13 μg, 23.80 ± 0.26 μg, 23.53 ± 0.36 μg, 20.54 ± 0.19 μg in the digested samples of BB, CP, CB, SB, and KB. Arginine also showed high concentrations of 27.60 ± 0.18 μg and 19.99 ± 0.23 μg in the digested CP and SB samples, while phenylalanine was present at levels of 21.76 ± 0.19 and 17.57 ± 0.73 in the CP and BB samples. Similarly, leucine was found in high concentrations of 27.62 ± 1.19 μg, and 23.39 ± 0.09 μg in BB and CP digesta, indicating that CP and BB digesta contained the highest overall levels of amino acids. As confirmed by the PCA plot (Figure 1B), relatively lower levels of amino acids were observed in samples from RB, KB, MB, and HS. Ornithine and citrulline were exclusively detected in the digested BB sample.
For free fatty acids, they were largely eliminated after dialysis, with only trace amounts remaining in the samples. According to the PCA plot (Figure 1C), the digested samples of BB, RB, and CP had the lowest fatty acid contents. In contrast, the digested SB sample contained the highest levels of oleic acid (10.02 ± 0.01 μg) and linoleic acid (25.27 ± 0.01 μg) (Supplementary Table S3). The digested KB sample also had a relatively high level of free fatty acids, with palmitic acid (3.67 ± 0.00 μg) and α-linolenic acid (5.51 ± 0.01 μg) present at higher levels compared to the other pulses.
3.2 Microbial taxonomic analysis of in vitro fermentation samples
The eight different digested pulses were cultured using an in vitro gut fermentation model, and products were collected at 0, 12, and 24 h in each pulse digesta. After collection, the genus-level 16S (V3-V4) rRNA sequencing and taxonomic profiling were performed, and the relative abundance of microbes was visualized in a bar plot chart (Figure 2). In the initial (0 h) colonic fermentation of the BB digesta, Enterobacter represented approximately 40% of the total gut microbiota, while the Prevotella 9 lineage accounted for around 15%. However, as the fermentation progressed, both Enterobacter and Prevotella 9 decreased in their portion, while Escherichia-Shigella, Fusobacterium, and Bacteroides increased, resulting in a simplified microbial community.
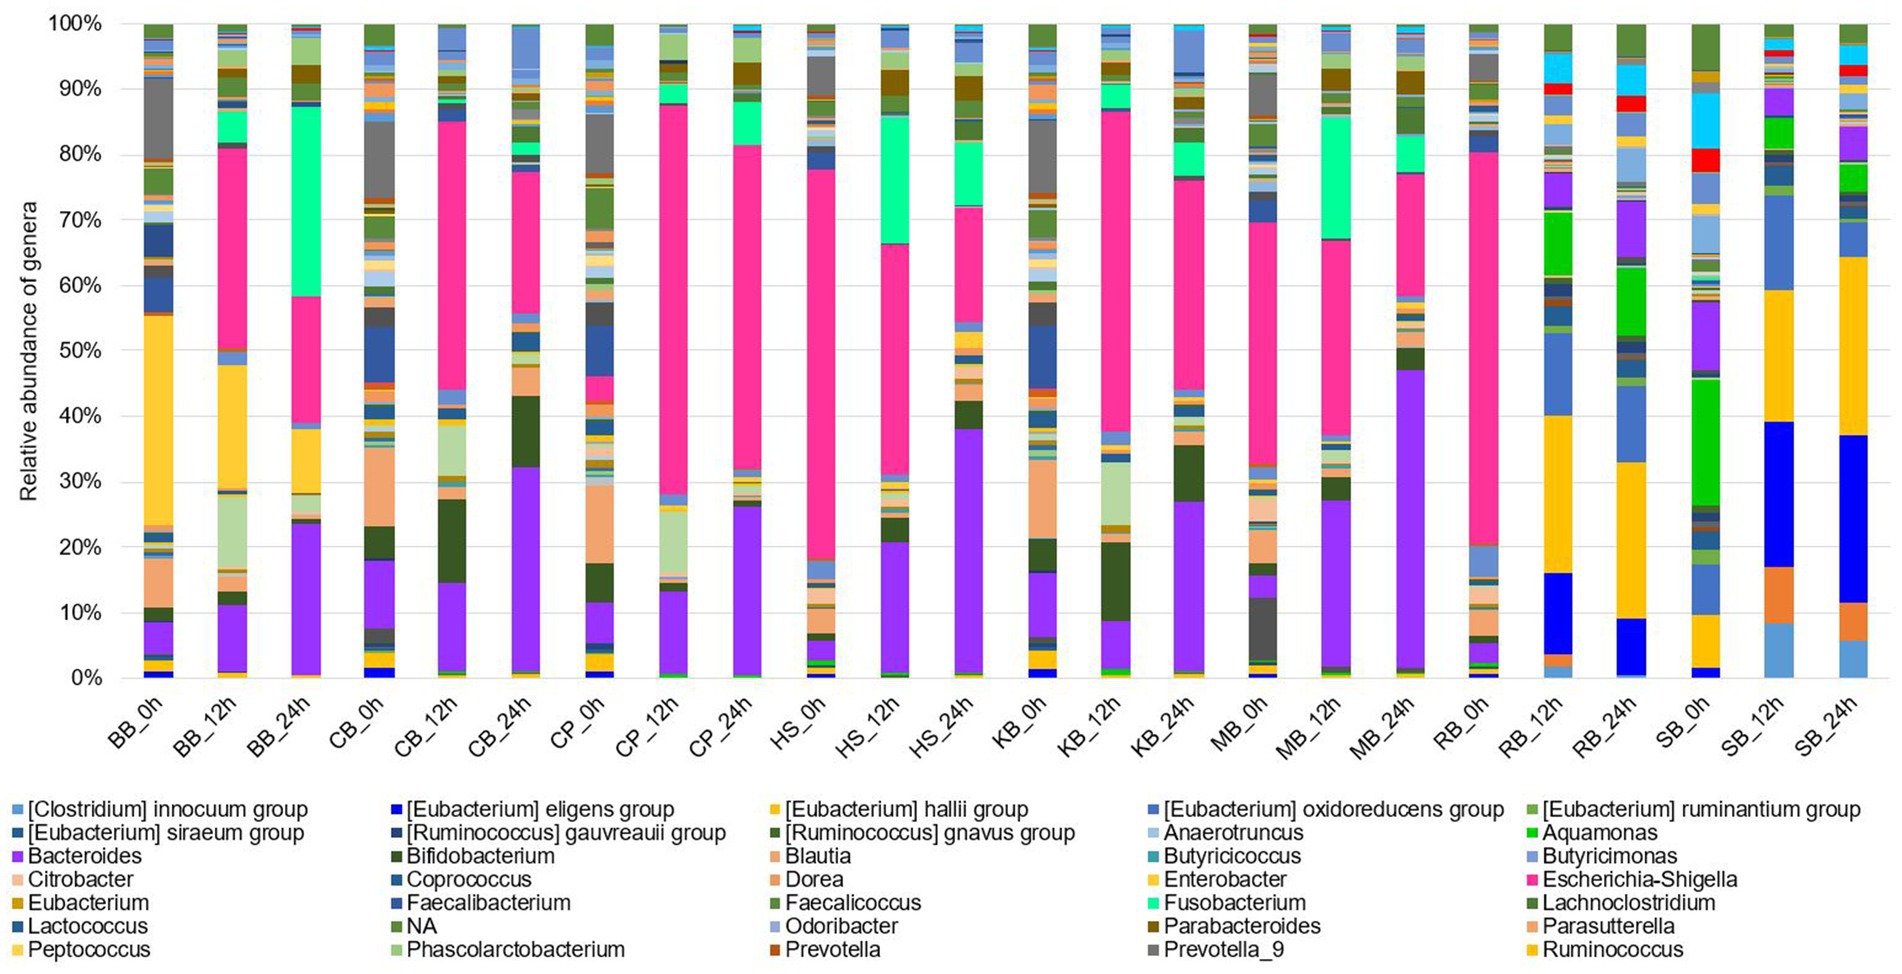
Figure 2. Composition of the gut microbiota of in vitro fermentation samples (0 h, 12 h, 24 h) of eight pulses at the genus level.
Besides, in the CB digesta, the initial microbial composition displayed a distribution of the diverse genus, including Prevotella 9, Faecalibacterium, Blautia, and Bacteroides, each representing about 15% of the community. But, over fermentation time, Escherichia-Shigella, Bifidobacterium, and Bacteroides dominated the community. This trend of simplification of the microbial composition was particularly pronounced in the CP digesta, with a remarkable increase in Escherichia-Shigella and Bacteroides, which came to account for a large portion of the microbial community. Similar patterns were observed during the fermentation of the KB digesta, where the relative abundance of Bifidobacterium increased.
Although the SB digesta initially contained a diverse community, with Alistipes, Akkermansia, Bacteroides, Aquamonas, and various Eubacterium groups comprising a substantial proportion, the Eubacterium groups increasingly constituted the community as fermentation progressed. In particular, Akkermansia gradually decreased during fermentation. Overall, a common trend was observed in the fermentation of BB, CB, CP, and KB digesta, characterized by an increase in the relative abundance of Escherichia-Shigella, Bacteroides, and Clostridium sensu stricto 1, along with a decrease in Blautia.
In the fermentation of HS digesta, a marked decrease in the relative abundance of Escherichia-Shigella, which comprised about 60% of the primary microbial community, was observed over time. Concurrently, the proportions of Bacteroides, Fusobacterium, and Bifidobacterium increased. A similar pattern was found in the fermentation of MB digesta, with a decline in the relative abundance of Bacillus and an increase in Bifidobacterium. An inverse relationship between the relative abundances of Escherichia-Shigella and Bacteroides was identified in most pulse digesta.
During the fermentation of RB digesta, the relative abundance of Escherichia-Shigella decreased significantly, while the portions of Bacteroides and the Eubacterium groups increased. This trend was consistent with the results seen in the SB digesta where Eubacterium oxidoreducens, Eubacterium hallii, and Eubacterium eligens groups collectively accounted for approximately 45% of the microbial community at the 12 h and 24 h time points. Furthermore, unlike the other pulses, RB digesta showed an increase in the relative abundance of Aquamonas, Alistipes, and Akkermansia. While Aquamonas is prevalent in environmental materials such as water and has not been studied in the context of human health or food samples, the positive health effects of Alistipes and Akkermansia are described in the discussions of Table 1.
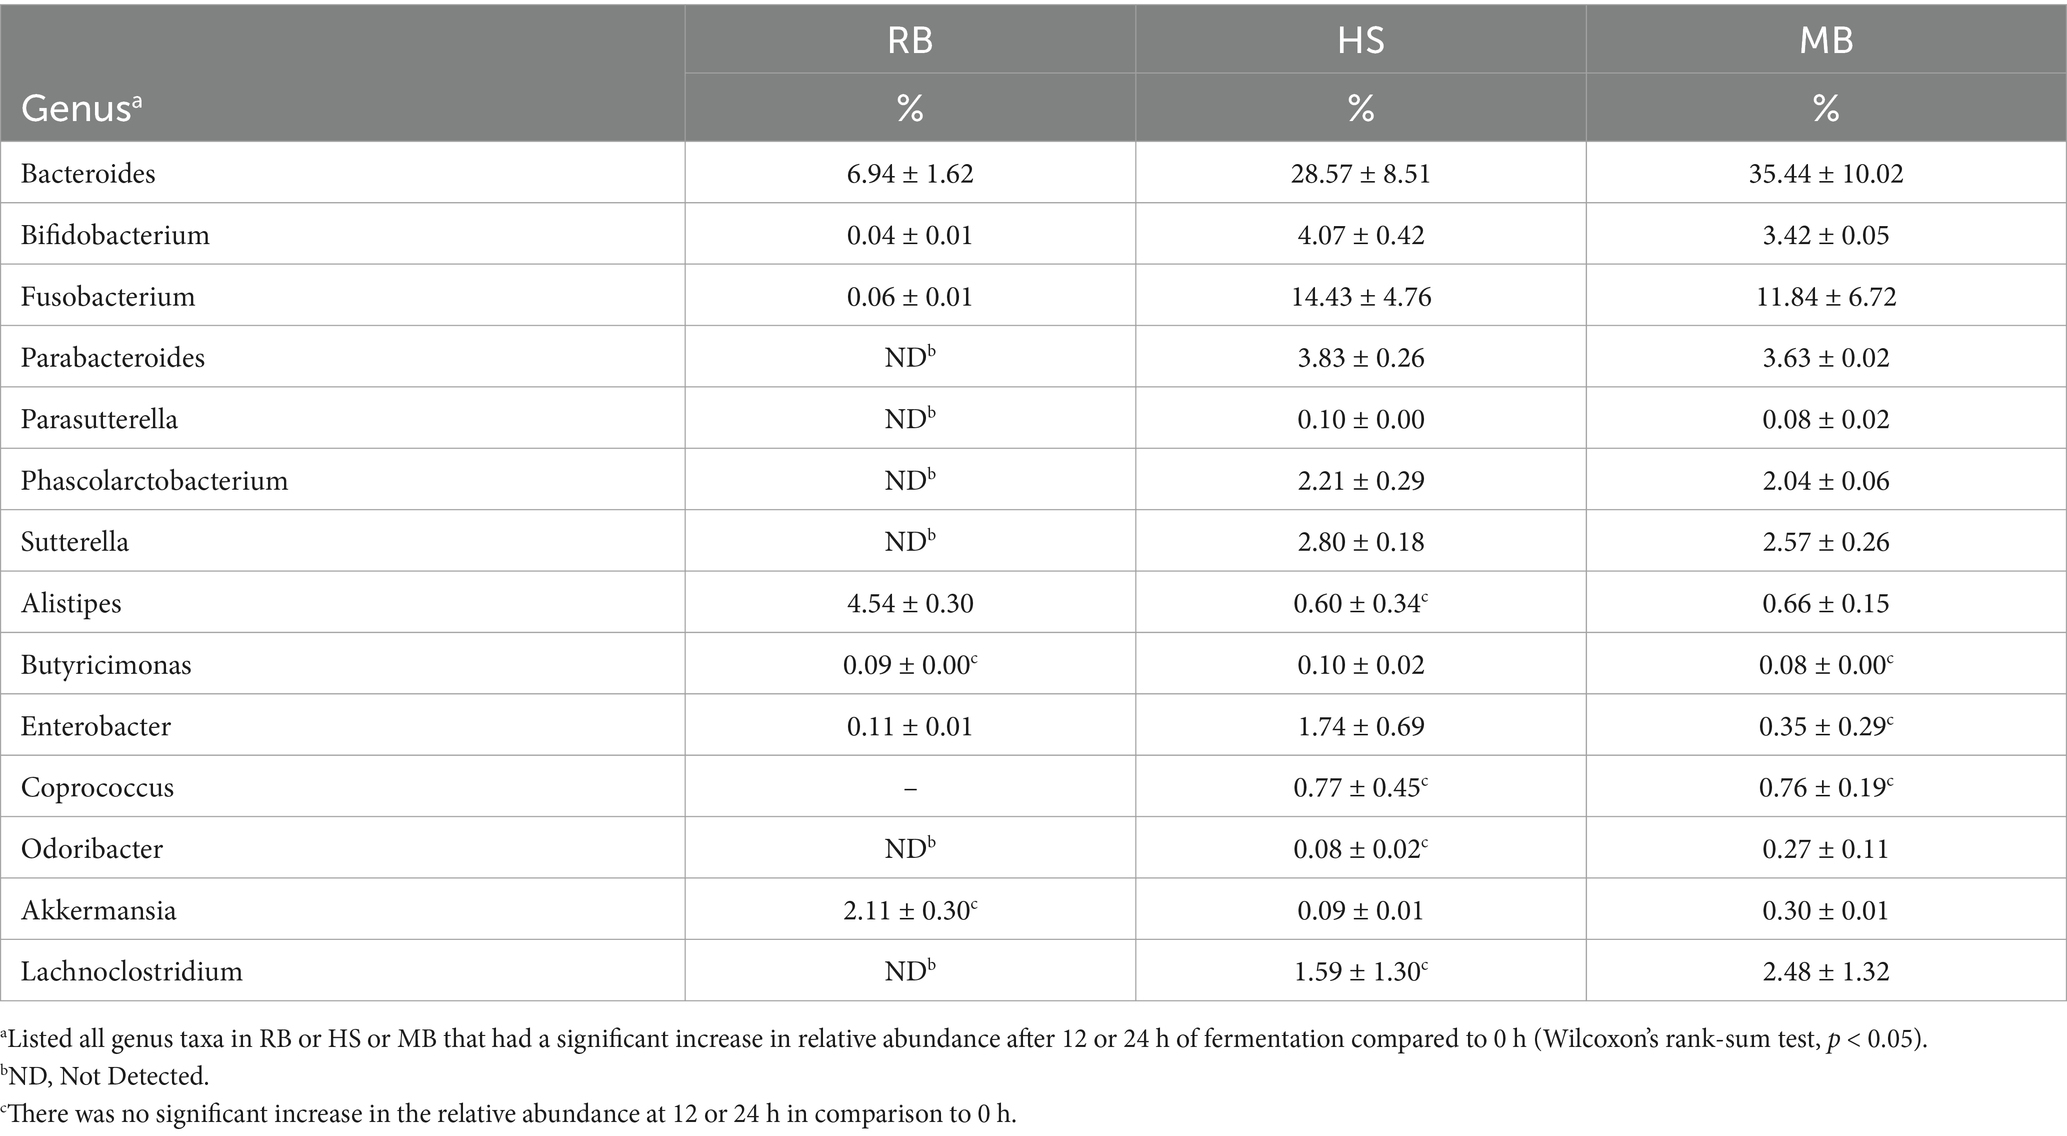
Table 1. The relative abundance of genera which exhibited a significant increase at 12 or 24 h of fermentation compared to the initial time point (0 h) for three pulse samples.
Furthermore, diversity analyses were conducted to provide a quantitative framework the patterns of microbial variability among the samples that were illustrated in the aforementioned bar plot. The ɑ-diversity (SI) of the pulse samples at each in vitro fermentation time was calculated to assess the genus complexity of the fecal microbiota within each pulse (Figure 3). In most samples, there was a decrease in diversity at 12 h of colonic fermentation compared to 0 h, with a slight increase observed at 24 h. However, in RB, HS, and MB, diversity consistently increased over time. The mean SIs at 0 h and 12 h for each sample were as follows: SB 6.25 and 5.24, KB 6.57 and 5.22, CB 6.60 and 5.54, CP 6.63 and 4.86, and BB 6.24 and 5.72, with a similar range of decrease. In contrast, the diversity increased from 5.23 to 6.17 in RB, from 5.30 to 5.84 in HS, and from 5.89 to 5.95 in MB, indicating an upward trend in these three pulses.
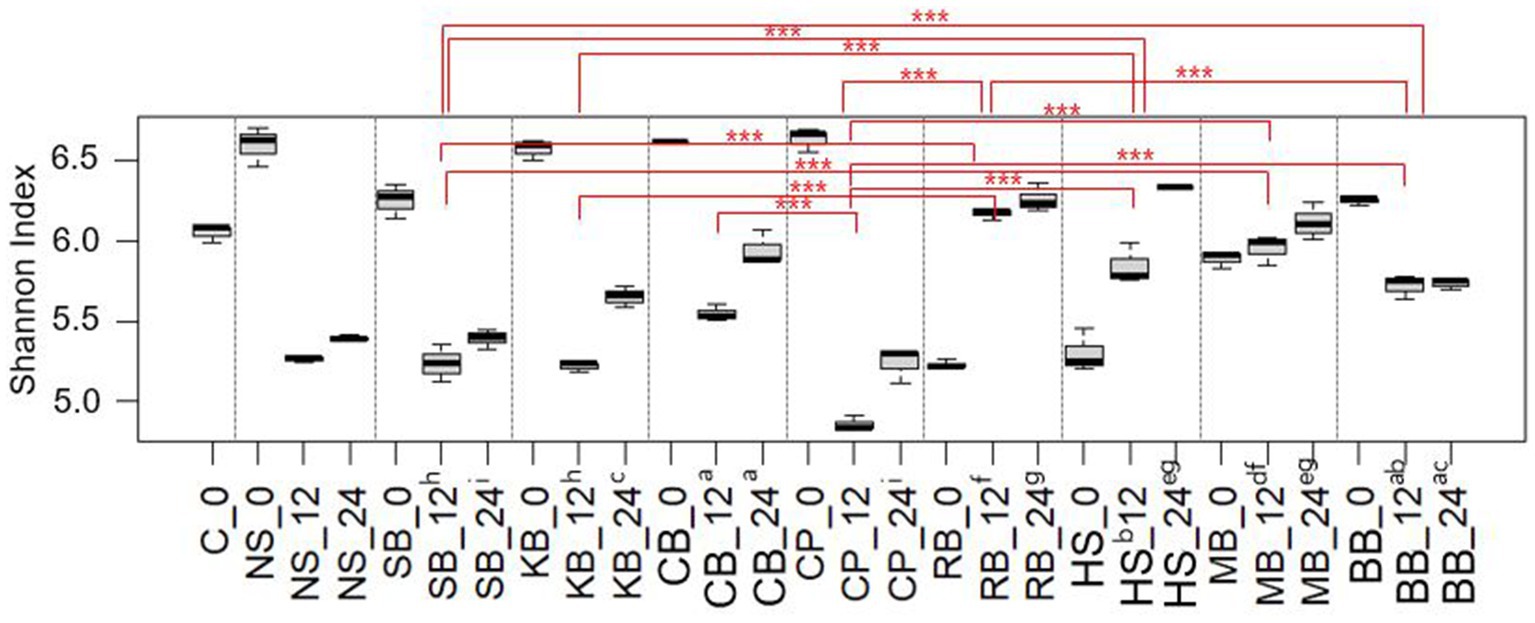
Figure 3. The change in Shannon indices of each pulse sample over fermentation hour (0 h, 12 h, 24 h). Samples with significant differences in Shannon indices at both 12 h and 24 h fermentation were connected by red lines and are indicated with their significance levels (***p < 0.001). Samples without significant differences were designated with the same alphabet. The C (control) and NS (non-substrate) samples were excluded from the significance test.
The β-diversity of the microbial communities was analyzed using Bray-Curtis distances between samples (Figure 4). Based on the calculated distances, a general distribution was observed by the MDS method, which exerted significant shifts in the composition of the gut microbiota at either 12 or 24 h of fermentation compared to 0 h in all pulse samples. Since KB, CB, CP, BB, and SB showed a decrease also in α-diversity as fermentation progressed, it was suggested that the digestive residues of these samples reduced the richness of the microbial distribution in the colon, simultaneously altering the composition of the microbiota. However, RB, HS, and MB digesta positively influenced the distribution of a variety of microorganisms during colonic digestion.
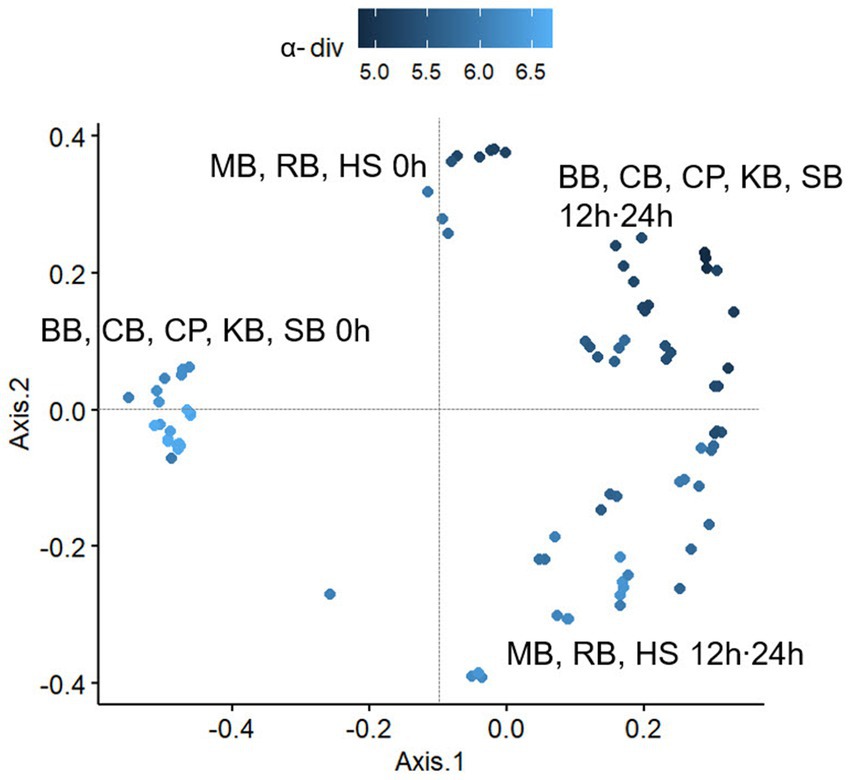
Figure 4. The plot based on a multidimensional scaling (MDS) analysis of the Bray-Curtis distances between pulse samples taken at each fermentation hour (0 h, 12 h, 24 h). BB, black bean; CB, cowpea; CP, chickpea; HS, Heunguseul; KB, kidney bean; MB, mung bean; RB, red bean; SB, soybean.
Changes in gut microbiome genera were observed in three pulses where health-positive bacteria increased during colonic digestion (Table 1). As the relative abundances of Bacteroides, Bifidobacterium, and Fusobacterium were found to be increased by colonic fermentation in all three samples, the relative growth of Coprococcus and Lachnoclostridium was uniquely depicted in RB, while Odoribacter and Akkermansia were specifically increased in MB. The species-level analysis performed by Shotgun whole genome sequencing for these genera (Figure 5) showed that these genera contained only O. splanchnicus and A. muciniphila, respectively. Meanwhile, the proportions of Alistipes and Lachnoclostridium increased in both RB and MB. Alistipes belongs to a relatively recently discovered sub-branch genus within the phylum Bacteroidetes. The Shotgun sequencing identified the following four species for Alistipes: A. onderdonkii (69%), A. shahii (19%), A. senegalensis (5%), and A. finegoldii (4%).
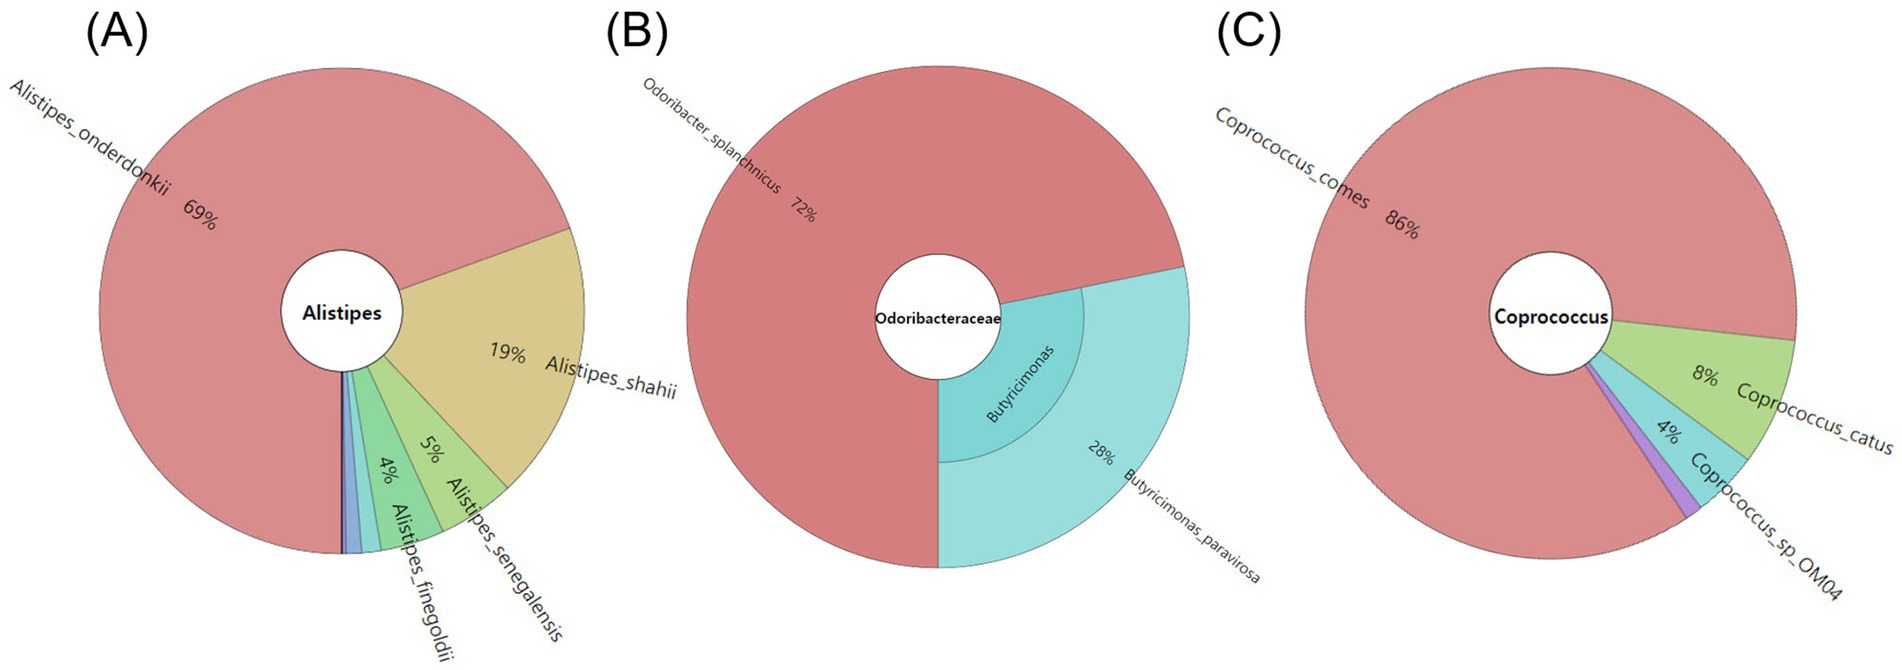
Figure 5. The taxonomic classification of species within the genus demonstrated a significant increase in relative abundance during the fermentation of HS (A), MB (B), and RB (C) digesta.
The relative abundances of Sutterella and Akkermansia also increased in MB and HS, while the relative growth of Enterobacter was promoted in RB and HS. In the case of Enterobacter, only E. hormaechei constituted a minute fraction, comprising 0.003% of the entire Enterobacteriaceae family.
3.3 Comprehensive correlations between nutrients, microbiome growth, and metabolite production
3.3.1 Positive correlation networks
A network analysis was conducted to explore positive interrelationships between nutrient content of eight digested pulses, microbiome changes, and metabolite production in the pulses after 12-h colonic fermentation (Figure 6A). The analysis revealed significant interconnectivity among nutrients, particularly amino acids and sugars, which exhibited high centrality and strong positive correlations.
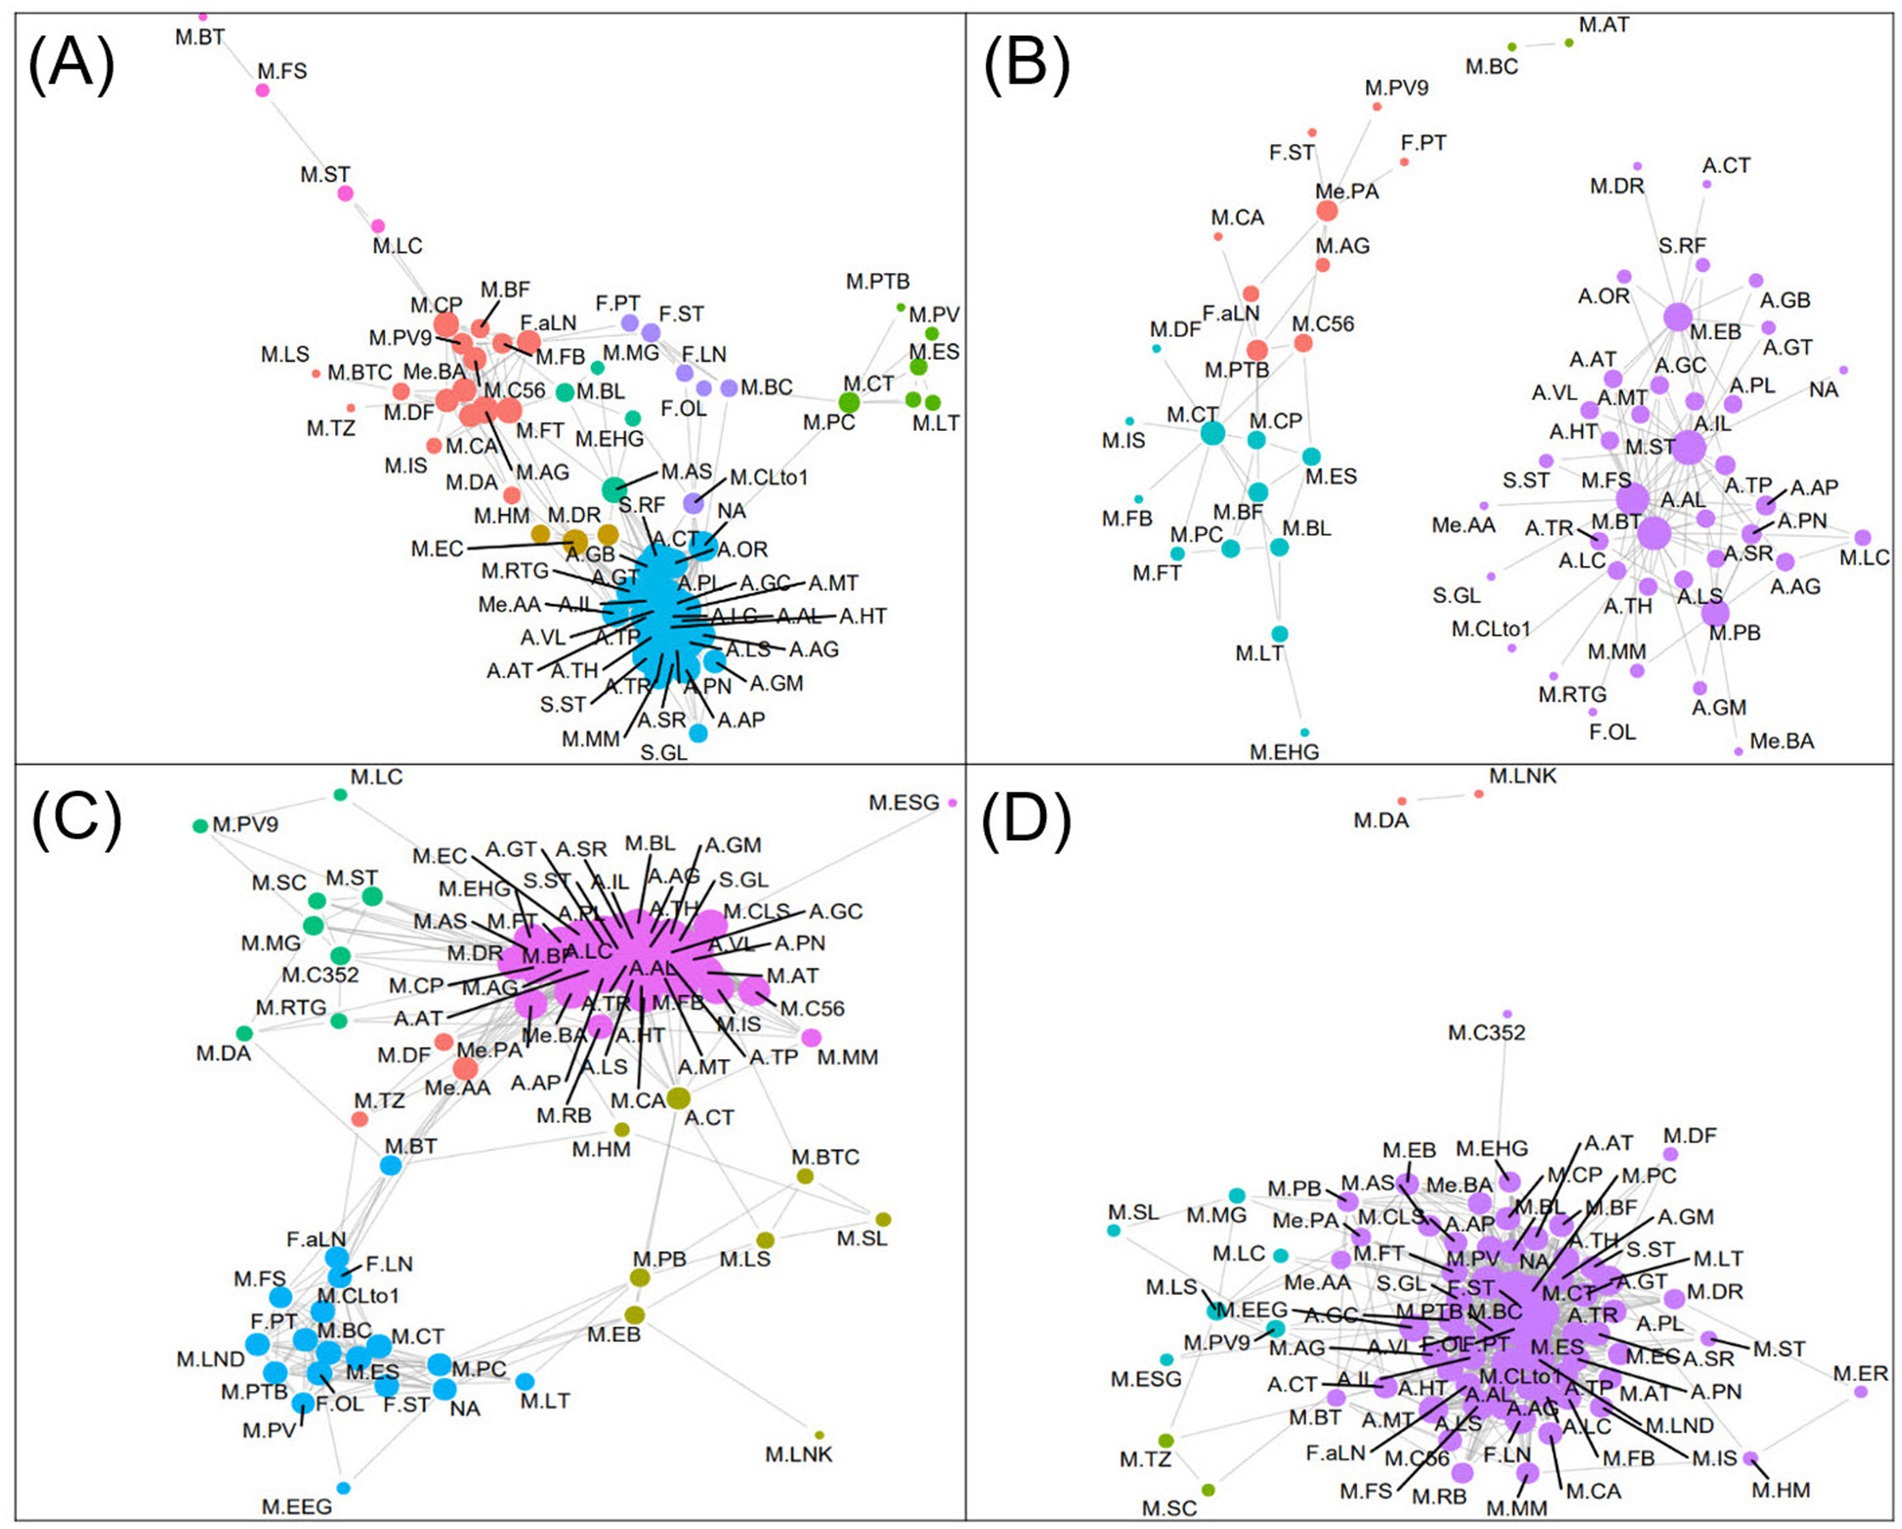
Figure 6. Positive (A,C) and negative (B,D) network analysis between the nutrient contents, microbial abundance changes (0 h–12 h), and metabolite contents produced by microbiota. The size of the nodes is indicative of the centrality of each variable, while the edges represent the correlation linkage. S.GL, glucose; S.ST, stachyose; S.RF, raffinose; A.GM, glutamine; A.LS, lysine; A.SR, serine; A.PN, phenylalanine; A.AP, asparagine; A.AG, arginine; A.TR, tyrosine; A.MT, methionine; A.AL, alanine; A.LC, leucine; A.TH, threonine; A.HT, histidine; A.TP, tryptophane; A.IL, isoleucine; A.AT, aspartate; A.OR, ornithine; A.CT, citrulline; A.GT, glutamate; A.GB, GABA; A.PL, proline; A.VL, valine; F.OL, oleic acid; F.LN, linoleic acid; F.ST, stearic acid; F.PT, palmitic acid; F.aLN, α-linolenic acid; M.AG, agathobacter; M.AT, alistipes; M.AS, anaerostipes; M.BC, bacillus; M.BT, bacteroides; M.BF, bifidobacterium; M.BL, blautia; M.BTC, butyricoccus; M.C352, CAG-352; M.C56, CAG-56; M.CA, catenibacterium; M.CT, citrobacter; M.CLto1, clostridium sensu stricto1; M.CLS, collinsella; M.CP, coprococcus; M.DF, desulfovibrio; M.DA, dialister; M.DR, dorea; M.EB, enterobacter; M.EC, enterococcus; M.ER, erysipelotrichaceae UCG-003; M.ES, escherichia-shigella; M.FB, faecalibacterium; M.FT, fusicatenibacter; M.FS, fusobacterium; M.HM, holdemanella; M.IS, incertae sedis; M.LC, lachnoclostridium; M.LS, lachnospira; M.LND, lachnospiraceae ND3007 group; M.LNK, lachnospiraceae NK4A136 group; M.LT, lactococcus; M.MM, megamonas; M.MG, monoglobus; NA, not identified; M.PB, parabacteroides; M.PTB, phascolarctobacterium; M.PV, prevotella; M.PV9, prevotella_9; M.PC, pseudocitrobacter; M.RB, romboutsia; M.SC, streptococcus; M.SL, subdoligranulum; M.ST, sutterella; M.TZ, tyzzerella; M.EEG, eubacterium eligens group; M.EHG, eubacterium hallii group; M.ESG, eubacterium siraeum group; M.RTG, ruminococcus torque group; Me.AA, acetic acid; Me.PA, propionic acid; Me.BA, butyric acid.
In terms of changes in the microbiome, two major communities were identified. The first community, comprising Faecalibacterium, Bifidobacterium, Agathobacter, Fusicatenibacter, Butyricoccus, Desulfovibrio, Catenibacterium, Coprococcus, and Prevotella 9, demonstrated complex positive correlations both within the group and with nutrient components. Notably, Fusicatenibacter, CAG-56, and Bifidobacterium showed positive correlations with α-linolenic acid (ALA), while Anaerostipes was influenced by amino acids, subsequently affecting the growth of Blautia, Monoglobus, and Fusicatenibacter. The second community, centered around Pseudocitrobacter, including Lactococcus, Prevotella, Phascolarctobacterium, Escherichia-Shigella, and Citrobacter, no strong correlations with the nutrients were observed. Among the metabolites, acetic acid exhibited strong positive correlations with amino acids and Enterococcus, while butyric acid was more strongly associated with microbial changes than nutrient components.
Further analysis of RB, MB, and HS samples, which showed markedly increased microbial diversity, revealed distinct patterns (Figure 6C). In comparison to the complete network, the Pseudocitrobacter-centered and fatty acid-based communities merged in these samples, displaying strong direct correlations between fatty acids and microorganisms. Nutrient-microbe interactions were more frequent, indicating dense positive effects of nutrients on multiple microorganisms. Additionally, three metabolites had strong positive relations with amino acids and were particularly influenced by fatty acids such as α-linolenic acid.
In conclusion, the network analysis for RB, MB, and HS illustrated higher connectivity between communities and more extensive microbe-nutrient interactions compared to the complete network. This increase connectivity and interaction may explain the elevated microbial diversity observed in these three pulses, highlighting the complex interplay between nutrient composition and microbial ecology in pulse digestion and fermentation processes.
3.3.2 Negative correlation networks
The negative network revealed two distinct communities, with the most significant centrality observed in a community dominated by Bacteroides, Fusobacterium, Sutterella, and Enterobacter. These four bacteria were commonly associated with eight amino acids: aspartate, glycine, histidine, isoleucine, methionine, proline, tryptophan, and valine. Sutterella and Enterobacter also exhibited negative correlations with glutamate, GABA, and ornithine. It is noteworthy that despite the known ability of these microorganisms to metabolize amino acids as a primary energy source, they demonstrated strong negative correlations with these nutrients.
On the other hand, fewer microorganisms showed negative correlations with fatty acids. Notable examples included Citrobacter and Phascolarctobacterium, which negatively correlated with α-linolenic acid, and Bacteroides, which showed a negative association with oleic acid. Among metabolites, propionic acid had negative correlations with Agathobacter, CAG-56, and Prevotella_9, as well as with fatty acids such as α-linolenic acid, palmitic acid, and stearic acid. Additionally, acetic acid and butyric acid had direct negative correlations with Fusobacterium and Parabacteroides.
The negative correlation network analysis for RB, MB, and HS samples (Figure 6D) revealed a different pattern compared to the overall network. In these samples, there was no clear community separation, and the centrality of fatty acids was the most prominent. Unlike the general network (Figure 6B), strong negative correlations were observed between fatty acids and amino acids in RB, MB, and HS. This analysis also supported the findings from the positive network, indicating that the nutrient composition of RB, MB, and HS digesta played a significant role in negatively influencing the growth of several microorganisms. These results emphasize the complex and counterintuitive relationships between nutrients and microbial communities in pulse digestion and fermentation processes.
3.3.3 The linear relationship between nutrient composition and microbial diversity
In fact, nutrient analysis of the digesta from RB, MB, and HS demonstrated relatively small differences in fatty acid and amino acid content compared to the other pulses. For example, the average range of fatty acid content in the digesta of RB, MB, and HS was 0.04–0.16, 0.64–5.07, 0.22–1.70 μg, respectively, while KB, CB, and BB showed similar fatty acid content (0.82–5.51, 0.55–4.22, 0.41–3.10 μg) (Supplementary Table S3). However, the average amino acid content of KB, CB, and BB was significantly higher (1.85–20.54, 1.65–14.99, 0.10–92.05 μg) than that of RB, MB, and HS (0.24–10.38, 0.16–4.30, 0.14–2.78 μg) (Supplementary Table S2). Thus, it is suspected that a balanced nutrient profile, rather than one dominated by a single nutrient, may promote diverse and active microbial interactions.
To further investigate the quantitative relationship between nutrient balance and microbial diversity implied by the network analysis, linear regression analyses were performed (Figure 7). The coefficient of determination between changes in the SI from 0 h to 12 h and the principle component score (PC1) of each nutrient group (sugars, S_PC; amino acids, A_PC; fatty acids, F_PC) was examined. Results showed a strong inverse correlation between SI changes and sugars (R2 = 0.6638, p = 0.000) and a moderate correlation with amino acids (R2 = 0.4201, p = 0.001).
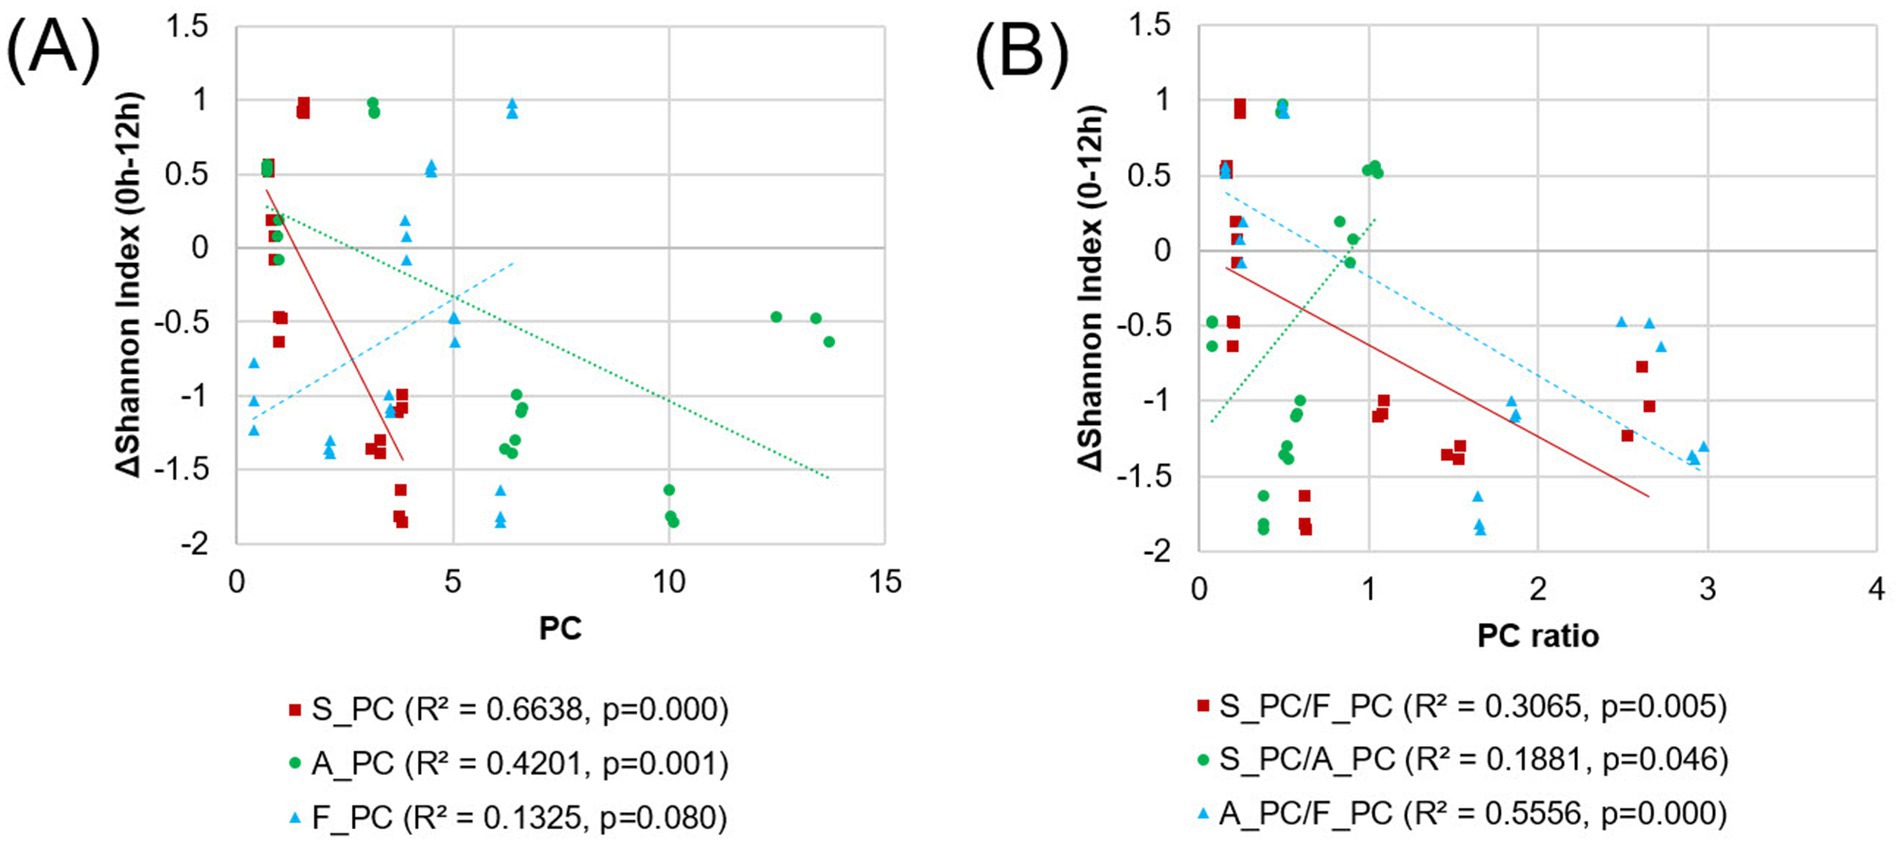
Figure 7. The linear regression analysis between the changes in the Shannon index for each pulse sample and the principal components of each nutrient (A) or their ratios (B). The amino acid content data for SBs were identified as outliers and were subsequently excluded from the analysis.
While the fatty acid content itself has a limited correlation with diversity (R2 = 0.1325, p = 0.080), its ratio with other nutrients significantly influenced the gut environment (Figure 7B). The ratio of S_PC to F_PC had a moderate negative correlation with the SI change (R2 = 0.3065, p = 0.005), while the A_PC to F_PC ratio was inversely related to SI change (R2 = 0.5556, p = 0.000). The S_PC to A_PC ratio had a weak positive correlation (R2 = 0.1881, p = 0.046). These results from quantitative analyses reinforce the findings from network analysis, implying the importance of nutrient balance in shaping microbial diversity.
4 Discussions
4.1 Health-affecting bacterial growth of in vitro gut fermentation samples
16S (V3-V4) rRNA sequencing and taxonomic profiling unveiled an enriched microbial community in RB, MB, and HS samples along with the fermentation time. Furthermore, there was a decrease in the relative abundance of health-negative genera such as Escherichia-Shigella, with an increase in beneficial bacteria including Bacteroides and Eubacterium groups. The term Escherichia-Shigella refers to both Escherichia coli and Shigella, which are genetically similar and difficult to be distinguished by 16S rRNA analysis. While most strains of E. coli are nonpathogenic and symbiotic in the human gut, Shigella is known to cause dysentery through intestinal infection (Wright et al., 2015; Xu et al., 2022). On the other hand, Bacteroides, although functionally diverse at the species level, plays a critical role in degrading complex carbohydrates in the gut, which supports intestinal immune function and homeostasis. Research has demonstrated that individuals with inflammatory bowel diseases (IBD), such as Crohn’s disease and ulcerative colitis, tend to have higher Escherichia-Shigella and lower Bacteroides levels (Wright et al., 2015).
Eubacterium oxidoreducens is known to participate in the oxidation–reduction reactions of various organic compounds in the gut and has been studied for its health-promoting role in cancer research, including esophageal (Li et al., 2024) and small cell lung cancer (Yang et al., 2024). Eubacterium hallii is an important gut bacterium that produces short-chain fatty acids (SCFAs), such as butyrate and propionate, which serve as an energy source for intestinal cells (Engels et al., 2016) and have been reported to contribute to anti-inflammatory effects and improved insulin sensitivity (Mukherjee et al., 2020; Seegers et al., 2021). Eubacterium eligens, known for its anti-inflammatory properties, regulates intestinal immune responses in the gut and may have protective effects against inflammatory bowel disease (IBD) (Chung et al., 2017; Olendzki et al., 2022). All of these species are known to metabolize complex carbohydrates and dietary fiber as energy sources, suggesting that measuring the dietary fiber and oligosaccharide content of RB may help identify the specific factors influencing the growth of these microorganisms.
While RB, HS, and MB positively influenced the distribution of a variety of microorganisms during colonic digestion, diversity analyses revealed that both α- and β-diversity varied among the initial fermentation samples (0 h). It has been previously reported that environments with high microbial diversity are known to be resilient to microbial perturbations, and ecological theory posits that environments with low microbial diversity are inherently less receptive to the colonization of new microbial species, as reduced diversity limits the availability of ecological niches and competitive opportunities (Lozupone et al., 2012; Bourdeau-Julien et al., 2023). Nevertheless, the present results, where samples with initially high diversity experienced a decrease while those with low diversity saw an increase, illustrated that RB, MB, and HS may have significant factors that promote a favorable gut environment compared to the others.
Not only was diversity enhanced in the three pulses, but there was also a recognized growth of multiple health-promoting microbiota including Bacteroides, Bifidobacterium, and Coprococcus. Bacteroides spp. protect the gut microbiome from pathogens and provide an energy source (Zafar and Saier, 2021). Approximately 50% of the carbohydrate in pulses is starch, which is converted to resistant starch (RS) during heat treatment. The metabolic capabilities of the gut microbiota vary depending on structural differences in RS, with RS4 consumption specifically known to increase the abundance of Bacteroides and Bifidobacterium (Kadyan et al., 2022).
Meanwhile, SCFA-producing Coprococcus (Nogal et al., 2021) has been found to grow with high quality diets. Since SCFAs are produced by the metabolism of anti-inflammatory bacteria that participate in energy synthesis in the human body, increasing the abundance of Coprococcus may help the growth of beneficial gut microbiomes (Laitinen and Mokkala, 2019). Coprococcus and Lachnoclostridium, along with Lachnospira, belong to the family Lachnospiraceae, which, according to NCBI, consists of 58 genera and several unclassified strains (Vacca et al., 2020). C. comes, consisting of 86% of Coprococcus genera, is a beneficial butyrate-producing bacterium found in the human gut. Butyrate, one of its major metabolic byproducts, plays a pivotal role in maintaining the intestinal barrier, reducing inflammation, and facilitating gut health. Studies have linked C. comes to positive outcomes in mental health, particularly in reducing symptoms of depression, due to its involvement in the gut-brain axis (Notting et al., 2023). Moreover, butyrate production by C. comes has been associated with anticancer properties, particularly in protecting against colorectal cancer by supporting the gut epithelium and regulating inflammatory processes (Liu et al., 2024). Clostridium symbiosum, the only species detected in the genus Lachnoclostridium, contributes to the fermentation of dietary fiber and aids in the production of SCFAs such as butyrate, which supports gut barrier function and reduces inflammation. By producing SCFAs, it can regulate metabolism and immune responses, playing a protective role in metabolic conditions like type 2 diabetes and colorectal cancer (Wang et al., 2012; Ren et al., 2024). However, overgrowth of C. symbiosum has been observed in conditions of gut dysbiosis, which may be associated with diseases such as obesity and inflammatory bowel disease (IBD) (Rodríguez et al., 2020).
The fermentation of MB digesta led to an enhanced relative abundance of Odoribacter, while HS digesta promoted the proliferation of Butrycimonas. Previous studies have indicated that Odoribacter, Butyricimonas, and Bacteroides are positively related with human cognitive function and contribute to the anti-inflammatory pathway and the modulation of the immune system (Zeng et al., 2021). The beneficial gut bacterium O. splanchnicus is known to utilize dietary fiber and resistant starch as its primary energy source, producing short-chain fatty acids (SCFAs) (Hiippala et al., 2020; Ren et al., 2024). During the fermentation of RB and MB, Alistipes showed a significant increase, with Alistipes onderdonkii emerging as the predominant species within this genus, and is recognized as a characteristic member of the gut microbiome with anti-inflammatory properties and involvement in the inhibition of tumor necrosis factor (TNF). It has been reported to play a beneficial role in cancer immunotherapy by modulating the tumor microenvironment (Parker et al., 2020; Li et al., 2023).
The genera Sutterella and Enterobacter, which showed increased abundance in HS and MB, and HS and RB respectively, are gut microbes with similar potential impacts on human health. Sutterella has been associated with inflammatory conditions such as irritable bowel syndrome (IBS) and autism spectrum disorders, suggesting that it may play a role in gut inflammation and immune modulation (Hiippala et al., 2016). On the other hand, Enterobacter species are opportunistic pathogens causing infection and dysbiosis, especially in immunocompromised individuals (Moreira de Gouveia et al., 2024). Both genera can affect gut homeostasis and contribute to disease states.
Besides, the relative abundance of Akkermansia significantly increased in HS and MB. Akkermansia muciniphila is one of the most abundant single species in the human gut microbiota, comprising 0.5–5% of the total bacteria. It degrades the mucin layer of the intestinal mucosa and produces beneficial metabolites such as acetate and propionate. Through this mechanism, A. muciniphila has been shown to reduce body fat mass and adipose tissue inflammation while improving insulin sensitivity, thereby enhancing gut barrier function (Cani and de Vos, 2017).
4.2 Nutrient-microbiome-metabolite network claims importance of nutrient balance for gut health
Protein degradation during pulse digestion led to a consistent increase in amino acid levels. The high interconnectivity between amino acids and sugars observed in the network analysis suggested that the pulses used in the experiment had proportional amounts of protein and carbohydrates. Fatty acids did not have direct positive networks with amino acids or sugars, indicating that the fat content of the pulses does not necessarily align with protein or carbohydrate level and may vary among the pulses.
In the positive correlation network of the eight pulses, few links were observed between microbes and nutrients. Fusicatenibacter, CAG-56, and Bifidobacterium were positively correlated with the fatty acid α-linolenic acid (ALA), while Anaerostipes was influenced by amino acids and associated with the growth of Blautia, Monoglobus, and Fusicatenibacter. Coakley et al. (2009) reported the ability of Bifidobacterium strains to convert linoleic acid to c9, t11-conjugated linoleic acid (CLA) and grow in the presence of anti-inflammatory ALA. Since the anti-inflammatory properties may create a favorable gut environment that is likely to foster the proliferation of SCFA-producing bacteria (Yang et al., 2023), the growth of SCFA-producing Fusicatenibacter (Pihelgas et al., 2024) might have been affected by ALA. Anaerostipes, a butyrate-producing genus, interacts with amino acids such as glutamate and lysine, which serve as substrates for SCFA production, especially butyrate, known for its anti-inflammatory effects (Singh et al., 2023) which can in turn promote the growth of Fusicatenibacter.
Cross-feeding interactions explain the correlations within this bacterial community, where one microbe’s byproducts support the growth of others. These interactions, several bacteria degrade dietary components into intermediate metabolites such as acetate or lactate, which are then sequentially used as nutrient substrates by butyrate-producing bacteria. Rivière et al. (2016) reported relationships between acetate- or lactate-producing Bifidobacterium and butyrate-producing colonic bacteria, such as Faecalibacterium prausnitzii (clostridial cluster IV) and Anaerostipes. Accordingly, positive associations of the SCFA metabolite content with microbial alteration were more frequent than those with nutrient content. This may stress that the composition and activity of the gut microbiota are of paramount importance in determining the production of key metabolites.
Therefore, optimizing microbial conditions may yield greater advantages to gut health than focusing solely on individual nutrient contents. Recent studies have highlighted the potential of dietary interventions in modulating the gut microbiome by enhancing beneficial microbial populations or increasing the production of SCFA. For instance, Purdel et al. (2023) reported that fasting and/or time-restricted regimens can achieve gut health. Time-restricted fasting, intermittent fasting, and Ramadan fasting protocols were shown to increase Akkermansia muciniphila and Bacteroidetes, associated with improved metabolic health and reduced gut inflammation. Caloric restriction and alternate day fasting resulted in increased microbial diversity and promoted Bacteroides and SCFA production. In addition, water-only fasting and fasting-mimicking diets led to a high abundance of beneficial microbes like Lactobacillus and Bifidobacterium, improving immune function and gut health.
The synergistic role of prebiotics―indigestible dietary fibers that provide food for beneficial bacteria―with probiotics in promoting a diverse and stable gut microbiome has also been emphasized (Shang et al., 2024). Combining probiotic-rich meals with prebiotic fibers enhances intestinal permeability defenses through SCFA production, maintaining stability in gut flora despite dietary or environmental changes. A previous study by Starke et al. (2023) reported that amino acid-cross-feeding bacteria contribute to the compositional stability of the gut microbiome, with no evidence that dietary amino acid intake affects the frequency of auxotrophy, suggesting that simple manipulation of nutrient content may not be sufficient to regulate microbial-nutrient metabolic pathways.
In the negative network analysis of the eight pulses, a community centered around Bacteroides, Fusobacterium, Sutterella, and Enterobacter exhibited the greatest centrality and had strong correlations with amino acids. These findings were on the opposite side with previous studies that have identified various taxa involved in amino acid metabolism, including nitrogen metabolism and the tricarboxylic acid (TCA) cycle (Kanehisa et al., 2023), implying the positive relationships between those microbes and amino acids. For example, some Enterobacter and Sutterella species are engaged in the glutamate metabolism of the TCA cycle, producing glutamine as a byproduct. The pathway also includes the conversion of glutamate to GABA, suggesting that a decrease in glutamate might lead to a reduced GABA level (Kanehisa et al., 2023). Given that no relationships were recognized for these bacteria with amino acids even in the positive network of present study, it was discerned that an imbalance in the overall nutritional state provoked by amino acids may have created an unfavorable gut environment for bacterial growth. Despite their reliance on amino acids for energy, their metabolism can produce toxic byproducts such as ammonia and hydrogen sulfide. These substances can disrupt gut homeostasis, contribute to dysbiosis, and negatively affect the balance of microbial populations (Lin et al., 2017).
4.3 Quantitative relationships among carbohydrates, amino acids, and fatty acids modulating the gut environment depend on context-rule
The positive and negative networks for RB, MB, and HS had higher connectivity between communities, with a broader range of microbes interacting directly or indirectly with fatty acids and amino acids compared to the complete network. This could interpret the improved microbial diversity observed in these three pulses. Since the three pulses comprising the subset network were not identified for their nutrient abundance, it was proposed that the overall nutritional status in RB, MB, and HS influenced the nutrient-microbe interactions.
Evidence from this study insists that facilitating a gut environment driven by the comprehensive nutrient balance, rather than individual nutrients, promotes eubiosis, thereby enhancing microbial diversity and stimulating the growth of beneficial microorganisms. In fact, the linear regression demonstrated the quantitative relationship between nutrient content and microbial diversity. Excess sugars and amino acids were found to negatively affect the gut environment, with a weak correlation between fatty acids and the SI. However, fatty acid content as a ratio to sugars or amino acids significantly influenced gut microbial diversity. Consequently, the nutritional context-dependence for maintaining gut health was highlighted by elucidating the importance of avoiding overconsumption of sugars and amino acids while maintaining a balance with fatty acids. In the human colon, an overload of certain nutrients can promote the overgrowth of specific microorganisms, which can disrupt the environment for others and reduce overall microbial diversity. Amino acids, in particular, can facilitate the growth of pathogenic amino-acid-degrading bacteria, such as Clostridium, and produce metabolites such as ammonia, phenols, and amines that can alter gut pH.
A previous opinion by Rios-Covian et al. (2017) suggested the metabolic remodeling of the host and Bacteroides in response to dietary organic nitrogen/carbohydrate combinations. In addition, a study in mice by Holmes et al. (2017) described that the pattern of protein and carbohydrate intake drives diet-microbiome interactions. The interdependence of sugars and amino acids in the digested pulses used in this study obscured the association of the ratio of carbohydrates to amino acids with microbiota, which also emphasized the relevance of the context of the food matrices in determining microbiome metabolism. Although this study concluded that balancing fatty acids with sugars or amino acids is relevant to a healthy microbiome, the context-based effect may not be distinguished when examining food groups in which carbohydrates are predominant, such as fruits and vegetables. Therefore, elucidating the multidirectional connections between nutrients and microbes using a variety of food ingredients might notify the way to combine foods that complement each ingredient’s nutritional benefits for gut microbiota health.
Several limitations need to be discussed in further studies. Although the primary energy source of microorganisms – saccharides, amino acids, and fatty acids—was quantified in this study, the content of complex carbohydrates such as dietary fiber, resistant starch, or a variety of oligosaccharides also needs to be analyzed. Functional food components including isoflavones could also be the other candidates, as their effects on human microbiome changes were reported (Aboushanab et al., 2022; Narduzzi et al., 2022). Furthermore, since a single food group, pulses, was studied in the present research, other food groups with diverse matrices containing various proportions of macronutrients should be examined to demonstrate the multifaceted interactions between nutrient components and microbial diversity.
5 Conclusion
This study elucidated the effects of nutrient intake from pulse consumption on the human microbiome and metabolite changes. Following the application of in vitro digestion and fermentation to pulses, 16S rRNA analysis revealed a reduction in harmful pathogenic microorganisms and a specific increase in beneficial bacteria in the RB, HS, and MB samples. In addition, SI and Bray-Curtis distance calculations indicated that these pulses enhanced gut microbial diversity that differed from the others. Network analysis and linear regressions examining the interaction between changes in microbial communities and the nutrient content of each sample suggested that this effect was due to the balanced nutrient profiles of the three pulses. However, this should not be interpreted to mean that other pulses are detrimental to gut health. As the present study was primarily limited to pulse digesta, this can be overcome in real-life dietary contexts by consuming a variety of food groups beyond pulses. Nevertheless, our research demonstrated that maintaining a diet rich in nutrient-balanced foods, including RB, HS, and MB, supports gut microbial diversity and an environment conducive to the growth of health-positive bacteria, such as Alistipes, Akkermansia, Coprococcus, and Eubacterium groups.
This pioneering study quantitatively investigated the extensive interdependence between key nutrients and gut microbiota dynamics. By applying food ingredients in their consumed forms to the replicated model of human digestion and gut microbiota, their contribution to microbial shifts and metabolite production could be explored, reflecting real-world conditions. There is a need to further examine the effects of commonly consumed individual ingredients in everyday meals—such as meat, fish, dairy products, fruits, and vegetables—on the gut microbiota. As more data accumulate, it may be possible to identify optimal food combinations for improving gut health. Additionally, in vitro fermentation model that simulates gastrointestinal conditions in patients with gut disorders could potentially provide tailored dietary recommendations for therapeutic purposes.
Data availability statement
The original contributions presented in the study are publicly available. This data can be found here: https://www.ncbi.nlm.nih.gov/, PRJNA1212984.
Ethics statement
The studies involving humans were approved by National Institute of Agricultural Sciences, Republic of Korea. The studies were conducted in accordance with the local legislation and institutional requirements. The participants provided their written informed consent to participate in this study.
Author contributions
DL: Data curation, Investigation, Methodology, Validation, Writing – original draft, Writing – review & editing. IH: Conceptualization, Data curation, Formal analysis, Project administration, Supervision, Visualization, Writing – original draft, Writing – review & editing.
Funding
The author(s) declare that financial support was received for the research, authorship, and/or publication of this article. This study was carried out with the support of the “Research Program for Agricultural Science & Technology Development (PJ016762)” by the National Institute of Agricultural Sciences. Rural Development Administration, Republic of Korea.
Conflict of interest
The authors declare that the research was conducted in the absence of any commercial or financial relationships that could be construed as a potential conflict of interest.
Generative AI statement
The authors declare that no Gen AI was used in the creation of this manuscript.
Publisher’s note
All claims expressed in this article are solely those of the authors and do not necessarily represent those of their affiliated organizations, or those of the publisher, the editors and the reviewers. Any product that may be evaluated in this article, or claim that may be made by its manufacturer, is not guaranteed or endorsed by the publisher.
Supplementary material
The Supplementary material for this article can be found online at: https://www.frontiersin.org/articles/10.3389/fmicb.2024.1512217/full#supplementary-material
References
Aboushanab, S. A., Khedr, S. M., Gette, I. F., Danilova, I. G., Kolberg, N. A., Ravishankar, G. A., et al. (2022). Isoflavones derived from plant raw materials: bioavailability, anti-cancer, anti-aging potentials, and microbiome modulation. Crit. Rev. Food Sci. Nutr. 63, 261–287. doi: 10.1080/10408398.2021.1946006
Bae, H. G., Kim, S., Lee, J. C., and Kim, M. J. (2021). Evaluation of antioxidant activity and lipid oxidative stability of roasted buckwheat according to in vitro digestive system. Korean Journal of Food Preservation. 28, 612–620. doi: 10.11002/kjfp.2021.28.5.612
Bouayed, J., Hoffmann, L., and Bohn, T. (2011). Total phenolics, flavonoids, anthocyanins and antioxidant activity following simulated gastro-intestinal digestion and dialysis of apple varieties: bioaccessibility and potential uptake. Food Chem. 128, 14–21. doi: 10.1016/j.foodchem.2011.02.052
Bourdeau-Julien, I., Castonguay-Paradis, S., Rochefort, G., Perron, J., Lamarche, B., Flamand, N., et al. (2023). The diet rapidly and differentially affects the gut microbiota and host lipid mediators in a healthy population. Microbiome. 11:26. doi: 10.1186/s40168-023-01469-2
Cani, P. D., and de Vos, W. M. (2017). Next-generation beneficial microbes: the case of Akkermansia muciniphila. Front. Microbiol. 8:1765. doi: 10.3389/fmicb.2017.01765
Chung, W. S. F., Meijerink, M., Zeuner, B., Holck, J., Louis, P., Meyer, A. S., et al. (2017). Prebiotic potential of pectin and pectic oligosaccharides to promote anti-inflammatory commensal bacteria in the human colon. FEMS Microbiol. Ecol. 93:fix127. doi: 10.1093/femsec/fix127
Coakley, M., Banni, S., Johnson, M. C., Mills, S., Devery, R., Fitzgerald, G., et al. (2009). Inhibitory effect of conjugated α-linolenic acid from bifidobacteria of intestinal origin on SW480 cancer cells. Lipids 44, 249–256. doi: 10.1007/s11745-008-3269-z
Coker, J. K., Moyne, O., Rodionov, D. A., and Zengler, K. (2021). Carbohydrates great and small, from dietary fiber to sialic acids: how glycans influence the gut microbiome and affect human health. Gut Microbes 13, 1–18. doi: 10.1080/19490976.2020.1869502
Deehan, E. C., Yang, C., Perez-Muñoz, M. E., Nguyen, N. K., Cheng, C. C., Triador, L., et al. (2020). Precision microbiome modulation with discrete dietary fiber structures directs short-chain fatty acid production. Cell Host Microbe 27, 389–404.e6. doi: 10.1016/j.chom.2020.01.006
Didinger, C., and Thompson, H. J. (2022). The role of pulses in improving human health: a review. Legume Sci. 4:e147. doi: 10.1002/leg3.147
Engels, C., Ruscheweyh, H. J., Beerenwinkel, N., Lacroix, C., and Schwab, C. (2016). The common gut microbe Eubacterium hallii also contributes to intestinal propionate formation. Front. Microbiol. 7:713. doi: 10.3389/fmicb.2016.00713
Gong, X., Li, X., Xia, Y., Xu, J., Li, Q., Zhang, C., et al. (2020). Effects of phytochemicals from plant-based functional foods on hyperlipidemia and their underpinning mechanisms. Trends Food Sci. Technol. 103, 304–320. doi: 10.1016/j.tifs.2020.07.026
Han, X., Tian, H., Yang, L., and Ji, Y. (2024). Bidirectional Mendelian randomization to explore the causal relationships between the gut microbiota and male reproductive diseases. Sci. Rep. 14:18306. doi: 10.1038/s41598-024-69179-9
Hettiarachchi, H. A. C. O., Gunathilake, K. D. P. P., and Jayatilake, S. (2021). Effect of in-vitro gastrointestinal digestion and dialysis process on phenolic compounds and antioxidant capacity of selected underutilized fruits in Sri Lanka. Trop. Agric. Res. 32, 212–218. doi: 10.4038/tar.v32i2.8468
Hiippala, K., Barreto, G., Burrello, C., Diaz-Basabe, A., Suutarinen, M., Kainulainen, V., et al. (2020). Novel Odoribacter splanchnicus strain and its outer membrane vesicles exert immunoregulatory effects in vitro. Frontiers in microbiology. 11:575455. doi: 10.3389/fmicb.2020.575455
Hiippala, K., Kainulainen, V., Kalliomäki, M., Arkkila, P., and Satokari, R. (2016). Mucosal prevalence and interactions with the epithelium indicate commensalism of Sutterella spp. Front. Microbiol. 7:1706. doi: 10.3389/fmicb.2016.01706
Holmes, A. J., Chew, Y. V., Colakoglu, F., Cliff, J. B., Klaassens, E., Read, M. N., et al. (2017). Diet-microbiome interactions in health are controlled by intestinal nitrogen source constraints. Cell Metab. 25, 140–151. doi: 10.1016/j.cmet.2016.10.021
Jaagura, M., Viiard, E., Karu‐Lavits, K., and Adamberg, K. (2021). Low‐carbohydrate high‐fat weight reduction diet induces changes in human gut microbiota. Microbiologyopen. 10:e1194. doi: 10.1002/mbo3.1194
Johnson, A. J., Zheng, J. J., Kang, J. W., Saboe, A., Knights, D., and Zivkovic, A. M. (2020). A guide to diet-microbiome study design. Front. Nutr. 7:79. doi: 10.3389/fnut.2020.00079
Kadyan, S., Sharma, A., Arjmandi, B. H., Singh, P., and Nagpal, R. (2022). Prebiotic potential of dietary beans and pulses and their resistant starch for aging-associated gut and metabolic health. Nutrients 14:1726. doi: 10.3390/nu14091726
Kanehisa, M., Furumichi, M., Sato, Y., Kawashima, M., and Ishiguro-Watanabe, M. (2023). KEGG for taxonomy-based analysis of pathways and genomes. Nucleic Acids Res. 51, D587–D592. doi: 10.1093/nar/gkac963
Karolkowski, A., Guichard, E., Briand, L., and Salles, C. (2021). Volatile compounds in pulses: a review. Food Secur. 10:3140. doi: 10.3390/foods10123140
Kim, H. S., Oh, K. Y., Lee, S. M., Kim, J. Y., Lee, S. H., Jang, J. S., et al. (2021). Effect of extraction methods on the quality of pomegranate juice and physiological activity. Journal of Korean Society of Food Science and Nutrition. 50, 136–148. doi: 10.3746/jkfn.2021.50.2.136
Laitinen, K., and Mokkala, K. (2019). Overall dietary quality relates to gut microbiota diversity and abundance. Int. J. Mol. Sci. 20. doi: 10.3390/ijms20081835
Lee, S. M., Park, H. J., Kim, H. S., Kim, J. Y., Lee, S. H., Jang, J. S., et al. (2019). Quality characterization by various juice extraction method and changes in physiological activities by in vitro digestion of Angelica keiskei, Brassica oleracea, and Oenanthe javanica vegetable juices. Journal of Korean Society of Food Science and Nutrition. 48, 718–727. doi: 10.3746/jkfn.2019.48.7.718
Li, Z., Rasic, M., Kwan, M., Sepulveda, M., McIntosh, C., Shastry, V., et al. (2023). Oral administration of the commensal Alistipes onderdonkii prolongs allograft survival. American Journal of Transplantation. 23, 272–277. doi: 10.1016/j.ajt.2022.11.011
Li, J., Gao, X., Sun, X., Li, H., Wei, J., Lv, L., et al. (2024). Investigating the causal role of the gut microbiota in esophageal cancer and its subtypes: a two-sample Mendelian randomization study. BMC Cancer 24:416. doi: 10.1186/s12885-024-12205-w
Lin, R., Liu, W., and Piao, M. (2017). A review of the relationship between the gut microbiota and amino acid metabolism. Amino Acids 49, 2083–2090. doi: 10.1007/s00726-017-2493-3
Liu, G., Tang, J., Zhou, J., and Dong, M. (2024). Short-chain fatty acids play a positive role in colorectal cancer. Discov. Oncol. 15:425. doi: 10.1007/s12672-024-01313-5
Lozupone, C. A., Stombaugh, J. I., Gordon, J. I., Jansson, J. K., and Knight, R. (2012). Diversity, stability, and resilience of the human gut microbiota. Nature 489, 220–230. doi: 10.1038/nature11550
Mandalari, G., Faulks, R. M., Rich, G. T., Lo Turco, V., Picout, D. R., Lo Curto, R. B., et al. (2008). Release of protein, lipid, and vitamin E from almond seeds during digestion. J. Agric. Food Chem. 56, 3409–3416. doi: 10.1021/jf073393v
Meslier, V., Laiola, M., De Filippis, F., Roume, H., Quinquis, B., Giacco, R., et al. (2020). Mediterranean diet intervention in overweight and obese subjects lowers plasma cholesterol and causes changes in the gut microbiome and metabolome independently of energy intake. Gut 69, 1258–1268. doi: 10.1136/gutjnl-2019-320438
Minekus, M., Alminger, M., Alvito, P., Ballance, S., Bohn, T. O. R. S. T. E. N., Bourlieu, C., et al. (2014). A standardised static in vitro digestion method suitable for food–an international consensus. Food Funct. 5, 1113–1124. doi: 10.1039/C3FO60702J
Moreira de Gouveia, M. I., Bernalier-Donadille, A., and Jubelin, G. (2024). Enterobacteriaceae in the human gut: dynamics and ecological roles in health and disease. Biology 13:142. doi: 10.3390/biology13030142
Mukherjee, A., Lordan, C., Ross, R. P., and Cotter, P. D. (2020). Gut microbes from the phylogenetically diverse genus Eubacterium and their various contributions to gut health. Gut Microbes 12:1802866. doi: 10.1080/19490976.2020.1802866
Narduzzi, L., Agulló, V., Favari, C., Tosi, N., Mignogna, C., Crozier, A., et al. (2022). (Poly) phenolic compounds and gut microbiome: new opportunities for personalized nutrition. Microbiome Res. Rep. 1:16. doi: 10.20517/mrr.2022.06
Nogal, A., Louca, P., Zhang, X., Wells, P. M., Steves, C. J., Spector, T. D., et al. (2021). Circulating levels of the short-chain fatty acid acetate mediate the effect of the gut microbiome on visceral fat. Front. Microbiol. 12:711359. doi: 10.3389/fmicb.2021.711359
Notting, F., Pirovano, W., Sybesma, W., and Kort, R. (2023). The butyrate-producing and spore-forming bacterial genus Coprococcus as a potential biomarker for neurological disorders. Gut Microbiome 4:e16. doi: 10.1017/gmb.2023.14
Oku, T., Tanabe, K., Ogawa, S., Sadamori, N., and Nakamura, S. (2011). Similarity of hydrolyzing activity of human and rat small intestinal disaccharidases. Clin. Exp. Gastroenterol. 4, 155–161. doi: 10.2147/CEG.S19961
Olendzki, B., Bucci, V., Cawley, C., Maserati, R., McManus, M., Olednzki, E., et al. (2022). Dietary manipulation of the gut microbiome in inflammatory bowel disease patients: pilot study. Gut Microbes 14:2046244. doi: 10.1080/19490976.2022.2046244
Ondov, B. D., Bergman, N. H., and Phillippy, A. M. (2011). Interactive metagenomic visualization in a web browser. BMC Bioinformatics 12:385. doi: 10.1186/1471-2105-12-385
Parker, B. J., Wearsch, P. A., Veloo, A. C. M., and Rodriguez-Palacios, A. (2020). The genus Alistipes: gut bacteria with emerging implications to inflammation, cancer, and mental health. Front. Immunol. 11:906. doi: 10.3389/fimmu.2020.00906
Pihelgas, S., Ehala-Aleksejev, K., Adamberg, S., Kazantseva, J., and Adamberg, K. (2024). The gut microbiota of healthy individuals remains resilient in response to the consumption of various dietary fibers. Sci. Rep. 14:22208. doi: 10.1038/s41598-024-72673-9
Purdel, C., Margină, D., Adam-Dima, I., and Ungurianu, A. (2023). The beneficial effects of dietary interventions on gut microbiota—an up-to-date critical review and future perspectives. Nutrients 15:5005. doi: 10.3390/nu15235005
Ren, Y. M., Zhuang, Z. Y., Xie, Y. H., Yang, P. J., Xia, T. X., Xie, Y. L., et al. (2024). BCAA-producing Clostridium symbiosum promotes colorectal tumorigenesis through the modulation of host cholesterol metabolism. Cell Host Microbe 32, 1519–1535.e7. doi: 10.1016/j.chom.2024.07.012
Rinott, E., Meir, A. Y., Tsaban, G., Zelicha, H., Kaplan, A., Knights, D., et al. (2022). The effects of the green-Mediterranean diet on cardiometabolic health are linked to gut microbiome modifications: a randomized controlled trial. Genome Med. 14:29. doi: 10.1186/s13073-022-01015-z
Rios-Covian, D., Salazar, N., Gueimonde, M., and de los Reyes-Gavilan, C. G. (2017). Shaping the metabolism of intestinal bacteroides population through diet to improve human health. Front. Microbiol. 8:376. doi: 10.3389/fmicb.2017.00376
Rivière, A., Selak, M., Lantin, D., Leroy, F., and de Vuyst, L. (2016). Bifidobacteria and butyrate-producing colon bacteria: importance and strategies for their stimulation in the human gut. Front. Microbiol. 7:979. doi: 10.3389/fmicb.2016.00979
Rodríguez, C., Romero, E., Garrido-Sanchez, L., Alcaín-Martínez, G., Andrade, R. J., Taminiau, B., et al. (2020). Microbiota insights in Clostridium difficile infection and inflammatory bowel disease. Gut Microbes 12:1725220. doi: 10.1080/19490976.2020.1725220
Ross, F. C., Patangia, D., Grimaud, G., Lavelle, A., Dempsey, E. M., Ross, R. P., et al. (2024). The interplay between diet and the gut microbiome: implications for health and disease. Nat. Rev. Microbiol. 22, 671–686. doi: 10.1038/s41579-024-01068-4
Seegers, J. F., Bui, T. P. N., and de Vos, W. M. (2021). Remarkable metabolic versatility of the commensal bacteria Eubacterium hallii and Intestinimonas butyriciproducens: Potential next-generation therapeutic microbes. Probiotic Bacteria and Postbiotic Metabolites: Role in Animal and Human Health., 139–151. doi: 10.1007/978-981-16-0223-8_5
Shang, Z., Pai, L., and Patil, S. (2024). Unveiling the dynamics of gut microbial interactions: a review of dietary impact and precision nutrition in gastrointestinal health. Front. Nutr. 11:1395664. doi: 10.3389/fnut.2024.1395664
Shiowatana, J., Kitthikhun, W., Sottimai, U., Promchan, J., and Kunajiraporn, K. (2006). Dynamic continuous-flow dialysis method to simulate intestinal digestion for in vitro estimation of mineral bioavailability of food. Talanta 68, 549–557. doi: 10.1016/j.talanta.2005.04.068
Singh, V., Lee, G. D., Son, H. W., Koh, H., Kim, E. S., Unno, T., et al. (2023). Butyrate producers, “the sentinel of gut”: their intestinal significance with and beyond butyrate, and prospective use as microbial therapeutics. Front. Microbiol. 13:1103836. doi: 10.3389/fmicb.2022.1103836
Starke, S., Harris, D. M., Zimmermann, J., Schuchardt, S., Oumari, M., Frank, D., et al. (2023). Amino acid auxotrophies in human gut bacteria are linked to higher microbiome diversity and long-term stability. ISME J. 17, 2370–2380. doi: 10.1038/s41396-023-01537-3
Sugihara, K., and Kamada, N. (2024). Metabolic network of the gut microbiota in inflammatory bowel disease. Inflamm. Regen. 44:11. doi: 10.1186/s41232-024-00321-w
Tso, R., and Forde, C. G. (2021). Unintended consequences: nutritional impact and potential pitfalls of switching from animal-to plant-based foods. Nutrients 13:2527. doi: 10.3390/nu13082527
Vacca, M., Celano, G., Calabrese, F. M., Portincasa, P., Gobbetti, M., and de Angelis, M. (2020). The controversial role of human gut lachnospiraceae. Microorganisms. 8:573. doi: 10.3390/microorganisms8040573
Valentino, V., Magliulo, R., Farsi, D., Cotter, P. D., O’Sullivan, O., Ercolini, D., et al. (2024). Fermented foods, their microbiome and its potential in boosting human health. Microbial biotechnology. 17:e14428. doi: 10.1111/1751-7915.14428
Valles-Colomer, M., Menni, C., Berry, S. E., Valdes, A. M., Spector, T. D., and Segata, N. (2023). Cardiometabolic health, diet, and the gut microbiome: a meta-omics perspective. Nat. Med. 29, 551–561. doi: 10.1038/s41591-023-02260-4
Wang, J., Qin, J., Li, Y., Cai, Z., Li, S., Zhu, J., et al. (2012). A metagenome-wide association study of gut microbiota in type 2 diabetes. Nature 490, 55–60. doi: 10.1038/nature11450
Wright, E. K., Kamm, M. A., Teo, S. M., Inouye, M., Wagner, J., and Kirkwood, C. D. (2015). Recent advances in characterizing the gastrointestinal microbiome in Crohn’s disease: a systematic review. Inflammatory bowel diseases. 21, 1219–1228. doi: 10.1097/mib.0000000000000382
Xavier, A. A., and Mariutti, L. R. (2021). Static and semi-dynamic in vitro digestion methods: state of the art and recent achievements towards standardization. Curr. Opin. Food Sci. 41, 260–273. doi: 10.1016/j.cofs.2021.08.002
Xu, X., Ocansey, D. K. W., Hang, S., Wang, B., Amoah, S., Yi, C., et al. (2022). The gut metagenomics and metabolomics signature in patients with inflammatory bowel disease. Gut Pathogens. 14:26. doi: 10.1186/s13099-022-00499-9
Yang, J., Liu, S., Zhao, Q., Li, X., and Jiang, K. (2023). Gut microbiota-related metabolite alpha-linolenic acid mitigates intestinal inflammation induced by oral infection with toxoplasma gondii. Microbiome. 11:273. doi: 10.1186/s40168-023-01681-0
Yang, W., Fan, X., Li, W., and Chen, Y. (2024). Causal influence of gut microbiota on small cell lung cancer: a Mendelian randomization study. The Clinical Respiratory Journal. 18:e13764. doi: 10.1111/crj.13764
Zafar, H., and Saier, M. H. (2021). Gut bacteroides species in health and disease. Gut Microbes 13, 1–20. doi: 10.1080/19490976.2020.1848158
Keywords: gut fermentation, in vitro digestion, human microbiome, pulse, diversity
Citation: Lee DB and Hwang IS (2025) Macronutrient balance determines the human gut microbiome eubiosis: insights from in vitro gastrointestinal digestion and fermentation of eight pulse species. Front. Microbiol. 15:1512217. doi: 10.3389/fmicb.2024.1512217
Edited by:
Mohammad Altamimi, An-Najah National University, PalestineReviewed by:
Francisco Jose Roig, Universidad San Jorge, SpainRui Li, Chinese Academy of Sciences (CAS), China
Copyright © 2025 Lee and Hwang. This is an open-access article distributed under the terms of the Creative Commons Attribution License (CC BY). The use, distribution or reproduction in other forums is permitted, provided the original author(s) and the copyright owner(s) are credited and that the original publication in this journal is cited, in accordance with accepted academic practice. No use, distribution or reproduction is permitted which does not comply with these terms.
*Correspondence: In Seon Hwang, c3VuaTA4NDVAZ21haWwuY29t