
94% of researchers rate our articles as excellent or good
Learn more about the work of our research integrity team to safeguard the quality of each article we publish.
Find out more
ORIGINAL RESEARCH article
Front. Microbiol., 26 September 2024
Sec. Food Microbiology
Volume 15 - 2024 | https://doi.org/10.3389/fmicb.2024.1470115
This article is part of the Research TopicEnsuring Food Safety and Quality in Sustainable Emerging Production MethodsView all 5 articles
Introduction: As one of the main grain crops in China, maize is highly susceptible to Aspergillus infection during processing, storage and transportation due to high moisture at harvest, which results in the loss of quality. The aim of this study is to explore the early warning marker molecules when Aspergillus infects maize kernels.
Methods: Firstly, strains MA and MB were isolated from moldy maize and identified by morphological characterization and 18S rRNA gene sequence analysis to be Aspergillus flavus (A. flavus) and Aspergillus niger (A. niger). Next, fresh maize was moldy by contaminated with strains MA and MB. The volatile organic compounds (VOCs) during the contamination process of two fungal strains were analyzed by gas chromatography-ion mobility spectrometry (GC-IMS). A total of 31 VOCs were detected in maize contaminated with strain MA, a total of 32 VOCs were detected in maize contaminated with strain MB, including confirmed monomers and dimers. Finally, heat maps and principal component analysis (PCA) showed that VOCs produced in different growth stages of Aspergillus had great differences. Combined with the results of GC-IMS, total fungal colony counts and fungal spores, it was concluded that the Aspergillus-contaminated maize was in the early stage of mold at 18 h.
Results: Therefore, the characteristic VOCs butan-2-one, ethyl acetate-D, Benzaldehyde, and pentan-2-one produced by maize at 18 h of storage can be used as early mildew biomarkers of Aspergillus infection in maize.
Discussion: This study provided effective marker molecules for the development of an early warning and monitoring system for the degree of maize mildew in granaries.
Maize, as an important food crop in China with uneven production and balanced consumption, is an important cash crop for national economic development. Chinese total maize output in 2022 is 261 million tons, accounting for about 39% of the country’s total grain output, of which about 10% is used for rations, 20% is used for industrial processing, and 70% is used for feed (Timm et al., 2022). Maize is very susceptible to mildew because of its nutrition, which not only directly affects the color, taste and processing of maize kernels (Niu and Xiang, 2018), but also results in a decline in the quality of maize. These changes are detrimental to storage stability and can lead to the loss of seed, food and feeding value of maize (Coradi et al., 2021). The essence of mildew is that microorganisms use organic matter in grain for catabolism. Microorganisms can carry out nutritional metabolic activities when they are in suitable environmental conditions, which in turn lead to mildew in grain (Zhang Y. et al., 2023). It has been reported that maize was frequently contaminated with fungal and produced mycotoxins, especially Aspergillus, which caused significant economic losses and health risks (Chandravarnan et al., 2022; Marshall et al., 2020). Therefore, early warning of Aspergillus risk is of great significance for the scientific control and security of agricultural products such as maize.
Thin-layer chromatography (TLC), high performance liquid chromatography (HPLC), Liquid chromatograph-mass spectrometer (LC-MS/MS) and enzyme-linked immunosorbent assay (ELISA) have been widely used for the detection mycotoxins in food and feed (Lu et al., 2024). However, these methods often suffer from complex steps, long operating times and poor detection sensitivity. With the continuous development of chromatography and spectroscopy techniques, the identification of mold in the food industry has shifted to the detection of growth metabolites such as mycotoxins and volatile organic compounds (VOCs) produced by mold (Gu et al., 2020). Microbial VOCs (MVOCs) are primary or secondary metabolic volatile compounds produced by bacteria and fungi during their growth and reproduction (Jiang et al., 2023; Chen et al., 2022). Aspergillus flavus (A. flavus) and Aspergillus niger (A. niger) consumed a variety of nutrients, produced a variety of metabolites, and released a variety of VOCs that affected the quality and safety of grains during the growth process. A new technique named gas chromatography-ion migration spectrometry (GC-IMS) monitoring system is commonly used in current research. Compared with electronic nose (E-nose) and gas chromatography-mass spectrometry (GC-MS), GC-IMS has the advantages of simple use, portable equipment, high sensitivity and no need for sample pretreatment (Parastar and Weller, 2024). At present, the application of this technique in food is mainly focused on wine, fruits and tea, but less research has been conducted in the field of maize mildew detection (Tang and Peng, 2024; Yang et al., 2024; Huang et al., 2023; Wang et al., 2020). Considering the above factors, GC-IMS was used to establish an effective method for the identification of VOCs in maize infected by Aspergillus at different growth stages. The infection process of A. flavus and A. niger was analyzed by constructing fingerprint spectra and heat maps, and the identification molecules of maize early mildew were found by combining principal component analysis (PCA) and cluster analysis, so as to explore the feasibility of the application of this method in the rapid assessment and early warning of the mildew degree of Aspergillus-infected maize.
NK 718 maize kernels were harvested in Xingyang country, Zhengzhou city, Henan province, China, in 2023, and the initial moisture content was 13.5% (w/w). Potato dextrose agar (PDA) was acquired from Beijing Aobox Biotechnology Co., Ltd. (Beijing, China) and sodium hypochlorite (NaClO) was purchased from Shanghai Aladdin Biochemical Technology Co., Ltd. (Shanghai, China). All reagents used in this study were analytical-grade.
The moisture content of maize was adjusted from 13.5 to 15% by referring to the method of Kinyungu et al. (2019) with minor modifications. A sample of 500 g of maize kernels with 15% moisture content was placed in a sterile transparent plastic bag and stored in an HWS constant temperature and humidity chamber (Ningbo Southeast Instrument Co., Ltd., Ningbo, Zhejiang, China) at 30°C until the sample became moldy. Then 25 g of moldy maize was mixed with 225 mL of sterile water and shaken in an HPY-92 Bed Temperature Incubator (Shanghai Yuejin Medical Equipment Co., Ltd., Shanghai, China) at 30°C and 150 rpm for 30 min. Subsequently, the suspension was evenly spread on PDA plates and incubated at 28°C for 3–5 days (Liu et al., 2022). Finally, single colonies were obtained by purification culture using the three-point inoculation method, from which strain MA and strain MB were screened for further experiments.
Strain MA and strain MB were inoculated on PDA plates and incubated at 28°C for 5 days. Then a drop of cotton blue staining solution was added to the slides, and the morphology of strains MA and MB were observed under the BM1000 Biological Microscope (Nanjing Jiangnan Yongxin Optical Co., Ltd., Nanjing, Jiangsu, China). The morphological characteristics of strain MA and strain MB were compared with GB/T 4789.16-2016. The DNA of fungal strains was extracted using the Magnetic Bead Method Fungal Genome Extraction Kit, and the 18S rRNA gene was amplified by PCR using the fungal universal primers ITS1 (5′-TCCGTAGGTGAACCTGCGG-3′) and ITS4 (5′-TCCTCCGCTTATTGATATATGC-3′) (Caligiore-Gei et al., 2023). The amplified products were detected by agarose gel electrophoresis and then sequenced by Beijing Liuhe Huada Gene Technology Co., Ltd. (Beijing, China). The 18S rRNA gene sequence results were uploaded to the National Center for Biotechnology Information (NCBI)-GenBank using Bankit Tool to obtain the NCBI login number. In addition, the 18S rRNA gene sequence of the strain was compared with the sequence in the NCBI database, and the sequence with higher homology was selected as the reference sequence. MEGA X software adopted neighbor-joining method to construct the phylogenetic tree (Kumar et al., 2018). Available online: https://www.ncbi.nlm.nih.gov/, accessed on 3 June 2024, and the accession numbers of strains MA and MB were PP843644 and PP843646, respectively.
Maize kernels of uniform size with no insect infestation and no mechanical damage were selected, soaked in 0.3% sodium hypochlorite solution for 5 min, rinsed three times with sterile water, and then naturally ventilated at room temperature (Han et al., 2020). After drying the surface of the maize kernels, they were divided into two groups, each weighing about 250 g. The two groups of maize samples were immersed in suspensions of strain MA and strain MB spores with a concentration of about 106–107 spore/mL for 10 s, and then placed in a petri dish of sterile water agar medium, dried at room temperature (Majumdar et al., 2021). Subsequently, we placed them in an HWS constant temperature and humidity chamber at 30°C for cultivation and observation of contamination of maize by strain MA and strain MB (Zhang J. et al., 2023). Uncontaminated maize samples were used as control group. The samples were collected every 18 h. Among them, 5 g were stored in a 20 mL headspace vials in a refrigerator at −20°C for a total of four times, and three biological replicates were set up for each treatment.
The total fungal colony counts were determined by the plate count method (Zhang D. D. et al., 2024). Firstly, 25 g maize kernels were mixed with 225 mL sterile water and shaken well to make a fungal suspension with a concentration of 10−1, and then the fungal suspensions with dilution concentrations of 10−2 and 10−3 were prepared sequentially. After that, 100 μL of different dilutions of the fungal suspension were absorbed on PDA medium, evenly coated, and then placed in the incubator at 28°C for 3–5 days. Finally, the plates with colonies of 10–150 CFU were selected for counting, and the total number of fungal colonies was calculated. Three parallel experiments were performed for each dilution. For the sake of further analysis, the log of fungal spore quantity was calculated.
The fungal spores in maize were determined by enumeration spores of fungi (Zhang et al., 2021). Firstly, 10 g maize kernels and 30 mL deionized water were placed in a 50 mL test tube, which was corked and shaken vigorously up and down for 1 min (about 120–150 times). Next, the mixture was homogenized and filtered with 300 mesh filter cloth and the filtrate was collected for subsequent determination. Finally, the fungal spores were counted using a hemocytometer (25 medium squares with V equal to 0.1 mm3). After the counting chamber of the hemocytometer was examined microscopically and free of dirt, a 20 mm × 20 mm coverslip was covered, and a drop of the filtrate was added to the plate with a rubber-tipped burette to ensure that no bubbles were generated. The fungal spores were counted for 30 s on a BM1000 biological microscope with an eyepiece of 10× and an objective of 10×. When the total number of spores in the 5 medium squares was less than 10, the number of spores in the 25 medium squares needed to be recorded. Two parallel counts were carried out for each sample, and the maximum of the two counts was taken as the experimental result. In addition, the maize samples were classified into four grades based on the results of fungal spores in storage, which were healthy (<1.0 × 10⁵), mild mildew (1.0 × 10⁵–9.9 × 10⁵), moderate mildew (1.0 × 10⁶–9.9 × 10⁶) and heavy mildew (≥1.0 × 10⁷). Three biological parallel experiments were performed for each sample.
The VOCs in maize were identified and quantitatively analyzed by GC-IMS flavor analyzer (FlavourSpec® 1H1-00053, Dortmund, Germany) under different storage conditions. Referring to Kang et al. (2024) method and slightly modified, with 5 g maize kernels in a headspace vial, an injection needle temperature of 80°C, an incubation temperature of 60°C, an incubation time of 10 min, and 500 μL of sample injected by desorption in splitterless mode. A WAX capillary column (30 m, ID: 0.53 mm) at 50°C was used for chromatographic separation with nitrogen as carrier gas. Under isothermal conditions, carrier gas flow chromatography was used to separate the carrier gas flow rate from 2 mL/min for 2 min, increasing to 15 mL/min within 8 min, 100 mL/min within 10 min, and linearly increasing to 150 mL/min at 10 min. The total time for the analysis was 30 min (Li X. et al., 2019). Three biological parallel experiments were performed for each sample.
Statistical analysis and data visualization using SPSS Statistics 25 software, Origin (2022) software and Hiplot platform (Zhang D. D. et al., 2024). The Laboratory Analytical Viewer (LAV, G.A.S., Dortmund, Germany), three plug-ins (G.A.S., Dortmund, Germany) and GC-IMS Library Search were used to analyze the samples from different perspectives (Yang et al., 2019). Use the LAV analysis software that comes with the device Reporter, Gallery, Dynamic PCA plug-in and GC-IMS Library Search was used to construct difference maps of VOCs. Subsequently, two-dimensional qualitative analysis of the analytical sample materials was performed using the built-in NIST 2014 gas phase retention index database and the IMS migration time database of G.A.S. (Monedeiro et al., 2019). Meanwhile, PCA and heat maps were used to cluster maize samples (Pan et al., 2024).
Two dominant fungi, strain MA and strain MB, were isolated from moldy maize. The morphological characteristics of strain MA were shown in Figure 1A. The colony was slightly flocculent in texture, with a convex center and regular edges, and was yellowish green on the front side (Figure 1A,a). The middle of the dorsal surface of strain MA was light brown with no exudate (Figure 1A,b). The conidial peduncle was long, the terminal capsule was flask-shaped, and the conidia were mostly spherical and a few were oval (Figure 1A,c). The morphological characteristics of strain MB were shown in Figure 1B. Strain MB was fast growing, with flat colonies, loose texture, white at the beginning of the frontal surface and black velvet at the later stage (Figure 1B,a), while strain MB was yellow with no exudate on the back side (Figure 1B,b). The conidial peduncle was smooth and of variable length, the head acrosome was spherical, and the surface of the conidial was rough and black-brown spherical (Figure 1B,c). Phylogenetic tree was constructed based on 18S rRNA genes of strain MA and strain MB, closely related reference strains (Figure 2). On the base of point above, the dominant fungal strain MA was identified as A. flavus, and strain MB was identified as A. niger.
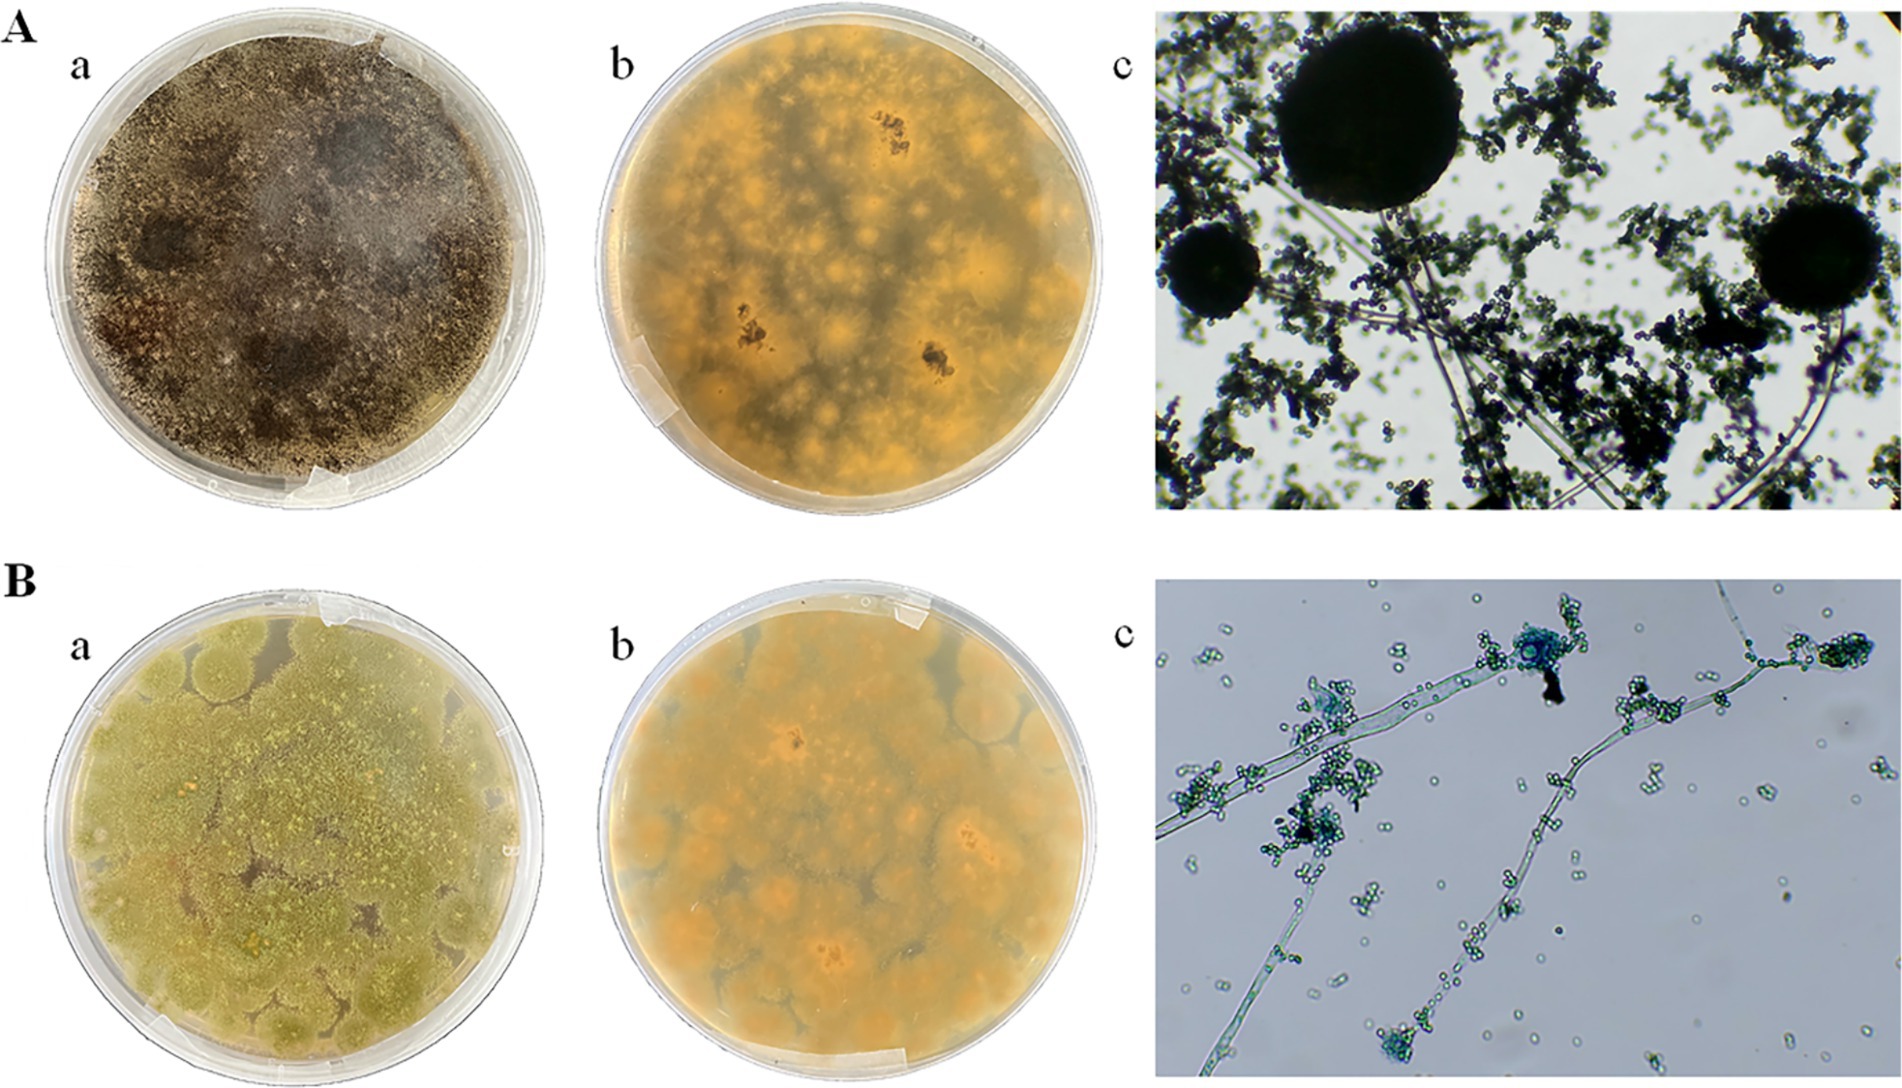
Figure 1. Morphological characteristics of strain MA and strain MB on PDA medium and under biological microscope. (A) Strain MA: (a) front side; (b) back side; (c) microscopic examination. (B) Strain MB: (a) front side; (b) back side; (c) microscopic examination.
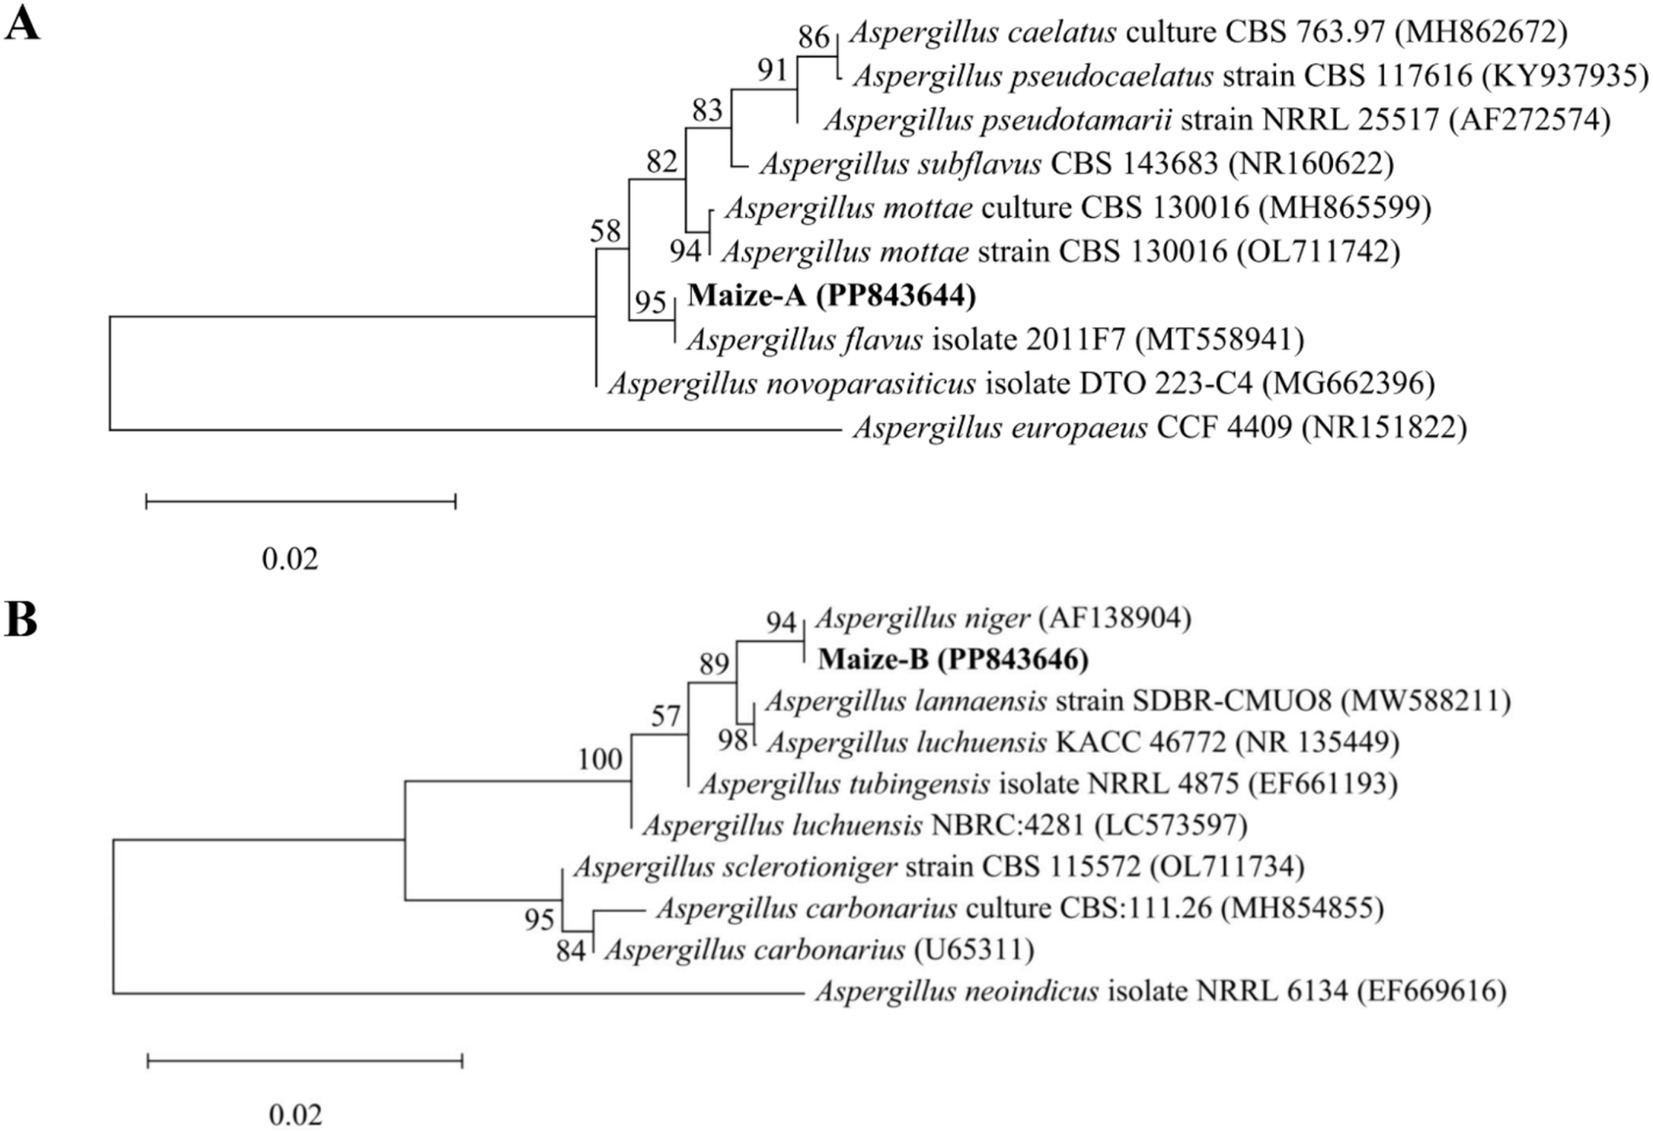
Figure 2. Phylogenetic tree of strain MA and strain MB and close reference strains based on 18S rRNA genes. (A) Phylogenetic tree of Aspergillus flavus. (B) Phylogenetic tree of Aspergillus niger.
The total fungal colony counts of maize infected with strains MA and MB were determined by the plate count method as shown in Figure 3. The results showed that with the extension of storage time, the total fungal colony counts of maize all showed an increasing trend. When stored for 0 h, the total colony counts of maize were all at a low level of about 2.8 lg CFU/g. During the period from 0 h to 18 h, the growth rate of the total colony counts of maize infected by the two fungi was relatively slow and in the delayed period, which was due to the fact that the nutrients in the kernels had not been completely absorbed (Guo et al., 2019). The total number of colonies of maize infected by the strain MA increased significantly during 18 h to 36 h, while the total number of colonies of maize infected by strain MB increased significantly during 18 h to 54 h, which was due to the fact that the fungi continuously absorbed nutrients in the early stage under suitable conditions and the cell division was slow. When the nutrients accumulated to a certain extent, the growth was rapid, which was in the logarithmic growth period. Then the growth of the total colony counts slowed down, and it was in the stable growth period. In addition, the total colony counts of maize infected by strain MB were consistently greater than those of strain MA-infected maize during the same storage time. The total colony count of strain MA-infected maize reached 4.2 lg CFU/g at 72 h, whereas the total colony count of strain MB-infected maize had reached 4.2 lg CFU/g at 54 h.
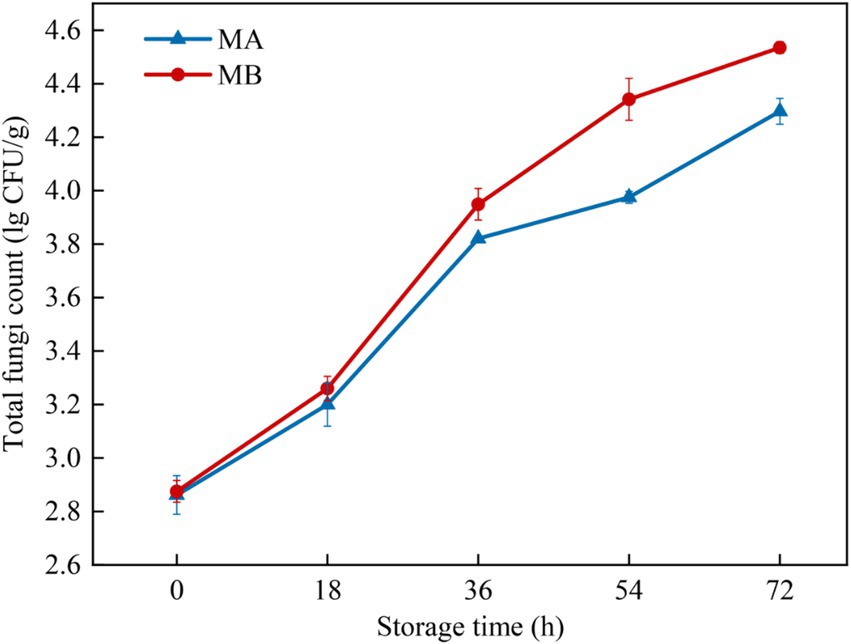
Figure 3. Total fungal colony counts in maize contaminated by dominant fungal strains MA and MB. The relative standard deviation of total fungi counts is represented with bars (n = 3).
The results of fungal spores in different moldy maize samples were shown in Figure 4. It can be seen that with the growth of storage time, the number of fungal spores infecting maize by strains MA and MB both increased gradually, and the status of maize kernels gradually changed from healthy to heavy mildew (Figure 4). In the storage time of 0 h, the number of fungal spores in maize was less than 1.0 × 10⁵ count/g, which was in a healthy state. After storage for 18 h, the number of fungal spores gradually began to increase, and the maize kernels were mildly mildewed. When the maize was stored for 36 h, the number of fungal spores ranged from 1.0 × 10⁶ to 9.9 × 10⁶ count/g, which was in the moderate mildew state. In the storage time of 54 h, the maize infected by strain MA was still in a moderate mildew state, while the maize contaminated by strain MB was in a heavy mildew state, with the number of fungal spores greater than 1.0 × 10⁷ count/g. When stored for 72 h, all maize kernels were in a heavy mildew state. In addition, the number of fungal spores in maize contaminated by strain MB was greater than the number of fungal spores in maize infected by strain MA. Therefore, strain MB contaminated maize more severely than strain MA at the same time.
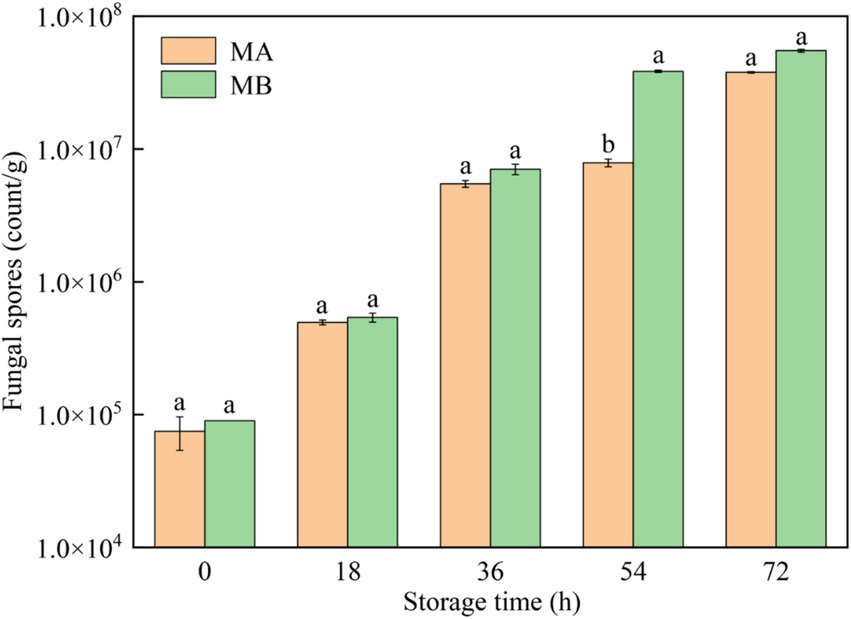
Figure 4. Fungal spores in maize contaminated by dominant fungal strains MA and MB. Different lowercase letters indicate significant differences (p < 0.05).
A. flavus and A. niger contamination of maize consumes many nutrients, produces various metabolites, and forms various VOCs, which affect the quality and flavor of maize. The VOCs produced by A. flavus and A. niger at different growth stages were analyzed by GC-IMS to explore the characteristic VOCs of Aspergillus at different infection stages in maize (Rahnavard et al., 2024). Figure 5A showed the mildew of maize kernels at different times after contamination by A. flavus and A. niger. A0 was the control group of A. flavus-contaminated maize, and A1-A4 were the samples collected at 18 h, 36 h, 54 h and 72 h after A. flavus contamination. B0 was the control group of A. niger-contaminated maize, and B1-B4 were the samples collected at 18 h, 36 h, 54 h and 72 h after A. niger contamination, respectively. Compared with the control group, the samples in groups A1 and B1 were mildly mildew, while samples in groups A2-A4 and B2-B4 were mildew more seriously. At the same time, it can be seen that the mildew phenomenon of A. niger-contaminated maize was more serious than that of A. flavus-contaminated maize, which may be related to the growth of mold. It was found in Figures 3, 4 that the total fungal colony counts and fungal spores in the maize infected by A. niger were larger than those in the maize infected by A. flavus at the same time, which was consistent with the phenomenon in this research.
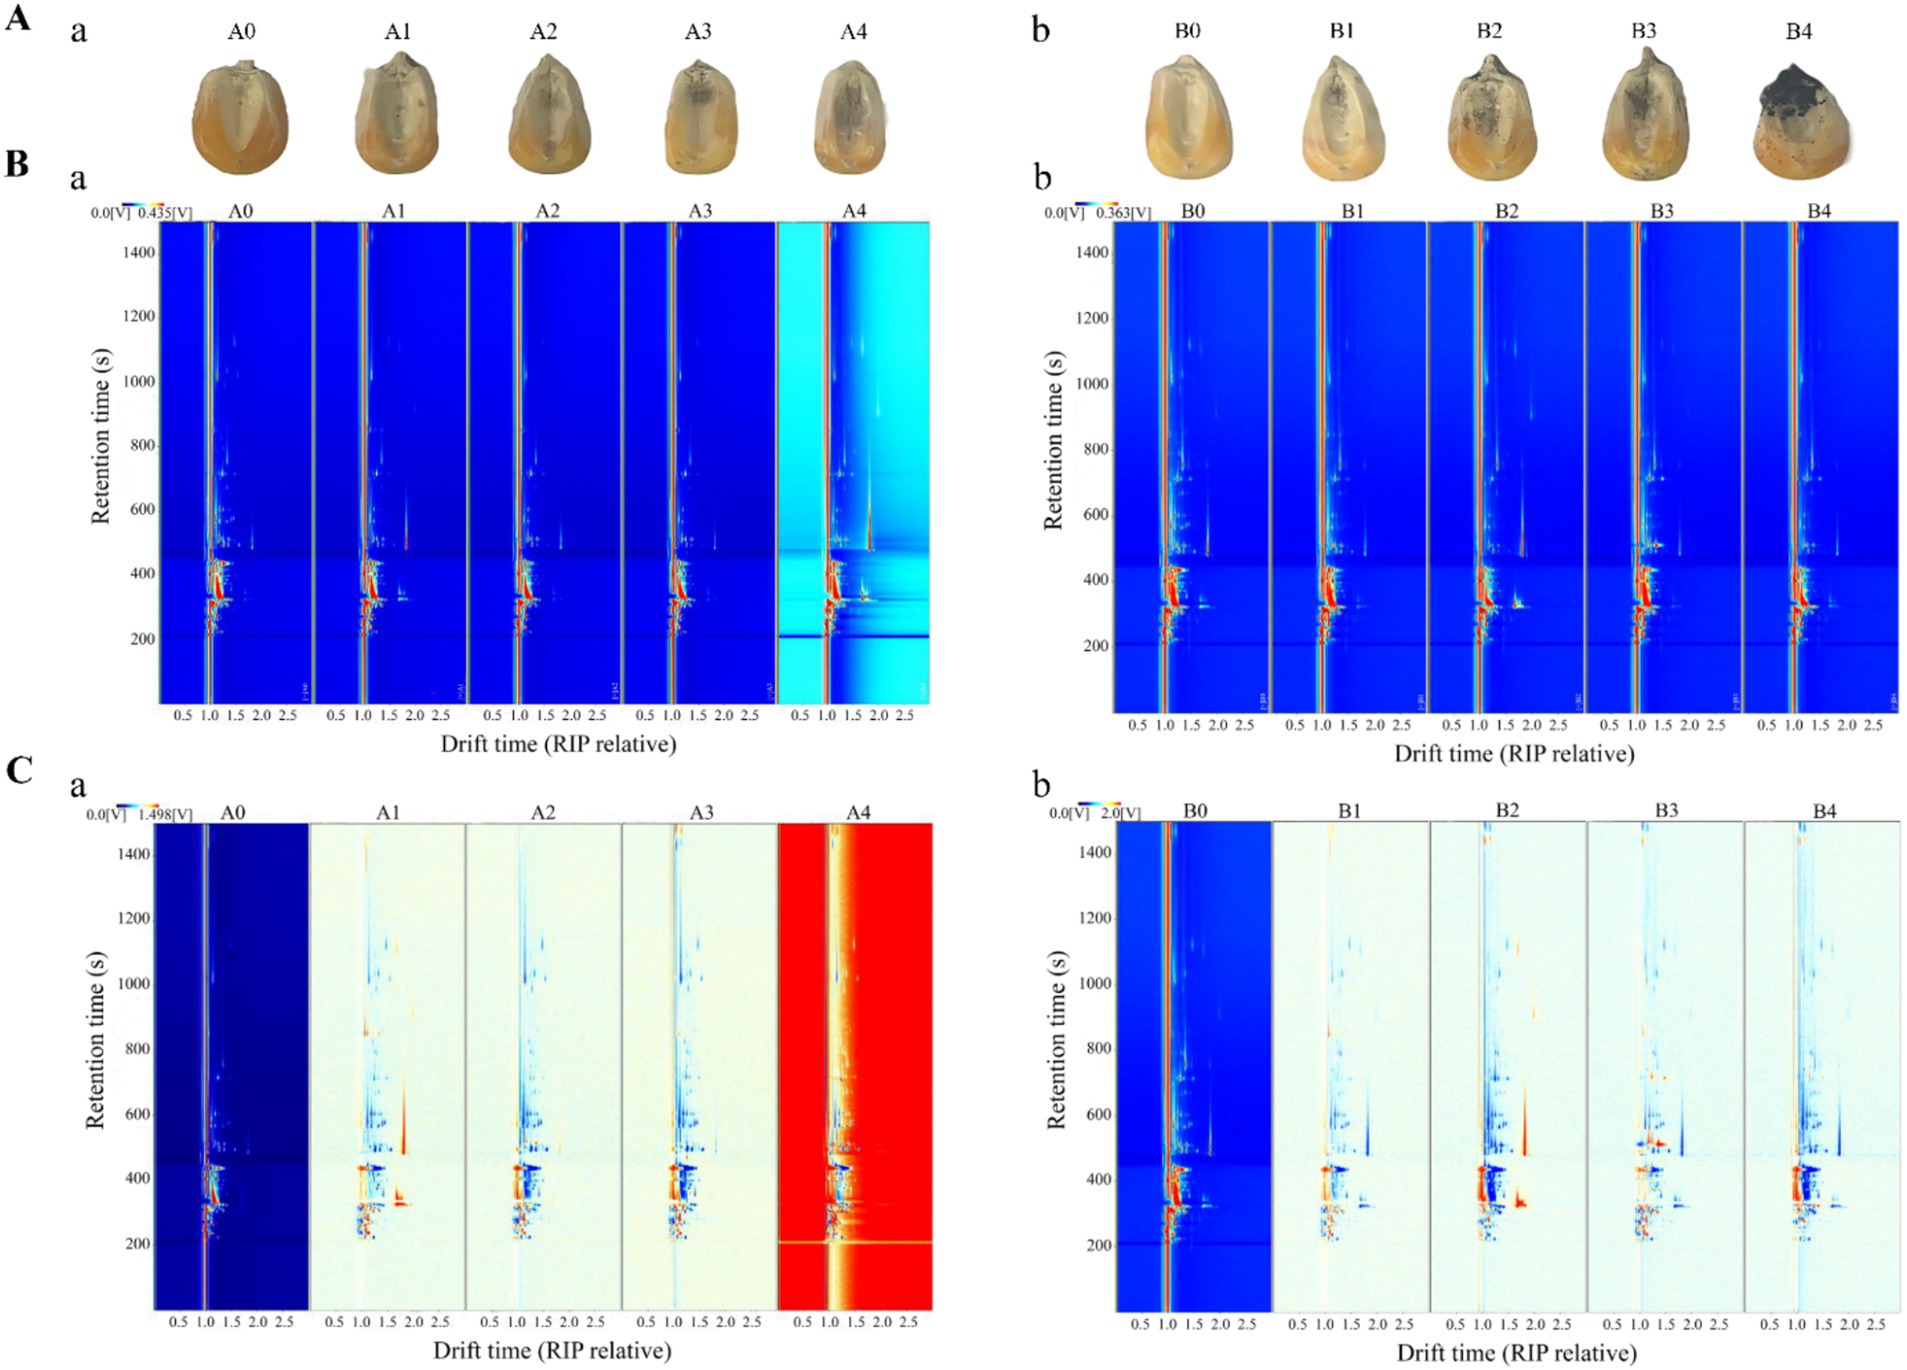
Figure 5. Maize samples and GC-IMS topography of maize samples at different storage periods. (A) Samples of maize at different mold growth stages (tested every 18 h): (a) A. flavus-contaminated maize samples; (b) A. niger-contaminated maize samples. (B) Top view of GC-IMS for VOCs in maize at different times (direct comparison): (a) A. flavus-contaminated maize samples; (b) A. niger-contaminated maize samples. (C) GC-IMS for VOCs of maize at different times (comparison of differences): (a) A. flavus-contaminated maize samples; (b) A. niger-contaminated maize samples. A0, B0: maize samples infected with A. flavus and A. niger for 0 h; A1, B1: maize samples infected with A. flavus and A. niger for 18 h; A2, B2: maize samples infected with A. flavus and A. niger for 36 h; A3, B3: maize samples infected with A. flavus and A. niger for 54 h; A4, B4: maize samples infected with A. flavus and A. niger for 72 h.
To further investigate the changing pattern of VOCs in maize kernels at different growth stages of Aspergillus contamination, two-dimensional spectra of aromatic compounds in maize kernels were determined by GC-IMS as shown in Figure 5B. The total compounds in the sample headspace were shown by the entire spectrum, and each individual volatile compound was shown by the point to the right of the reactive ion peak (RIP). Substance signal intensities were shown by color, with white indicating low intensities and red indicating high intensities, and the darker the color, the higher the intensity. The results of Figure 5B showed that the retention time of most signals during the process of A. flavus and A. niger uncontaminated maize kernels appeared in the range of 200–1,200 s, with a drift time of 1.0–2.0 s.
In order to more obviously compare the flavor changes of maize kernels at different stages of Aspergillus infection, the spectra of A0 and B0 were selected as reference spectra, and the spectra of other infection times were deducted from the reference to calculate the differences between the reference spectra of A0 and B0 and the spectra of other groups (Figure 5C). The white background indicated that the two VOCs are consistent; the red represented that the concentration of the substance is higher than the reference; and the blue represented that the concentration of the substance is lower than the reference. Figure 5C showed that the concentration signals of most VOCs in the samples of the contaminated experimental groups A1–A4 and B1–B4 were much higher than the reference spectra of the A0 and B0 control groups, which indicated that VOCs produced in different growth stages of the maize contaminated by A. flavus and A. niger have great differences. After being contaminated by Aspergillus, some of the compounds that are easily decomposed or degraded disappeared from the signal or the signal intensity decreased. On the contrary, the enhancement of certain signal strengths also indicated that the concentration of certain compounds increased after infection.
The previous experiments found that the types and concentrations of VOCs in different stages of infection were significantly different, in which some compounds may also exist as a monomer, dimer or polymer to produce spots or multiple signals, resulting in differences in the spectrum, depending on the actual concentration and compound properties (Gu et al., 2021; Arroyo-Manzanares et al., 2018). The drift time and retention time of ion-mobility spectra (IMS) of VOCs were compared with reference organic compounds in the database by the Library Search software of GC-IMS. Overall, 31 compounds were identified from the maize kernels infected by A. flavus (Figure 6A and Table 1), and 32 compounds were identified from the maize kernels infected by A. niger (Figure 6B and Table 2), in which the suffixes M and D of the substance with the same name represented the monomers and dimers of the same compound, respectively.
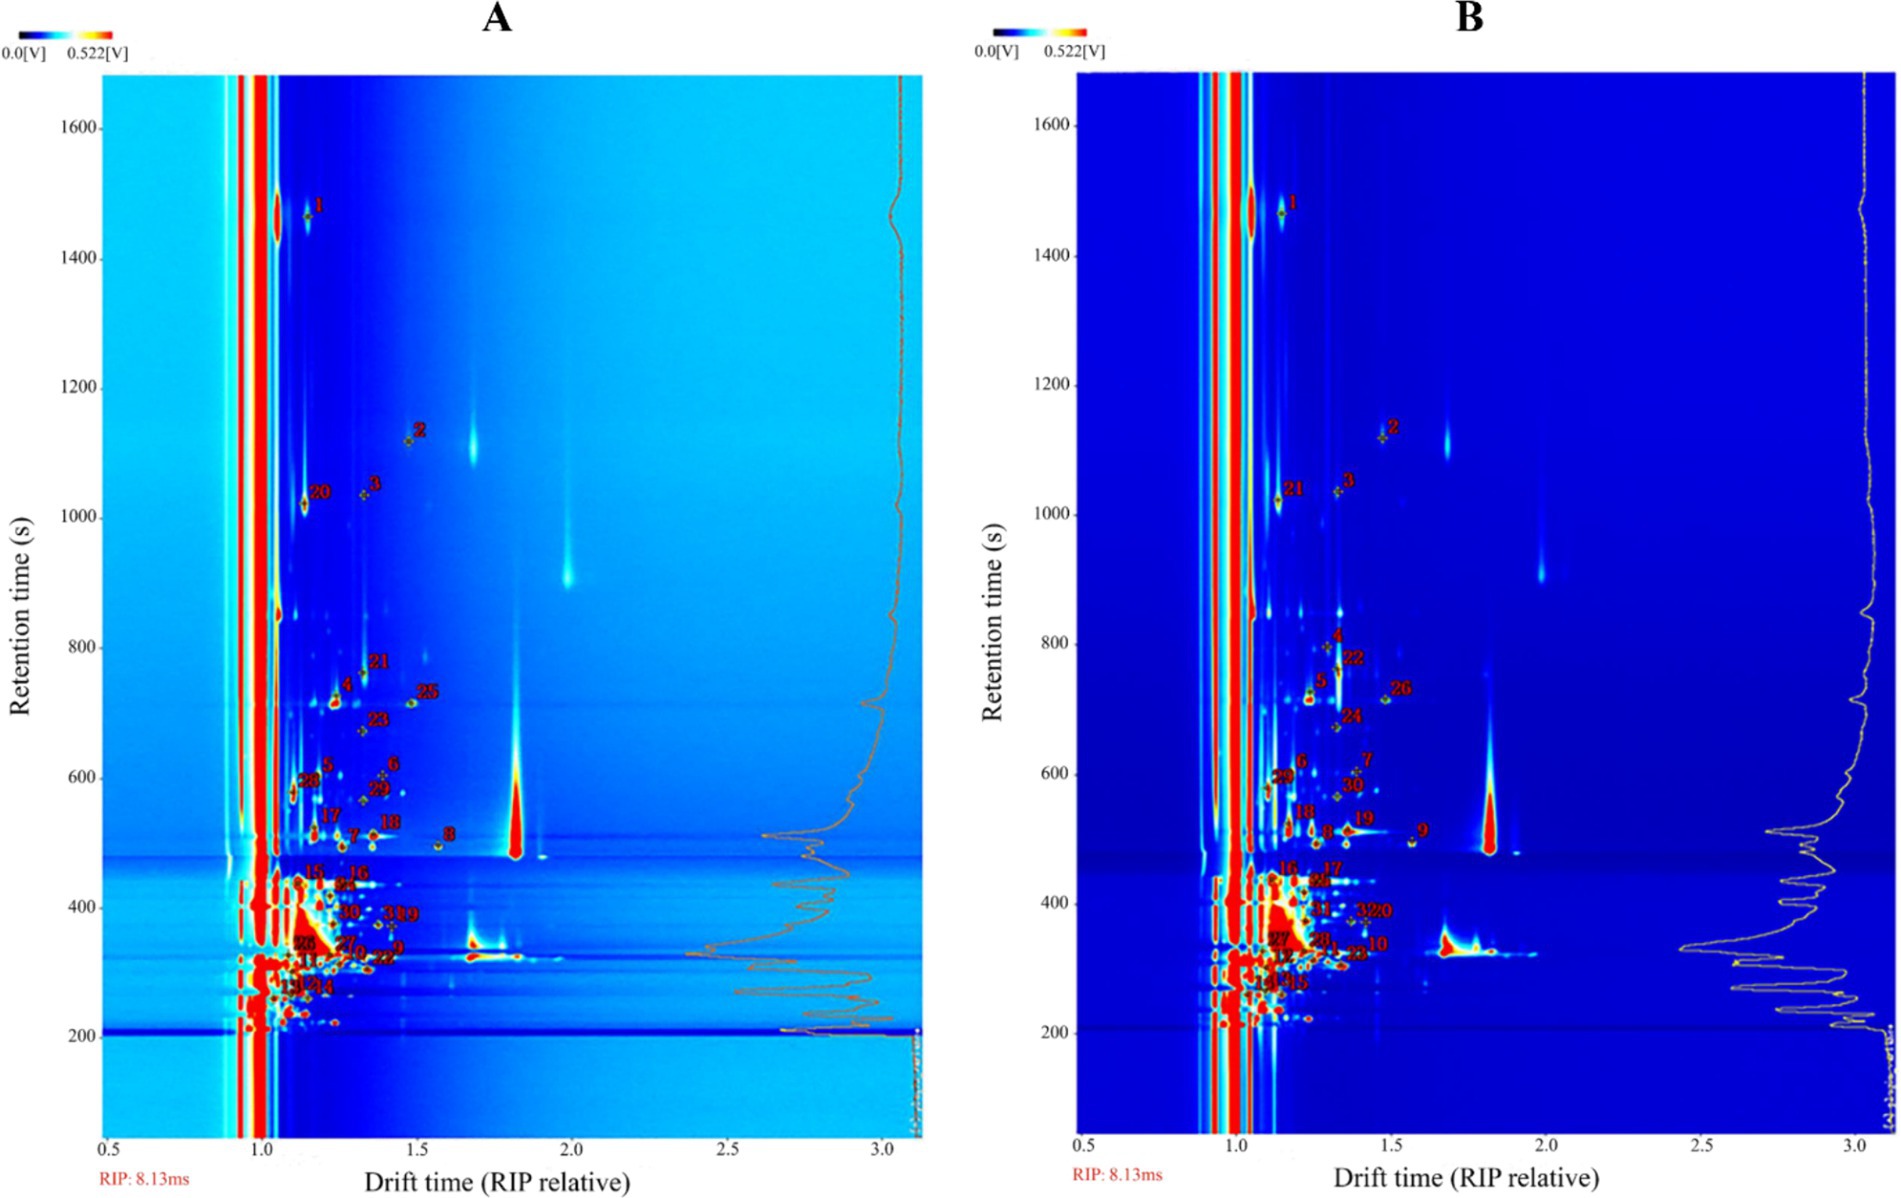
Figure 6. Ion mobility spectra of moldy maize. (A) A. flavus-contaminated maize samples. (B) A. niger-contaminated maize samples. The numbers indicate the identified VOCs.
In order to more directly observe the variation rules and relative content changes of VOCs in the process of Aspergillus infection of maize, the fingerprint spectrum of VOCs was plotted with the help of Gallery Plot plug-in, and the differences of VOCs among different samples were compared intuitively. Furthermore, the signal intensity of each aromatic compound indicated its concentration level (Chen et al., 2021).
Figure 7A showed the differential fingerprints of VOC species and concentrations in A. flavus-contaminated maize samples. As can be seen from Figure 7A, the signal intensity of VOCs such as 1-hexanol, butan-1-ol-D, valeraldehyde, cyclopentanone-D, hexana-M, propan-1-ol-D, 2, 6-dimethylpyrazine and alpha-pinene was very strong in the 0 h samples from region a. However, benzaldehyde, ethyl acetate-M, butan-2-one and other substances were almost non-existent in region a, and the strongest signal was found in the 18 h samples from region b. The concentrations of VOCs in regions c and d, such as 3-methyl-1-butanol-D, isobutanol-M, nonanal, propan-2-ol-M and heptanal, were higher than those in samples A2, A3, and A4 in the middle and late stages of the contamination, which were the main VOCs in the middle and late stages of maize mildew. Figure 7B showed the differential fingerprints of VOC species and concentrations in maize samples contaminated by A. niger. The signal intensities of VOCs such as alpha-pinene, heptanal, cyclopentanone-M, nonanal, butan-1-ol-D, valeraldehyde, hexanal-M, hexanal-D, p-cymene and others in the B0 sample of region a were much higher than those in the group of A. niger-contaminated samples. pentan-2-one, benzaldehyde, propanal-D, ethyl acetate-D and butan-2-one in region b were mainly presented in group B1 samples at the early stage of mildew. VOCs in region c such as ethyl hexanoate, isobutanol-D and 2-methylpropyl acetate appeared at 36–72 h in the middle and late stages of infection, and the signal intensity of these substances increased with the increase in A. niger infection time. The results showed that there were significant differences in VOCs at different infection stages in the experimental group, which provided a possibility for further monitoring of maize mildew.

Figure 7. Comparison of the fingerprints of VOCs in uninoculated and inoculated Aspergillus samples determined by GC-IMS. (A) A. flavus-contaminated maize samples. (B) A. niger-contaminated maize samples.
Cluster analysis of the data using heat maps was performed to further understand the differences in VOCs in Aspergillus contaminated maize kernels at different mold growth stages (Figure 8). Based on the vertical direction of the heat map, all samples were divided into three groups: the control group (A0, B0), the pre-mold stage (A1, B1) and the middle and late mold stages (A2–A4, B2–B4). The cluster analysis of VOCs in the A. flavus-contaminated maize kernels (Figure 8A) divided the substances in the samples into four categories: a, b, c and d. Among them, Group c was mainly found in the control group A0, the VOCs of Group b were mainly produced in the pre-mold stage A1, and the Groups a and d were mainly produced in the middle and late stages of mold A2–A4. The VOCs cluster analysis diagram of maize samples contaminated by A. niger (Figure 8B) classified the substances into three categories: a, b and c. The VOCs of Group a mainly existed in the control group B0, Group b was mainly produced in the pre-mold stage B1, and Group c was mainly produced in the middle and late stages B2–B4. Therefore, in order to achieve early monitoring and early warning, we focused on the detection targets of the compounds in Group b (Figure 8). The signals of benzaldehyde, pentan-2-one, butan-2-one and ethyl acetate in Group b were the strongest in the early stage of mildew. What’s more, it could be seen that the signals gradually weakened with the increase in the growth time of A. flavus and A. niger. The results showed that the sample group and the VOCs group set up in the experiment were well representative.
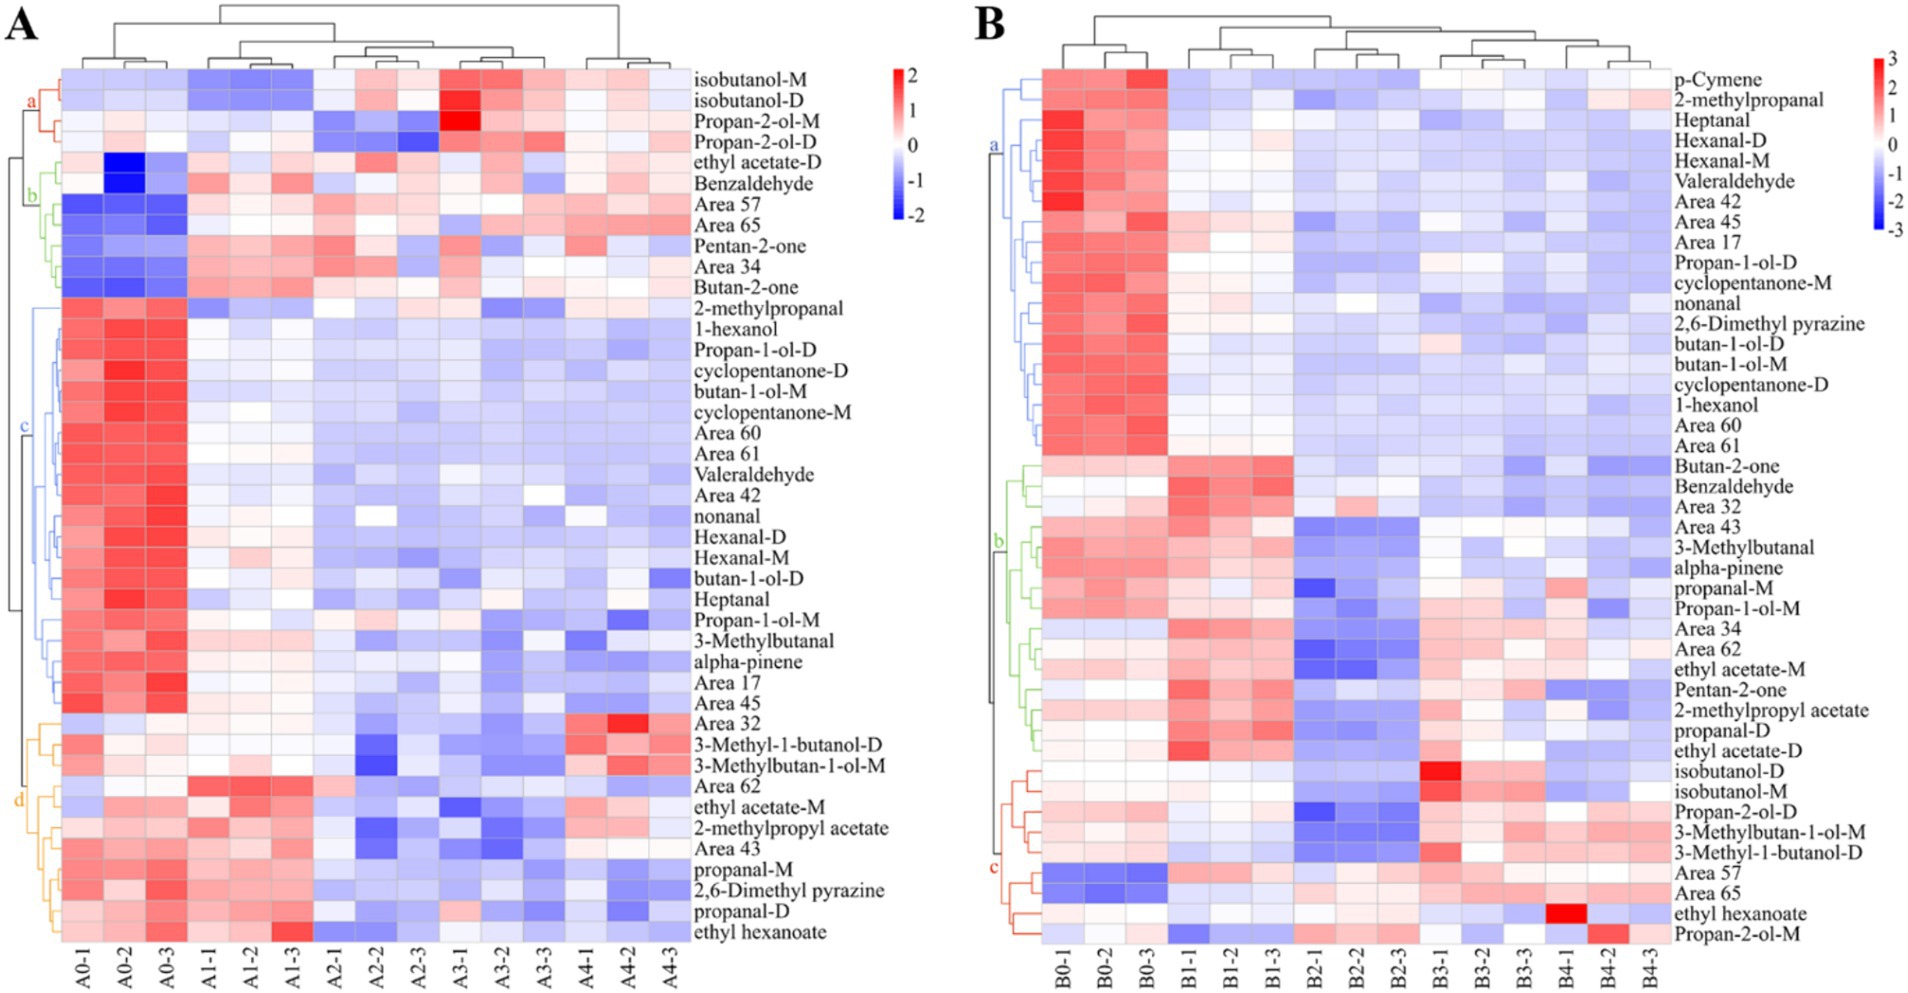
Figure 8. Heat map and cluster analysis of maize samples with different degrees of infection. (A) A. flavus-contaminated maize samples. (B) A. niger-contaminated maize samples.
Principal component analysis (PCA) is one of the most widely used data dimensionality reduction algorithms, the basic idea of which is to try to extract the main information of the data, and then discard the redundant information, so as to achieve the purpose of compression, while retaining the original data information to the greatest extent (Cavanna et al., 2019). Figure 9 showed the PCA data obtained from the analysis of the entire data of VOCs produced by Aspergillus-contaminated maize, which is divided into two parts: 1 and 2. Principal component 1 (PC1) accounted for 61.7% of the variance in the data, and PC2 accounted for 14.1% of the variance in Figure 9A,a. The results of the PCA were divided into four different regions, where region a included the A0 control group, region b included the pre-mold stage A1, region c included the middle stage of A2 and A3 mildew, and region d included the late stage of A4 mildew. In Figure 9A,b, PC1 and PC2 accounted for 47.4 and 31.4% of the variance in the data, respectively. The results of the PCA were divided into four different regions, where region a included the B0 control group, region b included the pre-mold stage B1, region c included the middle stage of B2 mildew, and region d included the late stage of B3 and B4 mildew. The PCA analysis of A. flavus and A. niger contaminated maize kernels showed a high degree of similarity in VOCs concentrations between samples from regions c and d, but significant differences between region b and the other regions. The results of the PCA were similar to the results of the previous cluster analysis heat maps.
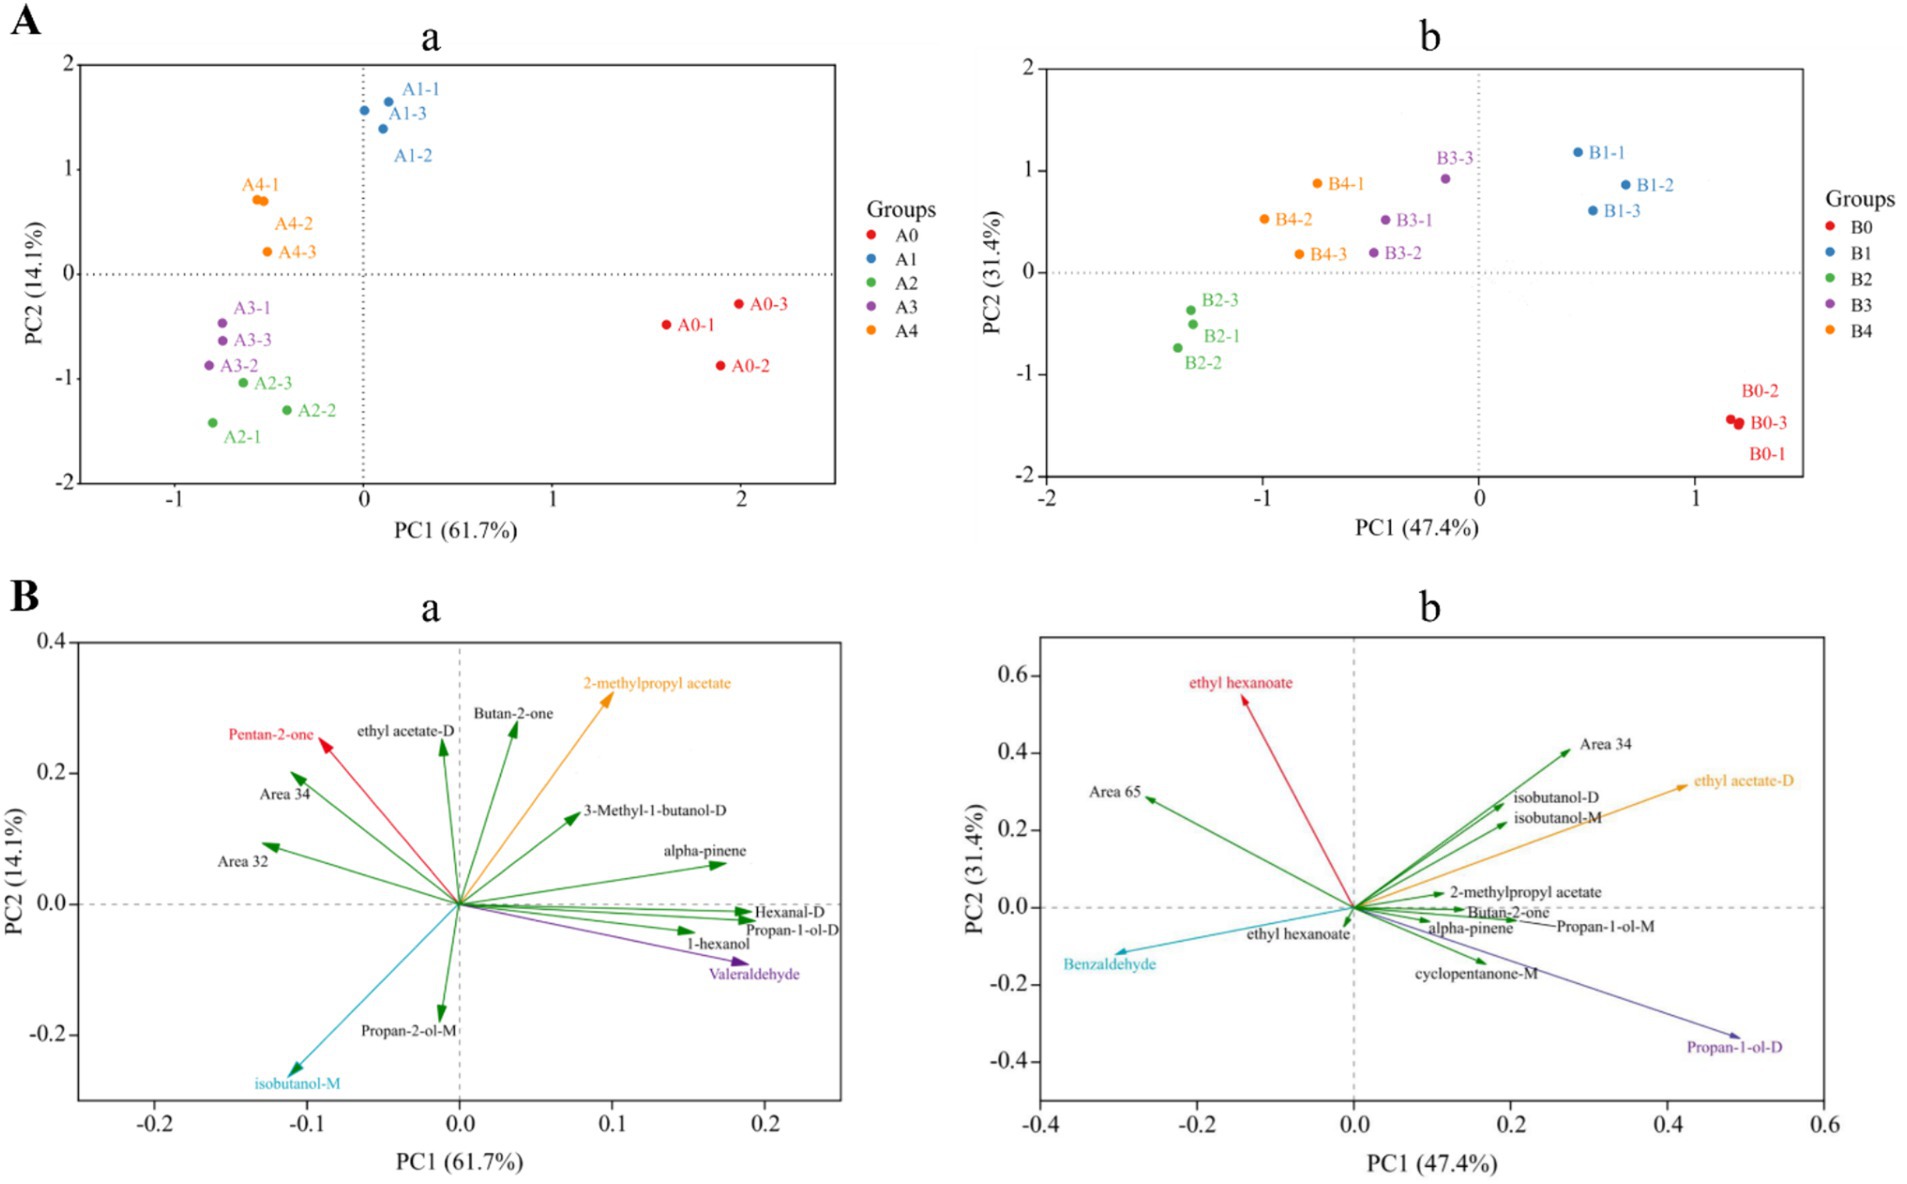
Figure 9. PCA analysis based on signal strength of maize samples. (A) Plot of the top two principal component scores: (a) A. flavus-contaminated maize samples; (b) A. niger-contaminated maize samples. (B) Plot of principal component loadings: (a) A. flavus-contaminated maize samples; (b) A. niger-contaminated maize samples.
Screening was performed using principal component loading plots to identify the VOCs that contributed the most to different principal component clusters. The direction and length of the vectors therein indicate the extent to which the variables contribute to the two principal components. It can be seen from Figure 9B,a that Valeraldehyde was positively correlated with the control group of A. flavus-contaminated maize samples, and 2-methylpropyl acetate was positively correlated with the samples at the early stage of aflatoxin growth. Then, for samples in the middle and late stages of mold growth, pentan-2-one and isobutanol-M were significantly positively correlated with the maize samples. In addition, the loading diagram of VOCs in maize samples contaminated by A. niger (Figure 9B,b) showed that propan-1-ol-D was positively correlated with the control group of maize samples, whereas ethyl acetate-D, which is the main characteristic flavor of B1, was the main cause of PC1.
The similarity between VOCs was analyzed and plotted in Figure 10, which showed that the differences between A. flavus and A. niger in maize samples in the pre-growth stage (A1, B1) and in the late growth stages (A2–A4, B2–B4) were large. The maize samples of A1 and B1 in the pre-mold stage could be separated from A0 and B0 in the control group. This finding is consistent with fingerprints and heat maps. This result provided a possibility for early monitoring and early warning of Aspergillus contamination in maize.
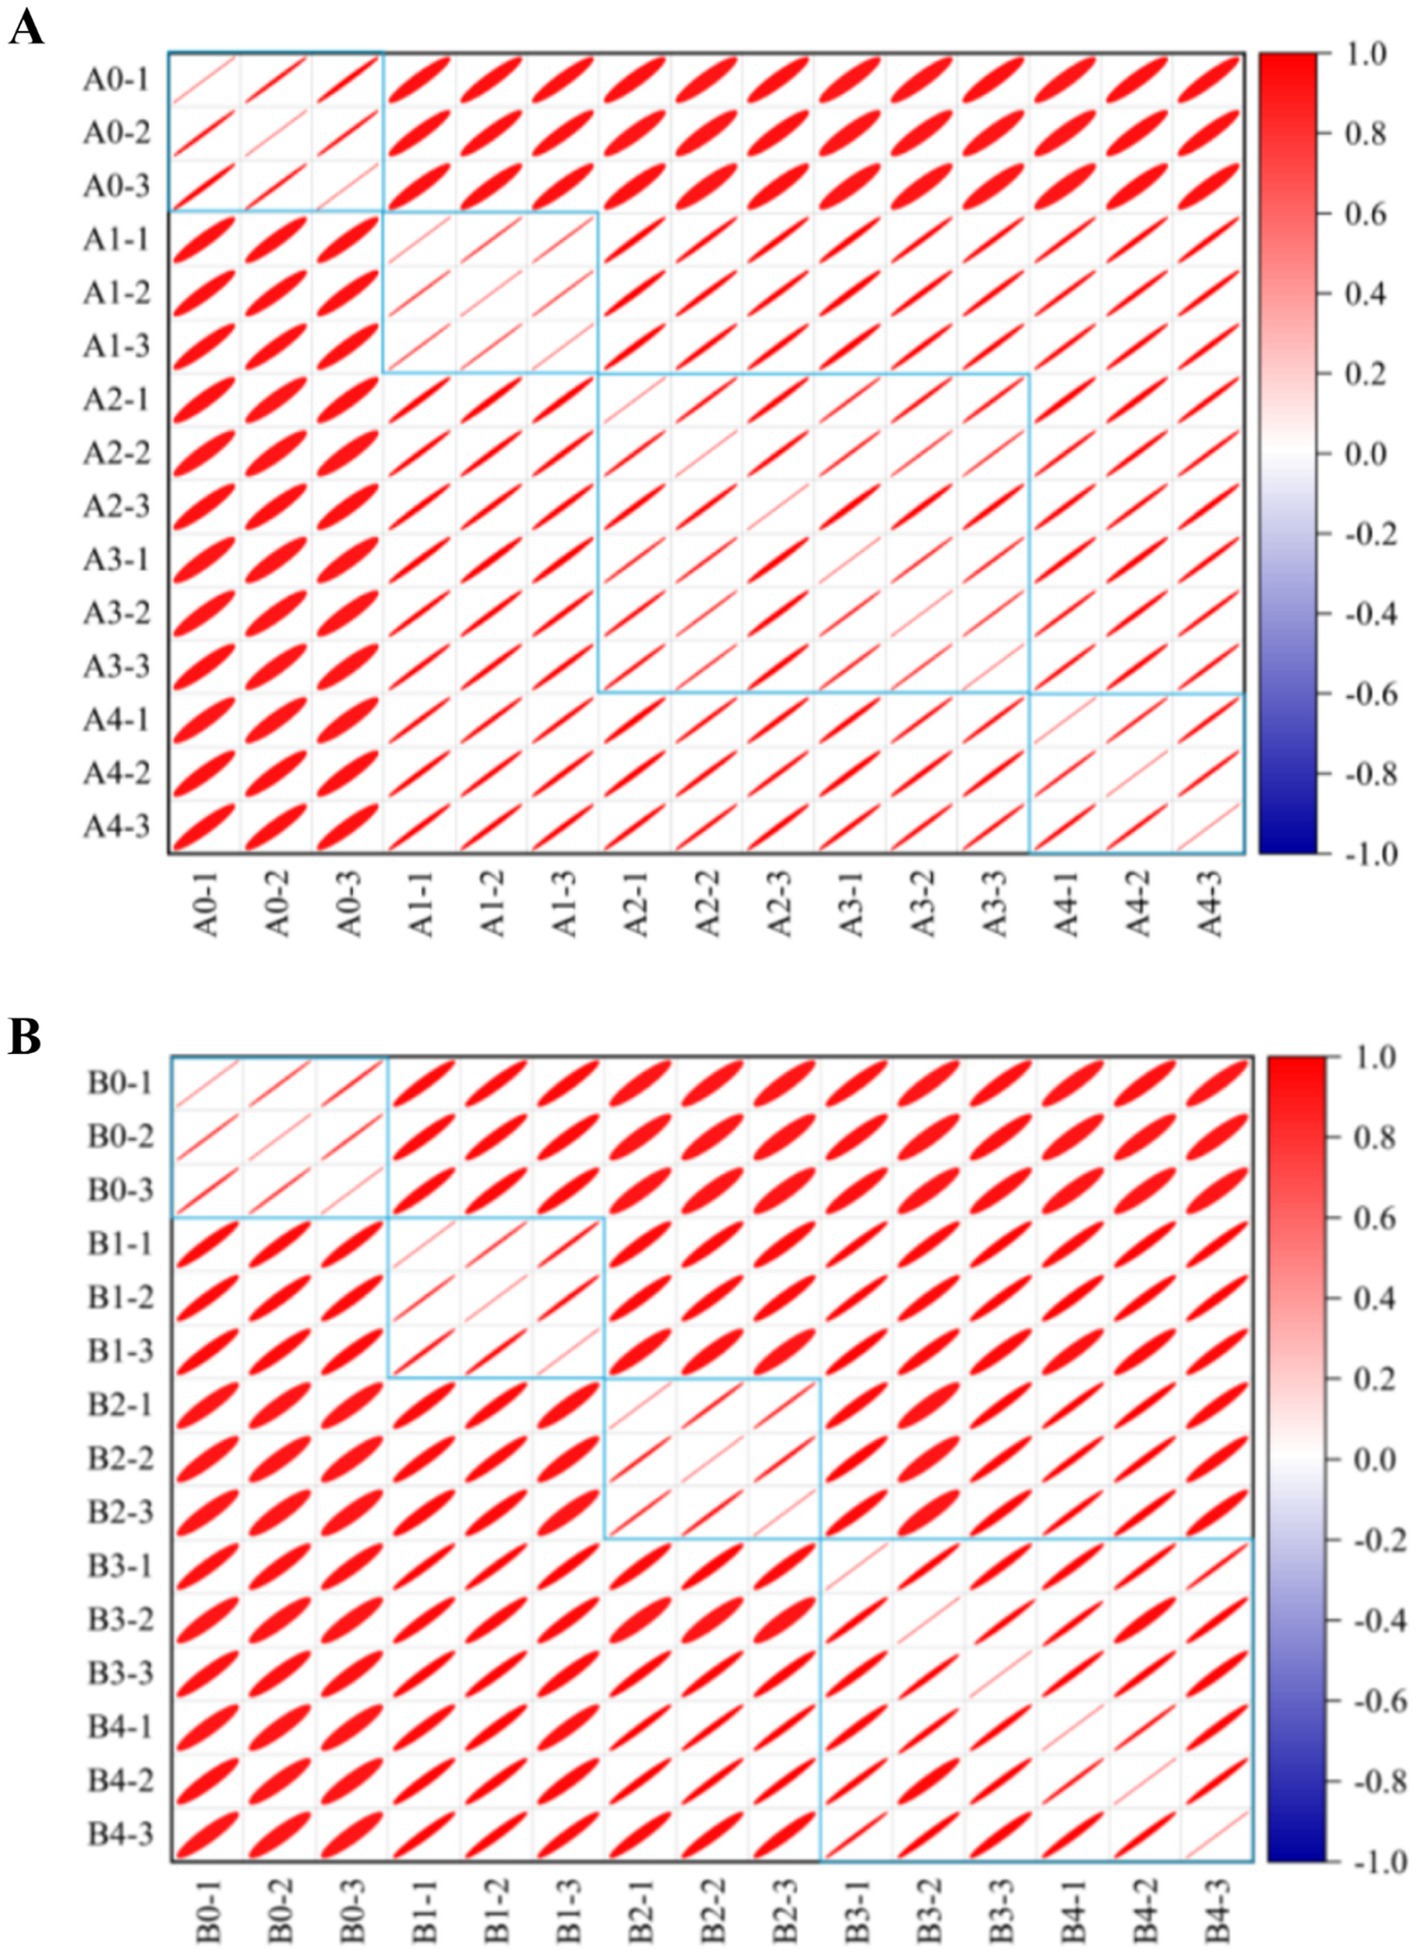
Figure 10. Similarity analysis of different groups in maize samples. (A) A. flavus-contaminated maize samples. (B) A. niger-contaminated maize samples. The colors in the similarity analysis between VOCs represent the degree of similarity from no correlation (dark blue) to high correlation (dark red). The area of the ellipse from small to large represents the correlation between VOCs from strong to weak.
As one of the major food crops in China, maize is an important source of raw materials and feed for the chemical and food industries, whose total output is second only to rice and wheat (Zou et al., 2024). However, maize is very susceptible to mold contamination during growth, harvesting, transportation and processing (Bocate et al., 2021), especially Aspergillus. Brito et al. (2022) pointed out that Aspergillus in maize stored in silo-bags mainly consisted of A. flavus, A. fumigatus and A. niger, with the highest incidence being A. flavus (61.75%). In this study, the predominant strains of mildew were selected from moldy maize, and A. flavus and A. niger were identified by morphological characterization and 18S rRNA gene sequence analysis (Figures 1, 2). Moldy maize not only leads to lower quality and economic losses, but can even pose a health risk to humans. A. flavus has been reported to produce aflatoxins such as AFB1 and AFB2, and A. niger produced B-group fumonitins, which were known to have deleterious effects such as teratogenicity, carcinogenesis and nephrotoxicity (Norlia et al., 2019; Zhang D. et al., 2024). Therefore, monitoring and controlling the quality of maize during storage based on A. flavus and A. niger is one of the main objectives of maize storage. Paolesse et al. (2006) used GC-MS to analyze maize infected with mold, and the experimental results showed that the VOCs of moldy maize included 3-methyl-1-butanol, 1-hexene, etc. Karlshøj et al. (2007) showed that VOCs such as ethanol, 2-methyl-1-propanol, 3-methyl-1-butanol, acetone and 2-butanone were released during the synthesis of certain mycotoxins, and that fungal contamination can be predicted by E-nose monitoring. However, the sensors used are costly and short-lived. GC-IMS, as a new technique, has the advantages of simple sample preparation, easy operation, high sensitivity, fast analytical speed, and the ability to even detect trace VOCs in a short period of time (Li M. et al., 2019).
Using GC-IMS technique in this study, 31 and 32 VOCs were identified from A. flavus and A. niger-contaminated maize, respectively. Furthermore, the results of PCA analysis and cluster analysis clearly demonstrated that different samples occupied distinct and discriminative spaces, indicated good representativeness in the preparation of moldy samples, which offered a viable approach for leveraging differences in flavor substance abundance and composition at various infection stages to assess and differentiate safety issues related to maize. Combined with GC-IMS fingerprinting, cluster analysis and PCA analysis, it was found that the maize contaminated by A. flavus and A. niger all began to mold at 18 h and entered the early stage of mold. In addition, the results of the determination of the total colony counts of moldy maize can be seen in Figure 3, which showed that the total colony counts of A. flavus and A. niger-infected maize were 3.20 lg CFU/g and 3.26 lg CFU/g, respectively, when stored for 18 h. Omobowale et al. (2016) suggested that when the total colony counts exceeded 1,000 CFU/g (i.e., 3 lg CFU/g), maize would become mildewed and be at an unsafe level for human consumption. As depicted in Figure 4, the maize contaminated by A. flavus and A. niger was healthy at 0 h of storage, while the fungal spore counts were between 1.0 × 10⁵ and 9.9 × 10⁵ at 18 h of storage, at which time the maize kernels underwent mild mold and were in the early stages of mold. Therefore, the determination of GC-IMS, total fungal colony counts and the number of fungal spores in maize can be concluded that the Aspergillus-infected maize kernels entered the early stages of mold at 18 h of storage.
This study focused on the analysis of potential biomarkers for the early stages of A. flavus and A. niger contamination of maize, the abundances of Butan-2-one, ethyl acetate-D, benzaldehyde and pentan-2-one were strongest in the pre-mold stage (18 h), while the concentration signal diminished in the middle and late stages of molding (36–72 h). Li et al. (2021) investigated the VOCs changes in maize mold using GC-IMS technique and found that ethyl acetate-D and 3-hydroxybutan-2-one-D could be used as early warning molecules for maize infection by A. flavus. This is in general consistent with our findings. Wang et al. (2021) analyzed potential biomarkers at different stages of A. flavus-contaminated walnuts and found that ethyl acetate-D and cyclohexanone had the strongest signals at the pre-mold stage, and the result suggested that the establishment of a suitable gas sensor to monitor the VOCs content at different stages of A. flavus infection in walnuts was feasible. This study provides effective monitoring target molecules for the development of gas monitoring sensors for early mold contamination of maize under storage conditions, and a real-time online monitoring and early warning system for maize mold under storage conditions can be designed based on these labeled molecules (Li et al., 2021).
In this study, a simple, efficient and specific method for evaluating the VOCs of maize samples infected by Aspergillus was established. Using GC-IMS for detection, no additional processing process is required during sample sampling, which shortens the analysis time. Collecting VOCs in a storage environment can efficiently and quickly monitor agricultural products, which provides a new idea for early warning and monitoring of maize mildew, and has great application prospects.
In this study, we screened maize mold dominant strains from moldy maize and identified A. flavus and A. niger by morphological and 18S rRNA gene sequence analysis. These two kinds of fungi were used to infect fresh maize and make it moldy, respectively. Then, using the GC-IMS technique, 31 and 32 VOCs were identified from A. flavus and A. niger-contaminated maize without sample pretreatment. The results showed that the abundance and composition of flavor substances in maize samples varied greatly at different growth stages of mold. Differences in the composition, abundance and composition of VOCs in stored maize contaminated with Aspergillus were evaluated by fingerprints, cluster analysis and PCA analysis. Combining the total fungal colony counts and fungal spores of A. flavus and A. niger-infected maize as well as the results of GC-IMS revealed that the maize entered the early stage of mold at 18 h. In conclusion, it can be seen that butan-2-one, ethyl acetate-D, benzaldehyde and pentan-2-one were strongest when stored for 18 h in the pre-mold stage of fungal infection, and the concentration signals decreased with the increasing growth time. Therefore, it was feasible that GC-IMS could be used for early warning of mold in maize.
The datasets presented in this study can be found in online repositories. The names of the repository/repositories and accession number(s) can be found in the article/supplementary material.
YQ: Data curation, Investigation, Methodology, Resources, Validation, Writing – original draft. HL: Formal analysis, Funding acquisition, Supervision, Writing – review & editing. YaX: Formal analysis, Writing – review & editing. LQ: Data curation, Writing – review & editing. YL: Methodology, Writing – review & editing. YiX: Formal analysis, Writing – review & editing. YZ: Funding acquisition, Supervision, Writing – review & editing.
The author(s) declare that financial support was received for the research, authorship, and/or publication of this article. The financial support of this study was supplied by the National Key Research and Development Program of China (2021YFD2100604-02), the Joint Funds of Science & Technology Research and Development Program of Henan (232103810075), the Higher Education Institution Key Research Project Plan of Henan Province (23A550004), and the Natural Science Foundation of Henan Province (242300421200).
The authors declare that the research was conducted in the absence of any commercial or financial relationships that could be construed as a potential conflict of interest.
All claims expressed in this article are solely those of the authors and do not necessarily represent those of their affiliated organizations, or those of the publisher, the editors and the reviewers. Any product that may be evaluated in this article, or claim that may be made by its manufacturer, is not guaranteed or endorsed by the publisher.
Arroyo-Manzanares, N., Martín-Gómez, A., Jurado-Campos, N., Garrido-Delgado, R., Arce, C., and Arce, L. (2018). Target vs spectral fingerprint data analysis of Iberian ham samples for avoiding labelling fraud using headspace—gas chromatography-ion mobility spectrometry. Food Chem. 246, 65–73. doi: 10.1016/j.foodchem.2017.11.008
Bocate, K. P., Evangelista, A. G., and Luciano, F. B. (2021). Garlic essential oil as an antifungal and anti-mycotoxin agent in stored corn. LWT 147:111600. doi: 10.1016/j.lwt.2021.111600
Brito, V. D., Achimón, F., Zunino, M. P., Zygadlo, J. A., and Pizzolitto, R. P. (2022). Fungal diversity and mycotoxins detected in maize stored in silo-bags: a review. J. Sci. Food Agric. 102, 2640–2650. doi: 10.1002/jsfa.11756
Caligiore-Gei, P. F., Moratalla-López, N., Poggi, L. M., and Alonso, G. L. (2023). Isolation, identification, and determination of the virulence of the causal agents of corm rot of saffron (Crocus sativus L.) in Valle de Uco, Argentina. Plants 12:2717. doi: 10.3390/plants12142717
Cavanna, D., Zanardi, S., Dall’Asta, C., and Suman, M. (2019). Ion mobility spectrometry coupled to gas chromatography: a rapid tool to assess eggs freshness. Food Chem. 271, 691–696. doi: 10.1016/j.foodchem.2018.07.204
Chandravarnan, P., Agyei, D., and Ali, A. (2022). Green and sustainable technologies for the decontamination of fungi and mycotoxins in rice: a review. Trends Food Sci. Technol. 124, 278–295. doi: 10.1016/j.tifs.2022.04.020
Chen, T., Chen, X., Meng, L., Wei, Z., Chen, B., Wang, Y., et al. (2022). Characteristic fingerprint analysis of the moldy odor in Guangxi fragrant rice by gas chromatography-ion mobility spectrometry (GC-IMS). Anal. Lett. 55, 2033–2045. doi: 10.1080/00032719.2022.2043337
Chen, T., Liu, C., Meng, L., Lu, D., Chen, B., and Cheng, Q. (2021). Early warning of rice mildew based on gas chromatography-ion mobility spectrometry technology and chemometrics. J. Food Meas. Charact. 15, 1939–1948. doi: 10.1007/s11694-020-00775-9
Coradi, P. C., Nunes, M. T., Bellochio, S. D. C., Camilo, L. J., and Teodoro, P. E. (2021). Effects of drying temperatures and storage conditions on the levels of lipids and starches in corn grains for yield ethanol industry. Biofuels 13, 745–754. doi: 10.1080/17597269.2021.1904674
Gu, S., Chen, W., Wang, Z., Wang, J., and Huo, Y. (2020). Rapid detection of Aspergillus spp. infection levels on milled rice by headspace-gas chromatography ion-mobility spectrometry (HS-GC-IMS) and E-nose. LWT 132:109758. doi: 10.1016/j.lwt.2020.109758
Gu, S., Zhang, J., Wang, J., Wang, X., and Du, D. (2021). Recent development of HS-GC-IMS technology in rapid and non-destructive detection of quality and contamination in agri-food products. TrAC Trends Anal. Chem. 144:116435. doi: 10.1016/j.trac.2021.116435
Guo, Z., Wang, M., Wu, J., Tao, F., Chen, Q., Wang, Q., et al. (2019). Quantitative assessment of zearalenone in maize using multivariate algorithms coupled to Raman spectroscopy. Food Chem. 286, 282–288. doi: 10.1016/j.foodchem.2019.02.020
Han, G. M., Li, C. P., Xiang, F. Z., Zhao, Q. Q., Zhao, Y., Cai, R. H., et al. (2020). Genome-wide association study leads to novel genetic insights into resistance to Aspergillus flavus in maize kernels. BMC Plant Biol. 20, 206–211. doi: 10.1186/s12870-020-02404-5
Huang, G. L., Liu, T. T., Mao, X. M., Quan, X. Y., Sui, S. Y., Ma, J. J., et al. (2023). Insights into the volatile flavor and quality profiles of loquat (Eriobotrya japonica Lindl.) during shelf-life via HS-GC-IMS, E-nose, and E-tongue. Food Chem. 20:100886. doi: 10.1016/j.fochx.2023.100886
Jiang, L., Qiu, Y., Dumlao, M. C., Donald, W. A., Steel, C. C., and Schmidtke, L. M. (2023). Detection and prediction of Botrytis cinerea infection levels in wine grapes using volatile analysis. Food Chem. 421:136120. doi: 10.1016/j.foodchem.2023.136120
Kang, Y., Wang, X., Xiong, L., Pei, J., Ding, Z., Guo, S., et al. (2024). Application of GC-IMS, GC-MS, and LC-MS/MS techniques to a comprehensive systematic study on the flavor characteristics of different muscles in the yak. Food Biosci. 59:104173. doi: 10.1016/j.fbio.2024.104173
Karlshøj, K., Nielsen, P. V., and Larsen, T. O. (2007). Differentiation of closely related fungi by electronic nose analysis. J. Food Sci. 72, M187–M192. doi: 10.1111/j.1750-3841.2007.00399.x
Kinyungu, S., Isakeit, T., Ojiambo, P. S., and Woloshuk, C. P. (2019). Spread of Aspergillus flavus and aflatoxin accumulation in postharvested maize treated with biocontrol products. J. Stored Prod. Res. 84:101519. doi: 10.1016/j.jspr.2019.101519
Kumar, S., Stecher, G., Li, M., Knyaz, C., and Tamura, K. (2018). MEGA X: molecular evolutionary genetics analysis across computing platforms. Mol. Biol. Evol. 35, 1547–1549. doi: 10.1093/molbev/msy096
Li, X., Cui, W., Wang, W., Wang, Y., Gong, Z., and Xu, Z. (2019). Analysis of the volatile compounds associated with pickling of ginger using headspace gas chromatography-ion mobility spectrometry. Flavour Fragr. J. 34, 485–492. doi: 10.1002/ffj.3530
Li, H., Kang, X., Wang, S., Mo, H., Xu, D., Zhou, W., et al. (2021). Early detection and monitoring for Aspergillus flavus contamination in maize kernels. Food Control 121:107636. doi: 10.1016/j.foodcont.2020.107636
Li, M., Yang, R., Zhang, H., Wang, S., Chen, D., and Lin, S. (2019). Development of a flavor fingerprint by HS-GC-IMS with PCA for volatile compounds of Tricholoma matsutake singer. Food Chem. 290, 32–39. doi: 10.1016/j.foodchem.2019.03.124
Liu, Y., Wang, R., Zhao, L., Huo, S., Liu, S., Zhang, H., et al. (2022). The antifungal activity of cinnamon-litsea combined essential oil against dominant fungal strains of moldy peanut kernels. Foods 11:1586. doi: 10.3390/foods11111586
Lu, D., Tian, X., Yang, Y., Fu, Z., Zhao, Q., Li, B., et al. (2024). Rapid and sensitive aptamer-linked immunosorbent assay with aptamer-templated silver nanoparticles for detection of aflatoxin B1 in medicinal and edible food. Food Biosci. 60:104387. doi: 10.1016/j.fbio.2024.104387
Majumdar, R., Kandel, S. L., Cary, J. W., and Rajasekaran, K. (2021). Changes in bacterial endophyte community following Aspergillus flavus infection in resistant and susceptible maize kernels. Int. J. Mol. Sci. 22:3747. doi: 10.3390/ijms22073747
Marshall, H., Meneely, J. P., Quinn, B., Zhao, Y. J., Bourke, P., Gilmore, B. F., et al. (2020). Novel decontamination approaches and their potential application for post-harvest aflatoxin control. Trends Food Sci. Technol. 106, 489–496. doi: 10.1016/j.tifs.2020.11.001
Monedeiro, F., Milanowski, M., Ratiu, I.-A., Zmysłowski, H., Ligor, T., and Buszewski, B. (2019). VOC profiles of saliva in assessment of halitosis and submandibular abscesses using HS-SPME-GC/MS technique. Molecules 24:2977. doi: 10.3390/molecules24162977
Niu, Y., and Xiang, Y. (2018). An overview of biomembrane functions in plant responses to high-temperature stress. Front. Plant Sci. 9, 23–41. doi: 10.3389/fpls.2018.00915
Norlia, M., Jinap, S., Nor-Khaizura, M. A. R., Radu, S., Samsudin, N. I. P., and Azri, F. A. (2019). Aspergillus section flavi and aflatoxins: occurrence, detection, and identification in raw peanuts and peanut-based products along the supply chain. Front. Microbiol. 10:2602. doi: 10.3389/fmicb.2019.02602
Omobowale, M. O., Armstrong, P. R., Mijinyawa, Y., Igbeka, J. C., and Maghirang, E. B. (2016). Maize storage in termite mound clay, concrete, and steel silos in the humid tropics: comparison and effect on bacterial and fungal counts. Trans. ASABE 59, 1039–1048. doi: 10.13031/trans.59.11437
Pan, Y., Qiao, L., Liu, S., He, Y., Huang, D., Wu, W., et al. (2024). Explorative study on volatile organic compounds of cinnamon based on GC-IMS. Metabolites 14:274. doi: 10.3390/metabo14050274
Paolesse, R., Alimelli, A., Martinelli, E., Di Natale, C., D’Amico, A., D’Egidio, M., et al. (2006). Detection of fungal contamination of cereal grain samples by an electronic nose. Sensors and Actuators B: Chemical. 119, 425–430. doi: 10.1016/j.snb.2005.12.047
Parastar, H., and Weller, P. (2024). Towards greener volatilomics: is GC-IMS the new Swiss army knife of gas phase analysis? TrAC Trends Anal. Chem. 170:117438. doi: 10.1016/j.trac.2023.117438
Rahnavard, M. A., Zare, D., Nassiri, S. M., Taghvaei, H., and Fazaeli, M. (2024). Impact of gliding arc cold plasma on deactivating of aflatoxin and post-treatment fungal growth on wheat grains. Food Control 164:110597. doi: 10.1016/j.foodcont.2024.110597
Tang, A., and Peng, B. (2024). Uncovering the flavor differences between black rice wine and glutinous rice wine by GC-MS, GC-IMS, HPLC, and electronic sensory analysis. Food Biosci. 60:104235. doi: 10.1016/j.fbio.2024.104235
Timm, N., Coradi, P. C., Bilhalva, N., Nunes, C. F., and Cañizares, L. (2022). Effects of corn drying and storage conditions on flour, starch, feed, and ethanol production: a review. J. Food Sci. Technol. 60, 2337–2349. doi: 10.1007/s13197-022-05549-3
Wang, S., Chen, H., and Sun, B. (2020). Recent progress in food flavor analysis using gas chromatography-ion mobility spectrometry (GC-IMS). Food Chem. 315:126158. doi: 10.1016/j.foodchem.2019.126158
Wang, S., Mo, H., Xu, D., Hu, H., Hu, L., Shuai, L., et al. (2021). Determination of volatile organic compounds by HS-GC-IMS to detect different stages of Aspergillus flavus infection in Xiang Ling walnut. Food Sci. Nutr. 9, 2703–2712. doi: 10.1002/fsn3.2229
Yang, L., Liu, J., Wang, X., Wang, R., Ren, F., Zhang, Q., et al. (2019). Characterization of volatile component changes in jujube fruits during cold storage by using headspace-gas chromatography-ion mobility spectrometry. Molecules 24:3904. doi: 10.3390/molecules24213904
Yang, Y., Xie, J., Wang, Q., Wang, L., Shang, Y., Jiang, Y., et al. (2024). Volatolomics-assisted characterization of the key odorants in green off-flavor black tea and their dynamic changes during processing. Food Chem.: X 22:101432. doi: 10.1016/j.fochx.2024.101432
Zhang, D., Huang, Y., Fan, X., and Zeng, X. (2024). Effects of solid-state fermentation with Aspergillus cristatus (MK346334) on the dynamics changes in the chemical and flavor profile of dark tea by HS-SPME-GC-MS, HS-GC-IMS and electronic nose. Food Chem. 455:139864. doi: 10.1016/j.foodchem.2024.139864
Zhang, Y., Li, J., Tang, F., Zhang, H., Cui, Z., and Zhou, H. (2021). An automatic detector for fungal spores in microscopic images based on deep learning. Appl. Eng. Agric. 37, 85–94. doi: 10.13031/aea.13818
Zhang, J., Qian, J., Pirttikangas, S., Zhang, S., Wang, J., and Wei, Z. (2023). Multi-frequency microwave dielectric properties-based method coupled with SPA-PLSDA algorithm for rapid discrimination of grain mildew. Food Control 152:109785. doi: 10.1016/j.foodcont.2023.109785
Zhang, Y., Tong, X., Chen, B., Wu, S., Wang, X., Zheng, Q., et al. (2023). Novel application of HS-GC-IMS for characteristic fingerprints and flavor compound variations in citrus reticulatae pericarpium during storage with different Aspergillus niger fermentation. Food Chem.: X 18:100653. doi: 10.1016/j.fochx.2023.100653
Zhang, D. D., Zhao, J. F., Tan, L. Q., Wu, Q., Lv, H. X., Zhang, Y. R., et al. (2024). Effects of zinc oxide nanocomposites on microorganism growth and protection of physicochemical quality during maize storage. Int. J. Food Microbiol. 411:110552. doi: 10.1016/j.ijfoodmicro.2023.110552
Zou, Y., Li, L., Wang, Y., Duan, R., Dong, H., Zhang, Y., et al. (2024). Growth and yield of maize in response to reduced fertilizer application and its impacts on population dynamics and community biodiversity of insects and soil microbes. Front. Plant Sci. 15:1362905. doi: 10.3389/fpls.2024.1362905
Keywords: maize, gas chromatography-ion mobility spectrometry (GC-IMS), Aspergillus flavus, Aspergillus niger, volatile organic compounds (VOCs), principal component analysis (PCA)
Citation: Qin Y, Lv H, Xiong Y, Qi L, Li Y, Xin Y and Zhao Y (2024) Early warning of Aspergillus contamination in maize by gas chromatography-ion mobility spectrometry. Front. Microbiol. 15:1470115. doi: 10.3389/fmicb.2024.1470115
Received: 25 July 2024; Accepted: 18 September 2024;
Published: 26 September 2024.
Edited by:
Lorena Martinez-Zamora, University of Murcia, SpainReviewed by:
Dandan Zhou, Nanjing Forestry University, ChinaCopyright © 2024 Qin, Lv, Xiong, Qi, Li, Xin and Zhao. This is an open-access article distributed under the terms of the Creative Commons Attribution License (CC BY). The use, distribution or reproduction in other forums is permitted, provided the original author(s) and the copyright owner(s) are credited and that the original publication in this journal is cited, in accordance with accepted academic practice. No use, distribution or reproduction is permitted which does not comply with these terms.
*Correspondence: Yan Zhao, emhhb3lhbkBoYXV0LmVkdS5jbg==
Disclaimer: All claims expressed in this article are solely those of the authors and do not necessarily represent those of their affiliated organizations, or those of the publisher, the editors and the reviewers. Any product that may be evaluated in this article or claim that may be made by its manufacturer is not guaranteed or endorsed by the publisher.
Research integrity at Frontiers

Learn more about the work of our research integrity team to safeguard the quality of each article we publish.