- Produce Safety and Microbiology Research Unit, Western Regional Research Center, Agricultural Research Service, United States Department of Agriculture, Albany, CA, United States
Agricultural water is commonly treated with chlorine-based disinfectants, which are impacted by water quality. Understanding how water quality influences disinfectants such as chlorine dioxide (ClO2) against pathogenic bacteria is important for creating efficacious sanitation regimens. In this study, the minimum inhibitory concentration (MIC) of ClO2 needed to achieve a 3-Log reduction against Shiga toxin-producing Escherichia coli (STEC) and Listeria monocytogenes was compared across agricultural water samples. Sterile ddH2O served as a control to compare with environmental samples from Salinas Valley, CA, and laboratory standards. To test different dosages and water qualities, stock ClO2 was diluted in 24-well plates with target concentrations of 10, 5, 2.5, and 1.25 mg/L. Well plates were inoculated with pathogens and treated with sanitizer for 5 min. Following treatment, surviving pathogens were enumerated using viable cell counts. The results demonstrate that groundwater samples had the highest water quality of the environmental samples and required the lowest concentration of disinfectant to achieve 3-Log reduction against both bacteria, with MIC between 1.4 and 2.0 mg/L. Open-source samples had lower water quality and required a higher concentration of ClO2 for 3-Log reduction, with MIC between 2.8 and 5.8 mg/L for both pathogens. There was no correlation between pH, turbidity, or conductivity/TDS and reduction for either STEC or L. monocytogenes, suggesting no individual water metric was driving reduction. A lower dosage was required to achieve 3-Log reduction against STEC, while L. monocytogenes required greater concentrations to achieve the same level of reduction. Overall, these results help guide growers in using ClO2 as a broad-spectrum disinfectant and demonstrate its efficacy in reaching 3-Log reduction across agricultural water samples.
1 Introduction
California’s Salinas Valley is a high-production region for leafy greens (Gorski et al., 2022; Lacombe et al., 2022). Unfortunately, Salinas Valley has been associated with multiple foodborne outbreaks, making it a focal point for investigating produce-related pathogen systems. The Food and Drug Administration (FDA) and the Center for Disease Control (CDC) have stated that agricultural water is a key factor in pathogen conveyance (Gelting et al., 2011; Lacombe et al., 2022). Pathogenic bacteria held commonly in cattle feces are carried by runoff, flooding, and wildlife directly into produce fields or into open-source water, which may be further used in growing operations (FDA, 2021; Gorski et al., 2022; Lacombe et al., 2022). Water treatment is then a critical point to intervene in leafy green production to prevent contamination of food products. Currently, most agricultural water in the United States is treated with chlorine-based sanitizers; however, these sanitizers are labeled to treat fungal pathogens, and no label yet exists for standardizing the treatment of pathogenic bacteria such as Shiga toxin-producing Escherichia coli. Federal government agencies, including the FDA and the Environmental Protection Agency (EPA), have more recently developed testing protocols to define standard effective procedures for treating low-quality water (EPA, 2024). This is important because the efficacy of some chemical sanitizers can be heavily impacted by pH and turbidity, while other methods may be more flexible.
Chlorine dioxide (ClO2) is an alternative chlorine-based sanitizer used in agriculture water treatment. Aqueous ClO2 is a strong oxidizing agent that disrupts bacterial membrane permeability, metabolism, and structural proteins via electrophilic abstraction (Bridges et al., 2020; Jefri et al., 2022; Nadupalli et al., 2011; Ofori et al., 2018, 2017; Zhang et al., 2023). Irrigation infrastructure is vulnerable to the build-up of algal and bacterial growth, and ClO2 is useful in biofilm inactivation, making it a diverse tool for growers to sanitize and unclog irrigation lines and other water transport systems (Krüger et al., 2023). Generator-based ClO2 requires large infrastructure investment and trained personnel to handle equipment; however, the development of manufacturer kits has made ClO2 a simpler and viable alternative for water treatment. This method allows for concentrated batches (200–500 ppm) of aqueous ClO2 to be produced with dry precursors. This gives the operator the flexibility to choose the appropriate dose for application based on the manufacturer’s instructions. However, there is a knowledge gap as to the appropriate dose for human pathogen disinfection based on water quality.
Recent Shiga toxin-producing Escherichia coli (STEC) outbreaks are a reminder of the importance of reducing contamination in food production operations. The Leafy Greens STEC Action Plan (LGAP) is a document created by the FDA to address repeated leafy-green-related foodborne outbreaks (FDA, 2023). LGAP addresses recurring STEC outbreaks by facilitating collaboration between public and private agency efforts to answer questions regarding produce safety. These efforts serve to reduce the frequency and seriousness of outbreaks (EPA, 2024; FDA, 2021). LGAP included methodology to determine the concentration of chemical sanitizer required to achieve a target of 3-Log (99.9%) pathogen reduction (FDA, 2021). FDA and EPA designed a protocol for testing “worst case scenario” water to test sanitizers’ disinfection efficacy in water with high turbidity, conductivity, total dissolved solids, and varied pH. Due to location and water rights, these water parameters are designed to reflect poor conditions faced by farmers pulling from open-source water systems, including canals and rivers. It is important to define disinfection parameters for these sources so that growers can efficiently inactivate human pathogens before water use.
Another human pathogen, Listeria monocytogenes, has been reported across the Salinas Valley in surface waters (Gorski et al., 2022). Long-term sampling and genotyping indicated that the majority of L. monocytogenes strains that were isolated contained virulence genes and pathogenicity islands, making them a potential threat to public health and produce safety (FDA, 2023; Gorski et al., 2022). Although L. monocytogenes outbreaks are most frequently associated with post-harvest production environments and gaps in good manufacturing practice, the prevalence and pathogenicity of L. monocytogenes in Salinas Valley makes it a key organism to monitor in pre-harvest water alongside STEC (Gorski et al., 2022). Therefore, STEC and Listeria monocytogenes were chosen for the present study as useful pathogens for testing sanitizing treatments in water samples from California’s central coast growing region.
Following FDA and EPA guidelines, this study aims to define the disinfection efficacy of chlorine dioxide against bacterial pathogens across a wide range of water samples associated with the Salinas Valley, a key production region for leafy greens. Initially, we identified variations in agricultural water samples’ pH, turbidity, conductivity, and total dissolved solids (TDS). Pathogenic bacteria were exposed to a gradient of ClO2 dosages to estimate the required concentration of disinfectant to achieve a 3-Log (99.9%) reduction in each water sample. Further, we monitored water metrics at three sites in the Salinas Valley to observe changes in chemistry and microbial content and understand if seasonal changes in water quality exist.
2 Materials and methods
2.1 Preparation of STEC and Listeria monocytogenes inoculum cultures
Following EPA protocol, cocktails of Shiga-toxin Escherichia coli (STEC) and Listeria monocytogenes were made to represent pathogens of both gram-positive and gram-negative bacteria. The STEC cocktail included serotypes O157:H7 (ATCC 43888), O121:H19 (BAA-2219), O103:H11 (BAA-2215), O26:H11 (BAA-2196), O111 (BAA-2440), O45:H2 (BAA-2193) and O145:NM (BAA-2192). The L. monocytogenes cocktail contained CFSAN 006121, CFSAN002285, CFSAN034257, and CFSAN00078. Prior to the experiment, archived strains of bacteria were pulled from −80°C storage and inoculated into brain heart infusion (BHI) broth. Individual STEC and L. monocytogenes serotypes were incubated at 37°C for 24 and 48 h, respectively. Following incubation in BHI, STEC and L. monocytogenes were streaked for isolation on Sorbitol MacConkey agar (SMAC) (Neogen, Lansing, MI) and PALCAM agar (Neogen, Lansing, MI), respectively. Colonies were transferred using a 10 μL loop onto Tryptic Soy Agar slants (STEC) and fresh PALCAM plates (L. monocytogenes) to be stored at 4°C throughout the experiment. Prior to each experiment, individual serotypes were incubated at 37°C in 7 mL of BHI broth for 24 h (STEC) and 48 h (L. monocytogenes). Serotypes of each bacterium were combined into 50 mL conical tubes and centrifuged at room temperature for 5 min at 10,000 × g. Pellets were washed twice using ddH2O prior to the exposure assay.
2.2 Preparation of test agricultural water
To represent variable water quality, pH-adjusted double-deionized water (ddH2O) (Millipore Sigma, Sigma-Aldrich) was used as a negative control, and samples were taken from a small organic farm (ALBA farms, Salinas Valley, CA), and environmental samples taken from open-source water systems in the Salinas Valley. In addition, two synthetic laboratory standards were made using EPA guidelines at pH levels of 6.5 and 8.4 (EPA6.5, and EPA8.4, respectively) (Table 1). The standards were made following the protocol described in the EPA’s agricultural water testing procedure at least 24 h prior to experimentation. Adjustments to pH were made using NaOH and HCl while homogenized with a stir bar. PTI Arizona dust, humic acid, and sodium chloride were used to meet water metric standards, as presented in Table 1.
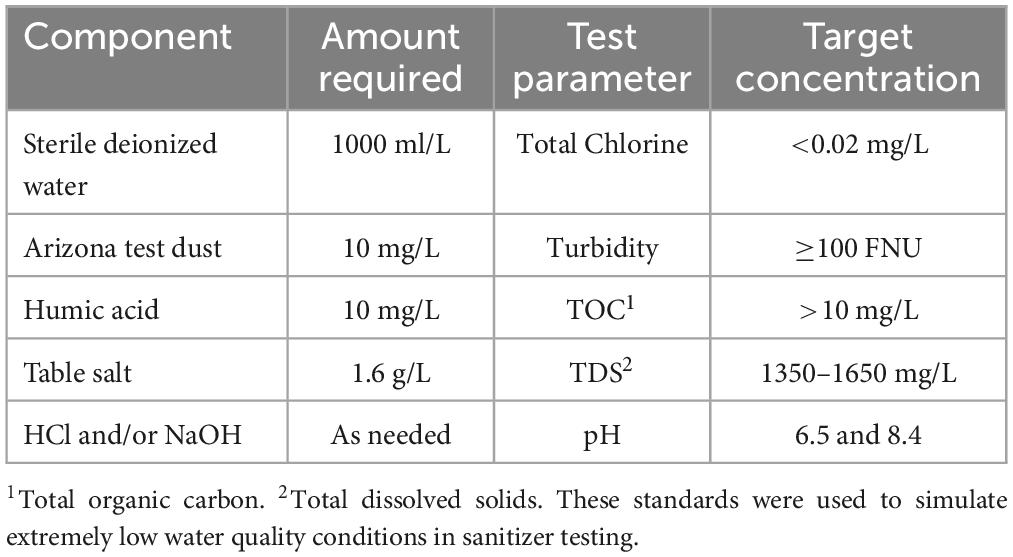
Table 1. Guidelines used for the synthesis of the EPA water standards based on the protocol from EPA (2024).
2.3 Water sample collection
Water samples were collected in the Salinas Valley, CA, during 2023 and 2024. Monthly sampling trips were conducted during June-August and December of 2023 and January and February 2024 to capture seasonal differences. Groundwater from a small organic farm in the Salinas Valley was sampled at two wells that access separate aquifers. The Agricultural Well (AW) assigned for leafy green production was drawn from a well approximately 800 feet deep and was not treated with chlorine. The Domestic Well (DW) samples represented the potable water source and were approximately 500 feet deep. Open-source water sampling sites were identified based on previous research in the area (Gorski et al., 2022) and were located along San Jon Road, Salinas, CA (ENV1) and the Salinas River near Gonzales River Road, Gonzales, CA (ENV2). These environmental samples represent water systems adjacent to commercial leafy green operations in this region.
2.4 Analysis of test water
Each sample was measured for pH, temperature, total dissolved solids, conductivity, free chlorine, and coliforms. The HACH Pocket Pro 2 (Hach Company, Loveland, CO) was used for measuring temperature (°C), pH, conductivity (uS/cm), and total dissolved solids (TDS) (ppm). Turbidity was measured using a HACH 2100Qis Portable Turbidimeter set to measure Formazin Nephelometric Units (FNU) (Hach Company, Loveland, CO). Free and Total Chlorine (F&T) was measured on the HACH Colorimeter DR900 (Hach Company, Loveland, CO) using 10 mL samples supplemented with HACH DPD Free Chlorine PermaChem Reagents (Hach Company, Loveland CO). The presence of coliforms was assessed with 100 mL samples processed through an IDEXX Quanti-tray Sealer Plus (IDEXX, Westbrook, ME) supplemented with Colilert (IDEXX, Westbrook, ME) and reported using the manufacturers Most Probable Number (MPN) table.
2.5 Preparation of chlorine dioxide
Stock solution of chlorine dioxide (ICA TriNova, Newnan, GA) was made by submerging a porous sachet containing dry chlorine/salt mixed with acid precursor components in a dark bucket filled with 6 L of ddH2O. The aqueous ClO2 was allowed to be generated in a chemical hood for 48 h at room temperature until a concentration of ∼250 ppm was achieved. Stock ClO2 was then stored at 4°C for the remainder of the experiment. Concentrations were calculated using the DPD method, and color reactions were measured using the Hach DR900 colorimeter. For each reduction assay, the stock concentration was confirmed, and a 10 mg/L sub-stock solution was made using the desired test water in triple-rinsed 250 mL glass bottles and stored at 4°C wrapped in foil prior to assay.
2.6 Determination of log-reduction and minimum inhibitory concentration
To estimate the minimum inhibitory concentration (MIC) required to achieve bacterial reduction of 3 log CFU/ml for each sample, a dilution assay was performed utilizing a 24-well plate. The 10 mg/L ClO2 sub-stock solution was further diluted across the 24 well plates in test water to final targets of 10, 5, 2.5, and 1.25 mg/L ClO2. The negative control wells contained 1 mL of the desired test water with no inoculated culture. To expose the bacterial cocktail to the sanitizer, a 10 uL loop of the cocktail was inoculated into each dilution and timed for 5 min, starting with the first inoculation. To stop the ClO2 treatment, the wells were quenched with 1 mL of 1% sodium thiosulfate (Na2S2O3). To enumerate the surviving microbial population, serial dilutions in 0.1% peptone water were performed before plating onto SMAC and PALCAM plates for STEC and L. monocytogenes, respectively. Both pathogens were incubated at 37°C, STEC for 24 h, and L. monocytogenes for 48 h. All plating was performed using an Eddy Jet 2W Spiral Plater (I&L Biosystems Inc, Königswinterer, Germany). Colony counts were averaged across replicates and transformed into the Log10 scale for reporting.
2.7 Minimum inhibitory concentration to achieve 3-log reduction
The lowest concentration of antimicrobials required to achieve a target reduction is the Minimum Inhibitory Concentration (MIC). With a target of 3-Log reduction, MIC was calculated using equations from 2nd-order polynomial lines fitted to reduction data from Figures 1, 2. First and Second-order polynomial fitted lines and equations are shown in Supplementary Figures 1, 2. To estimate the concentration required for 3-Log reductions, equations from each water sample were set to LogN/N0 = −3, where the y-axis represents LogN/N0, and the x-axis represents the antimicrobial concentration gradient.
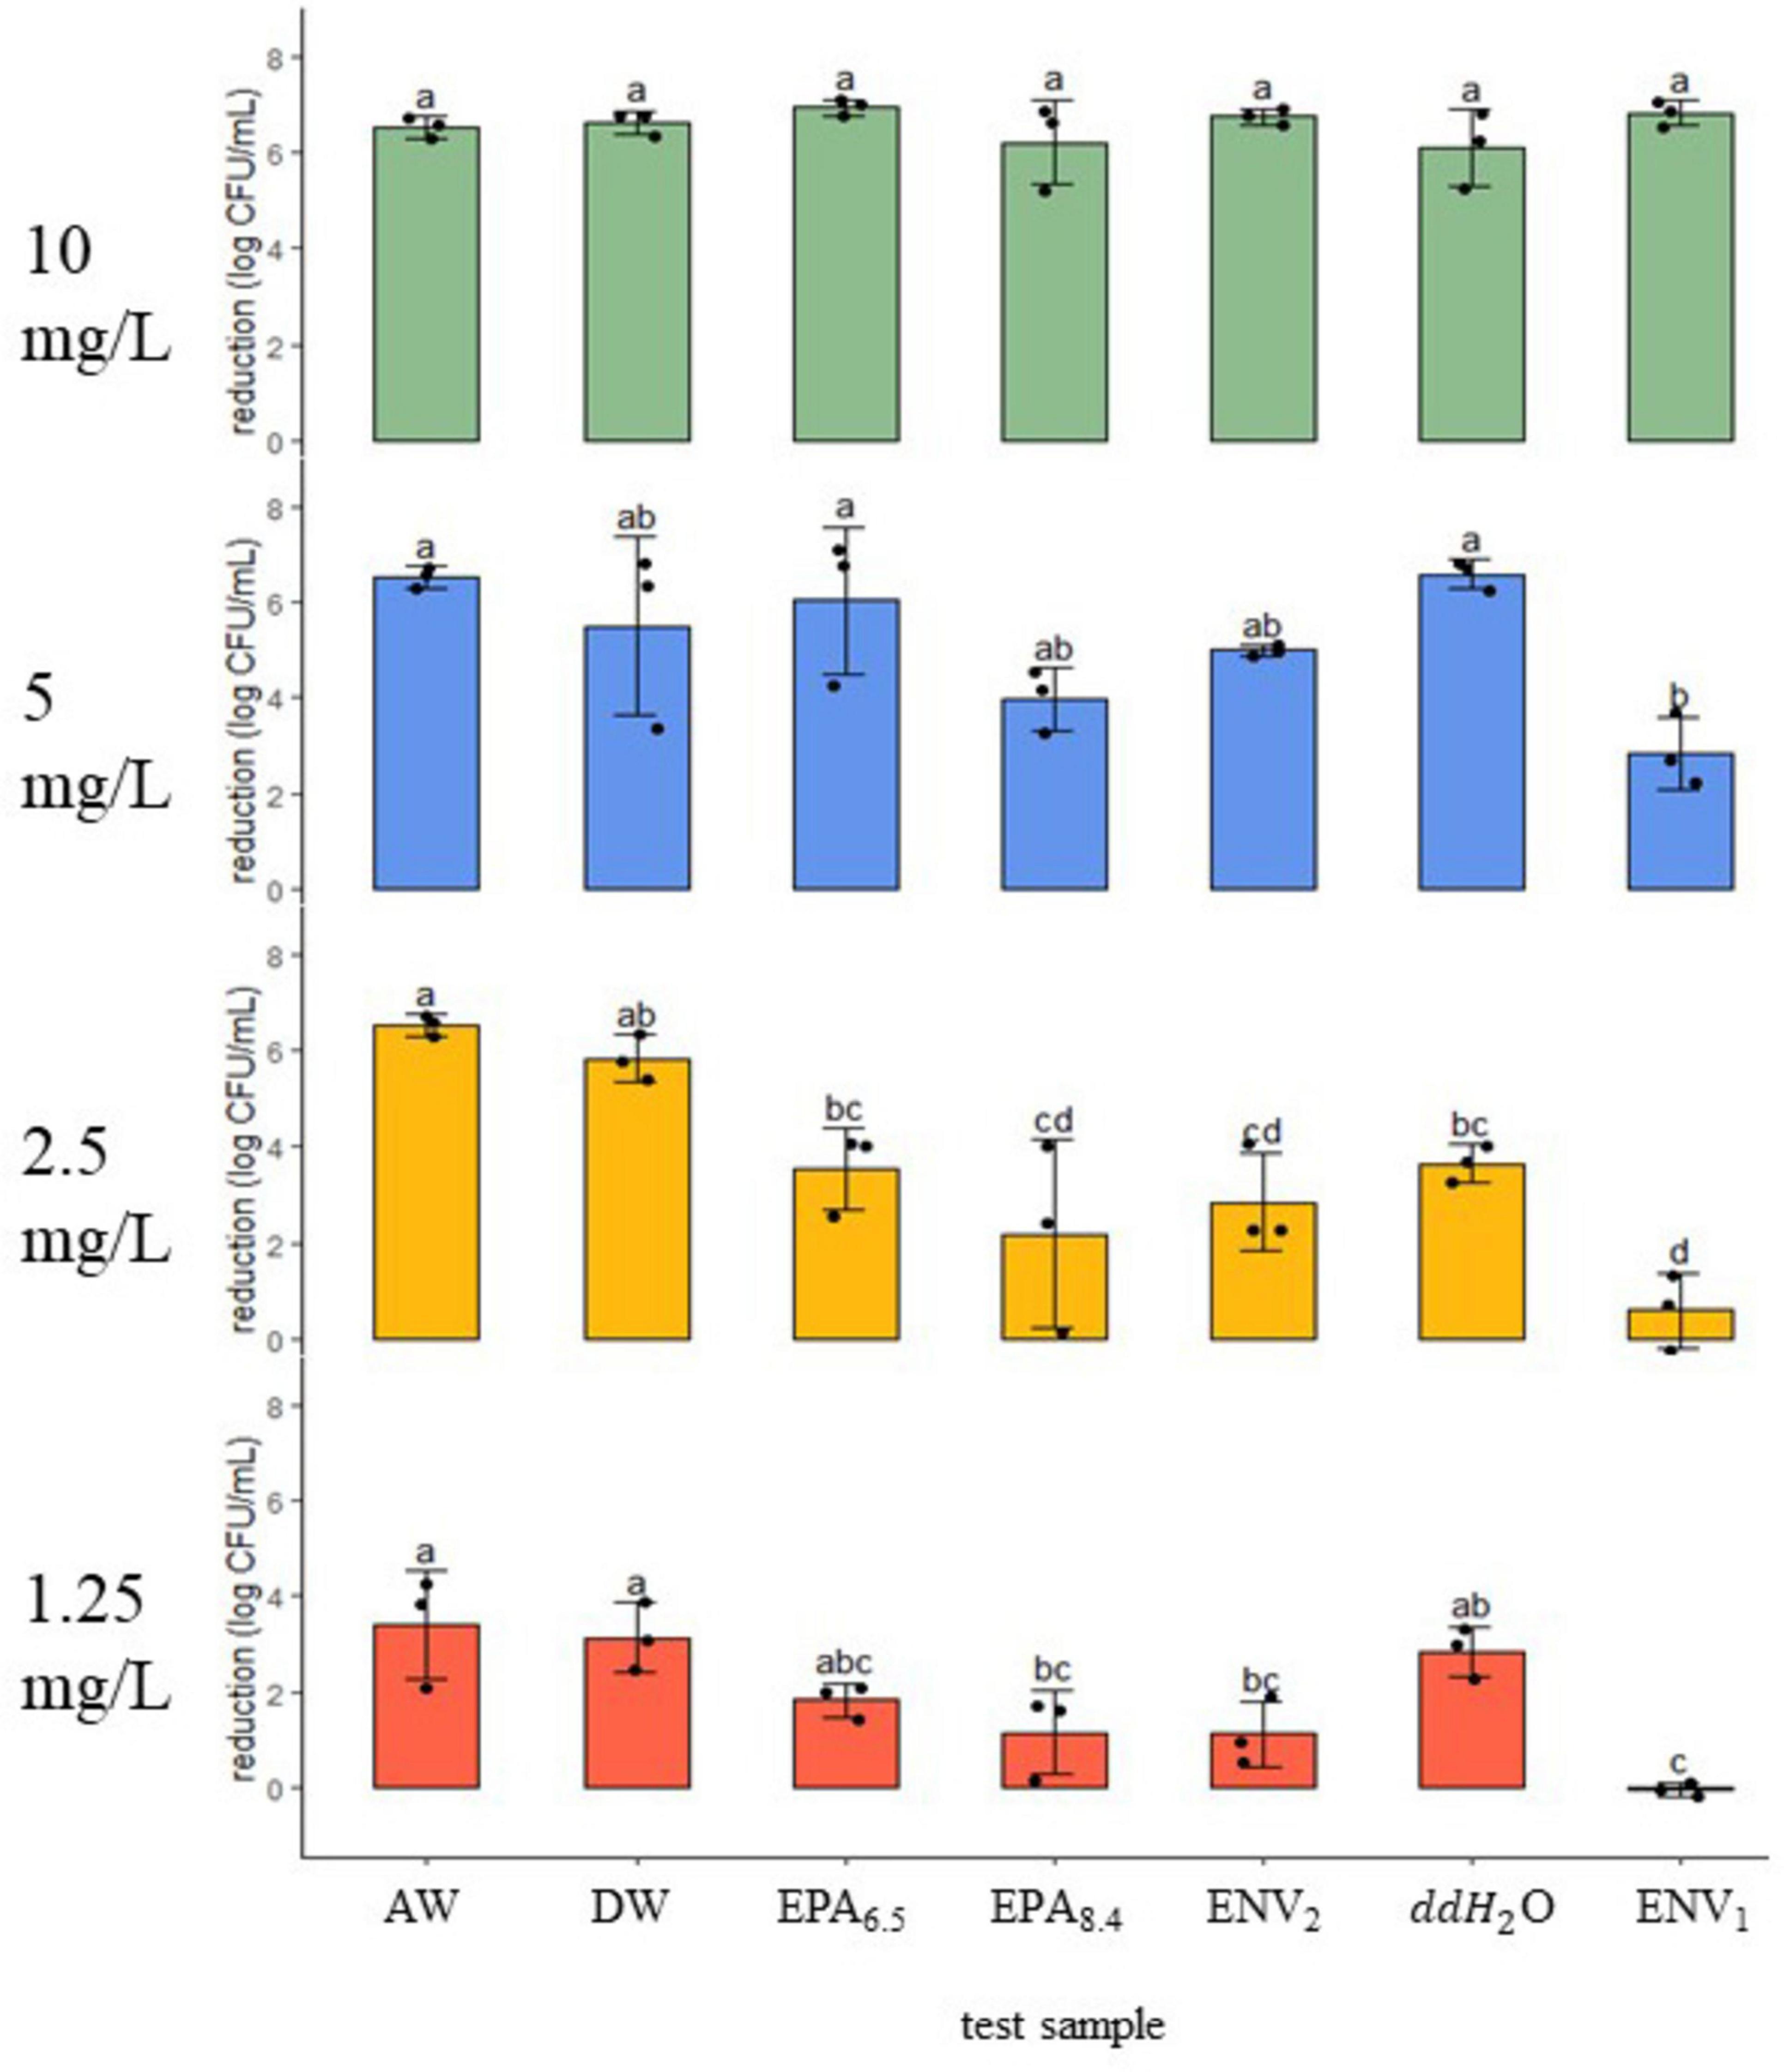
Figure 1. STEC reduction (log CFU/ml ± SD) after a 5-min exposure to a gradient of chlorine dioxide dosages in seven water samples. Dosage (mg/L) is shown on the left of each panel at 10, 5, 2.5, and 1.25. Black dots represent the individual data points. Means (N = 3) with similar letter designations represent similar reductions across water samples as determined by two-way ANOVA and Tukey post hoc tests (α = 0.05). AW, agricultural well; DW, domestic well; EPA6.5/EPA8.4, laboratory standards with adjusted pH; ENV1/ENV2, open source environmental samples; ddH20, double distilled water.
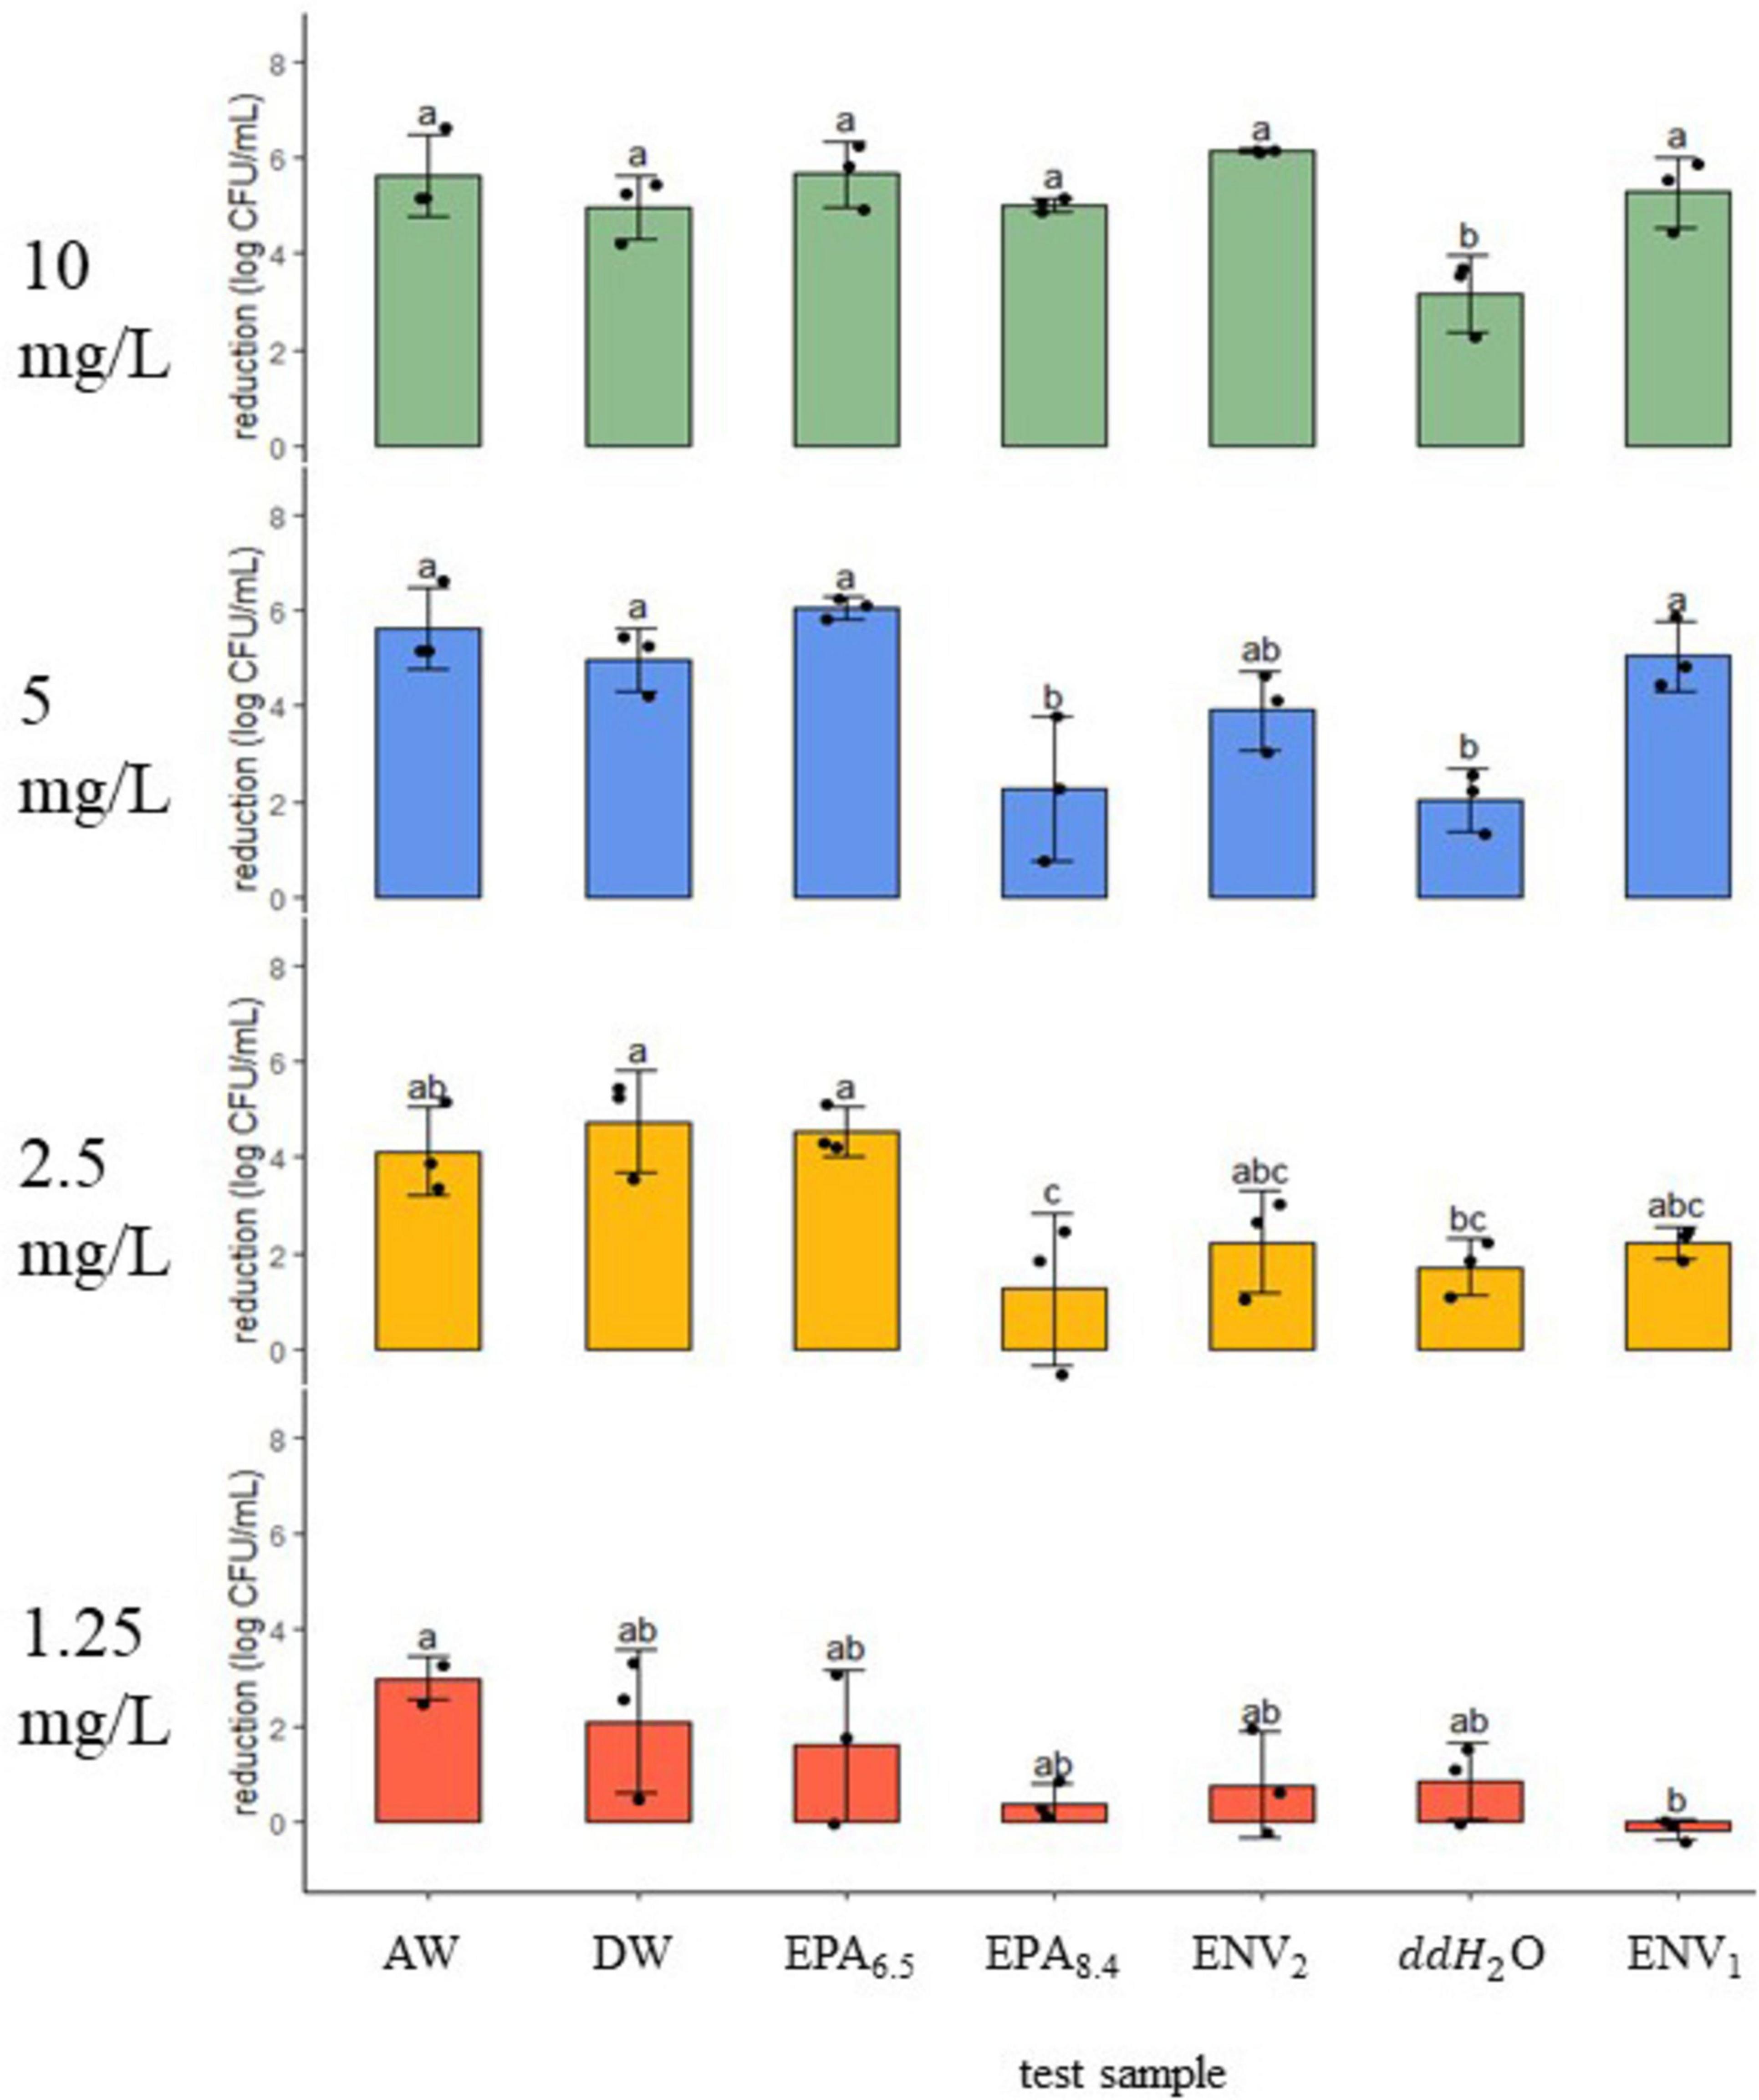
Figure 2. Listeria monocytogenes reduction (log CFU/ml ± SD) following 5-min exposure to a gradient of chlorine dioxide dosages in seven water samples. Dosage (mg/L) is shown on the left of each panel at 10, 5, 2.5, and 1.25. Black dots represent individual data points. Means (N = 3) with similar letter designations represent similar reductions across water samples as determined by two-way ANOVA and Tukey post hoc tests (α = 0.05). AW, agricultural well; DW, domestic well; EPA6.5/EPA8.4, laboratory standards with adjusted pH; ENV1/ENV2, open source environmental samples; ddH20, double distilled water.
2.8 Data analysis
All reduction experiments were performed in triplicate (n = 3), and all statistical analysis was performed in RStudio (2023.03.1++446) with standard significance levels (α = 0.05). Log reductions were calculated by subtracting treated bacterial populations from respective untreated positive control populations. Two-Way ANOVA followed by Tukey HSD post hoc tests were used to determine significant differences in reduction across water samples per treatment group. Student t-tests were used to determine differences in water metrics and sampled bacterial count between seasons. A Spearman’s correlation test was used to assess the strength and direction of the correlation between bacterial reduction and pH, turbidity, conductivity/TDS at 2.5 and 1.25 mg/L treatment levels.
3 Results
3.1 Test agricultural water quality
All water sample test results reporting pH, free chlorine, turbidity, conductivity, total dissolved solids, coliform, and Escherichia coli Most Probable Number are shown in Table 2. Environmental samples ENV1, ENV2, and the Domestic Well samples had pH of 8.3 ± 0.3, 8.1 ± 0.1, and 8.1 ± 0.2, respectively, which was similar in alkalinity to the EPA8.4 control (n = 6, p < 0.05). However, the Ag Well sample had only slight alkalinity with pH 7.4 ± 0.3 which was between ddH2O and EPA8.4 (n = 6, p < 0.05). The ddH2O negative control, Ag Well, and Domestic Well samples had no residual chlorine (0 ± 0 mg/L), while EPA6.5, EPA8.4, ENV1, and ENV2 all possessed similar trace levels of residual chlorine (n = 6, p < 0.05).
3.1.1 Turbidity
ENV2 had similar turbidity to EPA controls at 99.7 ± 9.3 FNU (n = 6, p < 0.05). In contrast, ENV1, had turbidity measurements of 72.8 ± 11.6 FNU, which was lower than the positive control turbidity (p < 0.05). The Ag Well, and Domestic Well samples had low turbidities of 1.0 ± 0.7 and 1.8 ± 1.1 FNU, respectively, similar to the ddH2O negative control.
3.1.2 Conductivity and total dissolved solids
There was a significant gradient in conductivity and total dissolved solids (TDS) across water samples (p < 0.001) (Table 2). The ENV1 sample had high conductivity and TDS measurements of 1783.3 ± 34.5 uS/cm and 1407.5 ± 25 ppm, respectively, which was similar to the EPA positive controls (n = 6, p < 0.05). Ag Well and Domestic Well samples had moderate conductivity of 719.8 ± 14.6 and 689 ± 39.1 uS/cm, respectively, which was higher than ddH2O (n = 6, p < 0.05). Similarly moderate, Ag Well and Domestic Well had TDS measurements of 571.8 ± 11.7 and 548.5 ± 11.7 ppm, respectively. The ENV2 environmental sample had lower conductivity and TDS measurements of 335.8 ± 69.6 uS/cm and 267.8 ± 56.3 ppm, respectively, significantly lower than the EPA controls but greater than ddH2O (n = 6, p < 0.05) (Table 2).
3.2 Response of STEC to chlorine dioxide
Under 10 mg/L treatment, there was 6–7 log reduction in STEC across field and lab samples (n = 3, p > 0.05) (Figure 1). At the next treatment level of 5 mg/L, the Ag Well, Domestic Well, and ENV2 samples showed a similar reduction to ddH2O, EPA6.5, and EPA8.4 controls, with 4–6 log reduction (n = 3, p > 0.05). However, at 5 mg/L, the ENV1 sample had 2.85 ± 0.8 log reduction, which was significantly lower compared to ddH2O and EPA6.5 controls but not compared to EPA8.4 (n = 3, p < 0.05). When exposed to 2.5 mg/L, Ag Well and Domestic Well groundwater samples demonstrated significantly higher reduction compared to ddH2O with 6.51 ± 0.2 and 5.82 ± 0.5 log CFU/ml respectively (n = 6, p < 0.05). Interestingly at 2.5 mg/L there was no difference in reduction between ddH2O, EPA6.5, and EPA8.4 (n = 3, p > 0.05). In addition, there was no difference (p > 0.05) between ENV2 and ddH2O control; however, ENV1 had a significantly lower reduction than ddH2O with only 0.58 ± 0.9 log CFU/ml reduction (n = 3, p < 0.05). At the lowest treatment level of 1.25 mg/L, the ddH2O, EPA6.5, and EPA8.4 controls had between 1 and 3 log reduction (n = 3, p > 0.05). Ag Well and Domestic Well samples had slightly higher reductions of 3.38 ± 1.1 and 3.14 ± 0.7 log CFU/ml, respectively, similar to ddH2O (n = 3, p > 0.05). The ENV2 sample had 1.10 ± 0.7 log reduction, similar to ddH2O, EPA6.5 and EPA8.4 (n = 3, p > 0.05). Lastly, the ENV1 sample had no reduction, with an average of −0.05 ± 0.2 log CFU/ml.
3.2.1 Minimum inhibitory concentration for a 3-Log reduction against STEC
Minimum Inhibitory Concentration (MIC) for 3-Log reduction against STEC was estimated using equations of lines fitted to reduction data (Table 3 and Supplementary Figure 1). Groundwater samples had the lowest MIC values of 1.4 and 1.6 mg/L for AW and DW, respectively. The ddH2O and EPA6.5 had similar MIC values of 1.8 and 2.0 mg/L. The open-source sample ENV2 MIC was 2.8 mg/L, and the EPA8.4 control MIC was 3.7 mg/L. The highest MIC against STEC was 5.8 mg/L for ENV1.
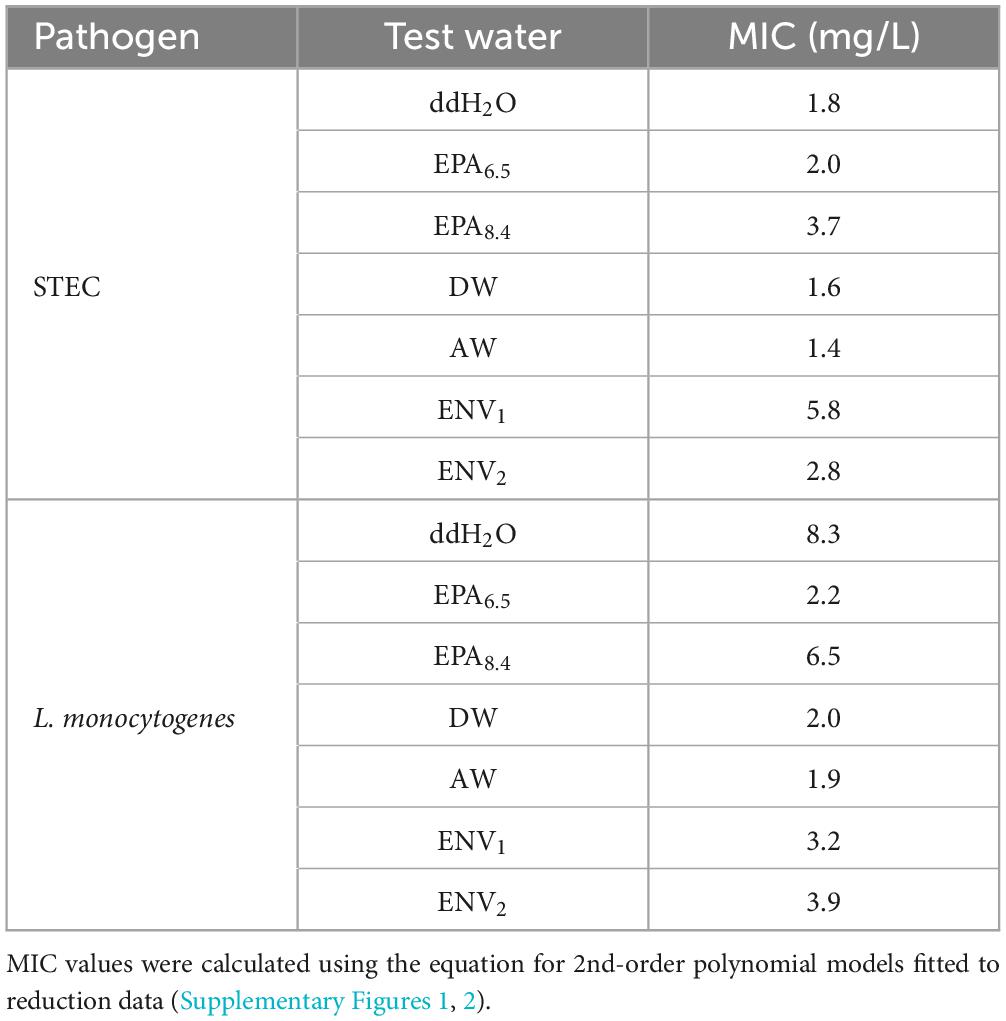
Table 3. Comparing minimum inhibitory concentration (MIC) of aqueous ClO2 required to achieve 3-Log reduction against STEC and L. monocytogenes across test water samples.
3.3 Response of L. monocytogenes to chlorine dioxide
At 10 mg/L treatment, the Ag Well, Domestic Well, ENV1 and ENV2 field samples were similar to EPA6.5 and EPA8.4 with ∼5–6 log CFU/ml reduction against Listeria monocytogenes (n = 3, p > 0.05) (Figure 2). In contrast, the ddH2O negative control had only 3.15 ± 0.8 log CFU/ml reduction, which was significantly lower than the other water samples (n = 3, p < 0.05). Following 5 mg/L treatment, the Ag Well, Domestic Well, ENV1, and EPA6.5 control had similar reduction between ∼5–6 log, with ENV2 slightly lower at 3.90 ± 0.8 log reduction (p > 0.05) (n = 3, p < 0.05). The ddH2O control had significantly less reduction with only 2.03 ± 0.7 log reduction, similar to EPA8.4 with 2.26 ± 1.5 log CFU/ml reduction (n = 3, p > 0.05). At 2.5 mg/L treatment, the Ag Well and Domestic Well samples had 4.12 ± 0.9 log CFU/ml and 4.74 ± 1.1 log CFU/ml reduction, respectively, similar to EPA6.5 and higher than ddH2O (n = 3, p < 0.05). The ENV1 and ENV2 samples had lower reduction values of 2.23 ± 0.3 and 2.23 ± 1.1 log CFU/ml, respectively, which were not significantly different from any controls (n = 3, p < 0.05). For the lowest treatment of 1.25 mg/L, the Ag Well, Domestic Well, ENV1, and ENV2 field samples were similar to lab controls with reduction measurements ranging from 0 to 3 Log reduction (n = 3, p > 0.05). The Ag Well and Domestic Well had the highest reduction at 2.98 ± 0.5 and 2.09 ± 1.5 log CFU/ml while ENV1 showed no reduction.
3.3.1 Minimum Inhibitory Concentration for a 3-Log reduction against L. monocytogenes
Minimum Inhibitory Concentration for 3 Log reduction (MIC) of ClO2 against L. monocytogenes was estimated using the same method as STEC (Table 3 and Supplementary Figure 2). Groundwater samples AW and DW had the lowest MIC of 1.9 and 2.0 mg/L, respectively. The EPA6.5 control and ENV1 sample MIC were 2.2 and 3.2 mg/L, respectively. ENV2 sample MIC was 3.9 mg/L while EPA8.4 control MIC was 6.5 mg/L. The highest MIC against L. monocytogenes was in ddH2O, at 8.3 mg/L.
3.4 Seasonal variation in water metrics
3.4.1 Water metrics
Summer and Winter water metrics were compared for each field site in the Salinas Valley using a student t-test (n = 2). At the ENV2 site, there were significant differences between Summer and Winter pH and turbidity (n = 2, p < 0.05) (Figure 3). At the same time, there were no differences in water metrics between summer and winter samples from the ENV1, AW, or DW field sites (p > 0.05) (Figure 4). The ENV2 site had pH levels of 8.64 ± 0 in the summer and 7.85 ± 0.04 in the winter. The turbidity of ENV2 was 131.65 ± 59.89 FNU in the summer and 740.5 ± 122.33 FNU in the winter.
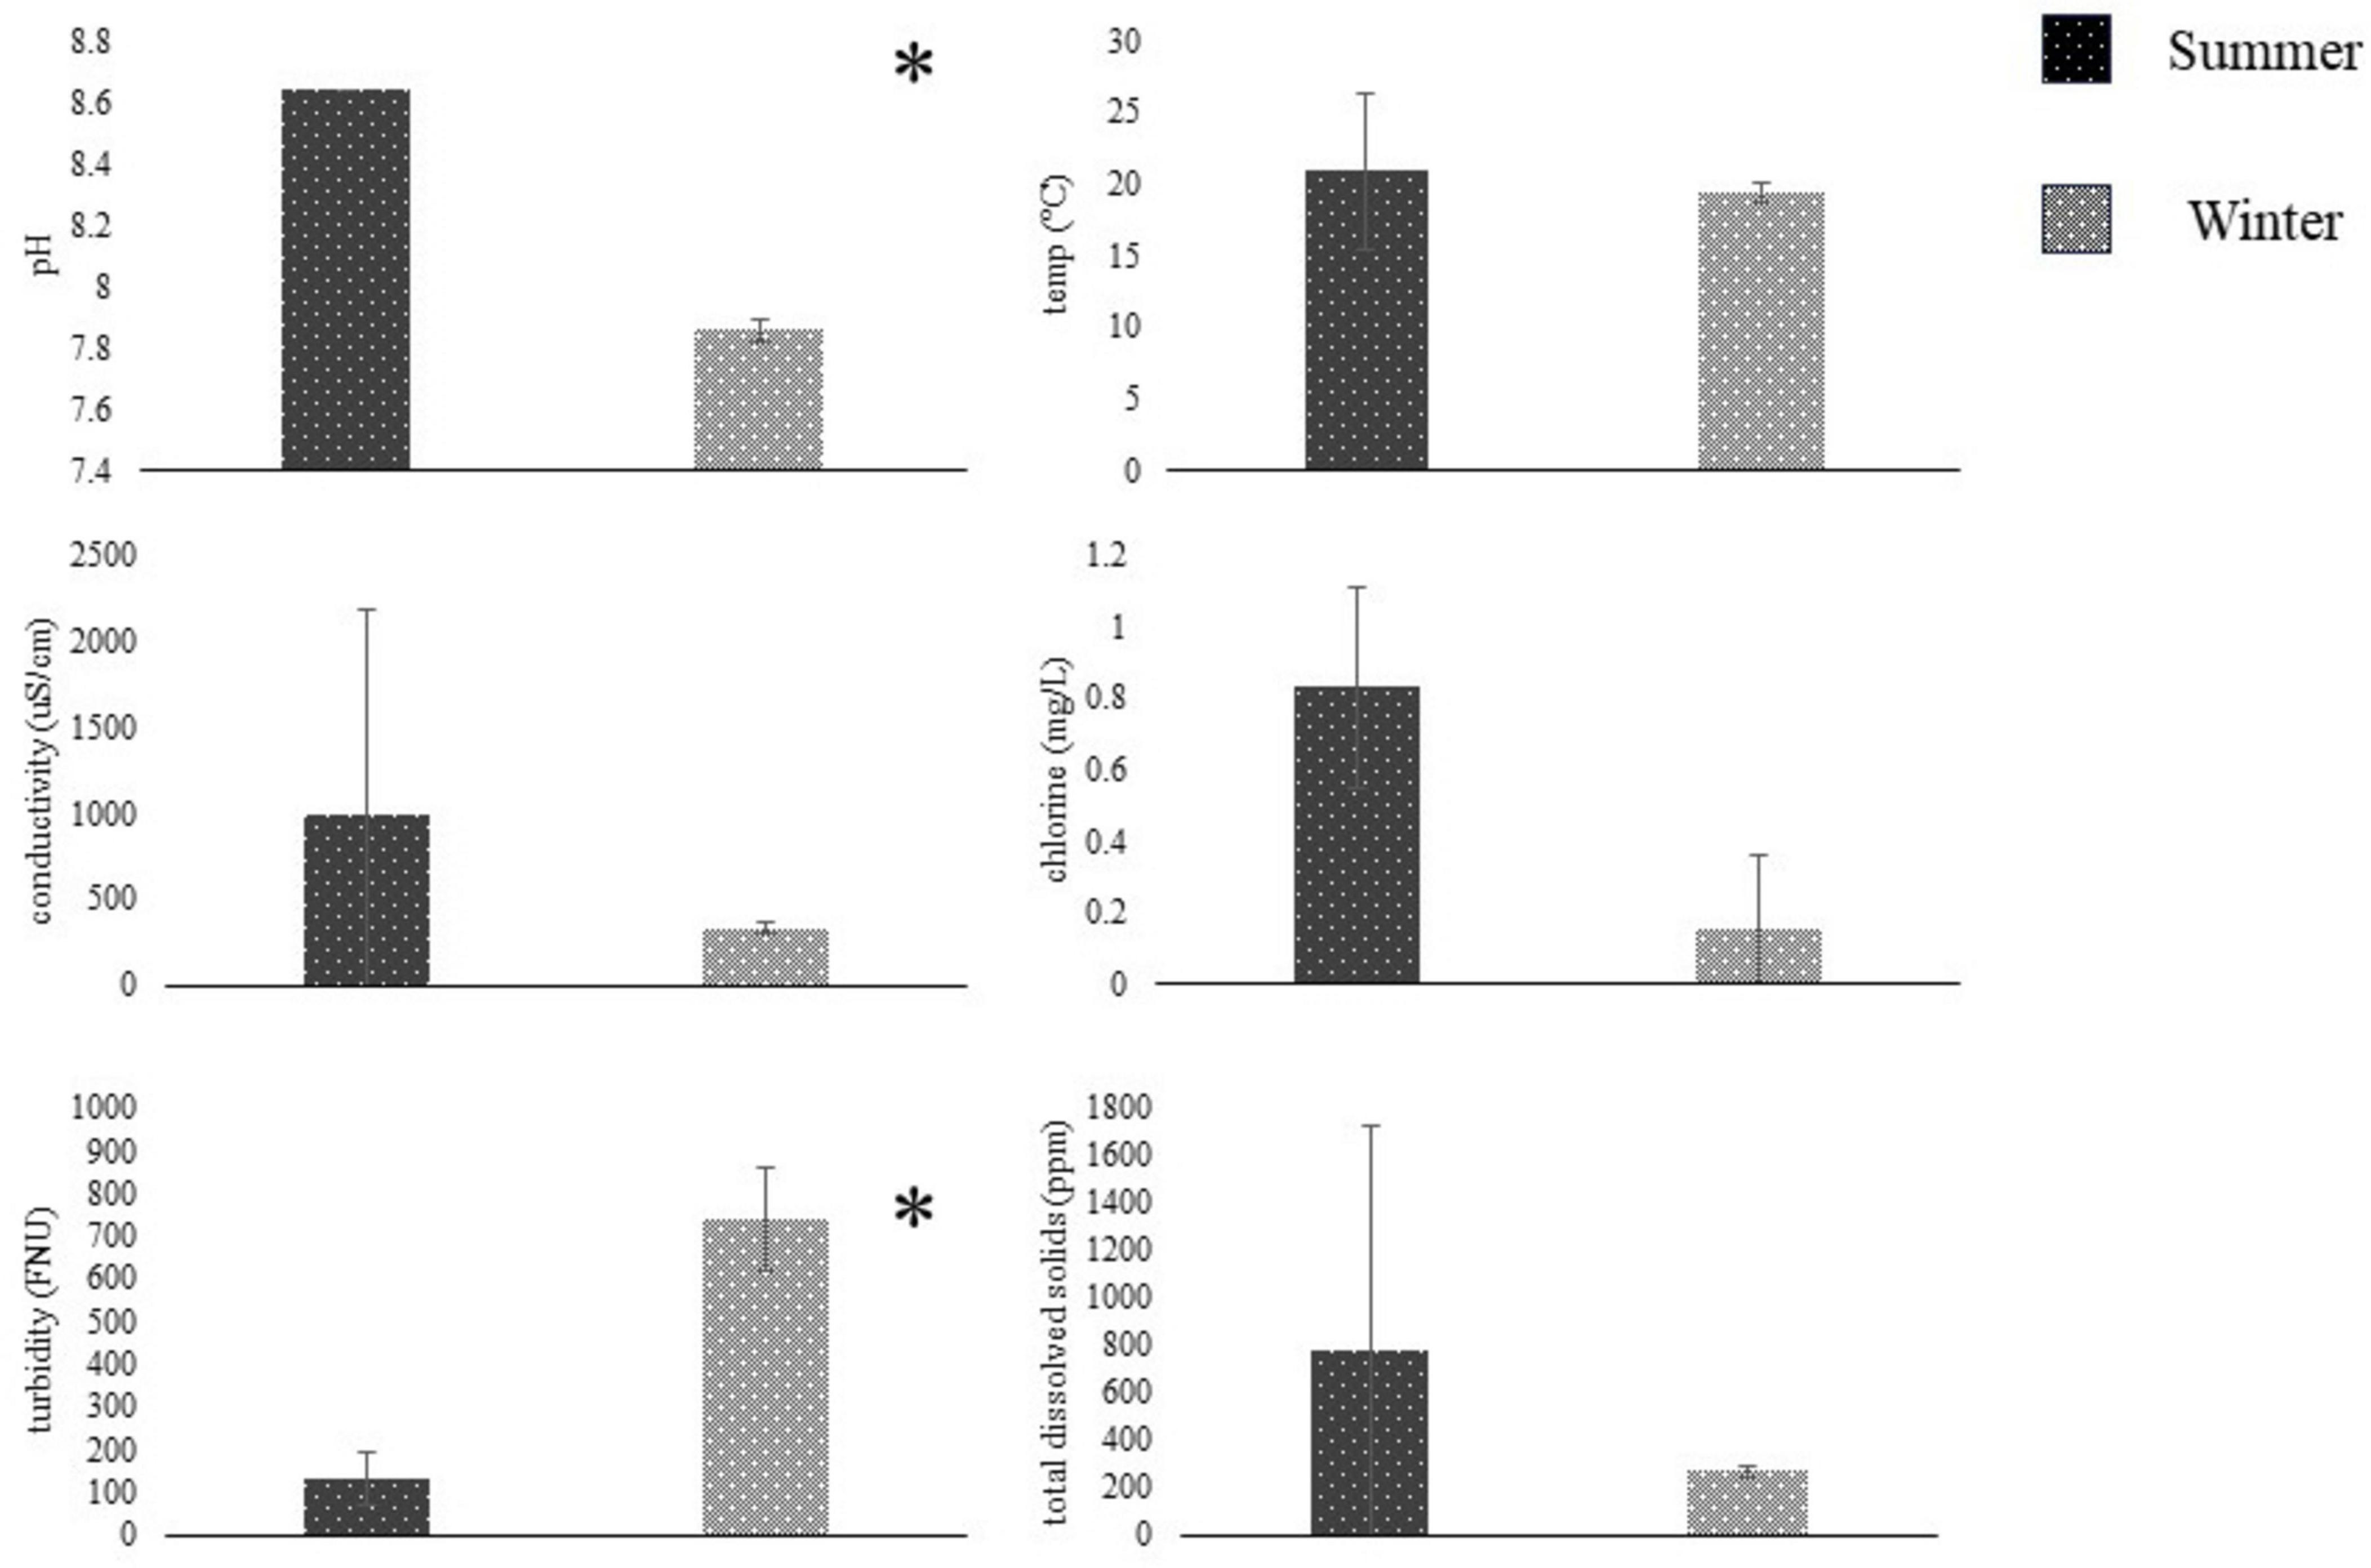
Figure 3. Water metrics (mean ± SD, N = 2) compared between summer (dark) and winter (light) seasons using students t-test. Summer sampling occurred between June and August, and winter sampling was conducted between November and January. Water was sampled from the Salinas River near Gonzales, CA, and tested on-site for pH, temperature, conductivity, chlorine, turbidity, and total dissolved solids—sampling site based on Gorski et al. (2022). *Represent significant differences (p < 0.05) between seasons.
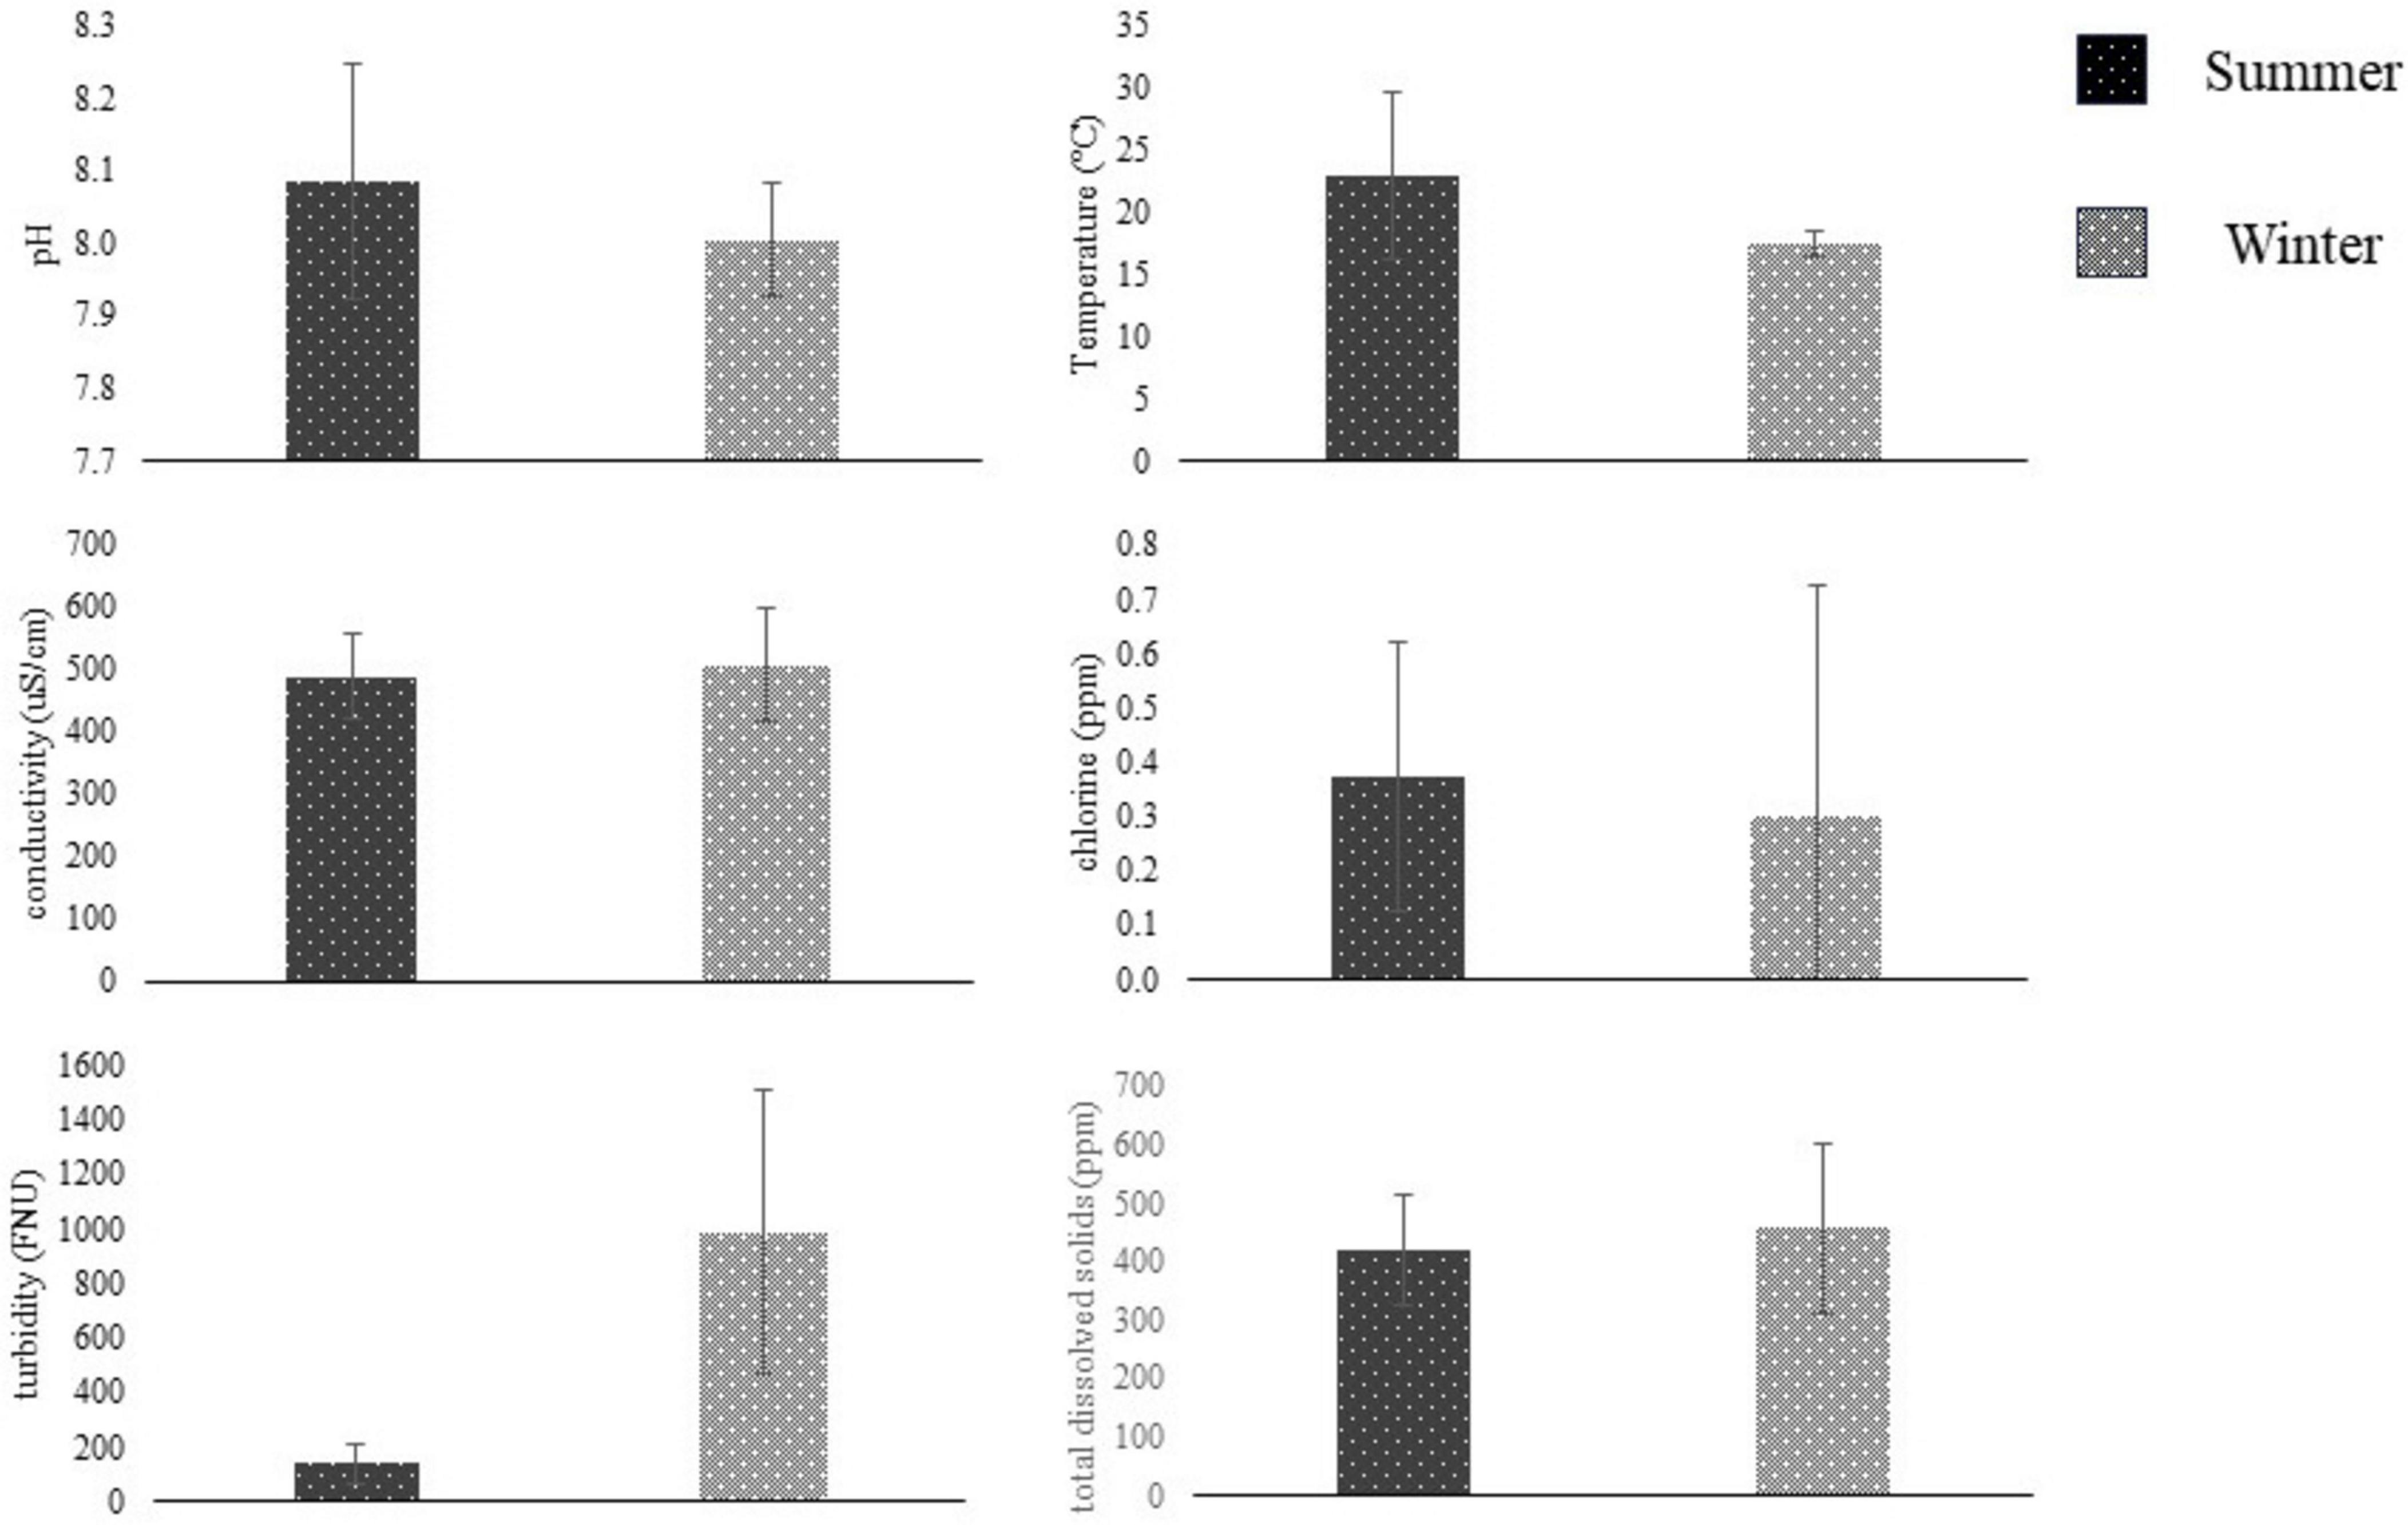
Figure 4. Water metrics (mean ± SD, N = 2) compared between summer (dark) and winter (light) seasons using students t-test. Summer sampling occurred between June and August, and winter sampling was conducted between November and January. Water samples were collected from San Jon Rd. canal near Salinas, CA, and tested on-site for pH, temperature, conductivity, chlorine, turbidity, and total dissolved solids. Sampling sites were based on Gorski et al. (2022). *Represent significant differences (p < 0.05) between seasons.
3.4.2 Coliforms and E. coli
Both open-source water sites tested positive (+) for coliforms in all samples across both seasons. When comparing E. coli MPN across seasons, there was no significant difference at either the ENV1 or ENV2 field sites. Both sample sites had a high level of variance from sample to sample, and a general increase in the winter was observed, though not significant (n = 2, p > 0.05) (Figure 5). The Ag Well and Domestic Well samples tested negative for coliforms and E. coli MPN across both seasons, as well as the ddH2O control and the EPA control samples.
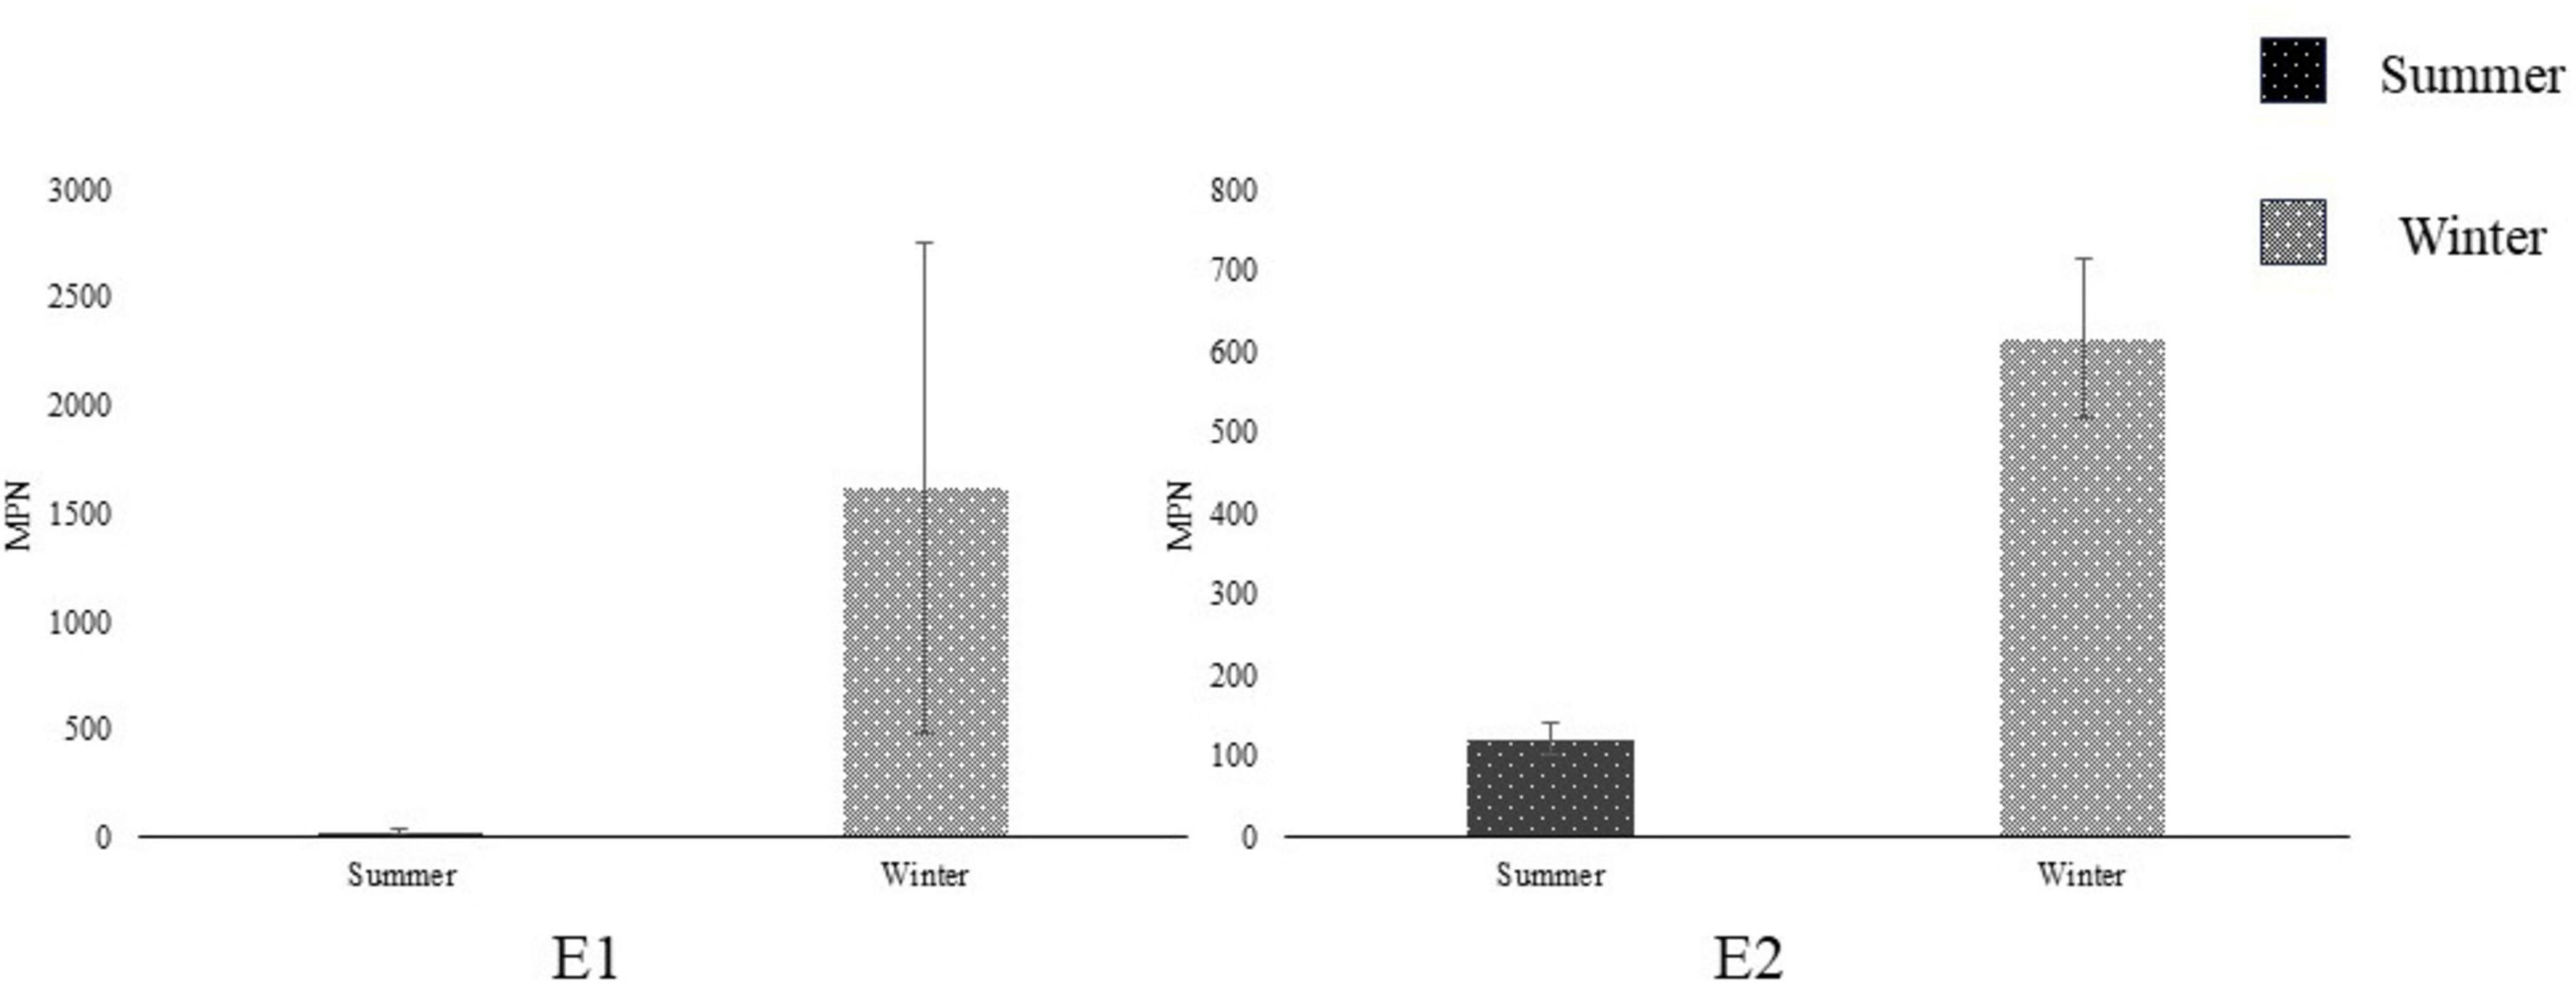
Figure 5. Comparing Escherichia coli Most Probable Number (MPN) (mean ± SD) between seasons at open-source sites E1 and E2 in Salinas Valley, CA (N = 2) using a student’s t-test. Summer (dark) season sampling occurred between June and August. Winter (light) season sampling occurred between November and January. *Represent significant differences (p < 0.05) between seasons.
3.5 Water metric and bacterial reduction correlation
Using Spearman correlation, there was no significant correlation between pH, turbidity, or conductivity/TDS and bacterial reduction of STEC or Listeria monocytogenes when testing across water samples at 1.25 and 2.5 mg/L (p > 0.05) (Table 4).
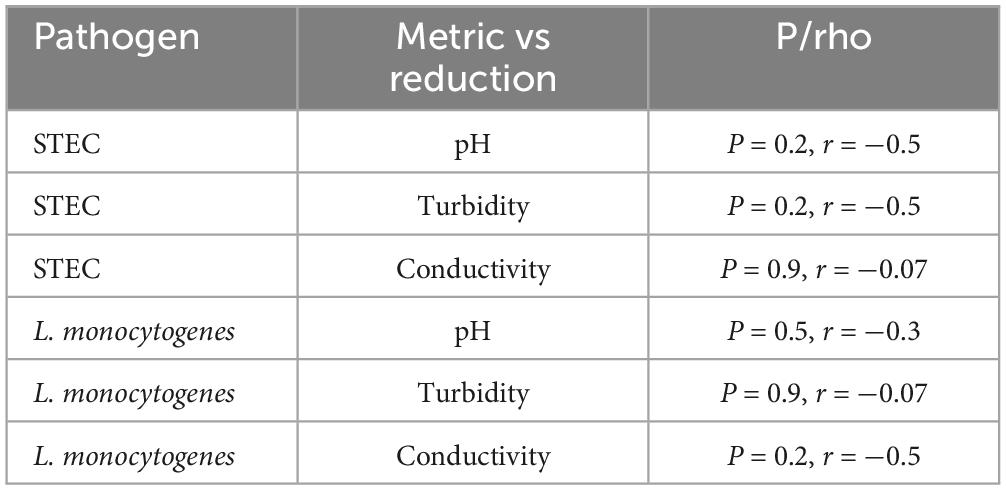
Table 4. Spearman correlation values for assessing the strength of correlation between reduction and water metrics.
4 Discussion
ClO2 is a strong oxidizer and a useful alternative to conventional chlorine-based methods for disinfecting pathogens in various water sources (Barbeau et al., 2005; Bridges et al., 2022; Goodburn and Wallace, 2013). Dry precursor batch treatments of ClO2 are efficacious in both ground and open-source waters, suggesting its suitability for agricultural water treatment. The present study demonstrates the inactivation of STEC and Listeria monocytogenes using dry precursors to create ClO2 in variable agricultural water qualities. It suggests concentrations for a 3-log reduction of human pathogens.
Irrigation water metrics may fall outside optimal NaClO water quality ranges, meriting the need for alternative treatments. Field samples from Salinas Valley had water metrics outside the optimal NaClO treatment range (Table 2). Standard agricultural water treatment utilizes NaClO (bleach) due to low cost and existing infrastructure. NaClO has limitations, including reduced efficacy in water with pH > 8 and reactivity with organic matter, such as nitrogen fertilizers that produce hazardous disinfection byproducts (DBPs) (Chang et al., 2000; Goodburn and Wallace, 2013). In addition, extensive use of NaClO has raised concerns regarding persistent populations of pathogens remaining in the food supply (Hu et al., 2020; Praeger et al., 2018; Xu et al., 2022; Zhang et al., 2023). In this study of ClO2 against STEC and L. monocytogenes, variation in reduction between water samples appeared at lower dosages while reduction was similar at 5 and 10 mg/L. Across treatments, there was no correlation between sample pH, turbidity, conductivity, and log reduction in either STEC or L. monocytogenes (Table 4). While the source of water played a role in water quality and ClO2 efficacy, no single variable significantly impacted the inactivation of pathogen. This is in alignment with previous research that demonstrate ClO2 broad spectrum ability to inactivate potential pathogens in irrigation water (Truchado et al., 2018).
Groundwater aquifers are a good source of irrigation water due to consistent water metrics and infrequent bacterial contamination. Pathogenic bacteria treated in groundwater required the lowest concentration to achieve 3-Log reduction (Table 3). In addition, Ag Well and Domestic Well samples showed a more significant reduction than ddH2O lab water. Recently, Krüger et al. (2023) reported increased ClO2 inactivation in phosphate buffered-saline solution compared to tap water when exposing Pseudomonas aeruginosa, E. coli, and Staphylococcus aureus to 0.4 mg/L ClO2 for 5 min. Although it is unclear why conductive samples increase ClO2 disinfection, a positive correlation between ClO2 and factors related to conductivity was demonstrated. Therefore, alkaline groundwater samples possessing moderate conductivity and low turbidity are potential candidates for ClO2 treatment.
In contrast to groundwater, open-source water in agricultural areas is subject to frequent contamination by runoff that contributes to fluctuating water metrics and pathogen load (Gorski et al., 2022; Jefri et al., 2022; Lacombe et al., 2022). Open-source field samples ENV1 and ENV2 had the lowest reduction across water samples despite having more moderate water quality compared to EPA6.5/EPA8.4 laboratory standards. The complexity and inconsistency in open-source water make it difficult to treat compared to groundwater sources, where high dosage and multiple disinfection methods are introduced to accommodate diversity within the sample. Regional water quality and contamination may vary throughout the year due to seasonal changes in precipitation, temperature, and animal activity. During the 2023–2024 season, extreme variation in water quality throughout seasons was observed at the open-source sites, likely due to sporadic rain events in the 2023–2024 summer-fall-winter. The pH decreased, and turbidity increased significantly at one site (ENV2) in the winter (Figure 5). E. coli MPN counts were also higher in the winter, coinciding with the elevated turbidity, posing potential issues for water treatment. ClO2 is less reactive to organic material and will not break down into chloramines as readily as NaOCl (Jefri et al., 2022; Nadupalli et al., 2011). Several articles report no major influence on ClO2 disinfection in pH ranging from 3.0 to 9.0 (Chang et al., 2000; Huang et al., 1997; Jefri et al., 2022; Xu et al., 2022). Therefore, ClO2 is well suited for open-source water decontamination because its broader spectrum activities accommodate unpredictable season changes.
Alkalinity is an important factor in determining water quality and the appropriate sanitizer. In the present study, the pH of each sample did not correlate with the reduction in either STEC or L. monocytogenes trials, but some patterns were observed (Table 4). Previously, Ofori et al. (2018) demonstrated that ClO2 disinfection kinetics increased in alkaline lab waters compared to acidic conditions. Nadupalli et al. (2011) showed that ClO2 reactivity increased in hydroxide-rich solutions and stunted reactivity in acidic conditions. While alkaline waters may improve the reactive rates of ClO2 oxidation, higher levels of turbidity and organic matter may quickly react ClO2 to the less reactive ClO2– ion, drastically reducing disinfection (Gagnon et al., 2005; Ayyildiz et al., 2009). In this case, a more significant reduction against STEC in groundwater samples with higher pH (8.1 and 7.4) is expected compared to pure ddH2O with a pH of 6.7 (Figures 1, 2 and Table 2). Although pH appears not to be the driving force for variation in reduction, it may play a complex role in influencing ClO2.
Bacterial cell envelope structure may influence pathogen tolerance to ClO2. In this report, L. monocytogenes and STEC responded differently to chlorine dioxide treatment across water samples. Overall, ClO2 was less effective in treating L. monocytogenes than STEC (Table 3). Previous reports demonstrated that L. monocytogenes responded less to ClO2 and may be best treated using peroxyacetic acid (PAA) (Hua et al., 2019). Differences in the cell wall and membrane structure between gram-positive and gram-negative bacteria may play a role, as ClO2 acts on these features of the cell (Bridges et al., 2020; Hua et al., 2019; Krüger et al., 2023; Ofori et al., 2018). Pathogens also displayed different responses across water samples. For example, L. monocytogenes treated in ddH2O required the highest dosage to achieve 3-Log reduction compared to any other water sample (Table 3). Little is known about the biotic and abiotic factors that allow L. monocytogenes to persist in the environment and whether the lack of environmental stressors may render L. monocytogenes harder to inactivate (Gartley et al., 2022; Arcari et al., 2020; Labidi et al., 2023). The EPA updated protocol excluded L. monocytogenes from the group of pathogens tested (EPA, 2024). This adjustment reflects the different responses to the environment and disinfectant displayed by L. monocytogenes compared to STEC, and thus, they should not be treated the same way. Facility contamination remains a pressing concern in food safety, and the abundance of pathogenic L. monocytogenes in Salinas Valley waterways underlines the importance of defining effective treatments (Gorski et al., 2022).
Pathogens in this experiment were tested at the stationary phase; however, cells in the long-term survival (LTS) phase exhibit greater tolerance to physical and chemical stressors, including chlorine-based disinfectants (Bhullar et al., 2021; Wen et al., 2009). The long-term survival phase is reached following the death phase and is common for cells persisting in water and soil (Finkel, 2006; Fremaux et al., 2008). While testing disinfectants against cells in the stationary phase is a common practice, understanding how cells in the LTS phase tolerate ClO2 treatment in environmental samples will be important for developing treatment recommendations and guidelines.
The primary goal of this report is to inform the development of water treatment guidelines designed to treat human pathogens in agricultural water. In this study, dosages of 1.5–3.5 mg/L ClO2 were effective in achieving ≥3 log reduction against stationary phase STEC across water qualities (Table 3). Listeria monocytogenes should be treated differently, and higher dosages are required due to the resiliency displayed and the uncertain factors influencing survivability (Table 3). Further mechanism studies may be useful in investigating the process by which gram-positive pathogens react to ClO2 and how effective other alternative disinfectants are against L. monocytogenes in agricultural water samples.
Data availability statement
The original contributions presented in this study are included in this article/Supplementary material, further inquiries can be directed to the corresponding author.
Author contributions
JV: Data curation, Formal analysis, Investigation, Methodology, Writing – original draft. AL: Conceptualization, Investigation, Methodology, Writing – review and editing. BH: Methodology, Writing – review and editing. VW: Conceptualization, Funding acquisition, Project administration, Resources, Supervision, Writing – review and editing.
Funding
The author(s) declare that financial support was received for the research, authorship, and/or publication of this article. This work was supported by the United States Department of Agriculture National Institute of Food and Agriculture (USDA NIFA) Grant Special Crops Research Initiative (grant number 20212-51181-35905).
Acknowledgments
We thank ALBA farm for collaboration. We also thank Joel Tenney (ICA TriNova) for generously providing ClO2 precursors.
Conflict of interest
The authors declare that the research was conducted in the absence of any commercial or financial relationships that could be construed as a potential conflict of interest.
Publisher’s note
All claims expressed in this article are solely those of the authors and do not necessarily represent those of their affiliated organizations, or those of the publisher, the editors and the reviewers. Any product that may be evaluated in this article, or claim that may be made by its manufacturer, is not guaranteed or endorsed by the publisher.
Supplementary material
The Supplementary Material for this article can be found online at: https://www.frontiersin.org/articles/10.3389/fmicb.2024.1469615/full#supplementary-material
References
Arcari, T., Feger, M.-L., Guerreiro, D. N., Wu, J., and O’Byrne, C. P. (2020). Comparative review of the responses of listeria monocytogenes and Escherichia coli to Low pH stress. Genes 11:1330. doi: 10.3390/genes11111330
Ayyildiz, O., Ileri, B., and Sanik, S. (2009). Impacts of water organic load on chlorine dioxide disinfection efficacy. J. Hazard. Mater. 168, 1092–1097. doi: 10.1016/j.jhazmat.2009.02.153
Barbeau, B., Desjardins, R., Mysore, C., and Prévost, M. (2005). Impacts of water quality on chlorine and chlorine dioxide efficacy in natural waters. Water Res. 39, 2024–2033. doi: 10.1016/j.watres.2005.03.025s
Bhullar, M. S., Shaw, A., Mendonca, A., Monge, A., Nabwire, L., Thomas-Popo, E., et al. (2021). Toxin–producing Escherichia coli in the long-term survival phase exhibit higher chlorine tolerance and less sublethal injury following chlorine treatment of romaine lettuce. Foodborne Pathog. Dis. 18, 276–282.
Bridges, D. F., Lacombe, A., and Wu, V. C. H. (2020). Integrity of Escherichia coli O157:H7 Cell Wal and Membranes After Chlorine Dioxide Treatment. Front. Microbiol. 11:888. doi: 10.3389/fmicb.2020.00888
Bridges, D. F., Lacombe, A., and Wu, V. C. H. (2022). Fundamental differences in inactivation mechanisms of Escherichia coli O157:H7 between chlorine dioxide and sodium hypochlorite. Front. Microbiol. 13:923964. doi: 10.3389/fmicb.2022.923964
Chang, C.-Y., Hsieh, Y.-H., Hsu, S.-S., Hu, P.-Y., and Wang, K.-H. (2000). The formation of disinfection byproducts in water treated with chlorine dioxide. J. Hazard. Mater. 79, 89–102. doi: 10.1016/S0304-3894(00)00184-9
EPA (2024). FDA updates protocol for the development and registration of treatments for preharvest agricultural water. Silver Spring, MD: FDA.
FDA (2021). FDA proposes changes to food safety modernization act rule to enhance safety of agricultural water used on produce. Silver Spring, MD: FDA.
FDA (2023). Outbreak investigation of E. coli: Romaine from salinas, California (November 2019). Silver Spring, MD: FDA.
Finkel, S. E. (2006). Long-term survival during stationary phase: Evolution and the GASP phenotype. Nat. Rev. Microbiol. 4, 113–120.
Fremaux, B., Prigent-Combaret, C., and Vernozy-Rozand, C. (2008). Long-term survival of Shiga toxin-producing Escherichia coli in cattle effluents and environment: An updated review. Vet. Microbiol. 132, 1–18.
Gagnon, G. A., Rand, J. L., O’Leary, K. C., Rygel, A. C., Chauret, C., and Andrews, R. C. (2005). Disinfectant efficacy of chlorite and chlorine dioxide in drinking water biofilms. Water Res. 39, 1809–1817. doi: 10.1016/j.watres.2005.02.004
Gartley, S., Anderson-Coughlin, B., Sharma, M., and Kniel, K. E. (2022). Listeria monocytogenes in irrigation water: An assessment of outbreaks, sources, prevalence, and persistence. Microorganisms 10:1319. doi: 10.3390/microorganisms10071319
Gelting, R. J., Baloch, M. A., Zarate-Bermudez, M. A., and Selman, C. (2011). Irrigation water issues potentially related to the 2006 multistate E. coli O157:H7 outbreak associated with spinach. Agric. Water Manag. 98, 1395–1402. doi: 10.1016/j.agwat.2011.04.004
Goodburn, C., and Wallace, C. A. (2013). The microbiological efficacy of decontamination methodologies for fresh produce: A review. Food Control 32, 418–427. doi: 10.1016/j.foodcont.2012.12.012
Gorski, L., Cooley, M. B., Oryang, D., Carychao, D., Nguyen, K., Luo, Y., et al. (2022). Prevalence and clonal diversity of over 1,200 Listeria monocytogenes isolates collected from public access waters near produce production areas on the central california coast during 2011 to 2016. Appl. Environ. Microbiol. 88, e357–e322. doi: 10.1128/aem.00357-22
Hu, Y., Yang, Q., Guo, Y., Xu, J., Zhou, W., Li, J., et al. (2020). Volatile organic chloramines formation during ClO2 treatment. J. Environ. Sci. 92, 256–263. doi: 10.1016/j.jes.2020.02.020
Hua, Z., Korany, A. M., El-Shinawy, S. H., and Zhu, M.-J. (2019). Comparative evaluation of different sanitizers against Listeria monocytogenes biofilms on major food-contact surfaces. Front. Microbiol. 10:2462. doi: 10.3389/fmicb.2019.02462
Huang, J., Wang, L., Ren, N., Ma, F., and Juli. (1997). Disinfection effect of chlorine dioxide on bacteria in water. Water Res. 31, 607–613. doi: 10.1016/S0043-1354(96)00275-8
Jefri, U. H. N. M., Khan, A., Lim, Y. C., Lee, K. S., Liew, K. B., Kassab, Y. W., et al. (2022). A systematic review on chlorine dioxide as a disinfectant. J. Med. Life 15, 313–318. doi: 10.25122/jml-2021-0180
Krüger, T. I. M., Herzog, S., Mellmann, A., and Kuczius, T. (2023). Impact of chlorine dioxide on pathogenic waterborne microorganisms occurring in dental chair units. Microorganisms 11:1123. doi: 10.3390/microorganisms11051123
Labidi, S., Jánosity, A., Yakdhane, A., Yakdhane, E., Surányi, B., Mohácsi-Farkas, C., et al. (2023). Effects of pH, sodium chloride, and temperature on the growth of Listeria monocytogenes biofilms. Acta Aliment. 52, 270–280. doi: 10.1556/066.2023.00017
Lacombe, A., Quintela, I. A., Liao, Y.-T., and Wu, V. C. H. (2022). Shiga toxin-producing Escherichia coli outbreaks in California’s leafy greens production continuum. Front. Food Sci. Technol. 2:1068690. doi: 10.3389/frfst.2022.1068690
Nadupalli, S., Koorbanally, N., and Jonnalagadda, S. B. (2011). Chlorine dioxide-facilitated oxidation of the azo dye amaranth. J. Phys. Chem. A 115, 11682–11688. doi: 10.1021/jp206175s
Ofori, I., Maddila, S., Lin, J., and Jonnalagadda, S. B. (2017). Chlorine dioxide oxidation of Escherichia coli in water – A study of the disinfection kinetics and mechanism. J. Environ. Sci. Health Part A 52, 598–606. doi: 10.1080/10934529.2017.1293993
Ofori, I., Maddila, S., Lin, J., and Jonnalagadda, S. B. (2018). Chlorine dioxide inactivation of Pseudomonas aeruginosa and Staphylococcus aureus in water: The kinetics and mechanism. J. Water Process Eng. 26, 46–54. doi: 10.1016/j.jwpe.2018.09.001
Praeger, U., Herppich, W. B., and Hassenberg, K. (2018). Aqueous chlorine dioxide treatment of horticultural produce: Effects on microbial safety and produce quality–A review. Crit. Rev. Food Sci. Nutr. 58, 318–333. doi: 10.1080/10408398.2016.1169157
Truchado, P., Gil, M. I., Suslow, T., and Allende, A. (2018). Impact of chlorine dioxide disinfection of irrigation water on the epiphytic bacterial community of baby spinach and underlying soil. PLoS ONE 13:e0199291. doi: 10.1371/journal.pone.0199291
Wen, J., Anantheswaran, R., and Knabel, S. (2009). Changes in barotolerance, thermotolerance, and cellular morphology throughout the life cycle of Listeria monocytogenes. Appl. Environ. Microbiol. 75, 1581–1588.
Xu, M.-Y., Lin, Y.-L., Zhang, T.-Y., Hu, C.-Y., Tang, Y.-L., Deng, J., et al. (2022). Chlorine dioxide-based oxidation processes for water purification:A review. J. Hazard. Mater. 436:129195. doi: 10.1016/j.jhazmat.2022.129195
Keywords: chlorine dioxide, Escherichia coli, Listeria monocytogenes, water treatment, agricultural water, minimum inhibitory concentration
Citation: Van Blair J, Lacombe A, Harvey BL and Wu VCH (2024) Chlorine dioxide is a broad-spectrum disinfectant against Shiga toxin-producing Escherichia coli and Listeria monocytogenes in agricultural water. Front. Microbiol. 15:1469615. doi: 10.3389/fmicb.2024.1469615
Received: 24 July 2024; Accepted: 10 October 2024;
Published: 25 October 2024.
Edited by:
Alicja Wegrzyn, University of Gdańsk, PolandReviewed by:
Aubrey Francis Mendonca, Iowa State University, United StatesSylwia Bloch, University of Gdańsk, Poland
Copyright © 2024 Van Blair, Lacombe, Harvey and Wu. This is an open-access article distributed under the terms of the Creative Commons Attribution License (CC BY). The use, distribution or reproduction in other forums is permitted, provided the original author(s) and the copyright owner(s) are credited and that the original publication in this journal is cited, in accordance with accepted academic practice. No use, distribution or reproduction is permitted which does not comply with these terms.
*Correspondence: Vivian C. H. Wu, dml2aWFuLnd1QHVzZGEuZ292
 Jared Van Blair
 Alison Lacombe
 Beatrice L. Harvey
 Vivian C. H. Wu