- 1Yunnan Botanee Bio-Technology Group Co., Ltd., Kunming, China
- 2Yunnan Characteristic Plant Extraction Laboratory, Yunnan Yunke Characteristic Plant Extraction Laboratory Co., Ltd., Kunming, China
- 3Innovation Materials Research and Development Center, Botanee Research Institute, Shanghai Jiyan Biomedical Development Co., Ltd., Shanghai, China
Introduction: Atopic dermatitis (AD) is an allergic disease caused by various factors that can affect an individual’s appearance and cause psychological stress. Therefore, it is necessary to investigate the underlying mechanisms and develop effective treatment strategies. The gut microbiota and bacterial metabolism play crucial roles in human diseases. However, their specific role in AD remains unclear.
Methods: In this study, we established a mouse model of AD and found that 2,4-dinitrofluorobenzene disrupted the skin barrier in mice. The species composition of intestinal bacteria was then analyzed by fecal 16s rRNA sequencing. The metabolic level of mice was analyzed by untargeted and targeted metabolomics in stool.
Results: The levels of filaggrin and aquaporin 3 proteins in the model mice and total superoxide dismutase, catalase and malondialdehyde levels were significantly altered. Additionally, inflammatory factors such as tumor necrosis factor-alpha showed a significant increase. Using 16S rRNA gene sequencing, we identified 270 bacterial species with altered abundances of Ruminococcaceae and Bifidobacteriaceae. The untargeted metabolomic analysis detected 1,299 metabolites. Targeted analysis of free fatty acids revealed 49 metabolites with notable increases in linoleic and linolenic acid levels. Fecal bacterial transplantation experiments have demonstrated that oxidative stress, inflammation, and skin barrier damage were alleviated after transplantation.
Discussion: These findings suggested that the metabolite linoleic acid negatively correlated with Ruminococcaceae and Bifidobacteriaceae may influence AD development. Perturbations in the intestinal bacteria and flora contributed to the development of AD, and the mouse model could serve as a valuable tool for further investigation of therapeutic approaches for managing ADS.
1 Introduction
At Atopic dermatitis (AD) is a chronic skin disease characterized by recurrent and acute flares, with primary symptoms including intractable pruritus, cutaneous eczema, structural defects, and immune dysfunction (Zeng et al., 2020). AD affects 1–3% of adults and is more prevalent in children (1–7 years old), affecting 10–20% (Wu et al., 2011). Increasing evidence suggests that AD is a systemic disease that is associated with cardiovascular, autoimmune, neurological, psychiatric, and metabolic disorders (Mesjasz et al., 2023). Considering the significant impact of AD on patients, it is crucial to investigate its pathogenesis and explore effective treatment methods.
The pathogenesis of AD typically involves five factors: disruption of the epidermal barrier, dysbiosis of the skin microbiota, altered immune responses, and genetic and environmental factors (Sroka-Tomaszewska and Trzeciak, 2021). Immune responses and genetic factors contribute to AD pathogenesis, with studies indicating a link between the incidence of AD and exposure to acidic oxides, nitrogen dioxide, and particulate matter (Park et al., 2022). Chronic skin inflammation in AD can lead to dysbiosis of the skin microbiota and increase pathogenic strains (Santos-Marcos et al., 2019).
The intestinal microenvironment, which is influenced by the gut microbiota and its products, significantly affects immune function. Specific diseases can alter the composition of the intestinal flora, and the microbiota in the intestine can influence diseases through various axes, such as the enterohepatic, intestinal-brain, intestinal-heart, and intestinal-skin axis (Zhou et al., 2020; Góralczyk-Bińkowska et al., 2022; Pabst et al., 2023; Matsiras et al., 2023; Qiao et al., 2024). Metabolites derived from the gut microbiota, particularly from fatty acid and tryptophan metabolism, play crucial roles at the cellular and systemic levels by interacting with the immune system and skin cell receptors (Stec et al., 2023). Several probiotics, including nitrobacteria, lactic acid bacteria, and bifidobacterial, are beneficial to the skin (Gao et al., 2023). Staphylococcus aureus has been shown to colonize significantly more skin surfaces in AD patients (Geoghegan et al., 2018). However, there is still insufficient data to characterize the pathogenesis and therapeutic approach of AD through gut microorganisms. This is particularly true for in-depth studies of flora-metabolite interactions, as well as metabolite-host interactions.
This study used mice to establish the AD model, aiming to investigate the changes of intestinal microenvironment (flora and metabolites) occurring in AD mice by 16 s rRNA gene sequencing and metabolomics technology. Then, the relationship between bacteria-metabolite interactions and ameliorative or pathogenic effects on AD was explore. It provided a basis for the in-depth study of AD pathogenesis and the development of therapeutic drug targets.
2 Materials and methods
2.1 Reagents and chemicals
The standard feed was obtained from Liaoning Changsheng Biotechnology Co., Ltd. (Shenyang, China). 2,4-Dinitrofluorobenzene (DNFB) was obtained from Shanghai Macklin Biochemical Technology Co., Ltd. (Shanghai, China). The bicinchoninic acid protein assay kit was obtained from Seven Biotech (Beijing, China). Absolute ethanol, methanol, chloroform, and isopropanol were obtained from Tianjin Kemiou Chemical Reagent Co. Ltd. (Tianjin, China). The primers used for RT-PCR were synthesized by Gene Pharma Company (Suzhou, China). Catalase (CAT), total superoxide dismutase (T-SOD), malondialdehyde (MDA), hydroxyproline (HYP) and hyaluronic acid (HA) detection kits were obtained from the Nanjing Jiancheng Institute of Biotechnology (Nanjing, China). Enzyme-linked immunoassays for collagen type I (COL-1) and ceramide (CER) detection kits were obtained from Jiangsu Meibiao Biotechnology Co., Ltd. (Nanjing, China). Horseradish peroxidase-conjugated goat anti-rabbit antibody was obtained from Proteintech Group, Inc. (Wuhan, China). The aquaporin 3 (AQP3) antibody was obtained from Affinity Biosciences (Jiangsu, China). Anti-filaggrin (FLG) antibody was purchased from GeneTex (USA).
2.2 Animals and ethical approval
Male C57BL/6J mice weighing 18–22 g (8 weeks old) were procured from Chang-Sheng Biotechnology Co., Ltd. (Shenyang, China). All experimental procedures adhered strictly to the PR China Legislation Regarding the Use and Care of Laboratory Animals, and all animal tests were approved by the Animal Care and Use Committee of Dalian Medical University (SYXK (Liao) 2018-0007). The mice were housed at a temperature of 22 ± 3°C with a humidity level of 55 ± 10%. They were allowed free movement throughout the experiment and maintained on a 12-h light–dark cycle to ensure access to adequate feed, fresh drinking water, and a clean environment.
2.3 DNFB-induced AD in mice
The mice were randomly divided into Control and Model groups with eight mice in each group. DNFB was dissolved in the solvent of acetone: olive oil = 4: 1. The back of the neck of the mice was first shaved over an area of approximately 2 × 2 cm. On days 1, 3, 7, 11, 16, 21, 28, and 30, the mice in Model group were treated by 50 μL of 0.5% DNFB solution to the shaved area using a pipette gun, which was applied evenly with the outer wall of the sterile gun tip, and the animals in Control group was coated with the same volume of blank solvent (Liang et al., 2023). Three days before the mice were executed, fecal samples were collected continuously. Fecal sample collection was performed in an ultra-clean bench. This was done by grasping the mice and gently massaging the abdomen to stimulate defecation, which was collected into sterile cryopreservation tubes and then snap-frozen in liquid nitrogen for 5 min before transferring them to a −80°C freezer. For serum samples, 1.5 mL sterile centrifuge tubes were used to collect venous blood from the eyes of mice, which was left to stand for half an hour, then centrifuged at 3500 r/min for 5 min, and the supernatant was aspirated into new 1.5 mL sterile centrifuge tubes, which were dispensed and transferred to a −80°C refrigerator. Skin tissue samples were collected from the drugged area using sterilized surgical instruments, placed in 2 mL sterile centrifuge tubes, and transferred to a −80°C refrigerator.
2.4 Measurement of biochemical indicators
The levels of T-SOD (superoxide dismutase assay kit, JianCheng, Nanjing, China), MDA (malondialdehyde assay kit, JianCheng, Nanjing, China), CAT (CATalase assay kit, JianCheng, Nanjing, China) in serum and the levels of HYP (hydroxyproline assay kit), COL-1 (human collagen type I ELISA commercial kit, Meibiao, Nanjing, China), CE (mouse ceramide ELISA commercial kit, Meibiao, Nanjing, China), and HA (hyaluronic acid assay kit, JianCheng, Nanjing, China) in the skin tissue of mice were detected using commercial kits according to the manufacturer’s instructions.
2.5 Histopathological testing
Skin tissues were fixed in 10% formalin and stained with hematoxylin and eosin, Masson’s trichrome, and toluidine blue. Stained sections were observed under a light microscope (Nikon Eclipse E100, Tokyo, Japan) at 200× magnification.
2.6 Immunofluorescence assay
Paraffin sections of skin tissues were deparaffinized, treated with ethanol and phosphate-buffered saline (PBS), boiled in an antigen repair solution, washed with PBS, incubated in a wet box for 1 h, and then incubated with antibodies at 4°C for 12 h. Samples were rinsed with PBS, incubated with fluorescein-labeled secondary antibodies, stained with DAPI, and imaged using an upright fluorescence microscope (Nikon Eclipse C1, Japan).
2.7 RT-PCR assay
RNA samples were extracted from mouse skin, and cDNA was synthesized from total RNA using the EasyScript All-in-One First Strand cDNA Synthesis SuperMix kit. mRNA levels were quantified using the Bio-Rad CFX Maestro system with glyceraldehyde-3-phosphate dehydrogenase for normalization, and the 2−△△Ct method was used for analysis.
2.8 Western blot assay
Skin tissue lysates were prepared, and protein concentrations were determined using a bicinchoninic acid kit. Samples were mixed with 6 × loading buffer, heated at 95°C for 5 min, separated using sodium dodecyl sulfate-polyacrylamide gel electrophoresis gel, transferred onto polyvinylidene fluoride membranes, blocked with blocking solution for 2 h, incubated with primary antibodies overnight at 4°C, incubated with secondary antibodies for 2 h at 4°C, and visualized using an enhanced chemiluminescence reagent on the ChemiDoc™ XRS Imaging System (Bio-Rad Laboratories, USA).
2.9 16S rRNA gene sequencing of feces samples
The integrity of the extracted genomic DNA and the concentration and purity of fecal samples were assessed (MagAtrract PowerSoil Pro DNA kit, Qiagen, Germany). The purity of DNA was assessed by determining the ratio of 260 nm/280 nm (≈1.8) and the ratio of 260 nm/230 nm (NanoDrop One, Thermo Fisher Scientific, Waltham, USA). The extracted DNA served as the template for PCR amplification of the V3-V4 variable region of the 16S rRNA gene, utilizing the upstream primer 338F and the downstream primer 806R, which carried the barcode sequence (Liang et al., 2023). Subsequently, purified PCR products were prepared using the NEXTFLEX Rapid DNA-Seq Kit and sequenced on an Illumina PE300 platform.
Noise reduction of optimized sequences after QC splicing was performed using the DADA2 plugin in the Qiime2 process based on default parameters. Based on the Sliva 16S rRNA gene database (v 138), the ASVs were analyzed for species taxonomy using the Naive bayes (or Vsearch, or Blast) classifier in Qiime2. All data analyses were performed on the Majorbio Cloud platform.1
2.10 Untargeted metabolism assay of feces samples in mice by GC-TOF/MS
Fecal samples were extracted before GC-TOF/MS analysis (Tan et al., 2022). The supernatant was dried using nitrogen and added methoxypyridine hydrochloride solution at 37°C for 90 min. Subsequently, the N,O-bis(trimethylsilyl)trifluoroacetamide derivatization reagent containing 1% trimethylchlorosilane was added and reacted at 70°C for 60 min. The analysis was conducted using an Agilent 8890 B gas chromatography system coupled with an Agilent 5977 B mass-selective detector. The sample was separated using a DB-5MS capillary column (40 m × 0.25 mm × 0.25 μm, Agilent). After onboarding, the raw GC/MS data were processed by the MassHunter workstation Quantitative Analysis (v10.0.707.0) software to produce a three-dimensional CSV-formatted data matrix containing the sample information, metabolite names, and mass spectral response intensities. Internal standard peaks as well as any known false positives (including noise, column loss, and derivatization reagent peaks) were removed from the data matrix, de-redundant, and peaks were merged. The metabolites were also identified by searching public databases such as NIST (2017), Fiehn (2013), MS-DIAL (2021). All data analyses were performed on the Majorbio Cloud platform (see text footnote 1).
2.11 Untargeted metabolism assay of feces samples in mice by UPLC-MS/MS
The samples were obtained from mouse feces for analysis (Liu et al., 2023), which was conducted using a Thermo UHPLC-Q Exactive HF-X system (Thermo Fisher Scientific, USA) equipped with an ACQUITY HSS T3 column (100 mm × 2.1 mm i.d., 1.8 μm, Waters, USA). The mobile phase consisted of 0.1% formic acid in water: acetonitrile (95:5, v/v) as mobile phase A and 0.1% formic acid in acetonitrile: isopropanol: water (47.5:47.5:5, v/v/v) as mobile phase B. During positive detection, the gradient of mobile phase B was increased from 0 to 20% (0–3 min), 20 to 35% (3–4.5 min), and 35 to 100% (4.5–5 min), and maintained at 100% (5–6.3 min). Conversely, for negative detection, the gradient of mobile phase B was increased from 0 to 5% (0–1.5 min), 5 to 10% (1.5–2 min), 10 to 30% (2–4.5 min), and 30 to 100% (4.5–5 min). The flow rate was set at 0.4 mL/min, and the column temperature was maintained at 40°C.
After on-boarding, the UPLC-MS/MS raw data were imported into the metabolomics processing software Progenesis QI (Waters Corporation, Milford, USA) for baseline filtering, peak identification, integration, retention time correction, peak alignment, and finally a data matrix of retention time, mass-to-charge ratio, and peak intensity was obtained. At the same time, the MS mass spectrometry information was matched with the metabolic public databases, HMDB2 and Metlin3, as well as Majorbio’s own libraries, to obtain the metabolite information. All data analyses were performed on the Majorbio Cloud platform (see text footnote 1).
2.12 Targeted metabolomics profiling of feces samples using GC-TOF/MS assay
Targeted metabolomics was performed using GC-TOF/MS for absolute quantification of a total of 32 free fatty acids (Yi et al., 2022). The free fatty acids were converted to fatty acid methyl esters after derivatization to improve their volatility and thermal stability, which could be detected by gas chromatographic analysis. The samples were extracted using a mixture of isopropanol and n-hexane (2:3, v/v containing 0.2 mg/L internal standard). They were then homogenized at 40 Hz for 4 min, sonicated in ice water for 5 min, and centrifuged at 12,000 rpm/4°C for 15 min. The resulting supernatant was collected and dried under a nitrogen atmosphere. Subsequently, a solution of methanol and trimethylsilyl diazomethane (1:2, v/v) was added to the dried sample, which was then dried again. The sample was then redissolved in n-hexane and centrifuged at 12,000 rpm for 1 min. Finally, the supernatant underwent GC–MS analysis using a 7890B GC System and a 5977B Mass Spectrometer (both from Agilent, USA), with separation achieved on a DB-FastFAME capillary column (90 m × 250 μm × 0.25 μm).
2.13 Fecal microbiome transplantation in mice
Male C57BL/6J mice weighing 18–22 g (8 weeks old) were procured from Chang- Sheng Biotechnology Co., Ltd. (Shenyang, China). Fecal bacterial transplantation experiments were performed by dividing mice into donor and recipient groups. Recipient mice were treated with 200 μL of triple antibiotic consisting of vancomycin (0.5 mg/mL), ampicillin (1 mg/mL) and metronidazole (1 mg/mL) for three consecutive days before the experiment. Donor mice were divided into Control (n = 5) and Model (n = 5) groups. All mice in the recipient group were modeled with 0.5% DNFB to establish AD and randomly divided into Control + DNFB (n = 5) and Model + DNFB (n = 5) groups. Fresh mouse feces from Control and Model groups were then transplanted into the recipient animals every 2 days. Each time, 200 mg of feces from donor group was taken, dissolved into 2 mL of sterile saline and centrifuged at 3500 r/min for 5 min to produce the supernatant. Each time, 100 μL of supernatant was given to the recipient mice by gavage. At the end of the test, the serum and the kin tissues were collected and stored with the at −80°C.
2.14 Correlation analysis
Metabolites identified using non-targeted metabolomics and differential bacteria identified using 16S rRNA gene sequencing were analyzed to determine the correlations. Data analysis was performed using the Majorbio Cloud Platform (see text footnote 1).
2.15 Statistical analysis
Images were processed using Image J software (version 1.53). Statistical analyses were conducted using GraphPad Prism software (version 5.0; San Diego, CA, USA). Unpaired t-tests were used to compare two groups. Data are presented as mean ± standard deviation, and p-values less than 0.05 or 0.01 were considered statistically significant.
3 Results
3.1 AD mice showed elevated levels of inflammation, oxidative stress, and disrupted skin barrier
As shown in Figure 1A, the skin of mice in Model group exhibited bloating and thickening of the epidermal and dermal layers. The dermal-epidermal junction appeared flattened, with a few twisted, broken, and disordered collagen fiber bundles in the dermis. Additionally, there was an increase in the number of mast cells, indicating damage to the skin barrier. As shown in Figure 1B, the level of FLG in the skin tissue of Model mice was significantly decreased, whereas the AQP3 level was markedly elevated compared with that in Control group. As shown in Figure 1C, compared with Control group, the levels of T-SOD and CAT significantly decreased, and the MDA level markedly increased in Model mice. In Figure 1D, the levels of inflammatory factors, including interleukin (IL)-6, IL-1β, and tumor necrosis factor-alpha, were elevated in model mice, while the levels of HYP, HA, COI-1, and CER in the skin tissue were significantly decreased (Figure 1E).
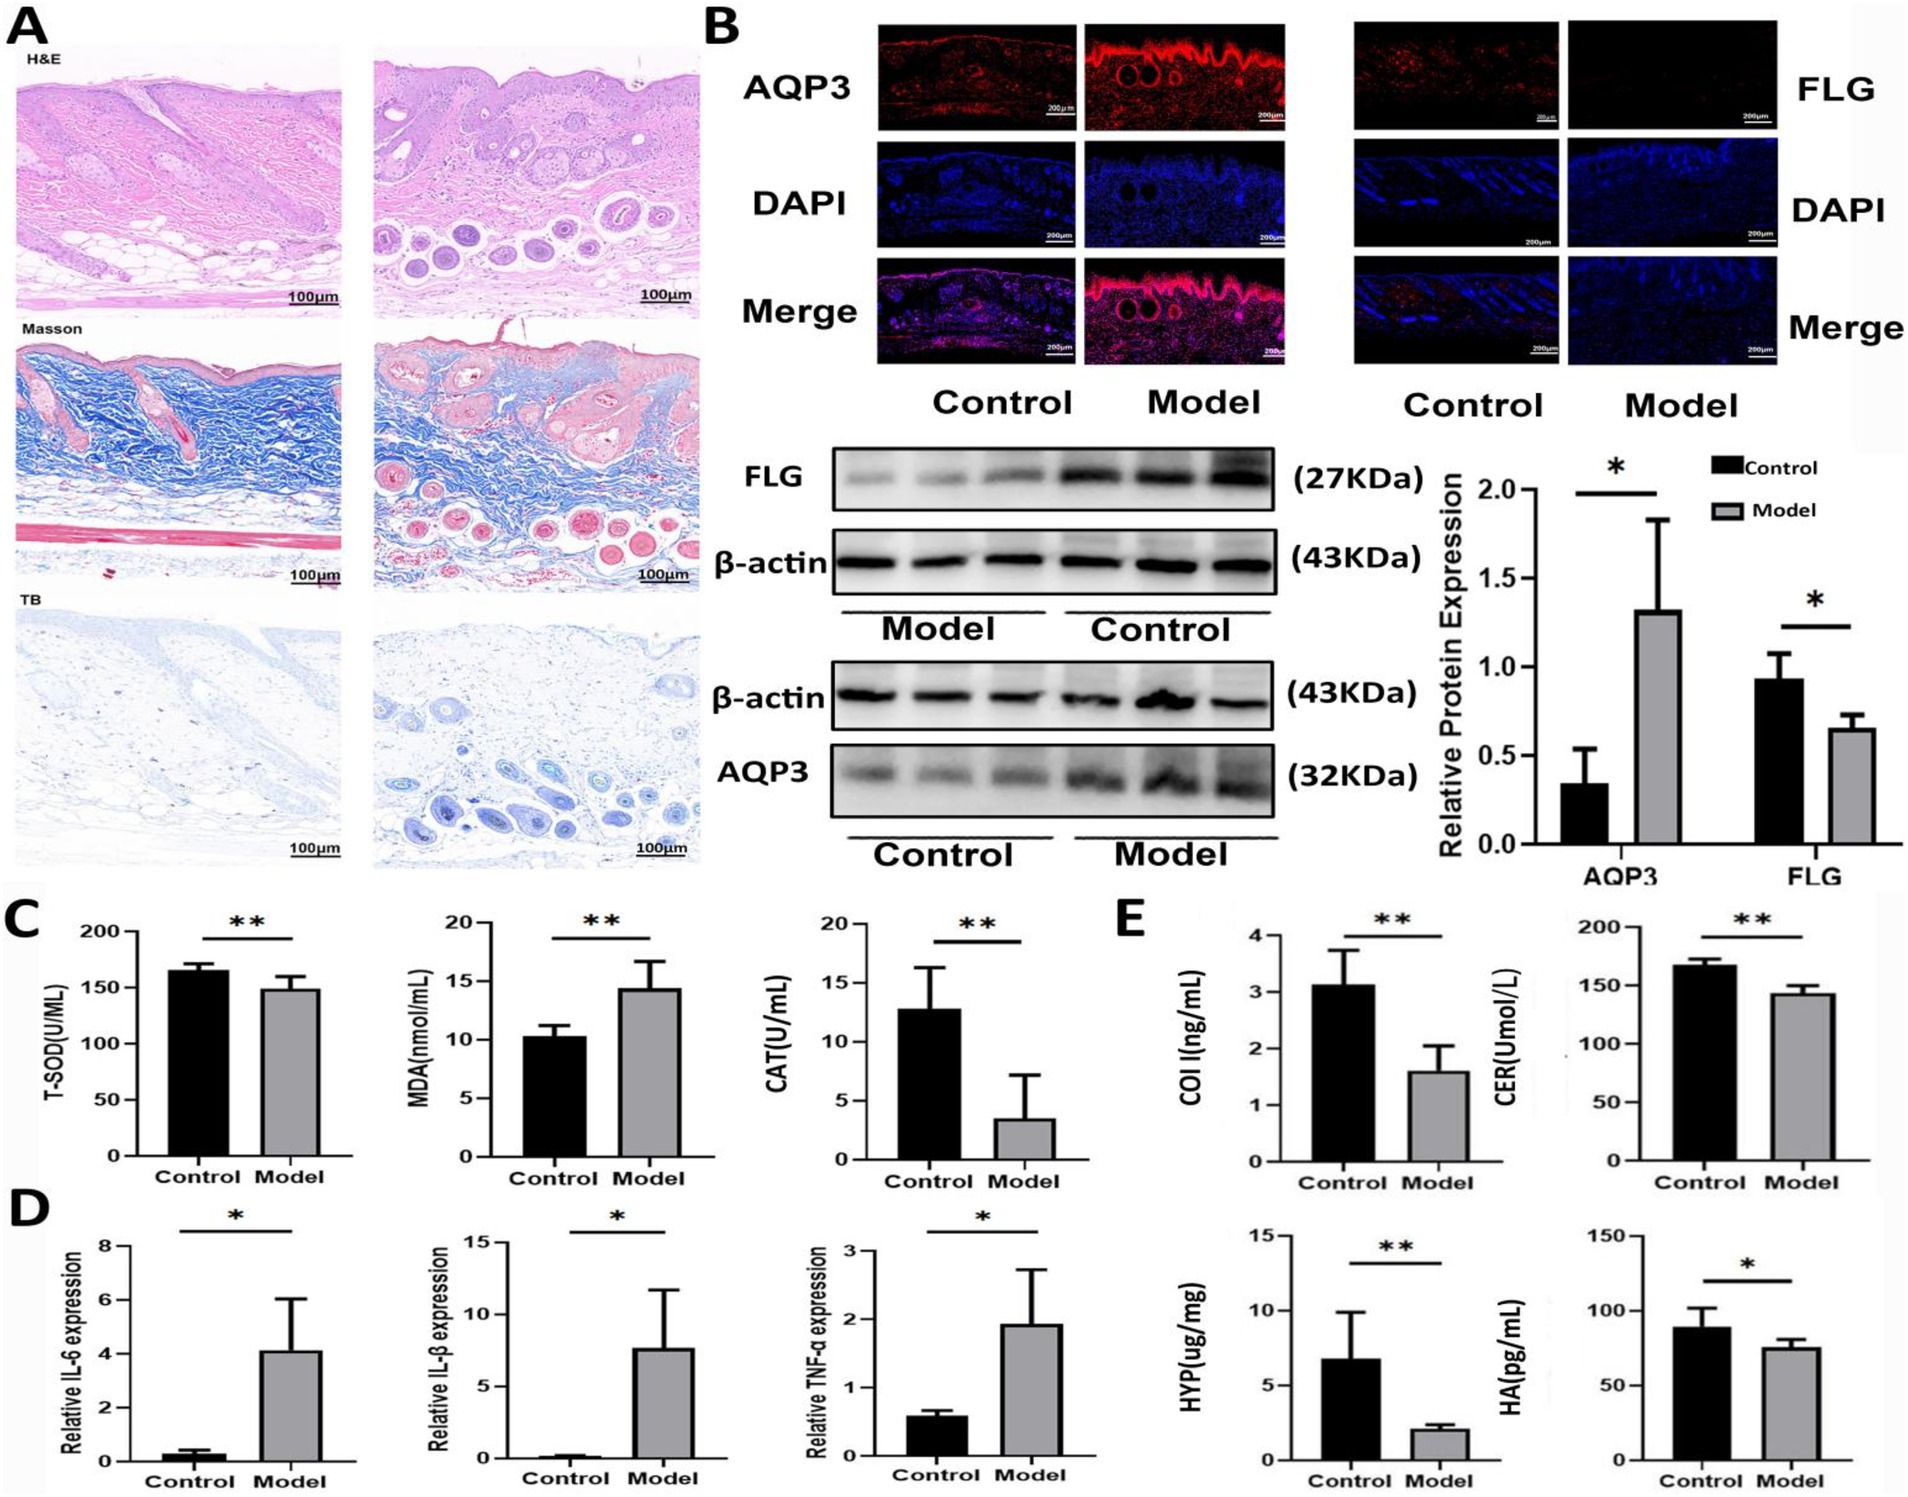
Figure 1. Establishment of an AD model in mice. (A) DNFB induced skin injury based on HE, Masson, and toluidine blue staining. (B) Expression levels of AQP3 and FLG in mice induced by DNFB based on western blot and immunofluorescence tests. Data are presented as the mean ± SD (n = 3). (C) The levels of T-SOD, MDA and CAT in mice induced by DNFB. Data are presented as the mean ± SD (n = 6). (D) The mRNA levels of IL-6, IL-1β and TNF-α in mice induced by DNFB. Data are presented as the mean ± SD (n = 3). (E) The levels of COL I, HA, CER and HYP in mice induced by DNFB. Data are presented as the mean ± SD (n = 6). *p < 0.05, **p < 0.01 compared with Model group.
3.2 Changes of the intestinal flora in AD mice
The results of 16 s rRNA gene sequencing are presented in Figure 2. The data in Figure 2A show information on the top 20 genera in terms of abundance at the genus level. Lactobacillus was the most abundant genus in both Control and Model groups. Figure 2B shows the Veen plot, where a total of 270 microorganisms were detected, and 117 were co-occurring in both Control and Model groups, and Figures 2C,D shows the Linear discriminant analysis Effect Size (LEfSe) analysis, which showed a greater predominance of Bifidobacterium and Ruminococcus in Control group compared to Model group. Figure 2E showed the statistical analysis of genus differences, with significantly higher abundance of Bifidobacterium and Ruminococcus in Control group compared to Model group.
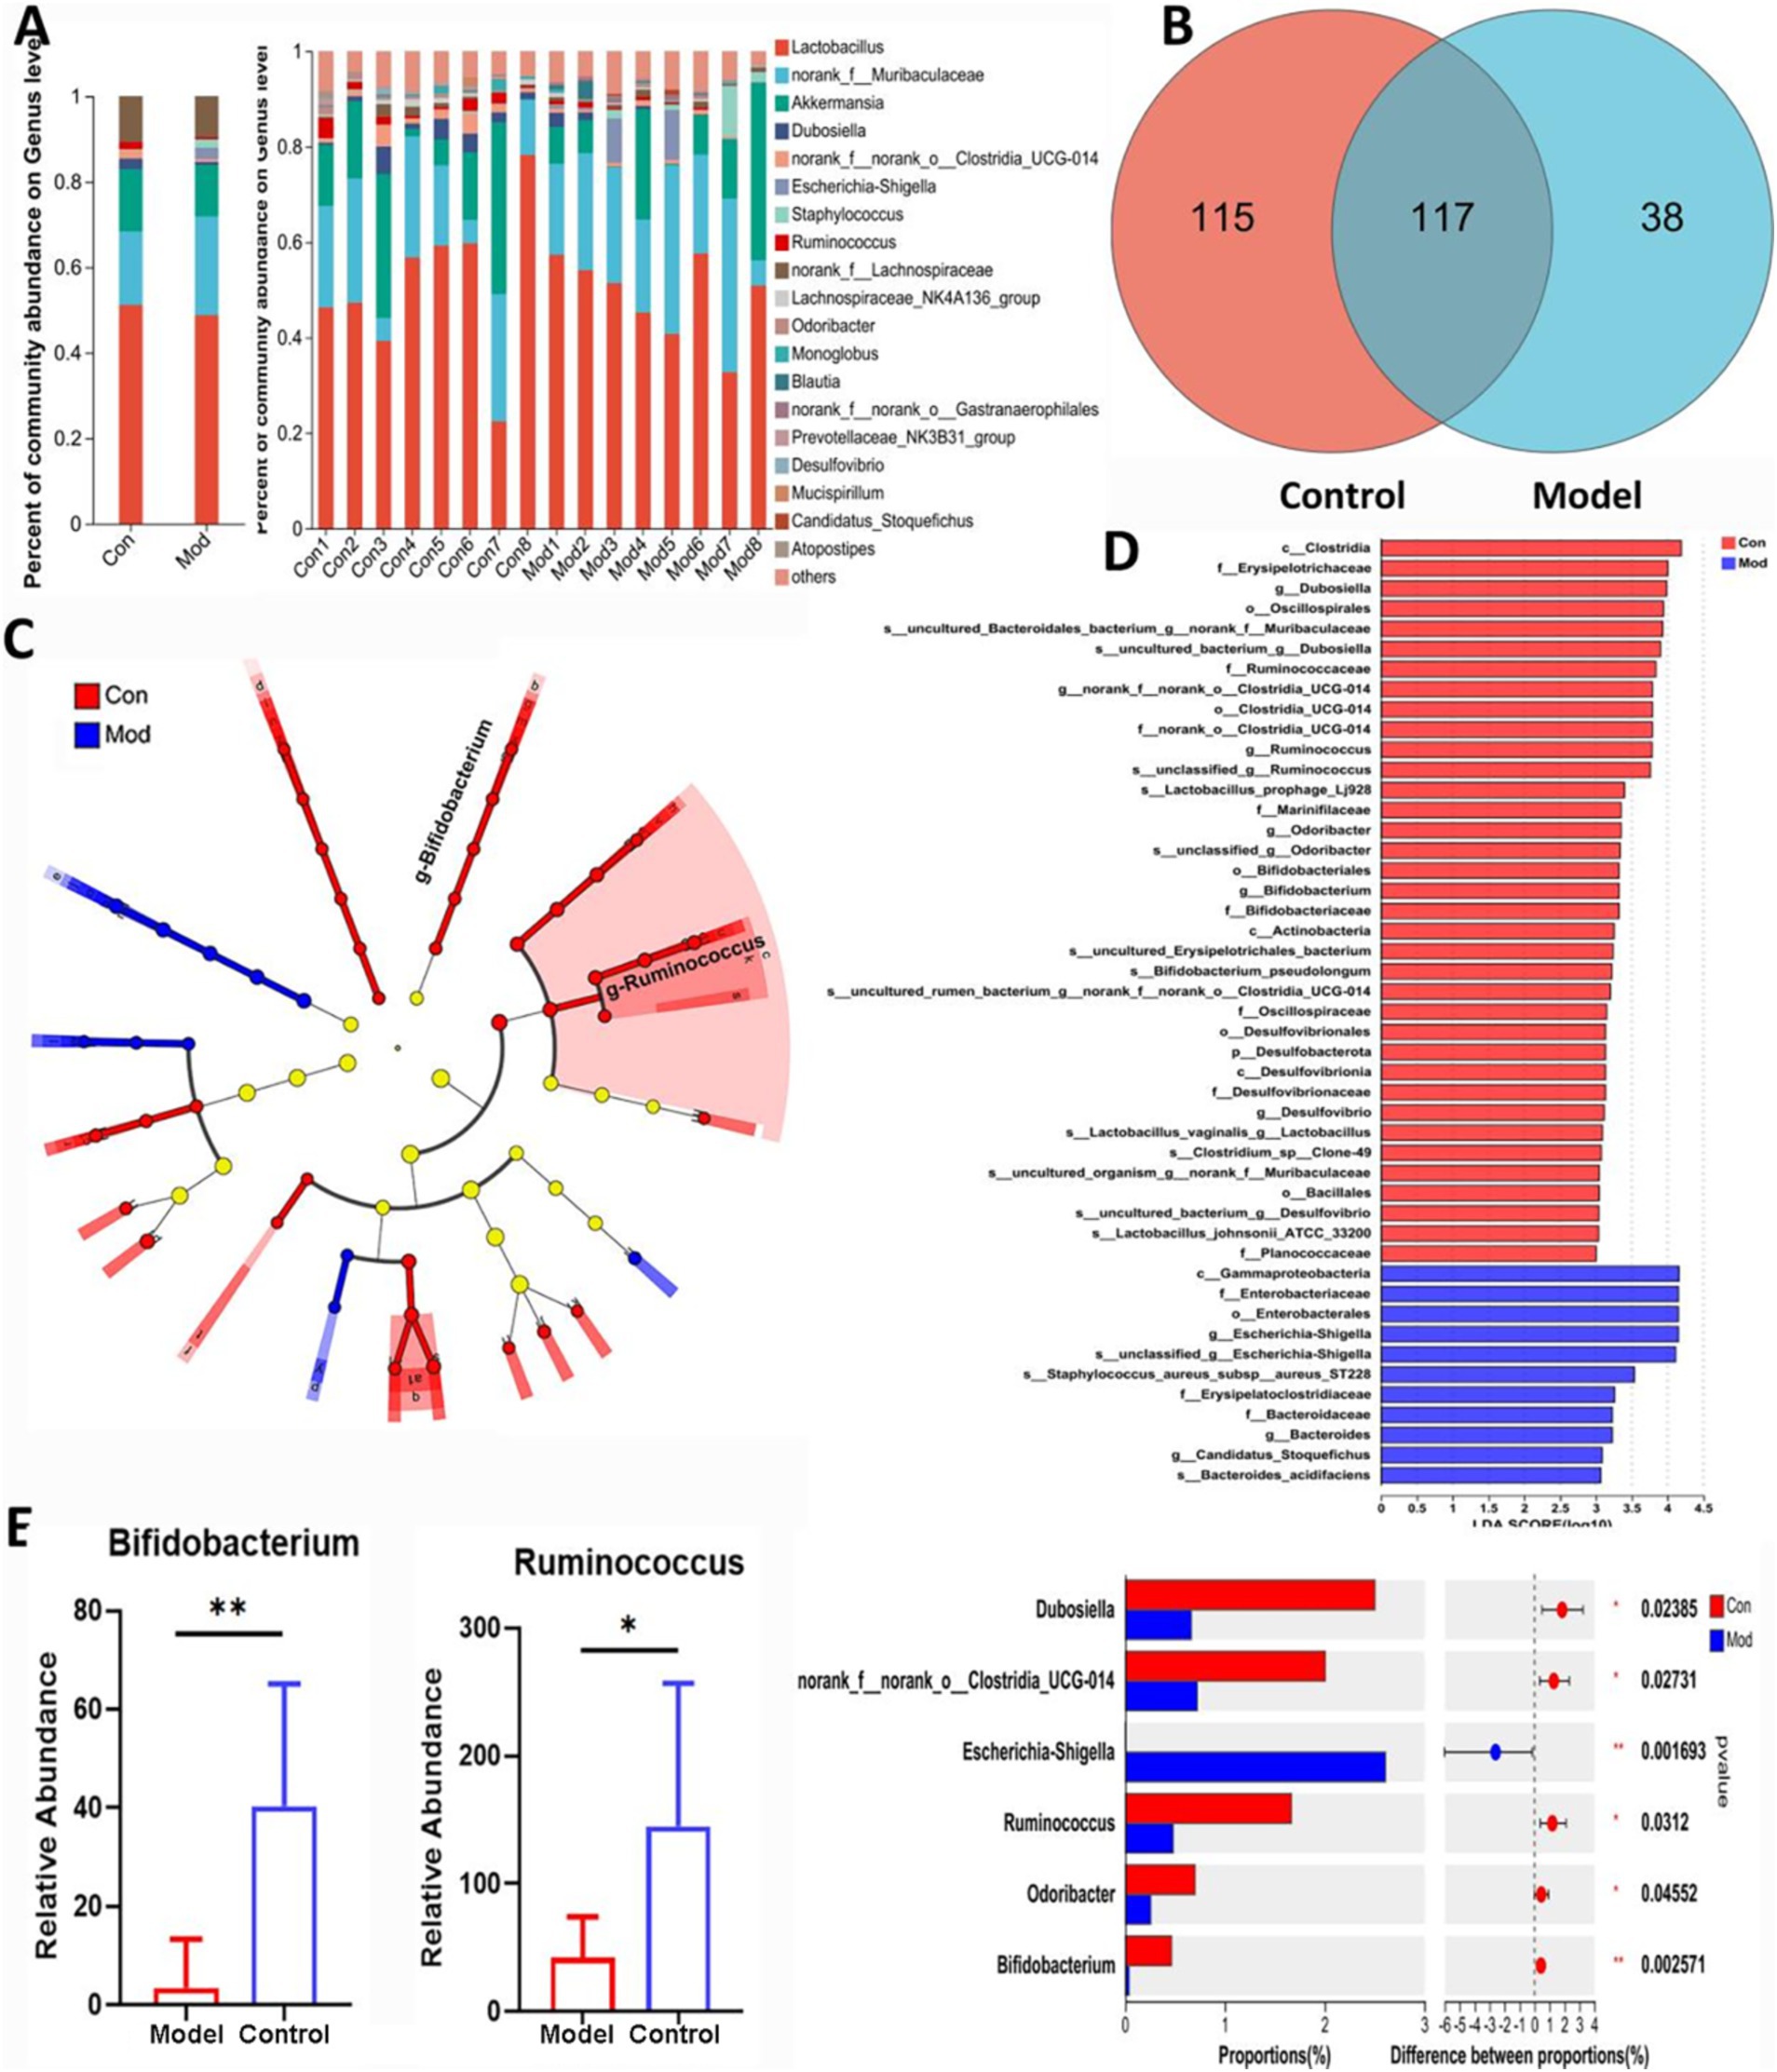
Figure 2. Gut microbiota composition in AD mice. (A) The microbial composition and relative abundance in Control and Model groups based on Community Barplot analysis. (B) Venn diagram illustrated the common and differential 270 microbiota among Control and Model groups. (C) Lefse assay showed the bacteria with greatly changes at different levels. (D) The differential flora marked in red or blue at the different levels in Control and Model groups, as well as the more differentiated bacteria at the genus level. (E) The bacteria involving the dominant species in Control and Model groups. Data are presented as the mean ± SD (n = 8).*p < 0.05, **p < 0.01 compared with Model group.
3.3 DNFB affected fecal metabolite levels in AD mice
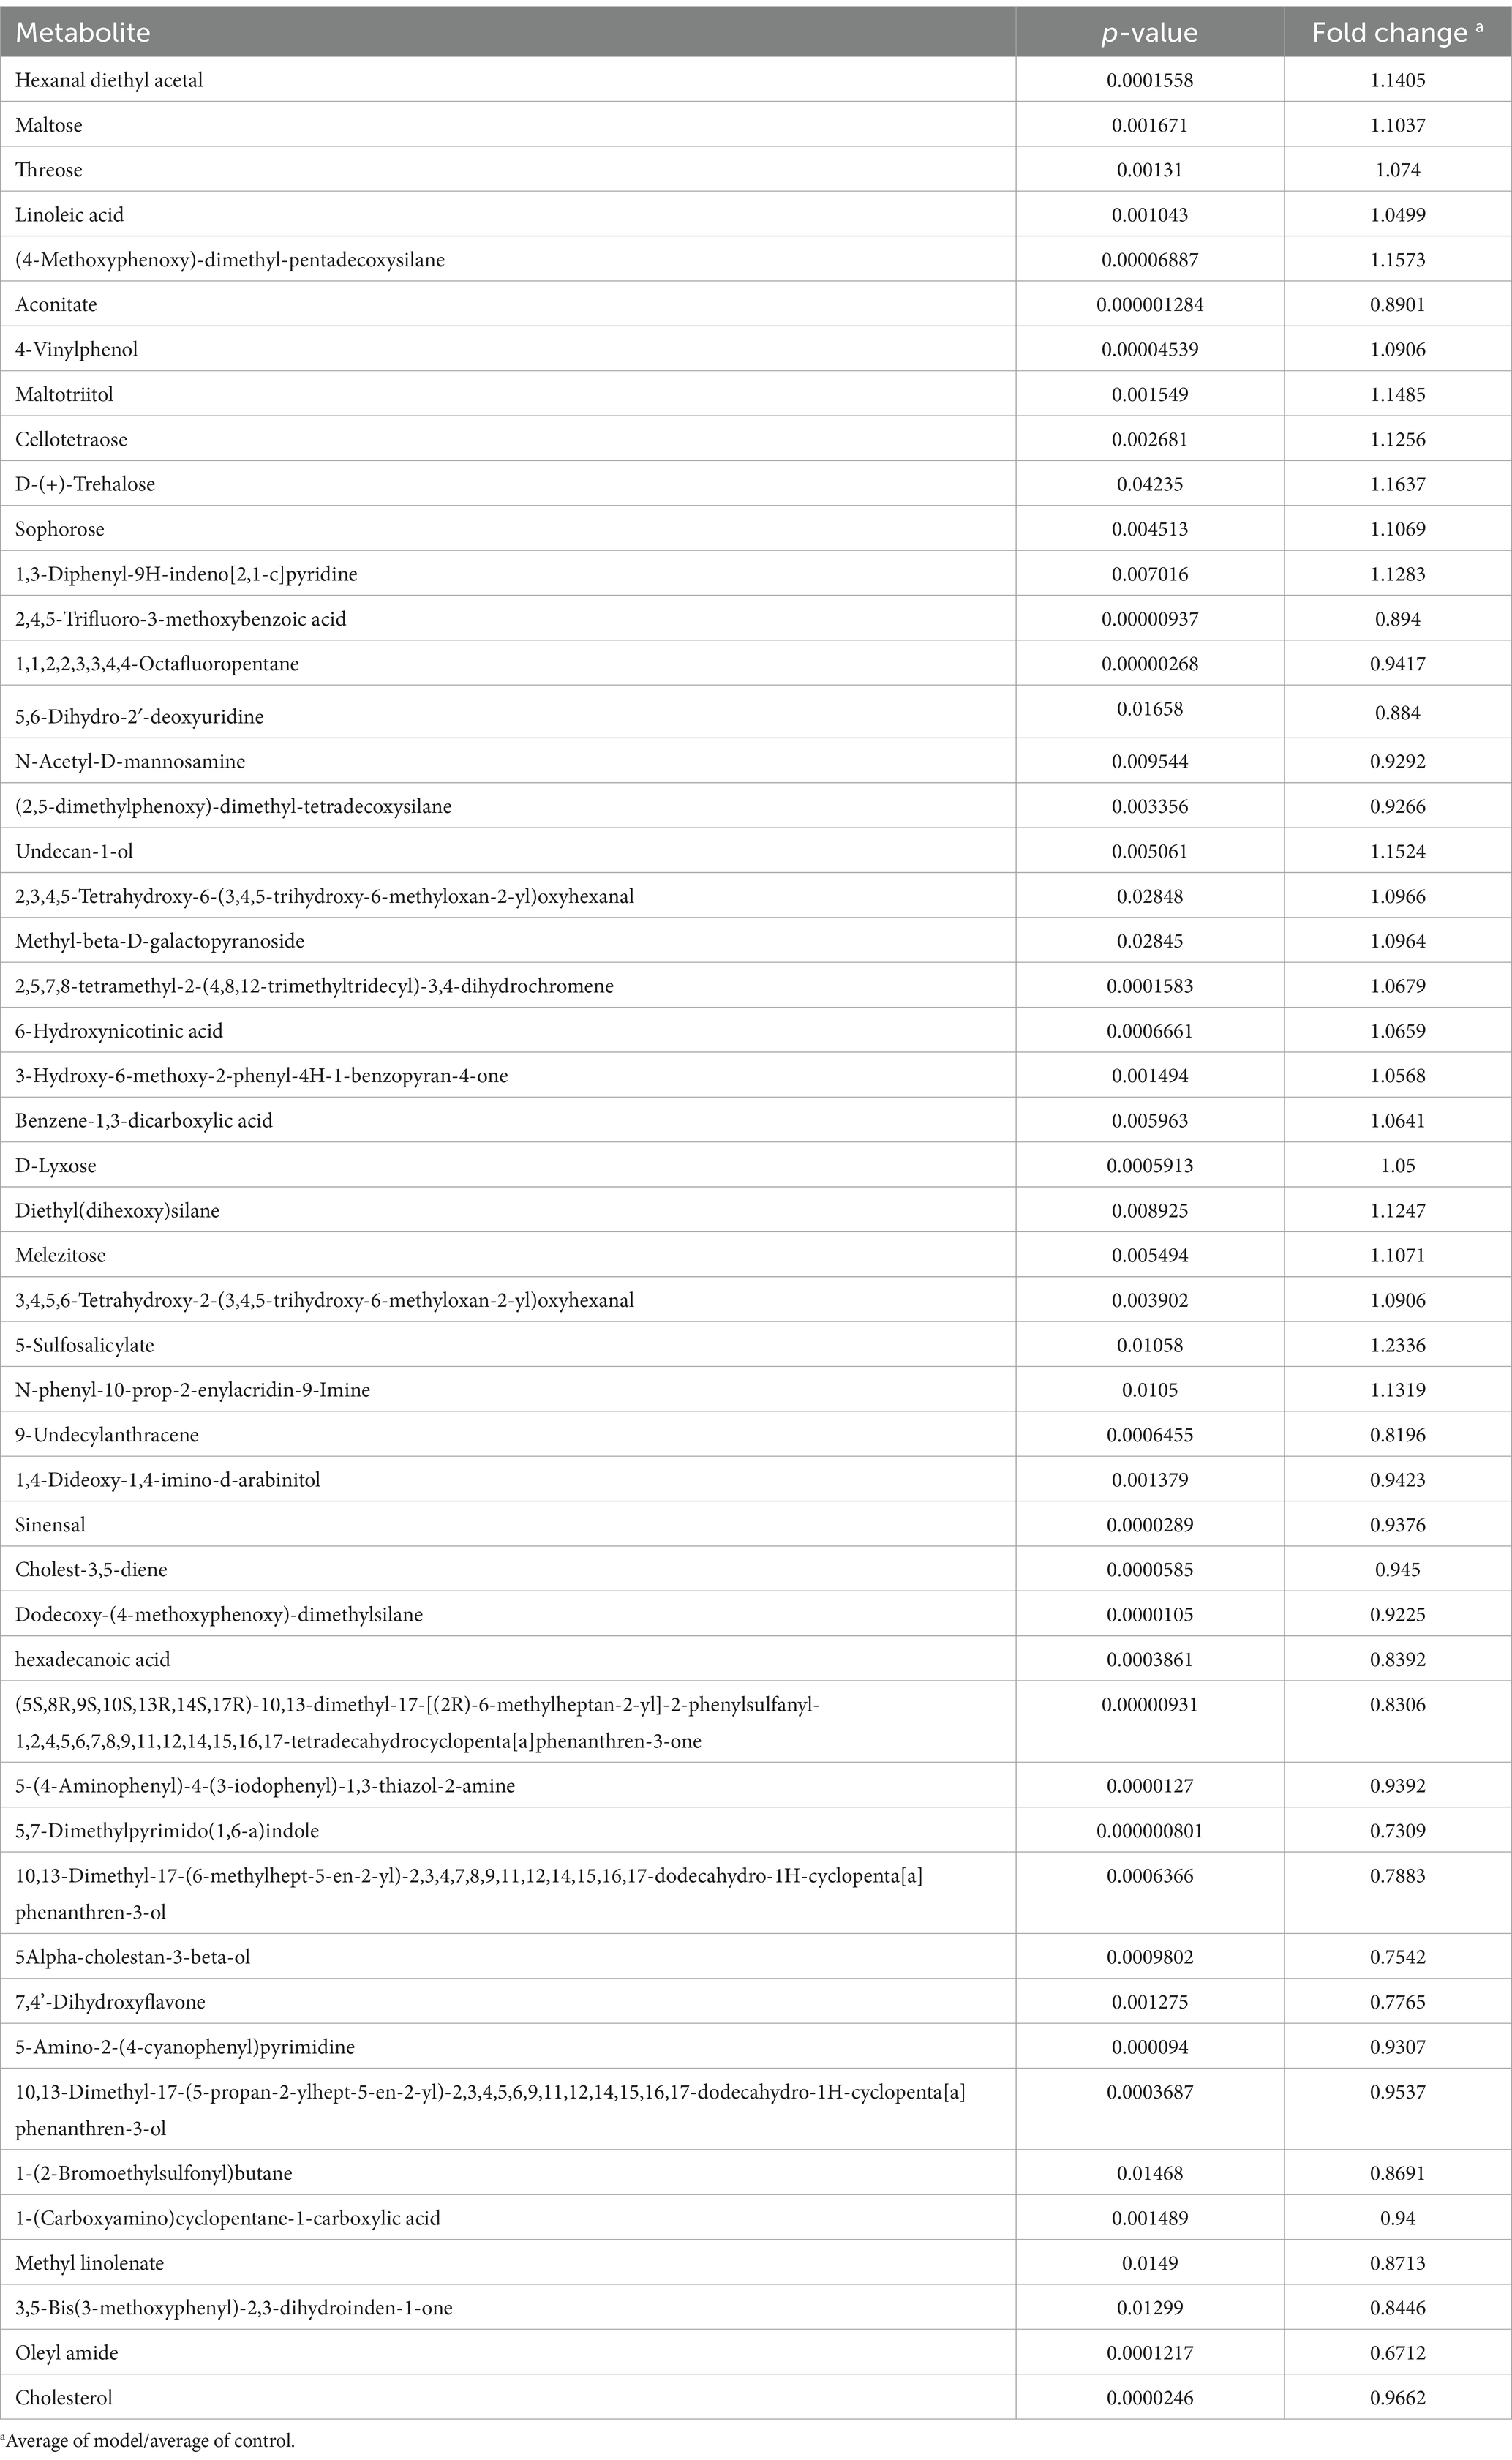
GC-TOF/MS detection identified 178 compounds in mouse feces. The differential metabolites are listed in Table 1. As shown in Figure 3A, principal component analysis (PCA) revealed significant differences in metabolite profiles between Control and Model groups. The Venn diagram in Figure 3B illustrates that 176 metabolites were common in both Control and Model groups. Figure 3C shows that fatty acid analogs and monosaccharides were the most abundant among the detected metabolites. The volcano map (Figure 3D) highlights 24 upregulated and 26 downregulated compounds compared with Control group (Log2FC < 1.5, p < 0.05). Figure 3E shows the cluster analysis, statistical analysis of variance, and KEGG pathway enrichment analysis of the differential metabolites. The metabolite levels of linoleic acid, maltose and threonine were significantly increased in the model group compared with the control group. In KEGG pathway enrichment, the differential metabolites in the control and model groups were mainly enriched in the pathways of linoleic acid metabolism, and metabolism of starch and sucrose.
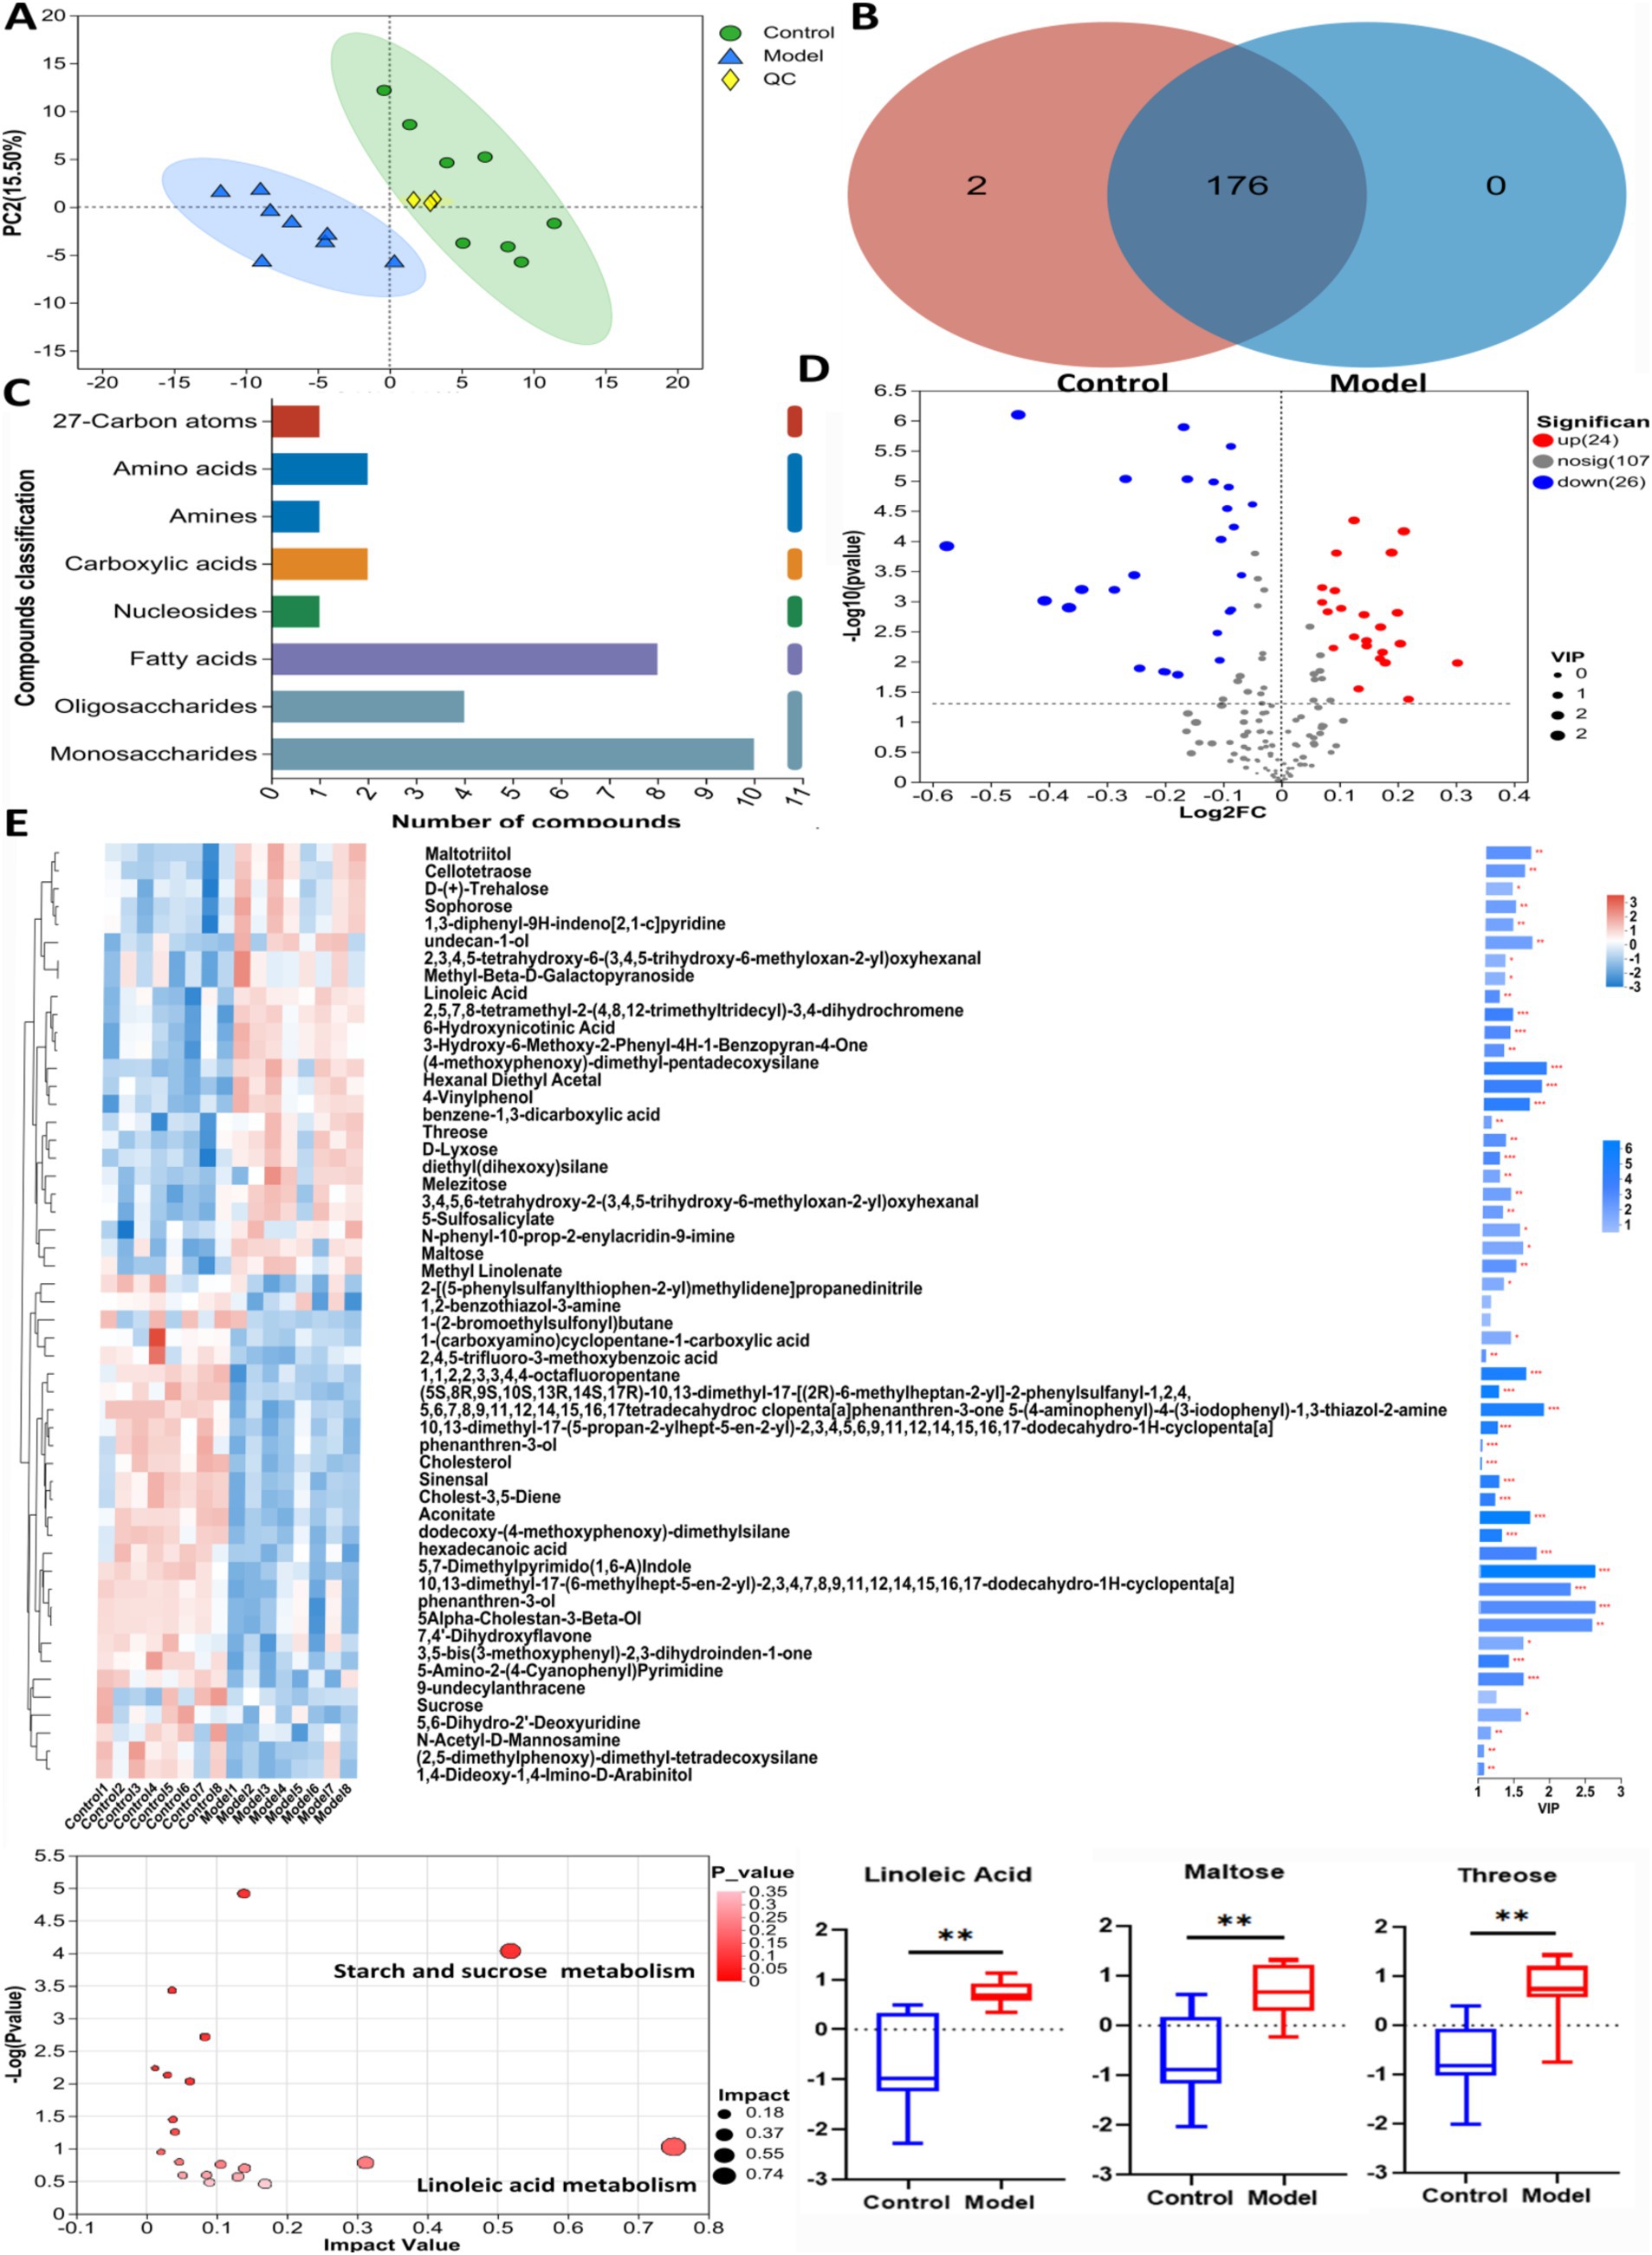
Figure 3. The untargeted metabolism of the feces in mice using GC/MS test. (A) The PCA plot showed a good separation of the samples in the two groups. (B) Venn diagram illustrated the common and differential 178 metabolites between the groups. (C) KEGG analysis showed the important pathways involved in the differential metabolites. (D) Volcano plot of the 50 differential metabolites between the groups. (E) Heatmap diagram showed the change trends of the differential metabolites, and the relative levels of the important metabolites and some pathways in Control and Model groups. Data are presented as the mean ± S. D (n = 8). **p < 0.01 compared with Model group.
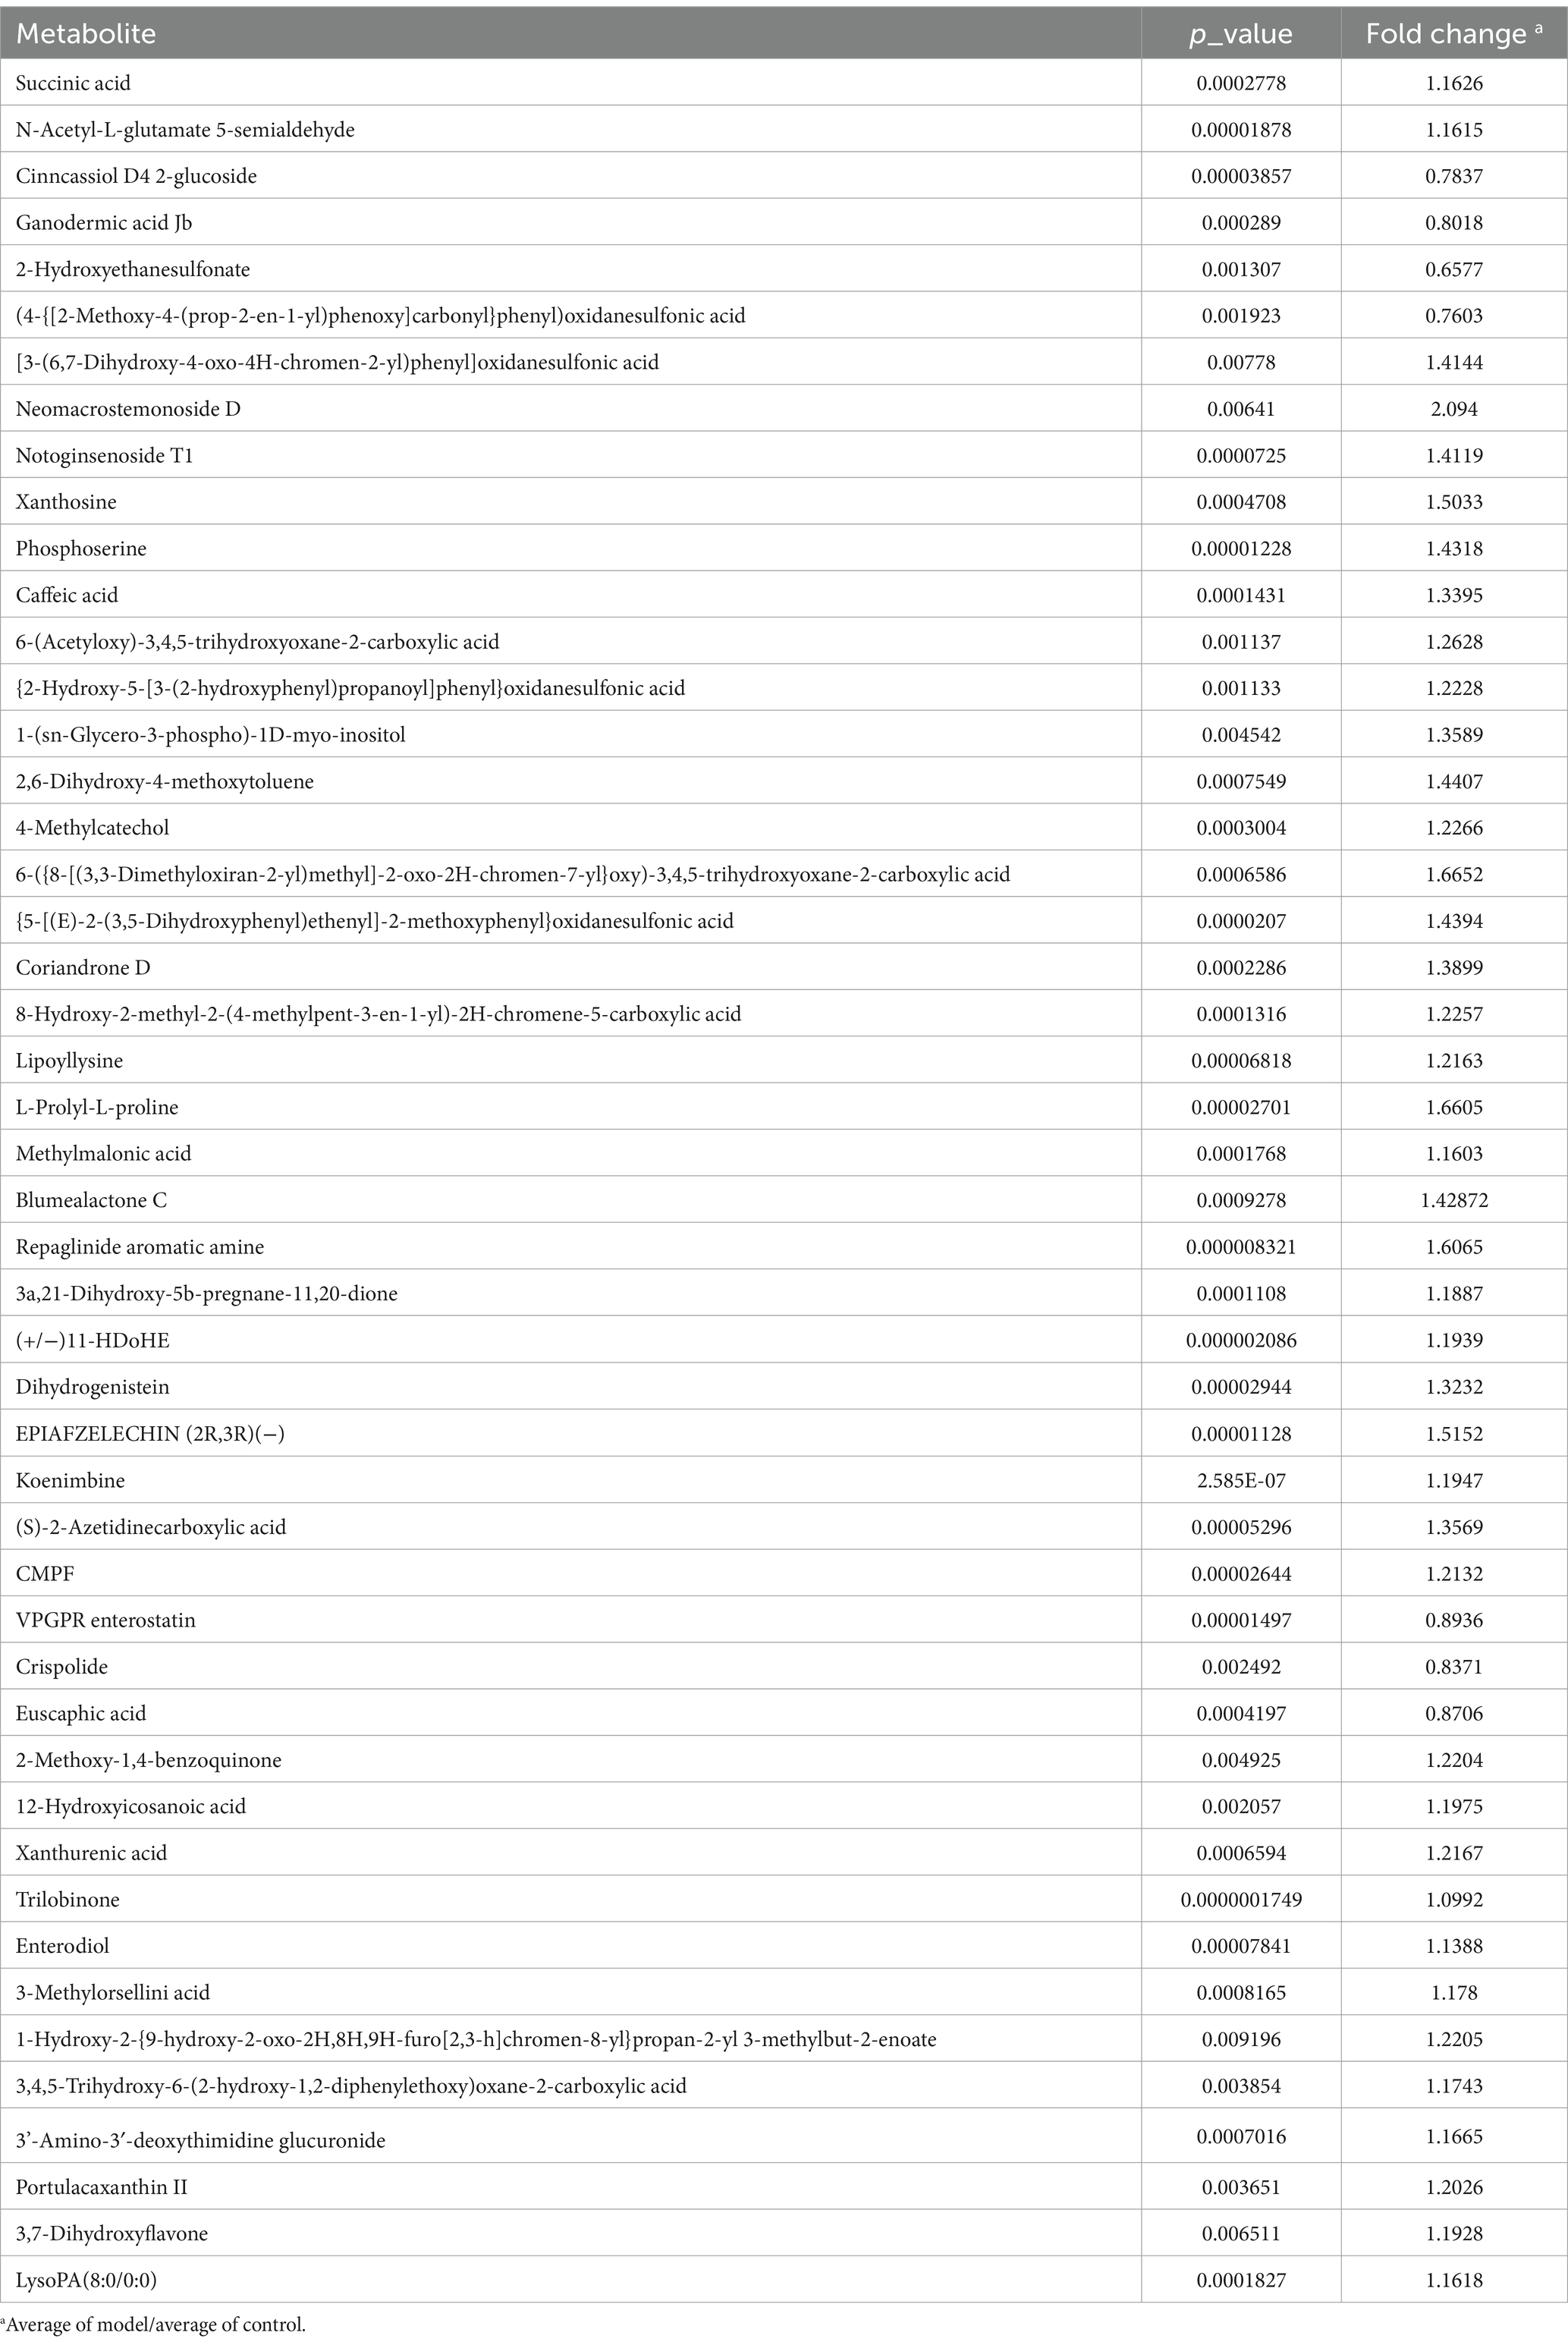
The metabolites in feces were determined using UPLC-MS/MS. In positive detection mode, 683 compounds were detected. In negative mode, 438 compounds were identified. Further details of other differential metabolites are listed in Tables 2, 3.
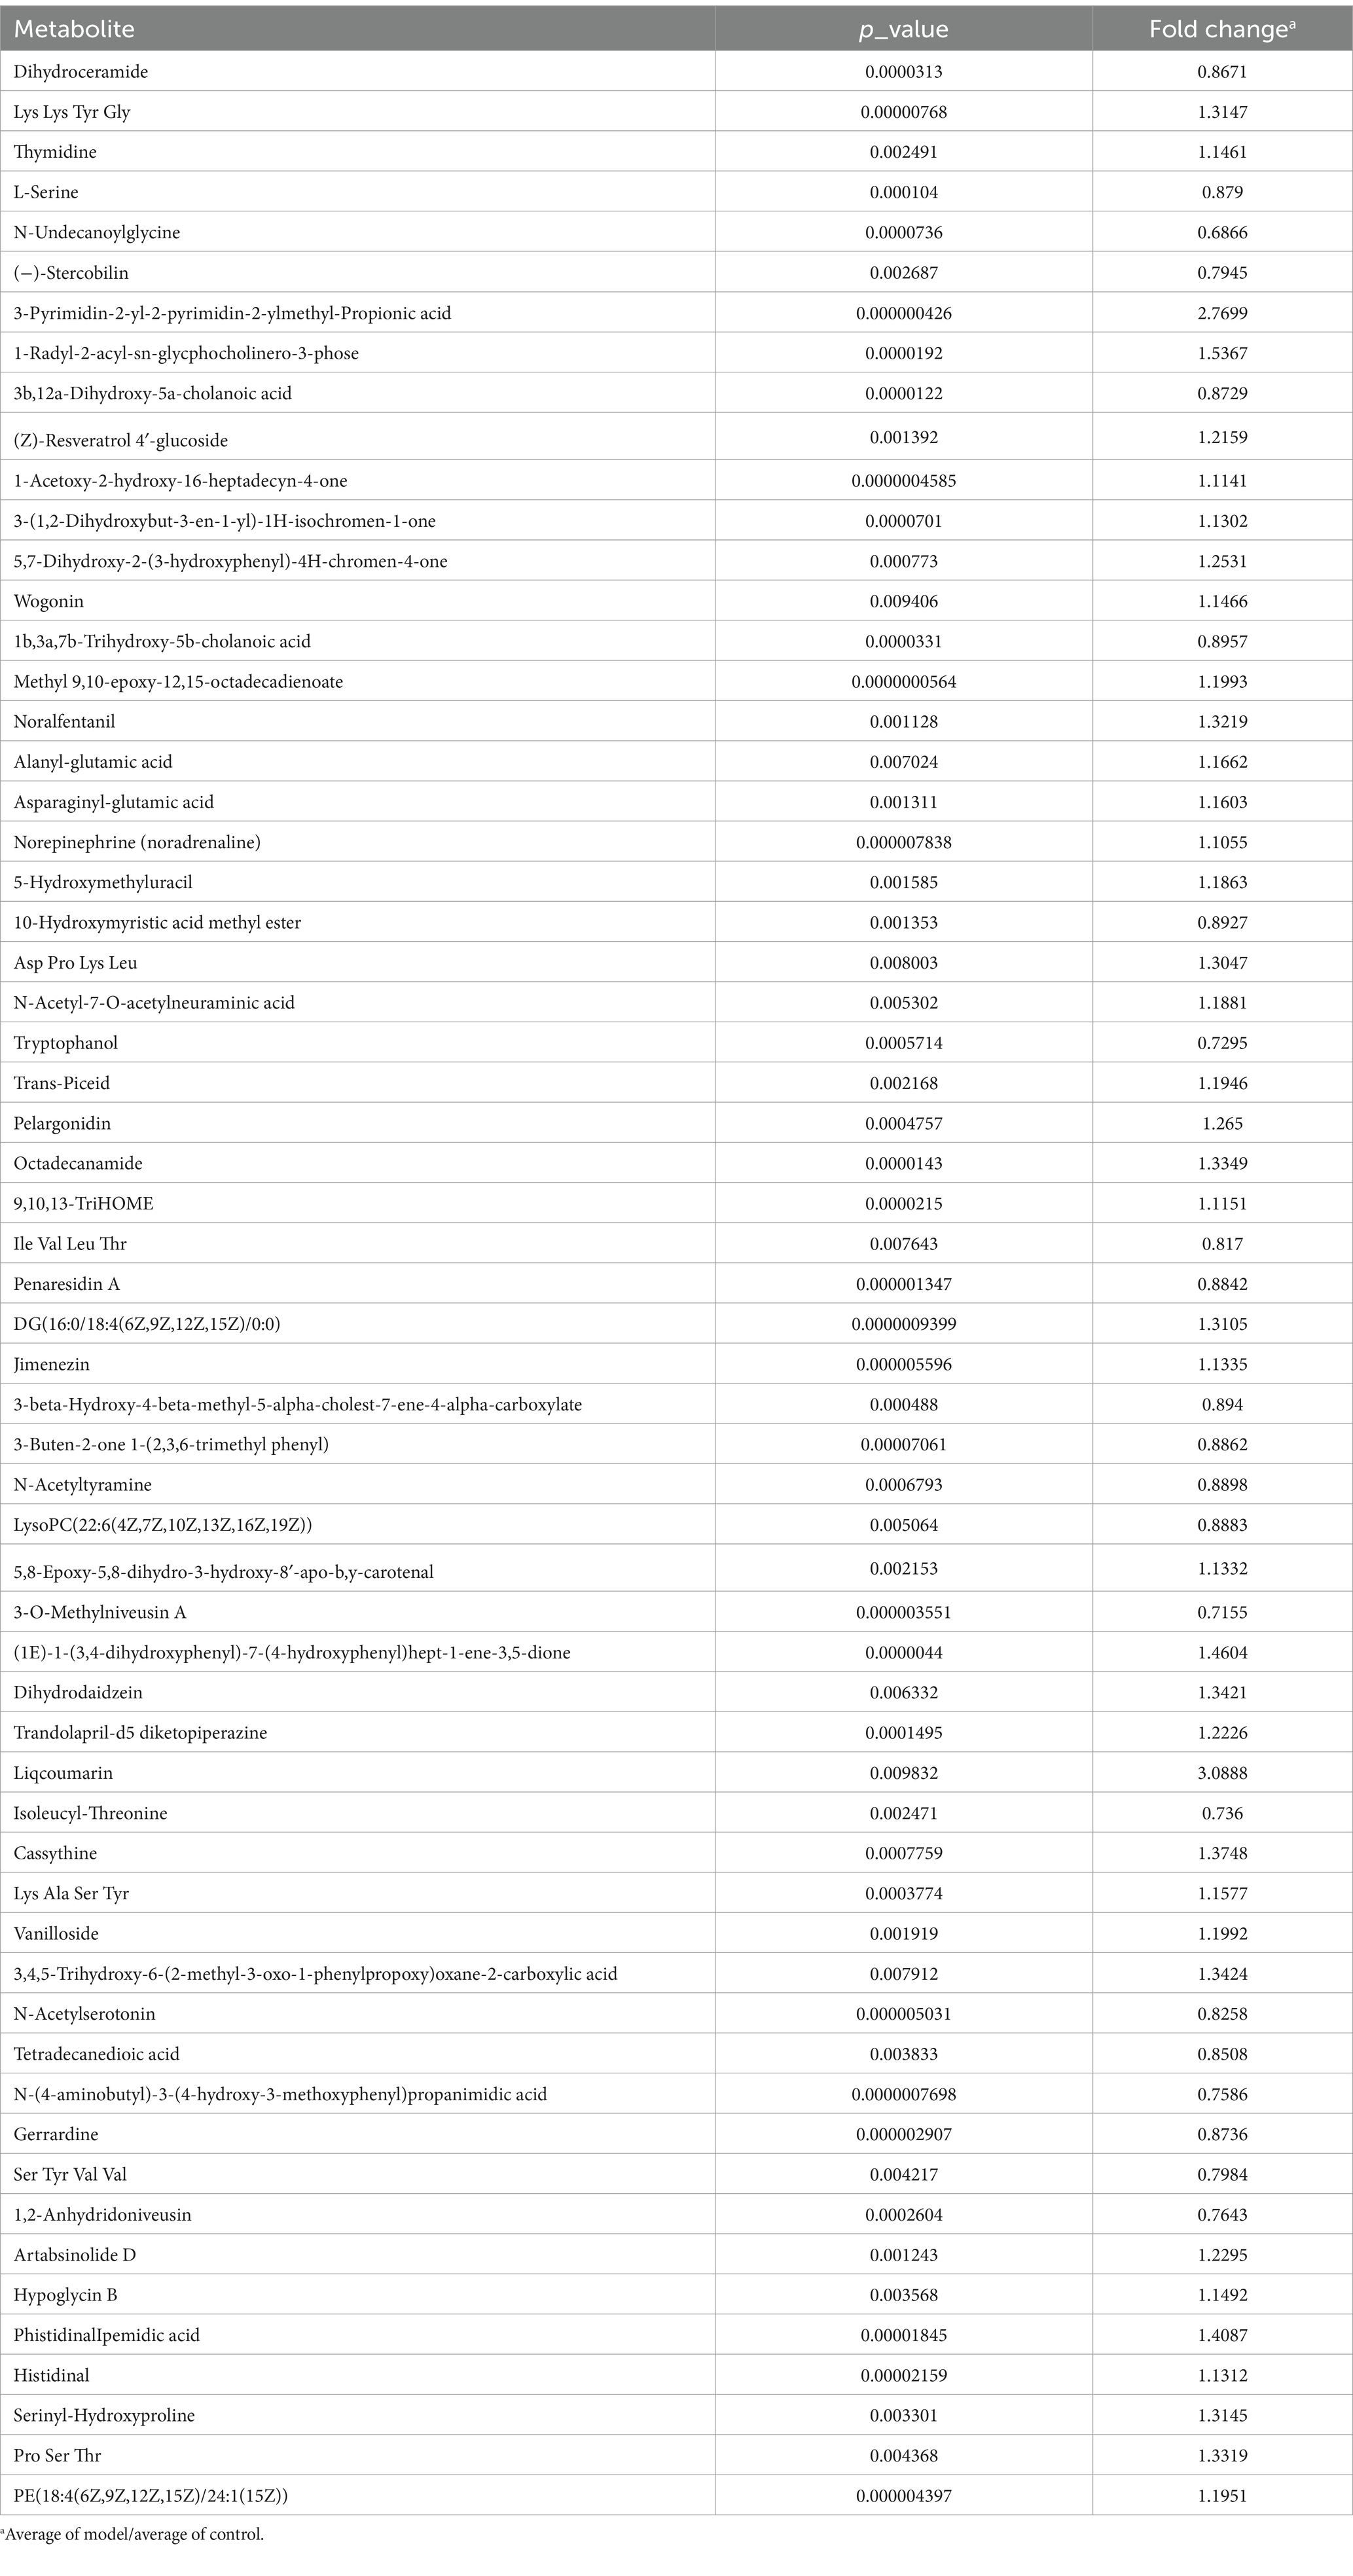
Table 2. The differential metabolites in untargeted metabolism under LC/MS test under positive detection.
Figure 4 showed the results of the positive detection pattern. In Figure 4A, the results of principal component analysis (PCA) showed a significant difference in metabolite levels between Control group and Model group. The results of the Venn diagram (Figure 4B) showed that 654 metabolites were co-existing between Control group and Model group. Figure 4C showed the categorization of the detected metabolites, with phospholipids, amino acid compounds and fatty acid compounds having the highest number of species. The volcano plot (Figure 4D) shows that 118 significantly up-regulated metabolites and 98 significantly down-regulated metabolites were found in Model group compared to Control group (Log2FC < 1.5, p < 0.05). Figure 4E showed the cluster analysis, statistical analysis and KEGG pathway enrichment analysis of the differential metabolites. L-serine, dihydroceramide levels were significantly increased and thymidine level was significantly decreased in Model mice compared with Control group. The results of pathway enrichment showed that pyrimidine metabolism, sphingolipid metabolism, and betaine biosynthesis were the major metabolic pathways enriched for differential metabolites.
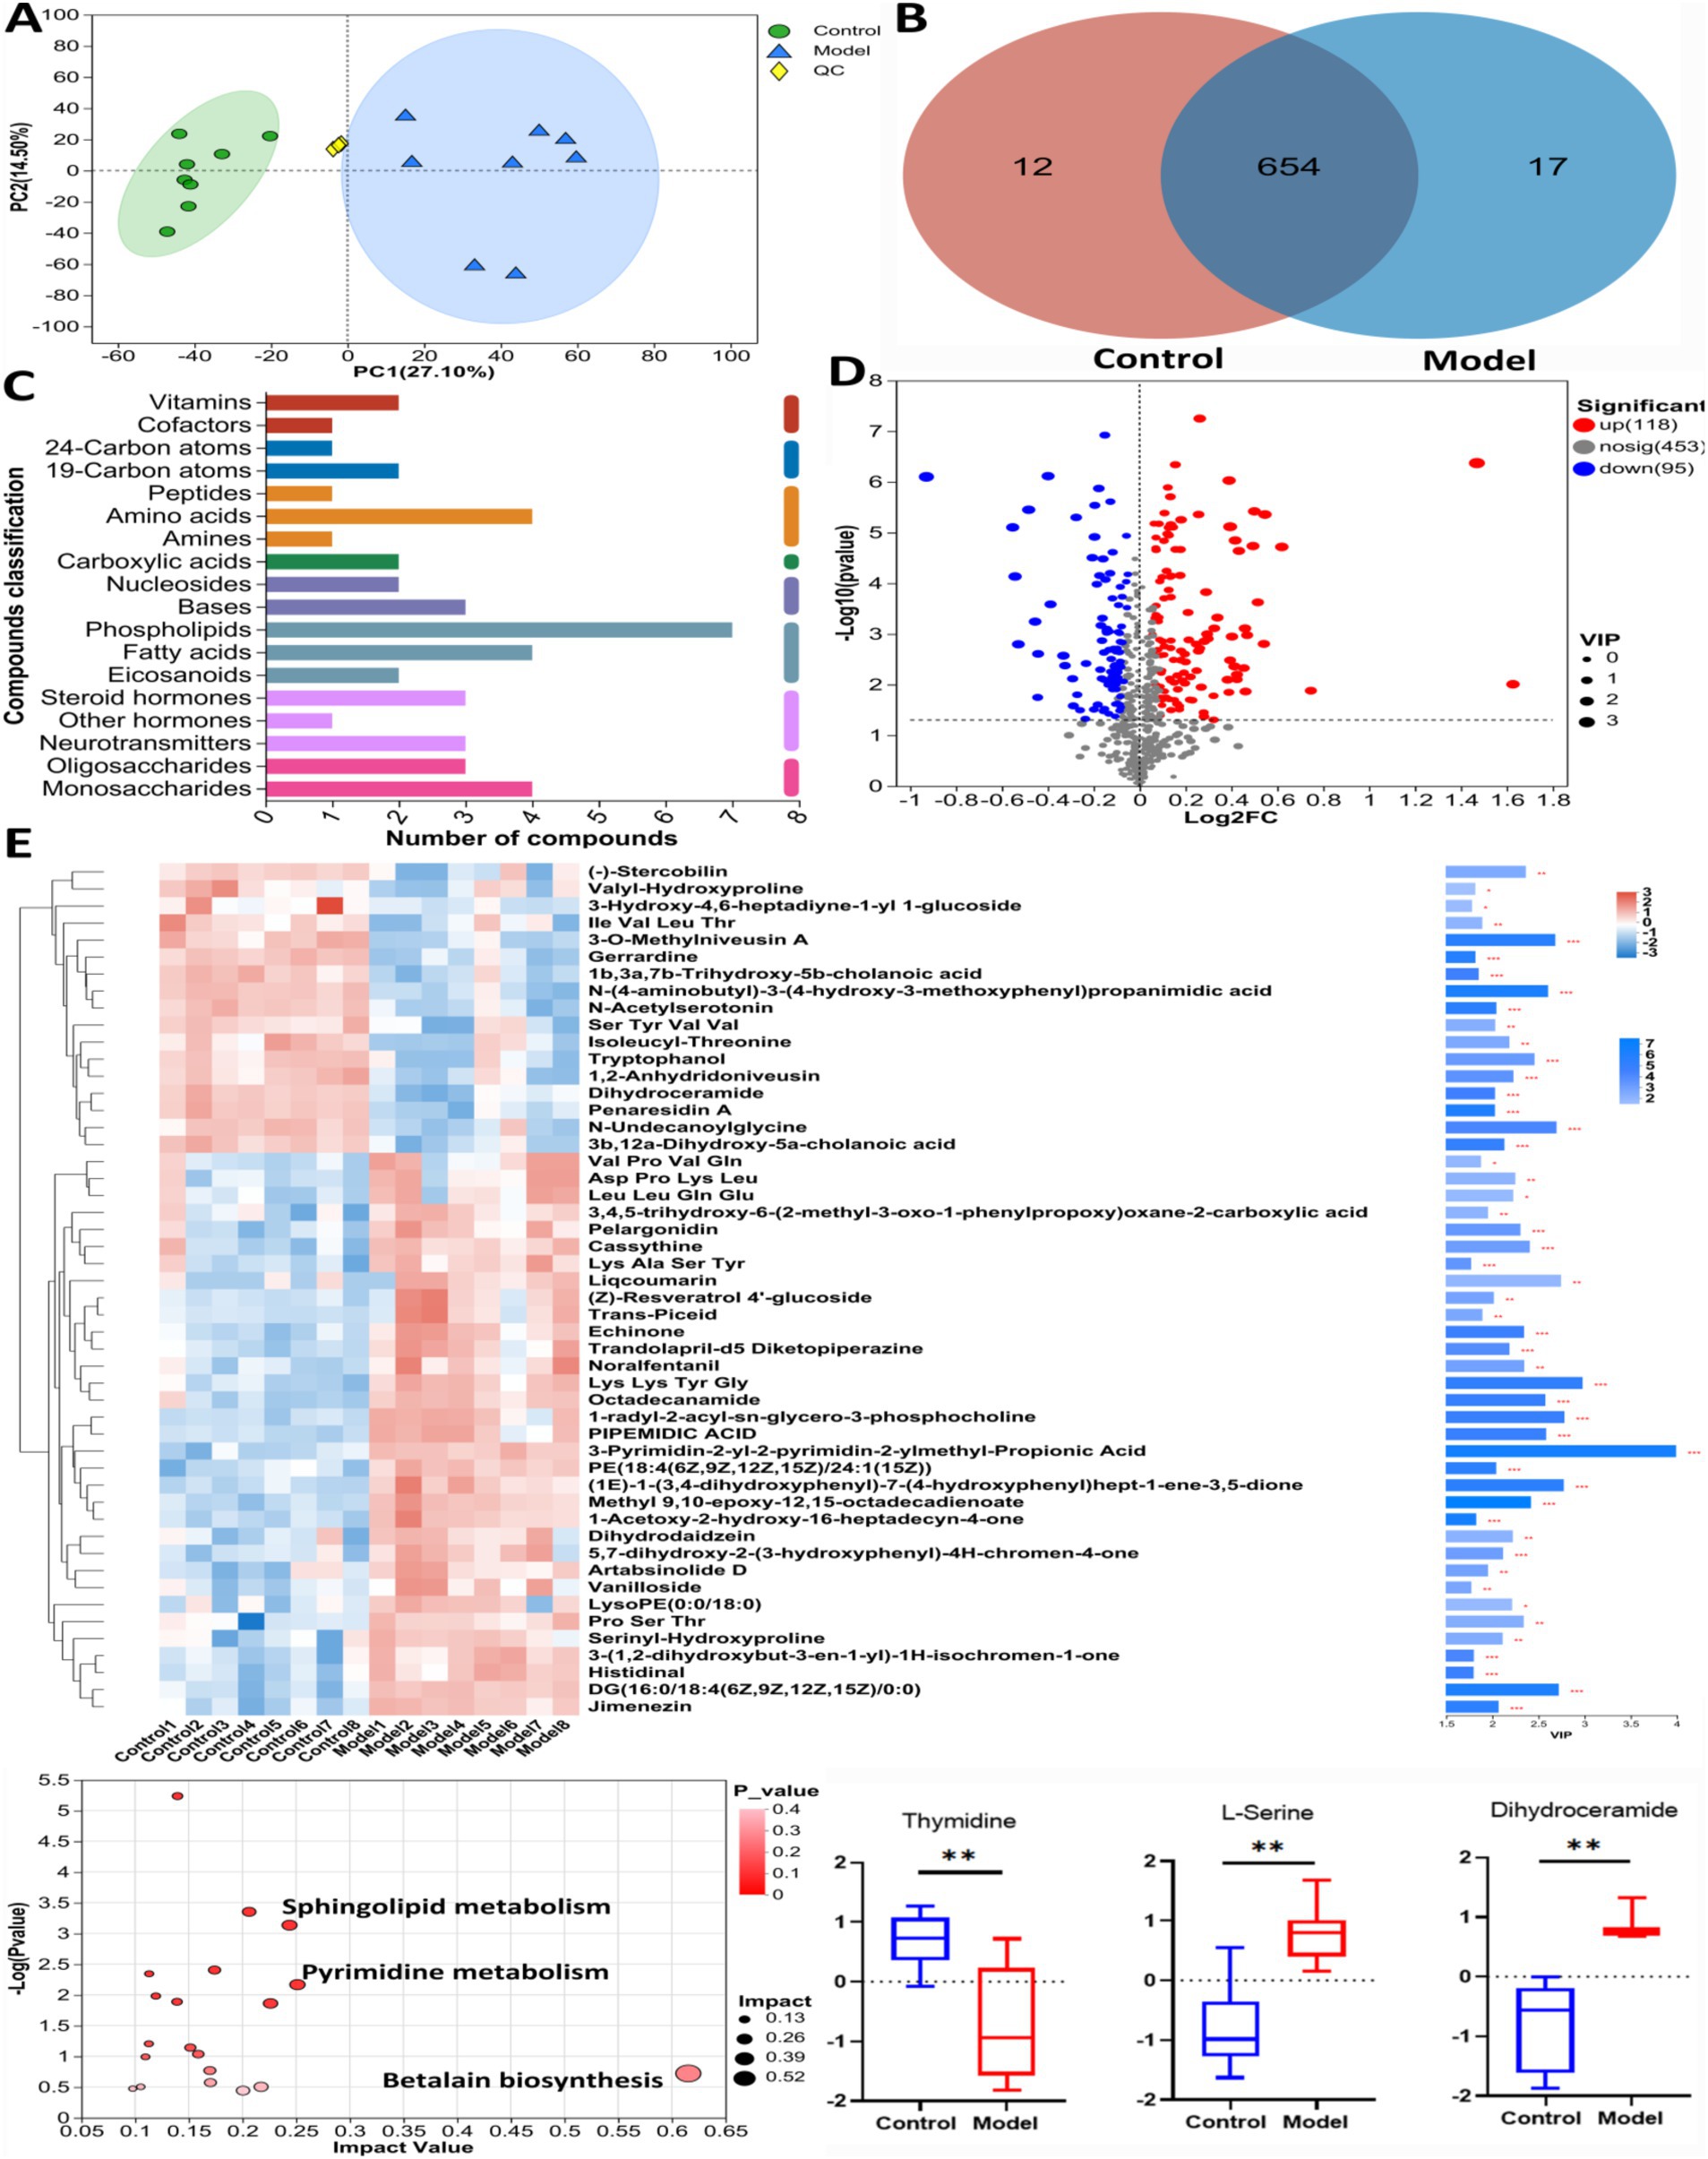
Figure 4. The untargeted metabolism of the feces in mice using LC/MS test under positive detection. (A) The PCA plot showed a good separation of the samples in the two groups. (B) Venn diagram illustrated the common and differential 683 metabolites between the groups. (C) KEGG analysis showed the important pathways involved in the differential metabolites. (D) Volcano plot of the 213 differential metabolites between the groups. (E) Heatmap diagram showed the change trends of the differential metabolites, and the relative levels of some important metabolites in the critical pathways in Control and Model groups. Data are presented as the mean ± SD (n = 8). **p < 0.01, compared with Model group.
Figure 5 showed the results of the negative detection mode. In Figure 5A, the results of principal component analysis (PCA) showed significant differences in metabolite levels between Control and Model groups. The results of the Venn diagram (Figure 5B) showed 407 metabolites co-occurring between Control and Model groups. Figure 5C shows the categorization of the detected metabolites, with amino acids and nucleosides having the highest number of species. The volcano plot (Figure 5D) shows that 116 significantly up-regulated metabolites and 35 significantly down-regulated metabolites were found in Model group compared to Control group (Log2FC < 1.5, p < 0.05). Figure 5E showed the cluster analysis, statistical analysis and KEGG pathway enrichment analysis of the differential metabolites. Succinate and N-acetylglutamate-5-semialdehyde levels were significantly elevated in Model mice compared with Control. The results of pathway enrichment showed that alanine, aspartate and glutamate metabolism, aminobenzoate degradation, and arginine biosynthesis were the major metabolic pathways enriched for the differential metabolites.
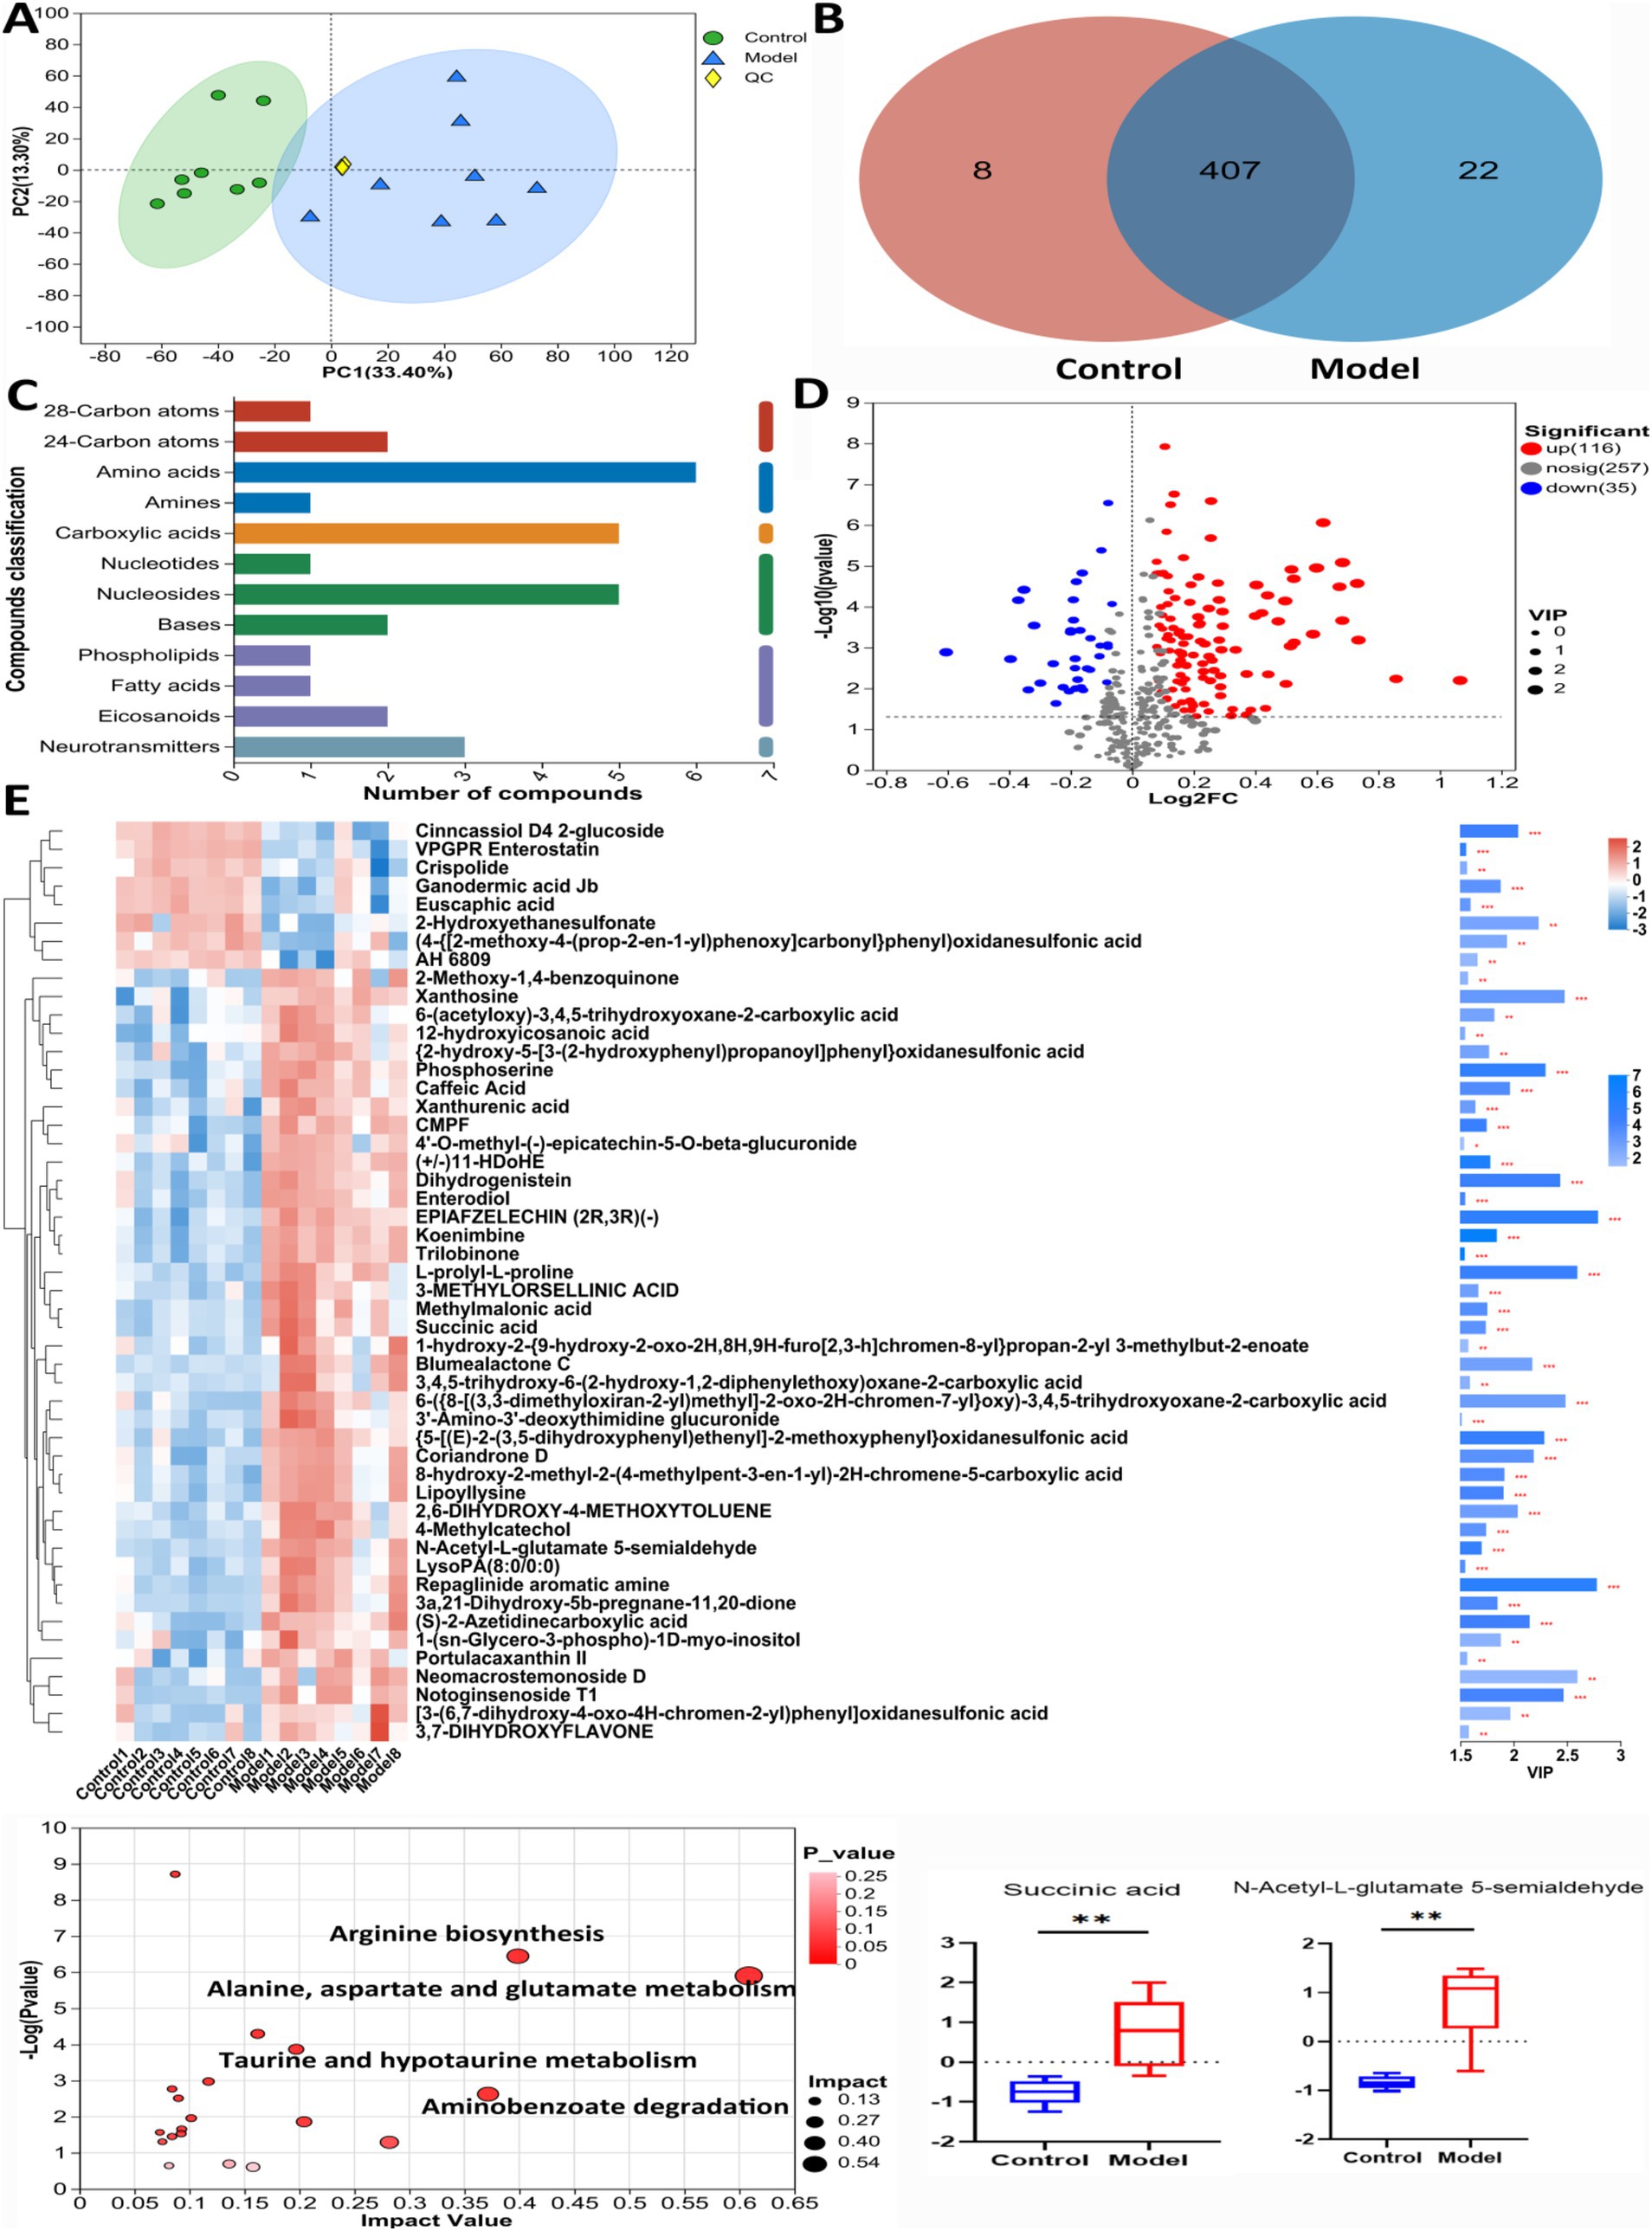
Figure 5. The untargeted metabolism of the feces in mice using LC/MS test under negative detection. (A) The PCA plot showed a good separation of the samples in the two groups. (B) Venn diagram illustrated the common and differential 437 metabolites between the groups. (C) KEGG analysis showed the important pathways involved in the differential metabolites. (D) Volcano plot of the 151 differential metabolites between the groups. (E) Heatmap diagram showed the change trends of the differential metabolites in Control and Model groups, and the relative levels of some important metabolites in the critical pathways. Data are presented as the mean ± SD (n = 8). **p < 0.01 compared with Model group.
3.4 Correlation of bacteria and metabolites
As shown in Figure 6, the results at the genus level revealed a negative correlation between linoleic acid and the abundances of Bifidobacterium and Ruminococcus. Additionally, Bifidobacterium was negatively correlated with maltose and threonine levels. These findings suggest a potential association between linoleic acid, trehalose, and maltose and the occurrence of AD mediated by the abundances of Bifidobacterium and Ruminococcus.
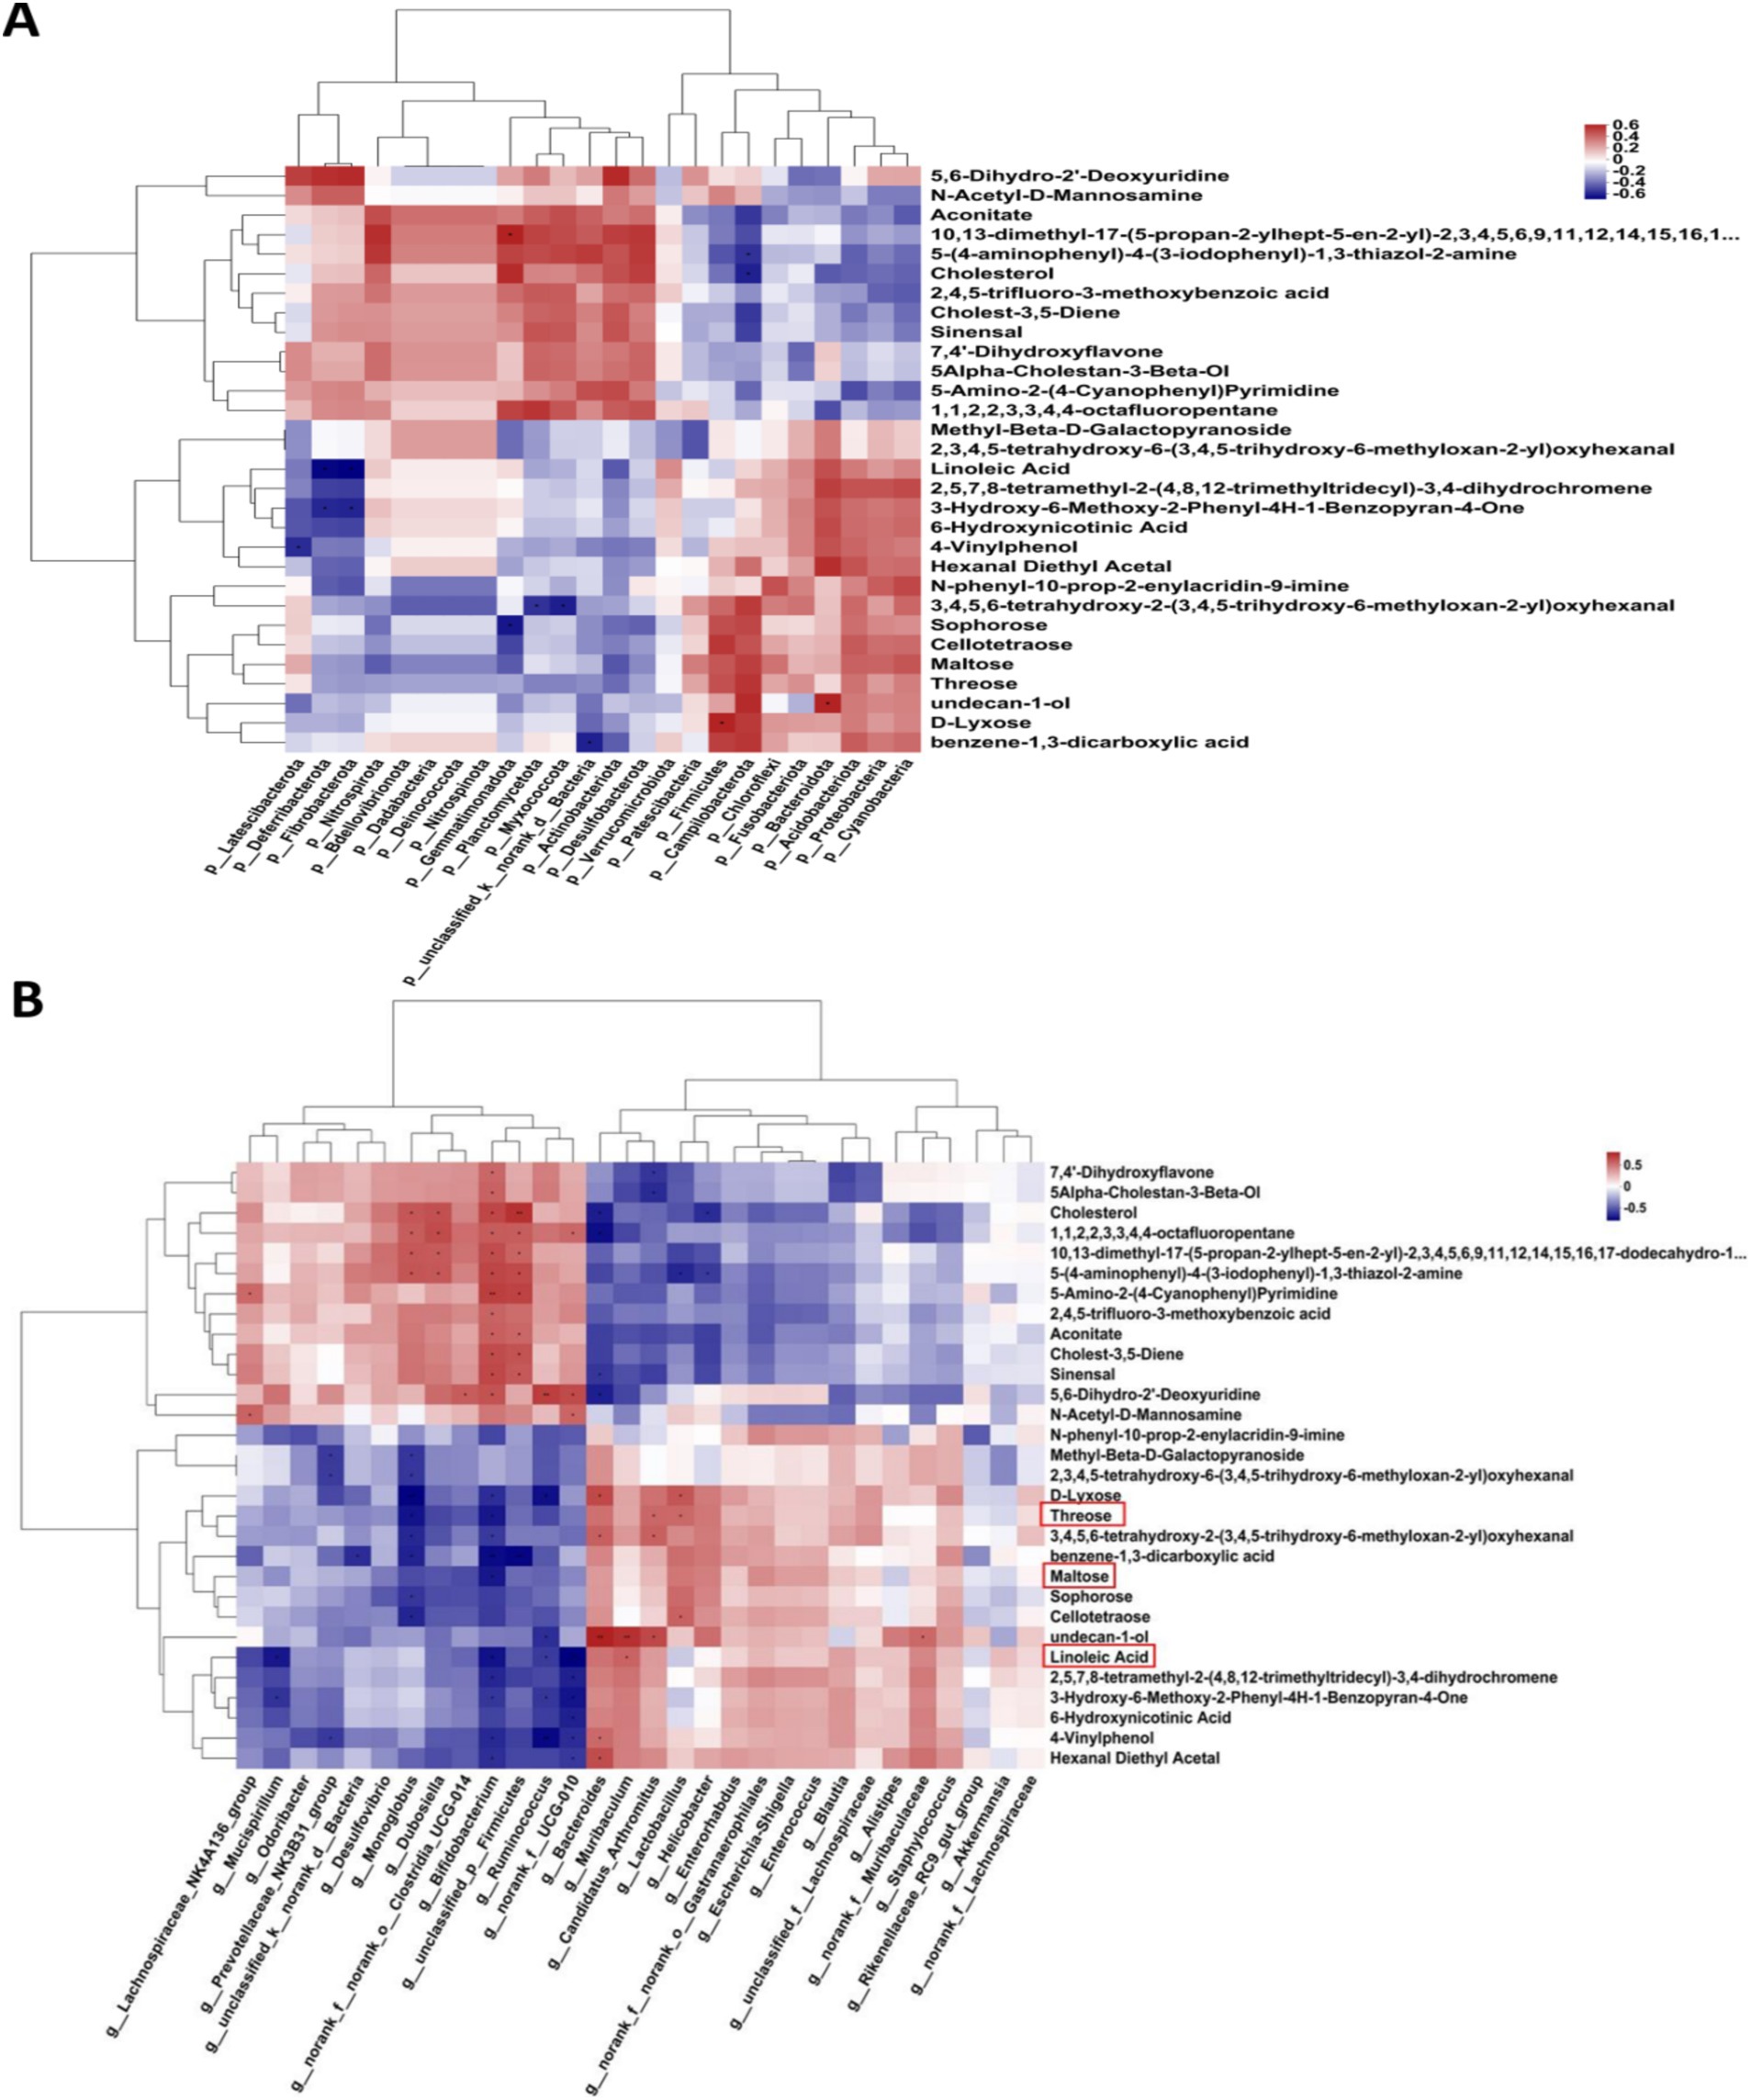
Figure 6. The correlation analysis between the bacteria and the metabolites using GC/MS. (A) The correlation analysis on phylum level. (B) The correlation analysis on the genus level.
3.5 Relationship between targeted metabolites and bacteria
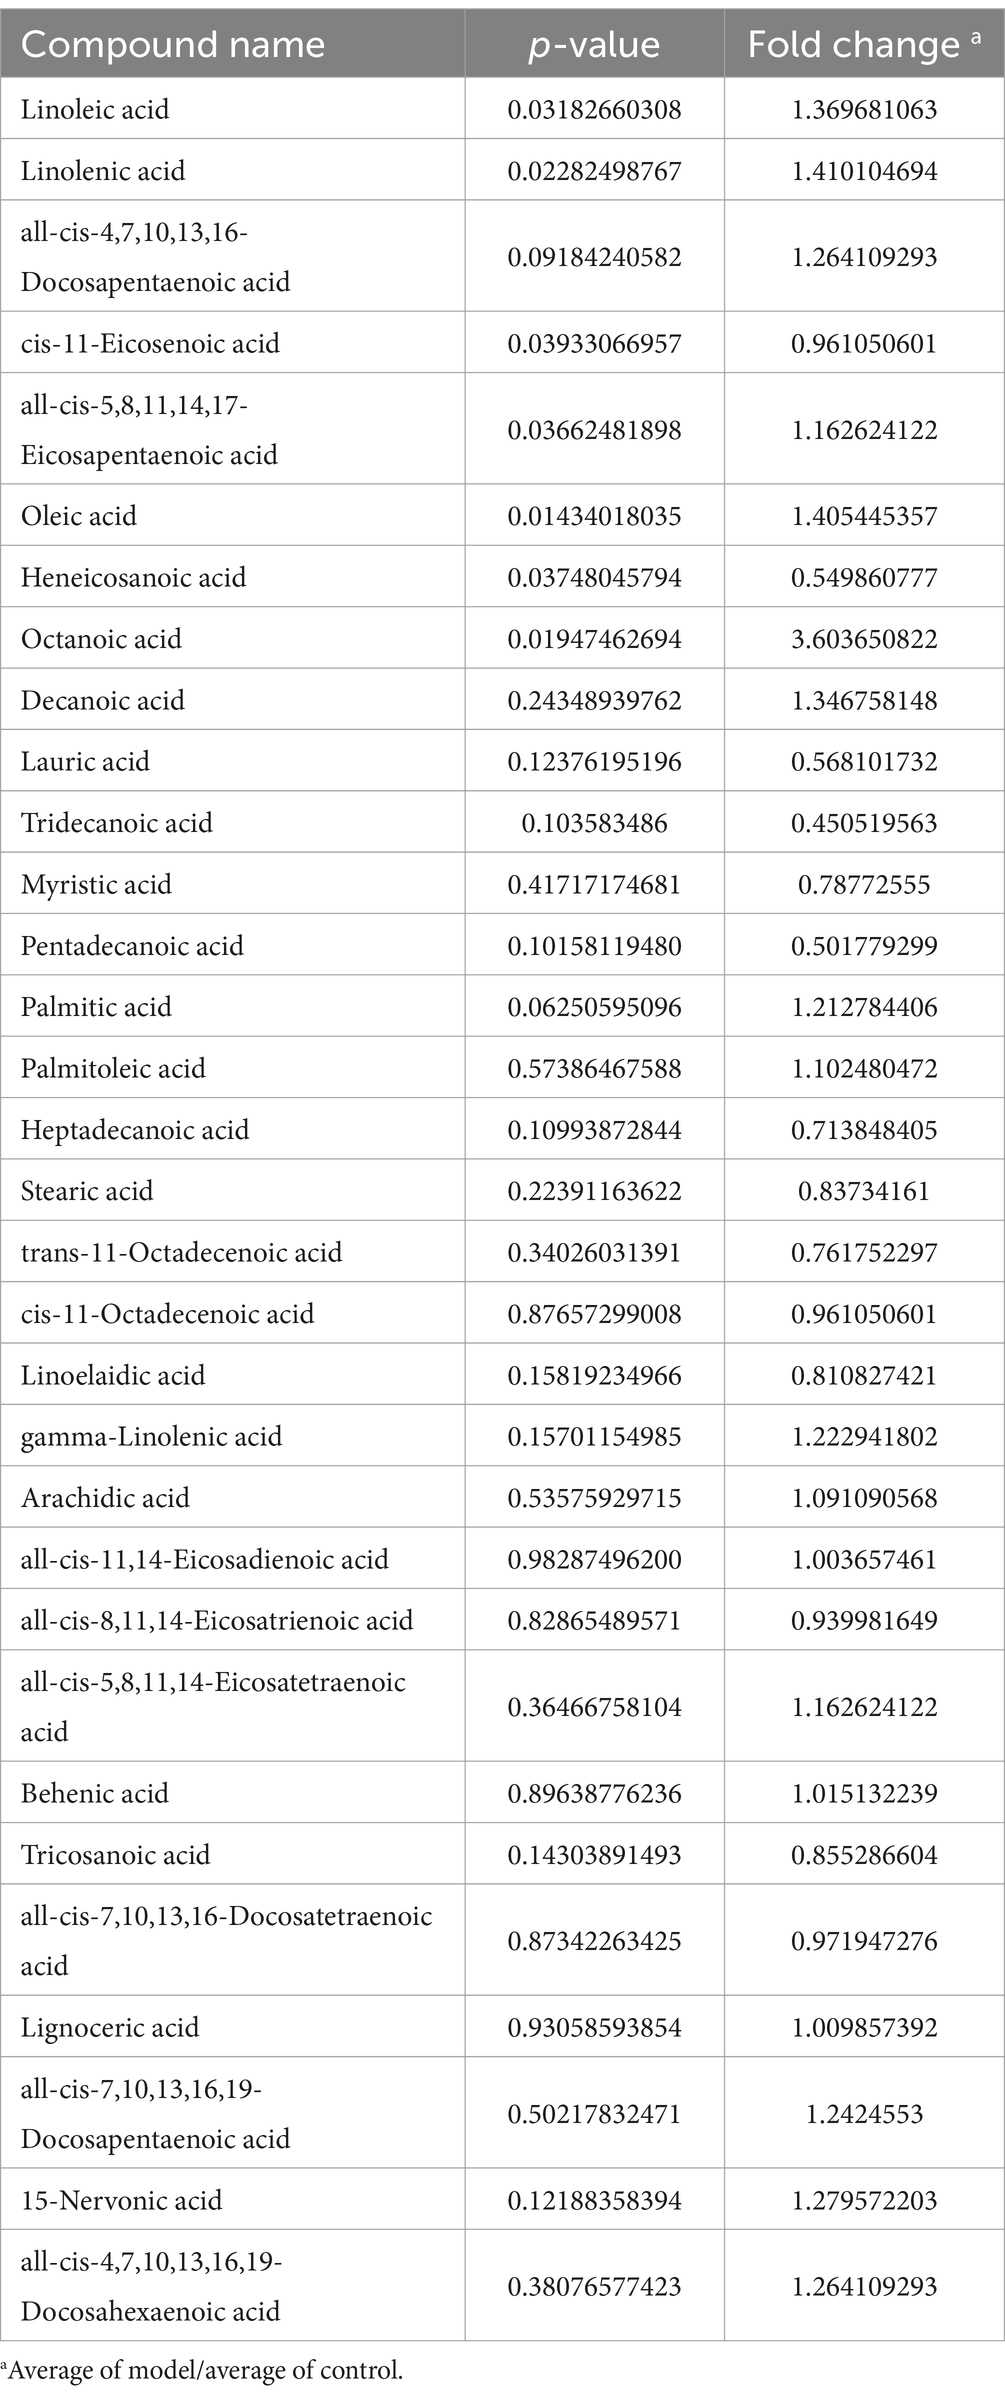
Figure 7A shows that the samples from the two groups were well separated. The volcano plot depicted in Figure 7B illustrates the trends in the metabolites that exhibited notable differences between the two groups, with red indicating upward trends and blue indicating downward trends. Figure 7C shows the magnitude of the changes in the identified differential metabolites. Figure 7D shows a hierarchical clustering plot of these metabolites. The correlation analysis between the differentially expressed bacteria and metabolites at the genus and species levels is shown in Figure 7E, revealing a negative correlation between Ruminococcus and linolenic acid at both genus and species levels. Figure 7F shows a histogram depicting the changes in the abundance of highly variable compounds. Further details regarding other differential metabolites are shown in Table 4.
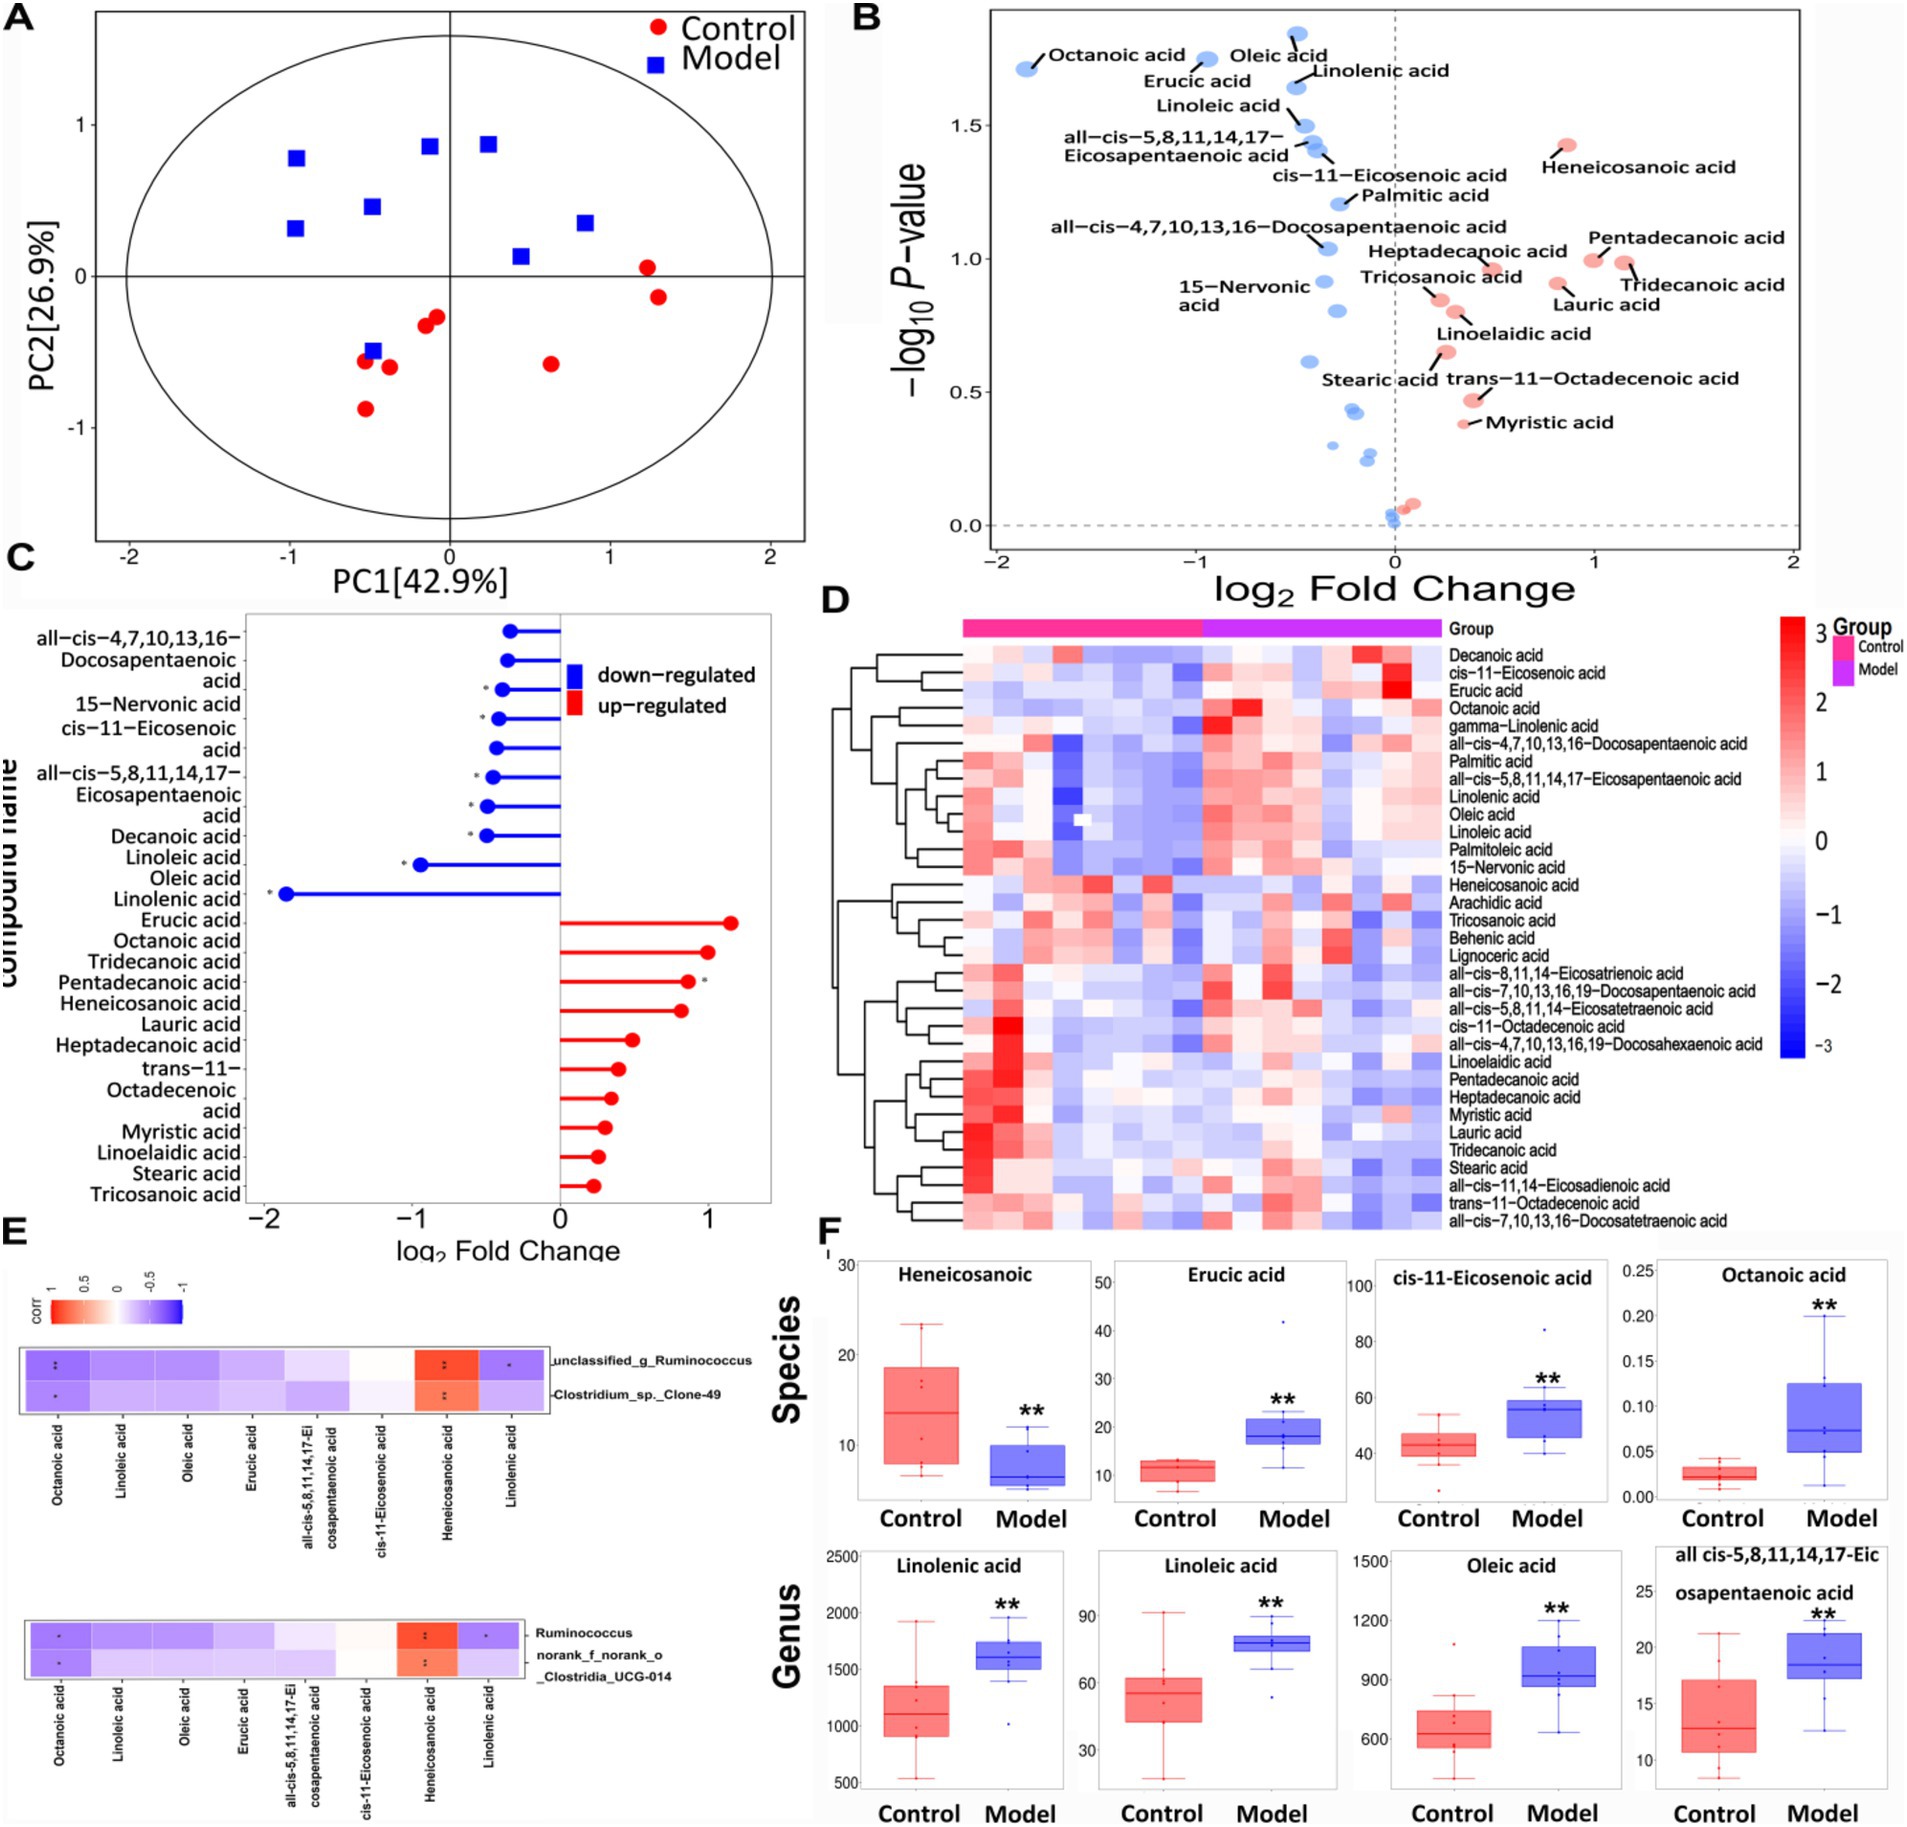
Figure 7. The targeted free fatty acids metabolism of the feces in mice using GC- TOF/MS. (A) OPLS-DA score scatter plot showed that all samples were within the 95% confidence interval. (B) Volcano plot of 25 free fatty acids metabolites between the groups. (C) Matchstick analysis displayed the highly variable differential metabolites between the groups. (D) Heatmap diagram showed the change trends of the differential free fatty acids metabolites in Control and Model groups. (E) Correlation analysis between the bacteria on genus level and free fatty acids metabolites. (F) The levels of free fatty acids metabolites. Data are presented as the mean ± SD (n = 8). *p < 0.05, **p < 0.01 compared with Model group.
3.6 Fecal transplantation relieved the symptoms of AD mice
In Figure 8A, based on hematoxylin and eosin, Masson trichrome and toluidine blue assays, mice in Model + DNFB group had the most severe skin damage. As shown in Figure 8B, the results of immunofluorescence and Western blotting tests showed that FLG levels were decreased and AQP3 levels were increased in Model + DNFB group compared with Model group. Figure 8C showed that the levels of HA, COI-1, HYP and CER were decreased in Model + DNFB group compared with Model group. In Figure 8D, the levels of MDA were obviously elevated and the levels of T-SOD and CAT were significantly decreased in Model + DNFB group compared with Model group. However, all of these indicators were significantly improved in the Control + DNFB group, confirming that AD symptoms were improved by transplanting colonies from healthy mice.
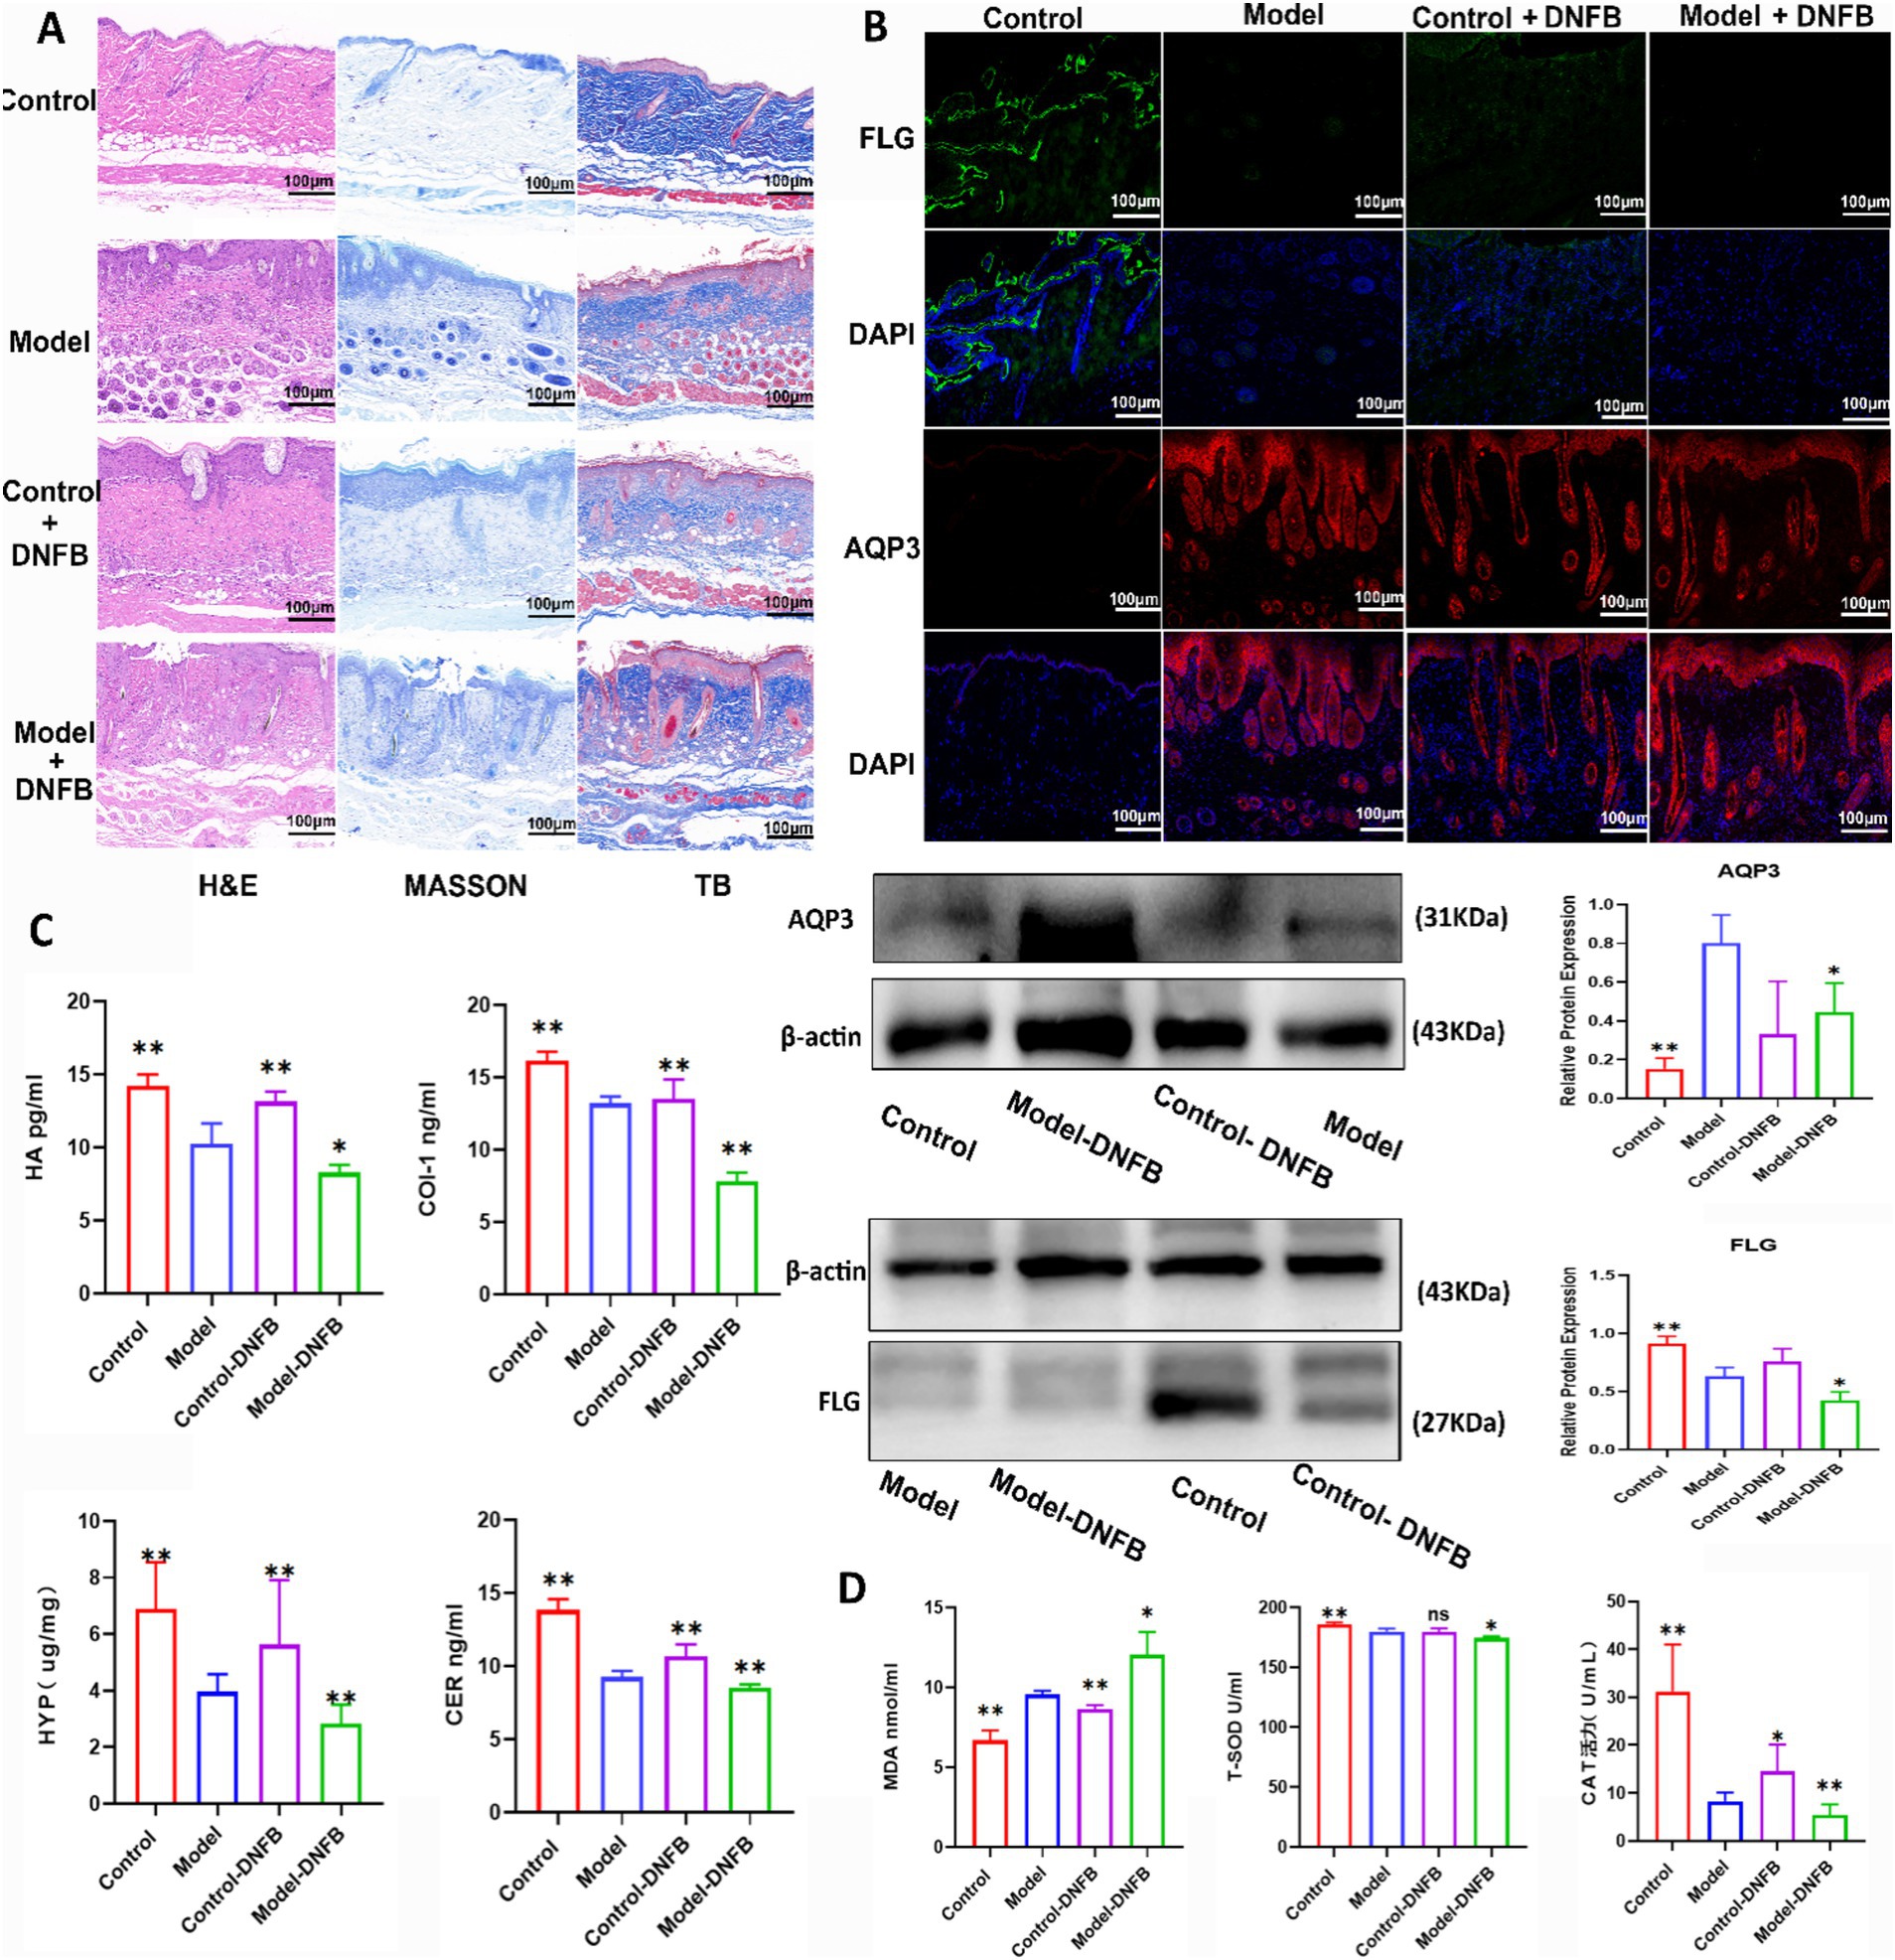
Figure 8. Fecal microbiota transplantation alleviated atopic dermatitis in mice. (A) The data of HE, Masson, and toluidine blue staining in mice after FMT on AD. (B) FMT changed the expression levels of AQP3 and FLG in AD mice by western blot and immunofluorescence tests. Data are presented as the mean ± SD (n = 3). (C) FMT reversed the levels of COL I, HA, CER and HYP in AD mice. Data are presented as the mean ± SD (n = 5). (D) FMT reversed the levels of T-SOD, MDA and CAT in mice AD. Data are presented as the mean ± SD (n = 5). *p < 0.05, **p < 0.01 compared with Model group.
4 Discussion
Atopic Dermatitis (AD) is a common chronic, recurrent, inflammatory skin disease. Its symptoms are mainly inflammation and flaking of the skin, erythema, accompanied by an intense itching sensation. The human gut microbiota is a complex and interconnected system that plays a crucial role in human health. The gut microbiota is closely associated with a wide range of chronic diseases and poses a significant risk to human health (Chen et al., 2021). Factors such as the body’s immune response, environmental influences and genetic predisposition combine to determine the structure and composition of the gut microbiota. Therefore, the maintenance of intestinal homeostasis is closely related to the normal functioning of body systems and microbiota (Kataoka, 2016). Microbial metabolites are important mediators of interactions between the microbiota and host cells (Petrosino et al., 2009), highlighting the importance of regulating gut flora and microbiota metabolism in the prevention and treatment of diseases such as AD. With intensive research, many studies have revealed the correlation between gut microbiota and AD. The “gut-skin” axis has been proposed and recognized as a new target for the prevention and treatment of AD (Fang et al., 2021).
In this study, we chose C57BL/6J mice for the experiments, which have similar symptoms to humans. AD mouse models have erythema, itching, and dryness similar to those of humans, which makes them the ideal models for studying AD (Nagata et al., 2021). In animal experiments, 0.5% DNFB was used for model establishment. The results of H&E staining showed that the skin of mice in Model group showed thickening and disorganization of collagen fiber bundles, suggesting that the skin barrier was severely damaged. AQP3 (aquaporin 3) and FLG (filamentous polyglutamic protein) are two important proteins in skin health, which play key roles in skin barrier function and moisturization. In AD patients, AQP3 expression level is significantly increased. This may be due to the decreased epidermal water content in patients with chronic eczema, and the epidermal stratum corneum cells compensatory express large amounts of AQP3 to facilitate the penetration of more water and glycerol from the body into the epidermal stratum corneum (Lu et al., 2023). In contrast, FLG expression is reduced in skin lesions in AD patients (Guttman-Yassky et al., 2019). In our work, the expression levels of these two proteins in the skin were examined by immunofluorescence and Western tests. FLG levels were significantly decreased and AQP3 levels were significantly increased in the skin tissues of Model mice compared to Control group. AD also triggers inflammation and oxidative stress (Huang et al., 2022; Bertino et al., 2020). We examined three common oxidative stress indicators (T-SOD, MDA, CAT) and three inflammatory factors (IL-1β, IL-6, TNF-α). The results showed that the levels of T-SOD and CAT were significantly decreased and the levels of MDA, IL-1β, IL-6, and TNF-α were significantly increased in Model mice compared with Control group. Hydroxyproline, hyaluronic acid, collagen I, and ceramides are several substances that have important roles in reducing the pathogenesis of AD. The experimental results showed that all four substances were significantly decreased in the skin tissues of mice in Model group compared to Control group. In conclusion, all the data indicate that the mouse modeling for sequencing was very successful.
16S rRNA gene sequencing method can provide valuable information for understanding bacterial composition (Johnson et al., 2019). In the present study, we observed significant changes in the composition of microorganisms associated with AD. In particular, Bifidobacterium and Ruminococcus. The results of this study showed that the abundances of Bifidobacterium and Ruminococcus were significantly decreased in Model mice compared to Control group. Bifidobacterium has been widely used in food and health care as the recognized probiotic. Fang et al. have found that Bifidobacterium longum can mediate tryptophan metabolism to ameliorate atopic dermatitis through the gut-skin axis (Fang et al., 2022). The exact mechanism regarding the association of Ruminococcus with the pathogenesis of atopic dermatitis has not been accurately verified. Mari Sasaki et al. have found that the abundance of Ruminococcus bromii was correlated with fecal butyrate levels and atopic dermatitis in infants (Sasaki et al., 2022). Jae-Rin Ahn et al. have also found in animal experiments that Ruminococcus improves atopic dermatitis by enhancing the Treg cells and metabolites of BALB/c mice (Ahn et al., 2022). In conclusion, the abundance of Bifidobacteria and Ruminococcus were significantly reduced after the onset of AD, and restoring their levels should improve the symptoms of AD.
When the flora is altered, the level of metabolism in the organism is also altered. Metabolomics provides a powerful tool for identifying biomarkers and gaining insight into disease mechanisms, thus facilitating the development of precision medicine approaches (Cui et al., 2018). Our study identified different metabolites using GC-TOF/MS and UPLC-MS/MS analyses, revealing their association with specific intestinal bacteria at different levels of classification. The experimental results showed that the metabolites such as linoleic acid, maltose, threonine thymine, L-serine, dihydroceramide, succinate and N-acetylglutamate-5-semialdehyde were significantly elevated in the model group as compared to the control group. Topical application of linoleic acid usually provides relief from atopic dermatitis. However, linoleic acid metabolism levels were significantly elevated in vivo in this study. We were intrigued by this phenomenon, and thus we further performed a targeted metabolomics assay, i.e., absolute quantification of the class of free fatty acids in mouse feces. The results were consistent with the untargeted results in that linoleic acid levels were significantly elevated in the model mice. We hypothesized that this may be some kind of in vivo protective mechanism to promote linoleic acid metabolism, but this speculation remains to be verified. To verify the potential link between the genera Ruminococcus and Bifidobacterium and linoleic acid, we performed genus-metabolite correlation analyses. The results of the joint assay showed that linoleic acid was significantly negatively correlated with Ruminococcus and Bifidobacterium. That was, the metabolic level of linoleic acid showed the increased tendency when the abundances of Ruminococcus and Bifidobacterium decreased, suggesting that Ruminococcus and Bifidobacterium may be involved in linoleic acid metabolism.
Fecal microbiota transplantation experiments demonstrated that mice receiving fecal transplants from Control + DNFB group exhibited reduced AD symptoms compared with those receiving transplants from Model + DNFB group. These improvements were accompanied by reductions in skin barrier damage and AQP3 levels, as well as elevations in FLG levels, underscoring the potential therapeutic benefits of modulating the gut microbiota composition (Smits et al., 2013).
This study discovered a number of bacteria and metabolites with significant changes caused by AD. In particular, the differential genera screened, Ruminococcus and Bifidobacterium, should be possible association with linoleic acid metabolism in vivo for the first time. These data provided experimental basis for in-depth research on the pathogenesis of AD and feasible prevention and treatment methods. Identifying specific metabolites and their association with microbial taxa can provide valuable insights into disease mechanisms and potential therapeutic targets. These findings should pave the way for future research to elucidate the underlying mechanisms of AD and develop targeted interventions to improve patient outcomes. The limitation of this study was that the functions of bacteria and metabolites with significant changes on regulating AD were not studied in depth, and in addition, the role and application of the association of bacteria and metabolites were not investigated, and the possible application of the bacteria and metabolites on AD were also not tested, which will be our next research focus. In our future plans, Ruminococcus and Bifidobacterium will be colonized in germ-free mice to confirm which supplementation is more effective in improving AD. We will also quantify the changes in linoleic acid content in the feces of different groups of mice to verify the relationship between bacteria and metabolites in vivo. At the same time, the bacteria will be co-cultured with linoleic acid to validate in vitro. Finally, the specific target of action will be screened by transcriptomics, and the mechanism of action of the bacteria will be completely elaborated.
Data availability statement
The original contributions presented in the study are included in the article/Supplementary material, further inquiries can be directed to the corresponding author.
Ethics statement
All experimental procedures adhered strictly to the PR China Legislation Regarding the Use and Care of Laboratory Animals, and all animal tests were approved by the Animal Care and Use Committee of Dalian Medical University (SYXK (Liao) 2018-0007). The study was conducted in accordance with the local legislation and institutional requirements.
Author contributions
FW: Methodology, Validation, Writing – original draft. ZW: Project administration, Writing – original draft. LQ: Conceptualization, Investigation, Supervision, Writing – review & editing.
Funding
The author(s) declare financial support was received for the research, authorship, and/or publication of this article. This work was supported by the Independent Research Fund of Yunnan Characteristic Plant Extraction Laboratory (2022YKZY004 and 2023YKZY004).
Acknowledgments
We thank the involvement of all authors in this study.
Conflict of interest
FW, ZW, and LQ were employed by Yunnan Botanee Bio-Technology Group Co., Ltd., and Yunnan Yunke Characteristic Plant Extraction Laboratory Co., Ltd. FW and LQ were employed by Shanghai Jiyan Biomedical Development Co., Ltd.
Publisher’s note
All claims expressed in this article are solely those of the authors and do not necessarily represent those of their affiliated organizations, or those of the publisher, the editors and the reviewers. Any product that may be evaluated in this article, or claim that may be made by its manufacturer, is not guaranteed or endorsed by the publisher.
Supplementary material
The Supplementary material for this article can be found online at: https://www.frontiersin.org/articles/10.3389/fmicb.2024.1462491/full#supplementary-material
Abbreviations
AD, Atopic dermatitis; AQP3, Aquaporin; CAT, catalase; Cer, ceramide; COL I, Collagen type I; DNFB, 2,4-dinitrofluorobenzene; FLG, Filaggrin; FMT, Fecal microbiota transplantation; GC-TOF/MS, Gas chromatography-time-of-flight-mass spectrometry; HA, Hyaluronic acid; HYP, Hydroxyproline; IL, interleukin; MDA, Malondialdehyde; PBS, Phosphate buffered-saline; SD, Standard deviation; T-SOD, Total superoxide dismutase; UPLC-MS/MS, Ultra-performance liquid chromatography tandem mass spectrometry.
Footnotes
References
Ahn, J., Lee, S., Kim, B., Nam, M., Ahn, Y., Park, Y., et al. (2022). Ruminococcus gnavus ameliorates atopic dermatitis by enhancing Treg cell and metabolites in BALB/c mice. Pediatr. Allergy Immunol. 33:e13678. doi: 10.1111/pai.13678
Bertino, L., Guarneri, F., Cannavò, S. P., Casciaro, M., Pioggia, G., and Gangemi, S. (2020). Oxidative stress and atopic dermatitis. Antioxidants 9:196. doi: 10.3390/antiox9030196
Chen, Y., Zhou, J., and Wang, L. (2021). Role and mechanism of gut microbiota in human disease. Front. Cell. Infect. Microbiol. 11:625913. doi: 10.3389/fcimb.2021.625913
Cui, L., Lu, H., and Lee, Y. H. (2018). Challenges and emergent solutions for LC-MS/MS based untargeted metabolomics in diseases. Mass Spectrom. Rev. 37, 772–792. doi: 10.1002/mas.21562
Fang, Z., Li, L., Zhang, H., Zhao, J., Lu, W., and Chen, W. (2021). Gut microbiota, probiotics, and their interactions in prevention and treatment of atopic dermatitis: a review. Front. Immunol. 12:720393. doi: 10.3389/fimmu.2021.720393
Fang, Z., Pan, T., Li, L., Wang, H., Zhu, J., Zhang, H., et al. (2022). Bifidobacterium longum mediated tryptophan metabolism to improve atopic dermatitis via the gut-skin axis. Gut Microbes 14:2044723. doi: 10.1080/19490976.2022.2044723
Gao, T., Wang, X., Li, Y., and Ren, F. (2023). The role of probiotics in skin health and related gut-skin axis: a review. Nutrients 15:3123. doi: 10.3390/nu15143123
Geoghegan, J. A., Irvine, A. D., and Foster, T. J. (2018). Staphylococcus aureus and atopic dermatitis: a complex and evolving relationship. Trends Microbiol. 26, 484–497. doi: 10.1016/j.tim.2017.11.008
Góralczyk-Bińkowska, A., Szmajda-Krygier, D., and Kozłowska, E. (2022). The microbiota –gut -brain axis in psychiatric disorders. Int. J. Mol. Sci. 23:11245. doi: 10.3390/ijms231911245
Guttman-Yassky, E., Bissonnette, R., Ungar, B., Suárez-Fariñas, M., Ardeleanu, M., Esaki, H., et al. (2019). Dupilumab progressively improves systemic and cutaneous abnormalities in patients with atopic dermatitis. J. Allergy Clin. Immunol. 143, 155–172. doi: 10.1016/j.jaci.2018.08.022
Huang, I., Chung, W., Wu, P., and Chen, C. (2022). JAK-STAT signaling pathway in the pathogenesis of atopic dermatitis: an updated review. Front. Immunol. 13:1068260. doi: 10.3389/fimmu.2022.1068260
Johnson, J. S., Spakowicz, D. J., Hong, B. Y., Petersen, L. M., Demkowicz, P., Chen, L., et al. (2019). Evaluation of 16S rRNA gene sequencing for species and strain-level microbiome analysis. Nat. Commun. 10:5029. doi: 10.1038/s41467-019-13036-1
Kataoka, K. (2016). The intestinal microbiota and its role in human health and disease. J. Med. Investig. 63, 27–37. doi: 10.2152/jmi.63.27
Liang, Y. H., Shu, P., Li, Y. L., Li, M., Ye, Z. H., Chu, S., et al. (2023). GDU-952, a novel AhR agonist ameliorates skin barrier abnormalities and immune dysfunction in DNFB-induced atopic dermatitis in mice. Biochem. Pharmacol. 217:115835. doi: 10.1016/j.bcp.2023.115835
Liu, Y., Liu, L., Luo, J., and Peng, X. (2023). Metabolites from specific intestinal bacteria in vivo fermenting Lycium barbarum polysaccharide improve collagenous arthritis in rats. Int. J. Biol. Macromol. 226, 1455–1467. doi: 10.1016/j.ijbiomac.2022.11.257
Lu, R., Peng, Z., Lian, P., Wazir, J., Gu, C., Ma, C., et al. (2023). Vitamin D attenuates DNCB-induced atopic dermatitis-like skin lesions by inhibiting immune response and restoring skin barrier function. Int. Immunopharmacol. 122:110558. doi: 10.1016/j.intimp.2023.110558
Matsiras, D., Bezati, S., Ventoulis, I., Verras, C., Parissis, J., and Polyzogopoulou, E. (2023). Gut failure: a review of the pathophysiology and therapeutic potentials in the gut-heart axis. J. Clin. Med. 12:2567. doi: 10.3390/jcm12072567
Mesjasz, A., Zawadzka, M., Chałubiński, M., and Trzeciak, M. (2023). Is atopic dermatitis only a skin disease? Int. J. Mol. Sci. 24:837. doi: 10.3390/ijms24010837
Mass Spectra-DIA-Lipidomics. (2021). Citation Guide for the MS-DIAL Standard Reference Simulation Website. Available at: https://systemsomicslab.github.io/
Nagata, N., Hamasaki, Y., Inagaki, S., Nakamura, T., Horikami, D., Yamamoto- Hanada, K., et al. (2021). Urinary lipid profile of atopic dermatitis in murine model and human patients. FASEB J. 35:e21949. doi: 10.1096/fj.202100828R
National Institute of Standards and Technology. (2017). Citation Guide for the NIST Standard Reference Simulation Website. Available at: https://www.nist.gov/
Pabst, O., Hornef, M. W., Schaap, F. G., Cerovic, V., Clavel, T., and Bruns, T. (2023). Gut-liver axis: barriers and functional circuits. Nat. Rev. Gastroenterol. Hepatol. 20, 447–461. doi: 10.1038/s41575-023-00771-6
Park, S. K., Kim, J. S., and Seo, H. M. (2022). Exposure to air pollution and incidence of atopic dermatitis in the general population: a national population-based retrospective cohort study. J. Am. Acad. Dermatol. 87, 1321–1327. doi: 10.1016/j.jaad.2021.05.061
Petrosino, J. F., Highlander, S., Luna, R. A., Gibbs, R. A., and Versalovic, J. (2009). Metagenomic pyrosequencing and microbial identification. Clin. Chem. 55, 856–866. doi: 10.1373/clinchem.2008.107565
Qiao, X., Kong, K., Liu, T., Jia, Y., Fang, J., and Zhang, X. (2024). Gut-skin Axis: unravelling the link between gut microbiome and chronic kidney disease-related skin lesions. Endocr. Metab. Immune Disord. Drug Targets 24, 39–49. doi: 10.2174/1871530323666230511140514
Santos-Marcos, J. A., Perez-Jimenez, F., and Camargo, A. (2019). The role of diet and intestinal microbiota in the development of metabolic syndrome. J. Nutr. Biochem. 70, 1–27. doi: 10.1016/j.jnutbio.2019.03.017
Sasaki, M., Schwab, C., Ramirez Garcia, A., Li, Q., Ferstl, R., Bersuch, E., et al. (2022). The abundance of Ruminococcus bromii is associated with faecal butyrate levels and atopic dermatitis in infancy. Allergy 77, 3629–3640. doi: 10.1111/all.15440
Smits, L. P., Bouter, K. E., de Vos, W. M., Borody, T. J., and Nieuwdorp, M. (2013). Therapeutic potential of fecal microbiota transplantation. Gastroenterology 145, 946–953. doi: 10.1053/j.gastro.2013.08.058
Sroka-Tomaszewska, J., and Trzeciak, M. (2021). Molecular mechanisms of atopic dermatitis pathogenesis. Int. J. Mol. Sci. 22:4130. doi: 10.3390/ijms22084130
Stec, A., Sikora, M., Maciejewska, M., Paralusz-Stec, K., Michalska, M., Sikorska, E., et al. (2023). Bacterial metabolites: a link between gut microbiota and dermatological diseases. Int. J. Mol. Sci. 24:3494. doi: 10.3390/ijms24043494
Tan, J., Gong, J., Liu, F., Li, B., Li, Z., You, J., et al. (2022). Evaluation of an antibiotic cocktail for fecal microbiota transplantation in mouse. Front. Nutr. 9:918098. doi: 10.3389/fnut.2022.918098
The Fiehn library. (2013). Citation Guide for the Fiehn Standard Reference Simulation Website. Available at: https://fiehnlab.ucdavis.edu/projects/fiehnlib/
Wu, G., Li, L., Sung, G., Kim, T. W., Byeon, S. E., Cho, J. Y., et al. (2011). Inhibition of 2,4-dinitrofluorobenzene-induced atopic dermatitis by topical application of the butanol extract of Cordyceps bassiana in NC/Nga mice. J. Ethnopharmacol. 134, 504–509. doi: 10.1016/j.jep.2010.12.012
Yi, W., Ji, Y., Gao, H., Luo, S., Pan, R., Song, J., et al. (2022). Effects of urban particulate matter on gut microbiome and partial schizophrenia-like symptoms in mice: evidence from shotgun metagenomic and metabolomic profiling. Sci. Total Environ. 857:159305. doi: 10.1016/j.scitotenv.2022.159305
Zeng, L., Liu, Y., Xing, C., Huang, Y., Sun, X., and Sun, G. (2020). Saponin from Periploca forrestii Schltr mitigates oxazolone-induced atopic dermatitis via modulating macrophage activation. Mediat. Inflamm. 2020:4346367. doi: 10.1155/2020/4346367
Keywords: atopic dermatitis, gut microbiota, intestinal bacteria metabolisms, linoleic acid, Ruminococcaceae
Citation: Wang F, Wang Z and Qu L (2024) The changes of intestinal flora and metabolites in atopic dermatitis mice. Front. Microbiol. 15:1462491. doi: 10.3389/fmicb.2024.1462491
Edited by:
Jodi Woan-Fei Law, The University of Nottingham Ningbo, ChinaReviewed by:
Loh Teng Hern Tan, The University of Nottingham Ningbo, ChinaLe Duc Huy Ta, National University of Singapore, Singapore
Copyright © 2024 Wang, Wang and Qu. This is an open-access article distributed under the terms of the Creative Commons Attribution License (CC BY). The use, distribution or reproduction in other forums is permitted, provided the original author(s) and the copyright owner(s) are credited and that the original publication in this journal is cited, in accordance with accepted academic practice. No use, distribution or reproduction is permitted which does not comply with these terms.
*Correspondence: Liping Qu, cXVsaXBpbmdAYm90YW5lZS5jb20=
†These authors have contributed equally to this work
 Feifei Wang1,2,3†
 Liping Qu