 Kai Shi
 Kai Huang
 Lin Li
 Qiaohui Liu
 Yi Zhang1
 Huilin Zheng
- 1College of Computer Science and Engineering, Guilin University of Technology, Guilin, China
- 2Guangxi Key Laboratory of Embedded Technology and Intelligent Systems, Guilin University of Technology, Guilin, China
Background: Clinical studies have demonstrated that microbes play a crucial role in human health and disease. The identification of microbe-disease interactions can provide insights into the pathogenesis and promote the diagnosis, treatment, and prevention of disease. Although a large number of computational methods are designed to screen novel microbe-disease associations, the accurate and efficient methods are still lacking due to data inconsistence, underutilization of prior information, and model performance.
Methods: In this study, we proposed an improved deep learning-based framework, named GIMMDA, to identify latent microbe-disease associations, which is based on graph autoencoder and inductive matrix completion. By co-training the information from microbe and disease space, the new representations of microbes and diseases are used to reconstruct microbe-disease association in the end-to-end framework. In particular, a similarity fusion strategy is conducted to improve prediction performance.
Results: The experimental results show that the performance of GIMMDA is competitive with that of existing state-of-the-art methods on 3 datasets (i.e., HMDAD, Disbiome, and multiMDA). In particular, it performs best with the area under the receiver operating characteristic curve (AUC) of 0.9735, 0.9156, 0.9396 on abovementioned 3 datasets, respectively. And the result also confirms that different similarity fusions can improve the prediction performance. Furthermore, case studies on two diseases, i.e., asthma and obesity, validate the effectiveness and reliability of our proposed model.
Conclusion: The proposed GIMMDA model show a strong capability in predicting microbe-disease associations. We expect that GPUDMDA will help identify potential microbe-related diseases in the future.
1 Introduction
Microbes, often known as microorganisms, are tiny or ultramicroscopic organisms that include bacteria, fungi, eukaryotes, archaea, and other microorganisms (Ley, 2022). Microbes inhabiting human skin, saliva, oral mucosa, and the gastrointestinal tract are important for human health and life (Aggarwal et al., 2023). Many studies have shown that the abnormality in microbial communities can lead to diseases, such as intestinal autoimmune diseases, multiple sclerosis, diabetes, neurological disorders, and cancer (Miyauchi et al., 2023; Loh et al., 2024; White and Sears, 2024). However, it is difficult to identify the relationship between microbes and diseases based on conventional biological experiments since they are time-consuming, labor-intensive, and expensive. Therefore, it is necessary to develop computational approaches with high accuracy and efficiency to identify latent microbe–disease associations.
Nowadays, many methods have been developed to screen the microbe–disease interactions (Wen et al., 2021; Wang L. et al., 2022). Network-based methods usually utilize the topological information of different networks to identify potential new relationships. These methods with fewer parameters are relatively simple and easy to understand, but the prediction accuracy is influenced by the available associations and cannot be applied to new diseases or microbes without any known association in the network. The initial work is that Chen et al. (2017) developed the first computational model (KATZHMDA) for predicting microbe–disease association based on the network measurement Katz by integrating the number and length of walks between nodes. Yan et al. (2020) designed a prediction method based on a bi-random walk on the heterogeneous network including the microbe network, diseases network, and known microbe–disease associations network. In addition, other methods, considering network projection, label propagation, multi-similarity fusion, etc., are developed to discover potential microbe–disease interactions (Qu et al., 2019; Luo and Long, 2020; Yin et al., 2022a,b).
Matrix factorization is another kind of method to screen potential associations of microbe–disease entities, which maps the high-dimensional matrix into the product of low-dimensional matrices (Wang et al., 2019; Ma et al., 2020; Peng et al., 2020; Liu Y. et al., 2021; Liu et al., 2023). Although it solved the problem of data sparsity well, there were also several limitations, such as poor interpretability and slow training speed. For example, Ma et al. (2020) presented a computational model (MDNMF) based on non-negative matrix factorization to deduce latent disease-related microbe candidates. Peng et al. (2020) adopted positive-unlabeled learning and random walk to select negative samples and then utilized logistic matrix factorization with neighborhood regularization to find possible microbe–disease associations. Liu et al. (2023) used low-rank representation to obtain structural similarity information and utilized collaborative filtering to identify unknown microbe–disease pairs.
In addition, traditional machine learning methods can achieve an accurate prediction of future data, which starts from some training samples. The prediction accuracy of machine learning methods is trustworthy, but the problem of optimal values of model parameters is still unsolved. Furthermore, it is a challenge for them to obtain appropriate feature representations for microbes and diseases including all key information from the similarity network and association matrix (Wang et al., 2017; Peng et al., 2018; Ding et al., 2021; Xu et al., 2021). Peng et al. (2018) developed an adaptive Boosting enhanced microbe–disease association (ABHMDA) prediction model, the core of which was to calculate the association probability of microbe–disease pairs by combining weak classifiers into strong classifiers. Xu et al. (2021) used the Kronecker regularized least squares to calculate prediction scores with different Kronecker similarities. Moreover, some researchers applied graph representation learning to achieve rich feature representations for microbe–disease association prediction (Lei and Wang, 2020; Wang Y. et al., 2022; Yueyue et al., 2022). One representative work is that Yueyue et al. (2022) used an embedding algorithm called GraRep to learn global graph features on the heterogeneous network and adopted a support vector machine classifier to obtain the probability score of the microbe–disease associations.
Recently, deep learning approaches have become popular solutions for predicting microbe–disease associations. The basic concept is to use multiple processing layers to automatically learn the representation of data and multiple levels of abstraction. As deep learning is widely used in different fields and shows satisfactory performance, many deep learning-based prediction methods (such as graph convolutional networks and graph attention networks) have been developed for microbe–disease association prediction (Li et al., 2021; Long et al., 2021; Chen and Lei, 2022; Peng et al., 2023; Zhu et al., 2023). For example, to conclude the underlying microbe–disease associations, the novel back-propagation neural network model (BPNNHMD) was designed (Li et al., 2021). Long et al. (2021) integrated a graph attention network with induction matrix completion to predict possible microbial candidates for diseases. Peng et al. (2023) proposed a multi-view feature aggregation model to identify microbe–disease interactions, in which both linear and nonlinear features were extracted, respectively. Moreover, Chen and Lei (2022) employed metapath to aggregate graph neural networks for finding potential microbe–disease pairs on a microbe–drug–disease heterogeneous network.
Although the existing methods have attained significant progress in microbe–disease association prediction, there are still some limitations. First, most methods only use a single dataset, so the accuracy and reliability of the data need to be further improved. Second, in the microbe–disease network, plenty of edges focus on a handful of disease nodes, predicting potential edges easily biased toward those with more known associations with disease or microbe. Third, most methods cannot be applied to the prediction of a new disease or new microbe (i.e., disease or microbe without any known associations) owing to similarities depending on known microbe–disease association. Additionally, the calculated similarity often contains noise due to the lack of high-quality experimental data, which affects the accuracy of prediction. Finally, some methods cannot accurately capture the complex nonlinear associations.
To address these challenges, we proposed an improved deep learning framework with graph autoencoders and inductive matrix completion (GIMMDA) to identify the latent microbe–disease associations. First, we constructed a robust microbe–disease heterogeneous network, and the disease network and microbe network are constructed by a similarity fusion strategy on different similarities including functional similarity and topological similarity. Then, we adopted an end-to-end framework to integrate graph autoencoder and inductive matrix completion, where the information from microbe and disease space are co-trained. Finally, the score matrix constructed from node representations of graph autoencoders is utilized to predict the potential microbe–disease interactions. Our model can be considered an end-to-end model that directly maps input data to the final output, automatically extracting features from raw data and making predictions by probability. In the 5-fold cross-validation (5-fold CV), our model obtained a reliable performance.
2 Materials and methods
2.1 The known human microbe–disease associations
Currently, the microbe–disease pairs prediction mainly depends on several popular databases, including HMDAD (Ma et al., 2017), Disbiome (Janssens et al., 2018), gutMDisorder (Cheng et al., 2020), MicroPhenoDB (Yao et al., 2020), MASI (Zeng et al., 2021) and Peryton (Skoufos et al., 2021). The interactions are screened from biomedical articles with manual curation or text-mining, which is shown in Table 1. However, the robust datasets are still lacking, due to different adopt strategies, noise introduction, and update absence. For more reliable prediction, we selected two datasets HMDAD (450 associations between 39 diseases and 292 microbes) and Disbiome (8,645 associations between 351 diseases and 1,582 microbes) to validate the performance of the model. Furthermore, we constructed a new dataset (multiMDA) including 1,124 associations between 287 diseases and 567 microbes, where those associations are found in at least two of the six datasets mentioned above, after unifying the disease name and microbe taxonomy.
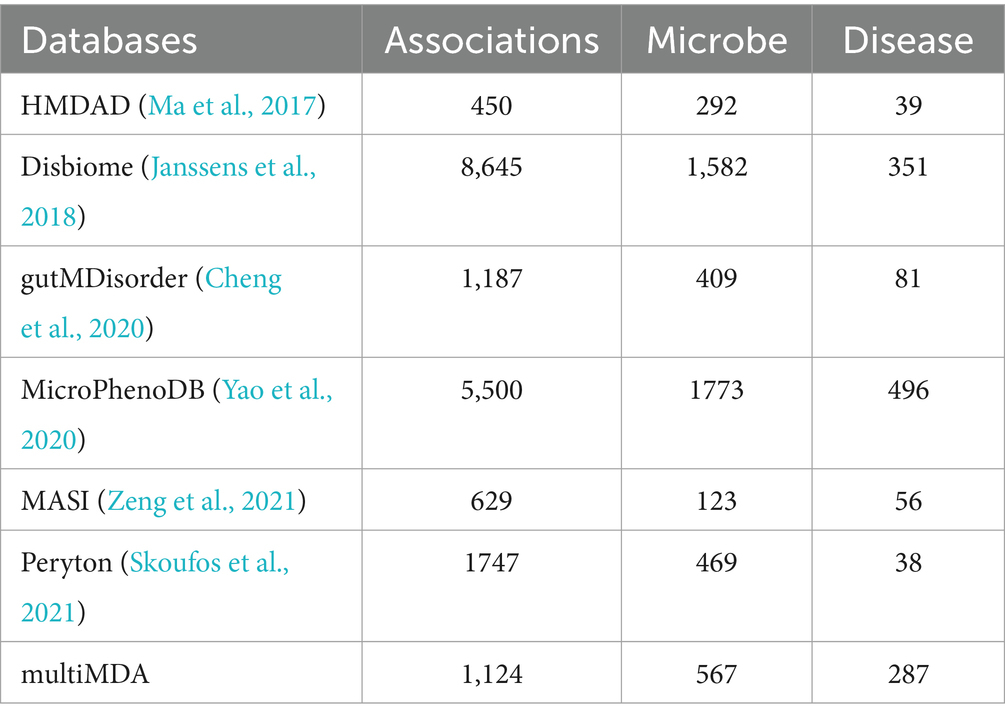
Table 1. Summaries of the human microbe-associated datasets.
In this study, an adjacent matrix with 0–1 entries is constructed to represent the known microbe–disease associations, where if a disease is associated with a microbe , otherwise .
2.2 Interaction profile similarity for disease and microbe
The interaction profile similarity is widely used to predict correlation between biological entities, and the underlying assumption is that similar diseases (microbes) generally have the same interaction patterns with similar microbes (diseases) and vice versa. In this study, several popular similarities based on the adjacency matrix are adopted, including Gaussian Interaction Profile (GIP) kernel similarity, Cosine similarity, and Jaccard similarity.
2.2.1 Gaussian interaction profile kernel similarity
Gaussian interaction profile kernel similarity is a kernel measuring the similarity of nodes in a network, in which the interaction profile of a node is a binary vector specifying the presence or absence of interaction with other nodes (van Laarhoven et al., 2011). In this study, we represent the interaction profile of the disease as a binary vector to encode the interaction pattern with every microbe. It is the row of the adjacency matrix , denoting as . Similarly, the column of matrix , known as , is the microbe interaction profile for a microbe . The Gaussian interaction profile kernel similarity for disease pairs or microbe pairs can be calculated as follows by Equations 1, 2:
where and denote the normalized kernel bandwidth (Equations 3, 4).
where and are the initial bandwidth parameters, which generally are set to 1.
2.2.2 Cosine similarity
Commonly, cosine similarity is a popular metric used to measure the similarity of related entities, which considers the cosine angle between vector representations of entities in Euclidean space. Then, we, respectively, constructed cosine similarity score matrixes for diseases and microbes under the adjacency matrix , where row vectors are the disease representation and column vectors are the microbe representation. Therefore, the similarity metrics are defined as follows by Equations 5, 6:
where represents the cosine similarity between disease and , and similarly, is the microbe cosine similarity between microbe and . Furthermore, we normalized the cosine similarity to the range 0 to 1.
2.2.3 Jaccard similarity
Jaccard similarity is a common proximity measurement for characterizing the similarity between two sets of objects. We adopted the following formula to calculate the disease similarity between disease and disease by Equation 7:
where , . Similarly, following the metric, we derived the microbe Jaccard similarity matrix .
2.3 Biological function similarity for disease and microbe
In addition to network topological information, wide pieces of evidence available from different biological sources are applied to improve accuracy for predicting microbe–disease associations. For disease resources, we considered disease-related symptom data, disease semantic information, and disease-gene functional information and also measured the similarity between microbes by the evolutionary distance of nucleotide sequences of microbes.
2.3.1 Disease symptom similarity
Zhou et al. (2014) constructed a comprehensive human symptom–disease network, which made it possible to find similar diseases from the perspective of disease symptoms. With representation learning, each disease is usually represented by a vector of symptoms, , where characterizes the importance of symptom to disease , ranging from 0 to 1. In clinical research, there is a common phenomenon that different diseases present trend to the prevalence of different symptoms. To highlight heterogeneity, the association strength between symptom and disease is measured as follows by Equation 8:
where is the number of diseases, and is the number of diseases with symptom . denotes if symptom and disease is co-occurrent. The symptom-based disease similarity between disease pairs can be calculated as follows by Equation 9:
where and donate the symptom vector of the disease and , respectively.
2.3.2 Disease semantic similarity
Semantic similarity is an important way of similarity measurement, which is widely applied to predict association. Therefore, we adopted semantic similarity to calculate the similarity between diseases. First, we downloaded MeSH descriptors from the National Library of Medicine,1 and each disease is represented by a directed acyclic graph (DAG) structure based on MeSH descriptors. By defining a semantic value for each disease, we calculated the semantic similarity between the two diseases. The semantic similarity between 0 and 1 is transformed into the disease semantic similarity matrix (Yin et al., 2022a). For disease , , where T( ) denotes the nodes in , and refers to the edges in . The semantic contribution value of disease to disease can be calculated as . We can get the semantic value of the disease and the semantic similarity .
In addition, the semantic contribution value of the disease to disease can be calculated as and the semantic value of disease is presented as . For disease and disease , the semantic similarity value is presented as . The final disease semantic similarity can be formulated as follows by Equation (10):
2.3.3 Disease gene functional similarity
Furthermore, we computed the disease functional similarity with disease-related genes. The underlying assumption is that phenotypically similar diseases usually interact with similar genes. The interactions between genes are available from the HumanNet dataset (Kim et al., 2022), in which an associated log-likelihood score (LLS) is used to evaluate the possible functional linkage between gene pairs. Given diseases and , the functional similarity can be formulated as follows by Equation 11:
where and denote gene sets of and , respectively. The functional association between a gene and a gene set is defined as follows by Equations 12, 13:
where denotes the functional similarity score between gene and gene with log-likelihood score formula (LLS) (Kim et al., 2022).
2.3.4 Microbe sequence similarity and evolutionary distance similarity
In molecular biology, the genetic sequences of microorganisms usually are considered to determine their structure, function, and behavior. Sequence similarity can measure how closely two related sequences are at the molecular level. Techniques, such as sequence alignment and comparison, are used to determine the degree of similarity between the nucleotide or amino acid sequences of different microorganisms. Higher sequence similarity suggests a closer evolutionary relationship, while lower similarity may indicate a more distant evolutionary divergence. In this study, we downloaded 16S rRNA gene sequences of microbiota in datasets from NCBI and compared the targeted sequence against the rest sequences in turn by the Basic Local Alignment Search Tool (BLAST+)(Camacho et al., 2009). The similarity value can be estimated based on the consistency of nucleotide sequences, where the normalized microbe sequence similarity matrix MIS consists of the identity of the alignment Equation 14.
where denotes a matrix about the identity of the alignment with size m × m.
Furthermore, we consider the microbe evolutionary distance under the p-distance model, which represents the number of nucleotide substitutions occurring between a pair of sequences. The evolutionary distance score is obtained by applying MEGA7(Tamura et al., 2021), and the normalized evolutionary distance similarity can be expressed as follows Equation 15:
where the is the evolutionary distance score between microbe and .
2.3.5 Microbe similarity based on disease semantic
We followed the hypothesis that functionally similar microbes are implicated in similar diseases (Wang et al., 2023) and obtained the microbe similarity based on disease semantics. If microbes and refer to the disease sets and , respectively, the max similarity between a disease and disease set is defined as follows Equation 16:
where is the disease semantic similarity between and , the final similarity between microbe and is calculated as follows Equation 17:
2.4 Construction of microbe–disease heterogeneous network
It is well known that precisely predicting microbe–disease association underlying a robust microbe–disease heterogeneous network. However, most studies insufficiently consider the similarity network of the biological entities (disease or microbe) in terms of different attributes (interaction profile and biological function information), to scream potential microbe-disease pairs due to the diversity of biological data.
In this study, we constructed the similarity networks for biological entities, respectively, where each similarity network considers different fusion strategies including the network topology based on the interaction profile and the biological function as illustrated in Figure 1.
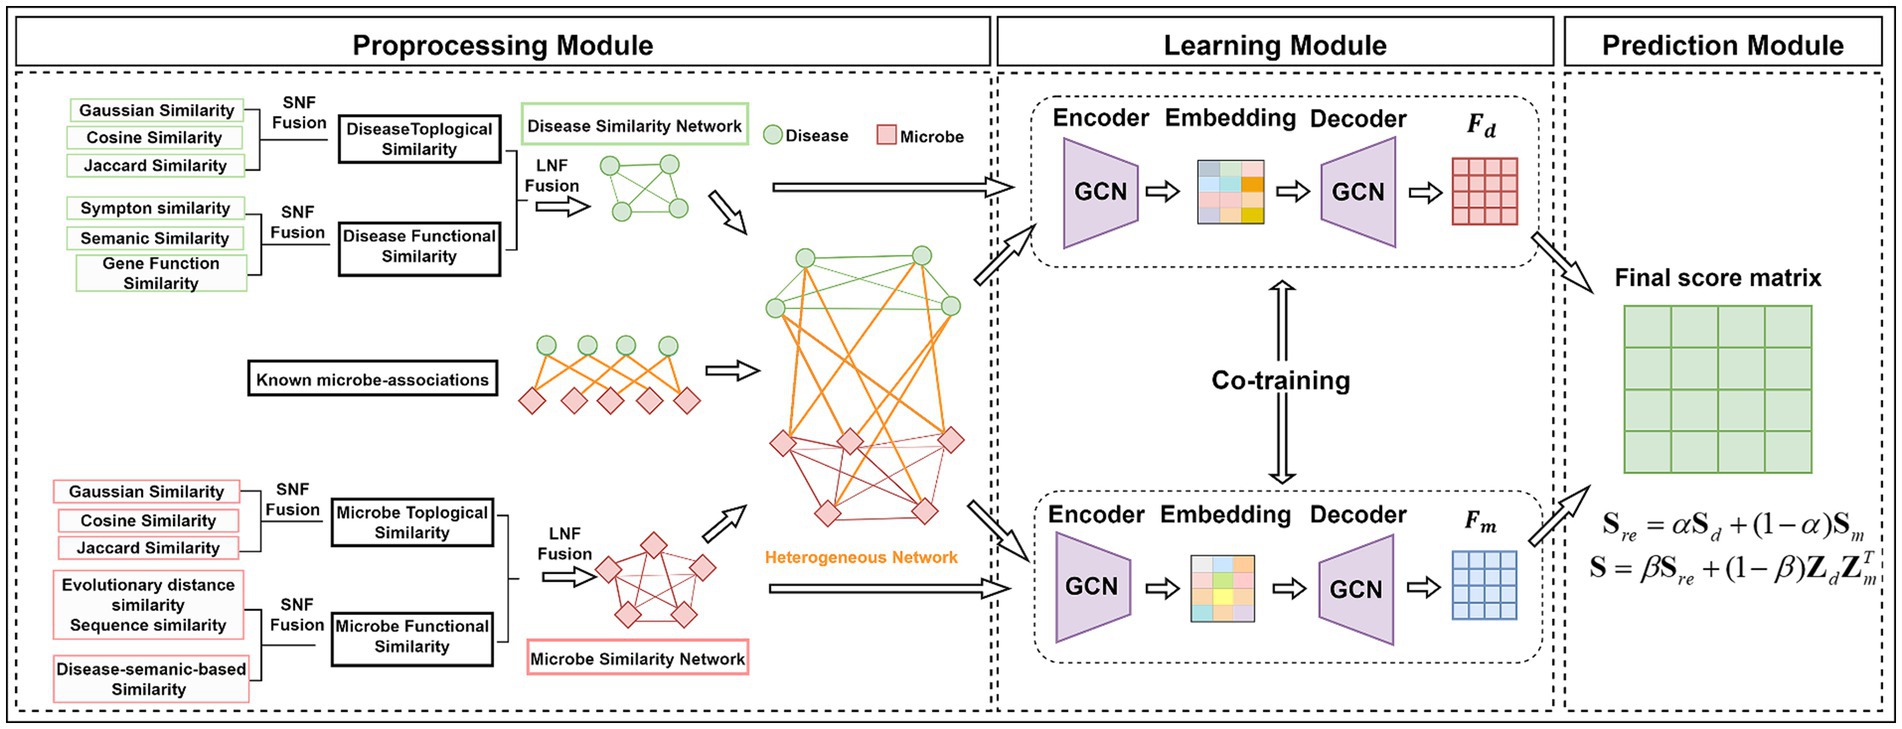
Figure 1. The flowchart of the GIMMDA model.
2.4.1 Fusion strategy within the same attributes
For the same attributes (network topology based on interaction profile or biological function information), we adopted similarity network fusion (SNF) (Wang et al., 2014). SNF is a nonlinear combination method, which is used to fuse the similarity of the same biological entities from different similarity metrics.
In the SNF procedure, after defining the similarity matrix W of each view data, a normalized weight matrix P and a local affinity matrix S are constructed. Then, the fusion process based on message-passing theory starts from as the initial state and as the kernel matrix to iteratively update the similarity matrix on datasets Equation 18:
The final similarity matrix can be defined as by Equation 19:
For the disease entity, we derive the disease topological similarity matrix by integrating three similarity metrics (GD, CD, and JD), and disease functional similarity matrix under considering similarity metrics (SymD, SeD, and FunD). In addition, microbe topological similarity and microbe functional similarity matrix are obtained similarly.
2.4.2 Fusion strategy between different attributes
Furthermore, the disease similarity and microbe similarity are integrated by linear fusion (LNF) as follows Equations 20, 21:
where is a weight parameter that controls topological similarity and functional similarity. Finally, the microbe–disease heterogeneous network is constructed based on similar networks , , and microbe–disease association A.
3 Method
In this study, we adopted an end-to-end framework GIMMDA to predict latent microbe–disease associations integrating the graph autoencoder and inductive matrix completion. The overview of the GIMMDA framework is shown in Figure 1. First, the preprocessing module integrates information from different biological sources using SNF and LNF methods. Second, the learning module learns new latent feature representations of microbes and diseases based on the graph autoencoder and inductive matrix completion. Finally, the prediction module utilizes the score matrix constructed from node representations of graph autoencoder to predict the potential microbe–disease interactions.
3.1 Graph autoencoder
Graph autoencoder is popularly applied to unsupervised learning and link prediction. Usually, graph autoencoder consists of the encoder and decoder, where the graph encoder generates an embedding matrix taking a feature matrix and a graph adjacency matrix , and the decoder reconstructs the graph adjacency matrix or node features matrix using pairs of node embedding vectors.
Here, we applied the graph autoencoder framework to obtain node representations on the disease network and microbe network, respectively, where the microbe–disease association matrix is regarded as the node attributes. First, we adopted graph convolution encoders to generate the node representation by aggregating node information from neighbors and graph structure information (Kipf and Welling, 2016) Equations 22, 23.
where and are the learnable weight parameters, and and denote the normalized adjacency matrix of the disease graph and microbe graph, respectively.
At the decoder part, we reconstruct the microbe–disease association matrix with the embedding of the diseases and microbes Zd and Zm, respectively, which can be expressed as follows Equations 24, 25:
where and are trainable parameter matrices.
In the graph autoencoder framework, we minimized the reconstruction loss of node features as follows by Equation 26:
where is the balance factor between the microbe and disease spaces.
3.2 Inductive matrix completion
Inductive matrix completion (IMC) usually is considered as transductive multi-label learning, where the association matrix can be generated by applying feature representations of its row and column entities to a low-rank matrix Z. In microbe–disease association prediction, the goal is to recover a feature projection matrix Z using the known microbe–disease association matrix , which can be formulated as an optimization problem as follows by Equation 27 (Li et al., 2020):
where and are the new embedding representations of microbes and diseases, respectively. denotes the embedding dimension, and are the learnable weight parameters. The inductive matrix completion loss can be defined as follows by Equation 28:
3.3 Collaborative optimization
Minimizing is equivalent to training graph autoencoders on microbe and disease networks, respectively. However, previous studies have shown that collaborative training can improve the accuracy of predicting associations of biological entities (Jin et al., 2021; Shi et al., 2021). We defined the total loss of GIMMDA as follows by Equation 29:
Let , the above equation can be rewritten as follows by Equation 30:
where is the balance factor between reconstruction loss and inductive matrix completion loss. The Adam (Jin et al., 2021) optimizer is used for optimization. Finally, the predicted score matrix is obtained under the optimal model parameters follows by Equation 31.
where .
The detailed steps of GIMMDA are summarized in Algorithm 1.
ALGORITHM 1. GIMMDA algorithm
Input: initial interaction matrix
Output: final score matrix
1: Compute the disease similarity matrix and the microbe similarity matrix
2: Compute the adjacent matrix of the disease graph and microbe graph respectively
3: repeat
4: Learn the embedding vectors of diseases and microbes via Encoder (expression here is defined in Equations 22, 23)
5: Reconstructed score matrix via Decoder (expression here is defined in Equations 24, 25)
6: Train the new feature representations of disease and microbe space through optimizing and update (i.e., parameters of graph convolutional networks) by Adam optimizer
7: Until Convergence
8: return
4 Results
4.1 Experiment setting
In our experiments, we performed a 5-fold CV on the association matrix under three different settings: a global test adopts randomly zeroed values to the association matrix; a horizontal test for diseases where rows of the association matrix are randomly zeroed; and a vertical test for microbes where columns of the association matrix are randomly zeroed.
The global test compares the ability to identify latent microbe–disease associations on all methods. Horizontal tests for diseases and vertical tests for microbes compare the ability to predict new diseases and microbes, respectively. To reduce the impact of random splitting on performance, we repeated the 5-fold CV of each method 10 times. The average AUC, F1 score, accuracy, sensitivity, and specificity values are used as the performance indicators.
4.2 Parameter selection
The proposed GIMMDA model involves six important hyperparameters, such as the learning rate , the dimension of the embedding , the disease and microbe spatial balance factor , the loss-term balance factor , the decay factor of regularization and the number of iterations epochs. It is worth noting that we used the global test in a 5-fold CV for parameter selection under the multiMDA dataset and considered different combinations of all parameters by grid search. As shown in Figure 2, our proposed model performs best when , , , , and
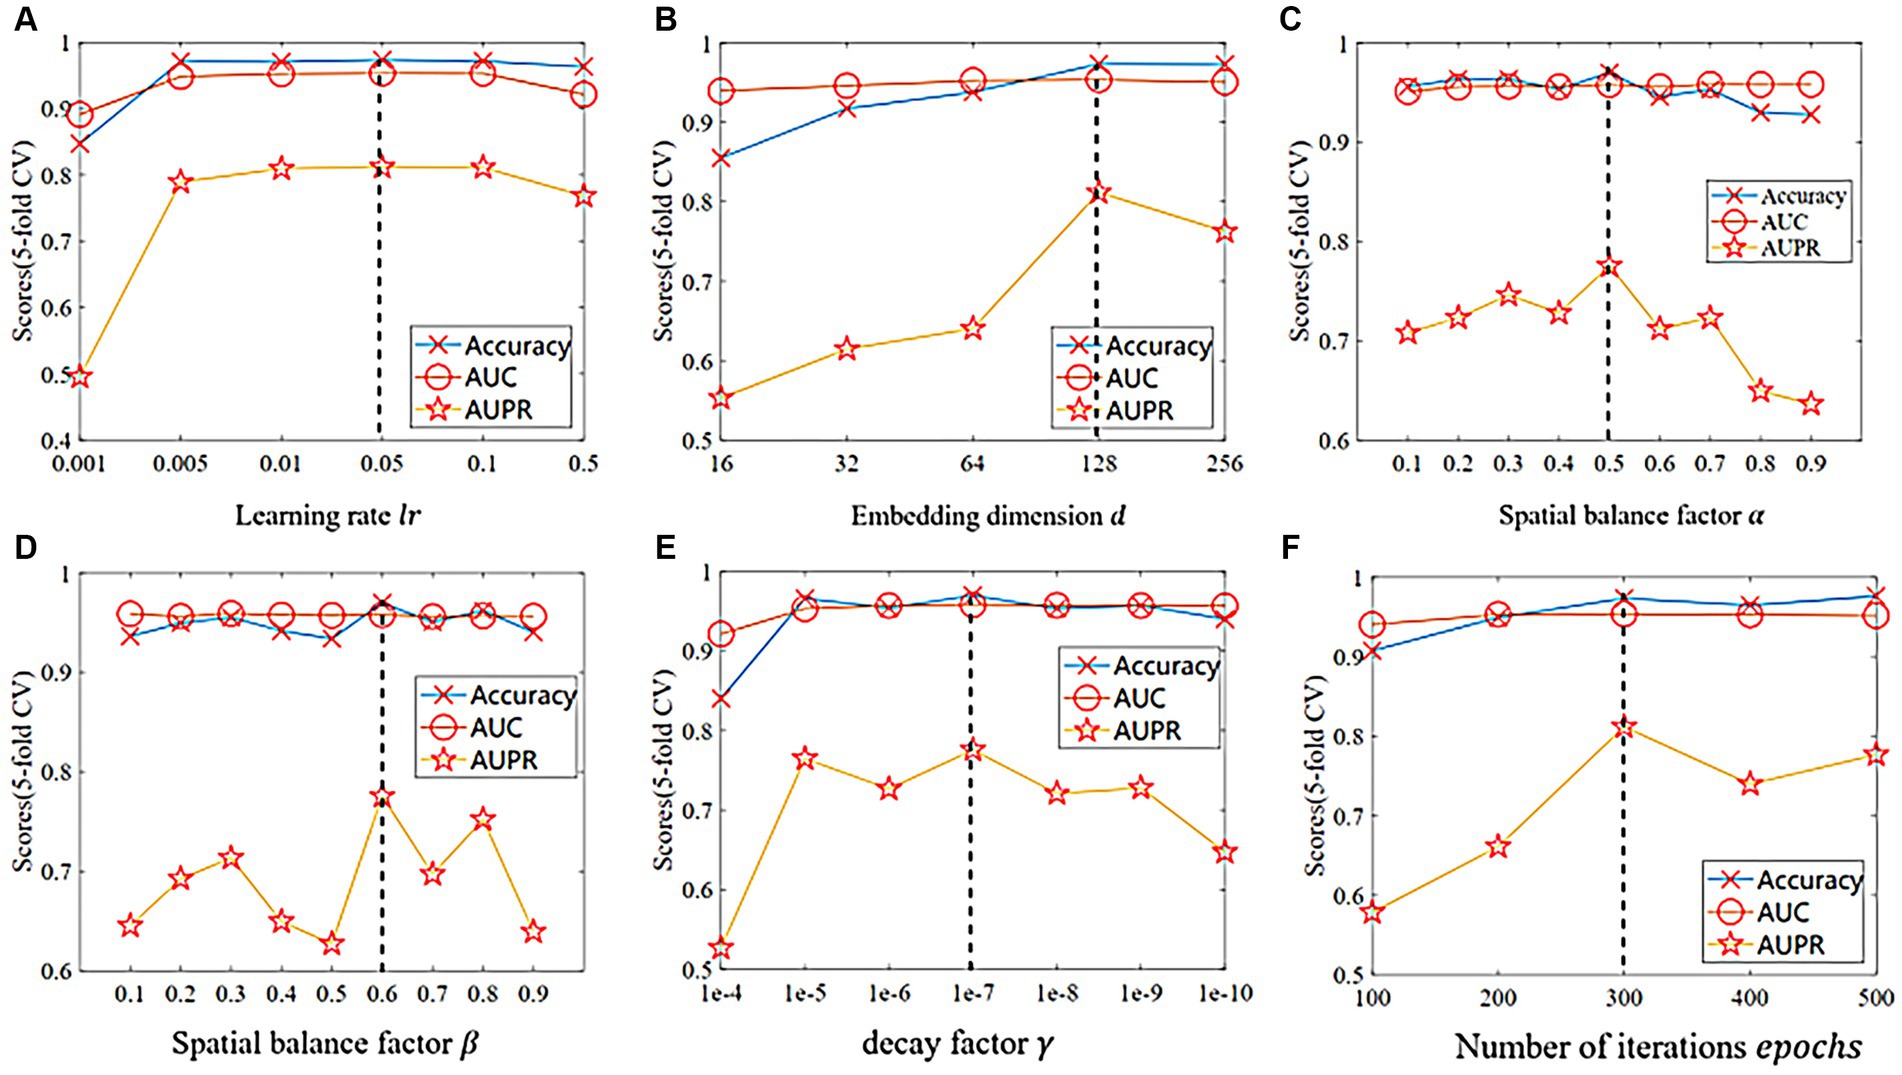
Figure 2. The comparison of different indicators in 5-fold CV on the multiMDA dataset for (A) learning rate , (B) embedding dimension , (C) spatial balance factor , (D) loss balance factor , (E) decay factor , and (F) number of iterations epochs.
4.3 Performance evaluation
In this study, we compared the proposed GIMMDA model with nine other state-of-the-art methods, including classical network-based methods [KATZHMDA (Chen et al., 2017), BRWMDA (Yan et al., 2020), and NTSHMDA (Luo and Long, 2020)], matrix factorization models [NBLPIHMDA (Wang et al., 2019) and MDLPHMDA (Qu et al., 2019)], and machine learning and deep learning models [LRLSHMDA (Wang et al., 2017), GATMDA (Long et al., 2021), BPNNHMDA (Li et al., 2021), and MVFA (Peng et al., 2023)].
Table 2 shows the performance comparison between GIMMDA and the other 9 methods in the global test of 5-fold CV based on HMDAD and Disbiome datasets. We observed that the AUC, F1 score, and accuracy values of the GIMMDA achieved 0.9735 ± 0.0050, 0.9140 ± 0.0239, and 0.9817 ± 0.0051 on the HMDAD dataset, which was the highest among all compared methods. Compared with the second-best method MVFA, the GIMMDA increased the AUC, F1 score, and accuracy by 2.17, 3.85, and 2.47%, respectively. On the Disbiome dataset, the GIMMDA also achieved the best performance in AUC, F1 score, accuracy, sensitivity, and specificity, which were 0.54, 7.5, 2.08, 12.31, and 9.36%, respectively, better than the second-best method MVFA.
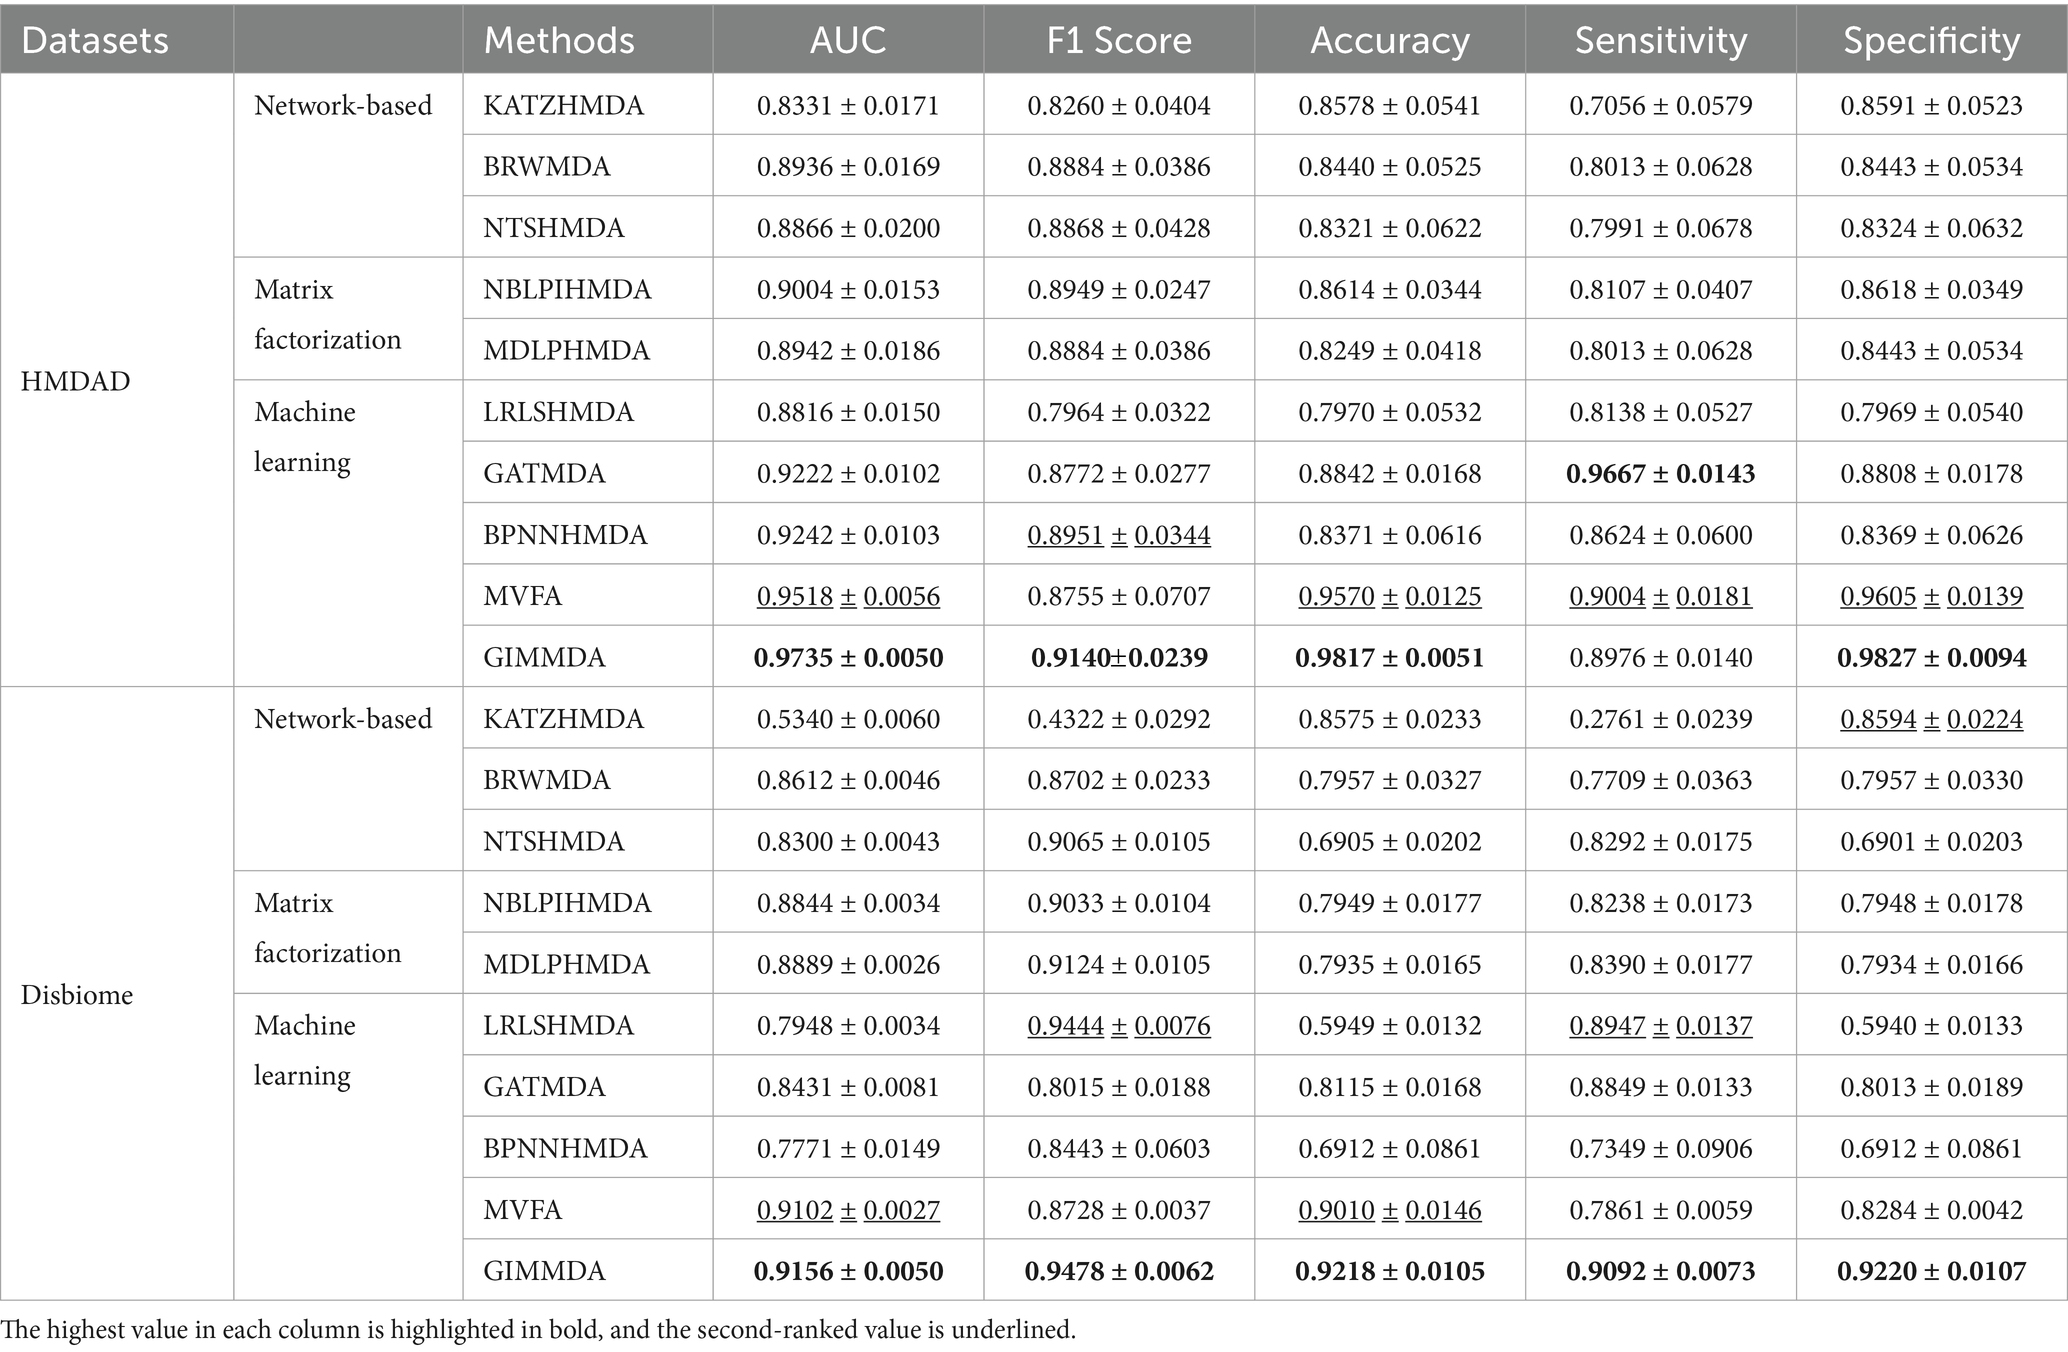
Table 2. Performance comparison of the 10 methods under the global test of 5-fold CV on HMDAD and Disbiome datasets.
In addition, we validated the robustness of these 10 methods on a multiMDA dataset. Figure 3 illustrates the area under the receiver operator characteristic (AUROC) curve and the area under the precision-recall curve (AUPRC) of the 10 MDA prediction models using the 5-fold CV on microbe–disease pairs.
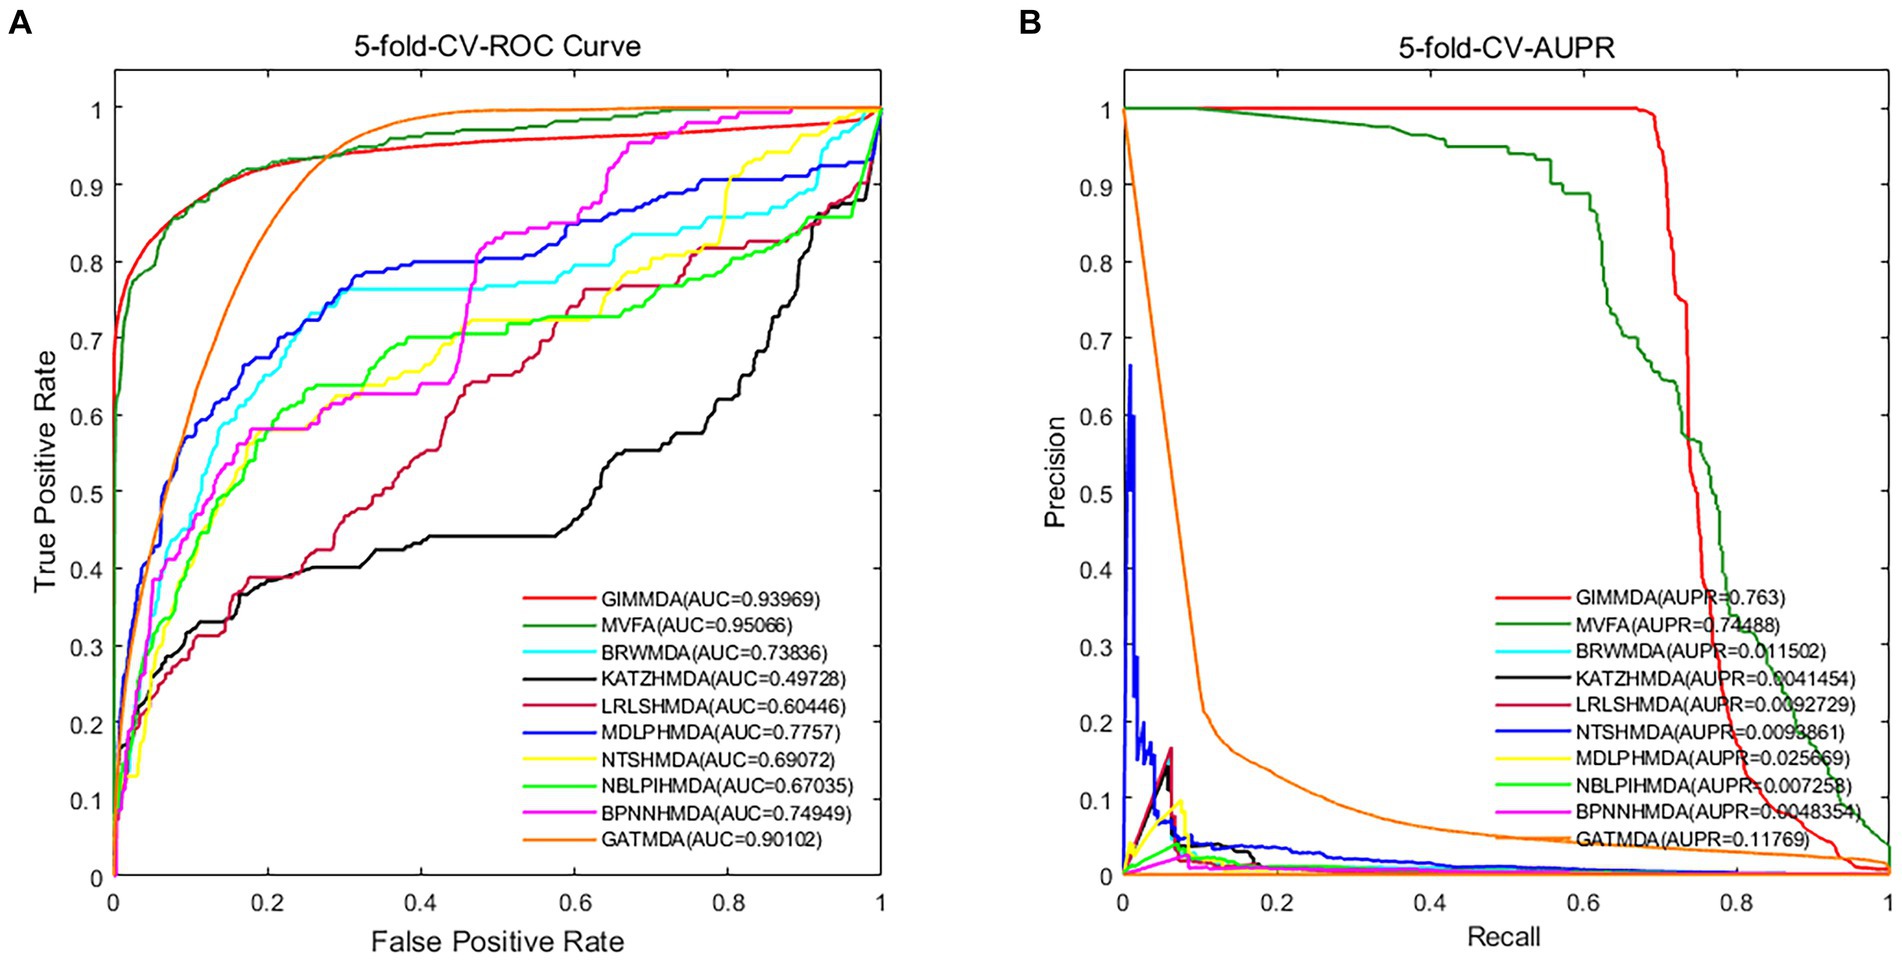
Figure 3. Performance comparison using the global test 5-fold CV on a multiMDA dataset for (A) AUROC; and (B) AUPRC.
Under the 5-fold CV, the GIMMDA computed a better AUC value of 0.93969 and the best AUPRC value of 0.763 among the 10 methods. These results demonstrated that the proposed GIMMDA model also achieved the best comprehensive performance compared with the other nine state-of-the-art methods on the multiMDA dataset, confirming the validity and robustness of our proposed model.
4.4 Ablation study
To verify whether our model can be applied to new diseases or new microbes without known associations, we performed the horizontal test for diseases and the vertical test for microbes with a 5-fold CV on the HMDAD and Disbiome datasets.
4.4.1 Performance comparison under CV on diseases
As shown in Table 3, our method still outperformed other models under CV on diseases, 80% of diseases were taken as the training set and the remaining was used as the test set. The GIMMDA obtained the AUCs of 0.6763 and 0.7123, the AUC and F1 score values of the GIMMDA ranked second, and the accuracy value ranked third respectively, outperforming LRLSHMDA, NTSHMDA, BRWMDA, NBLPIHMDA, MDLPHMDA, and KATZHMDA models.
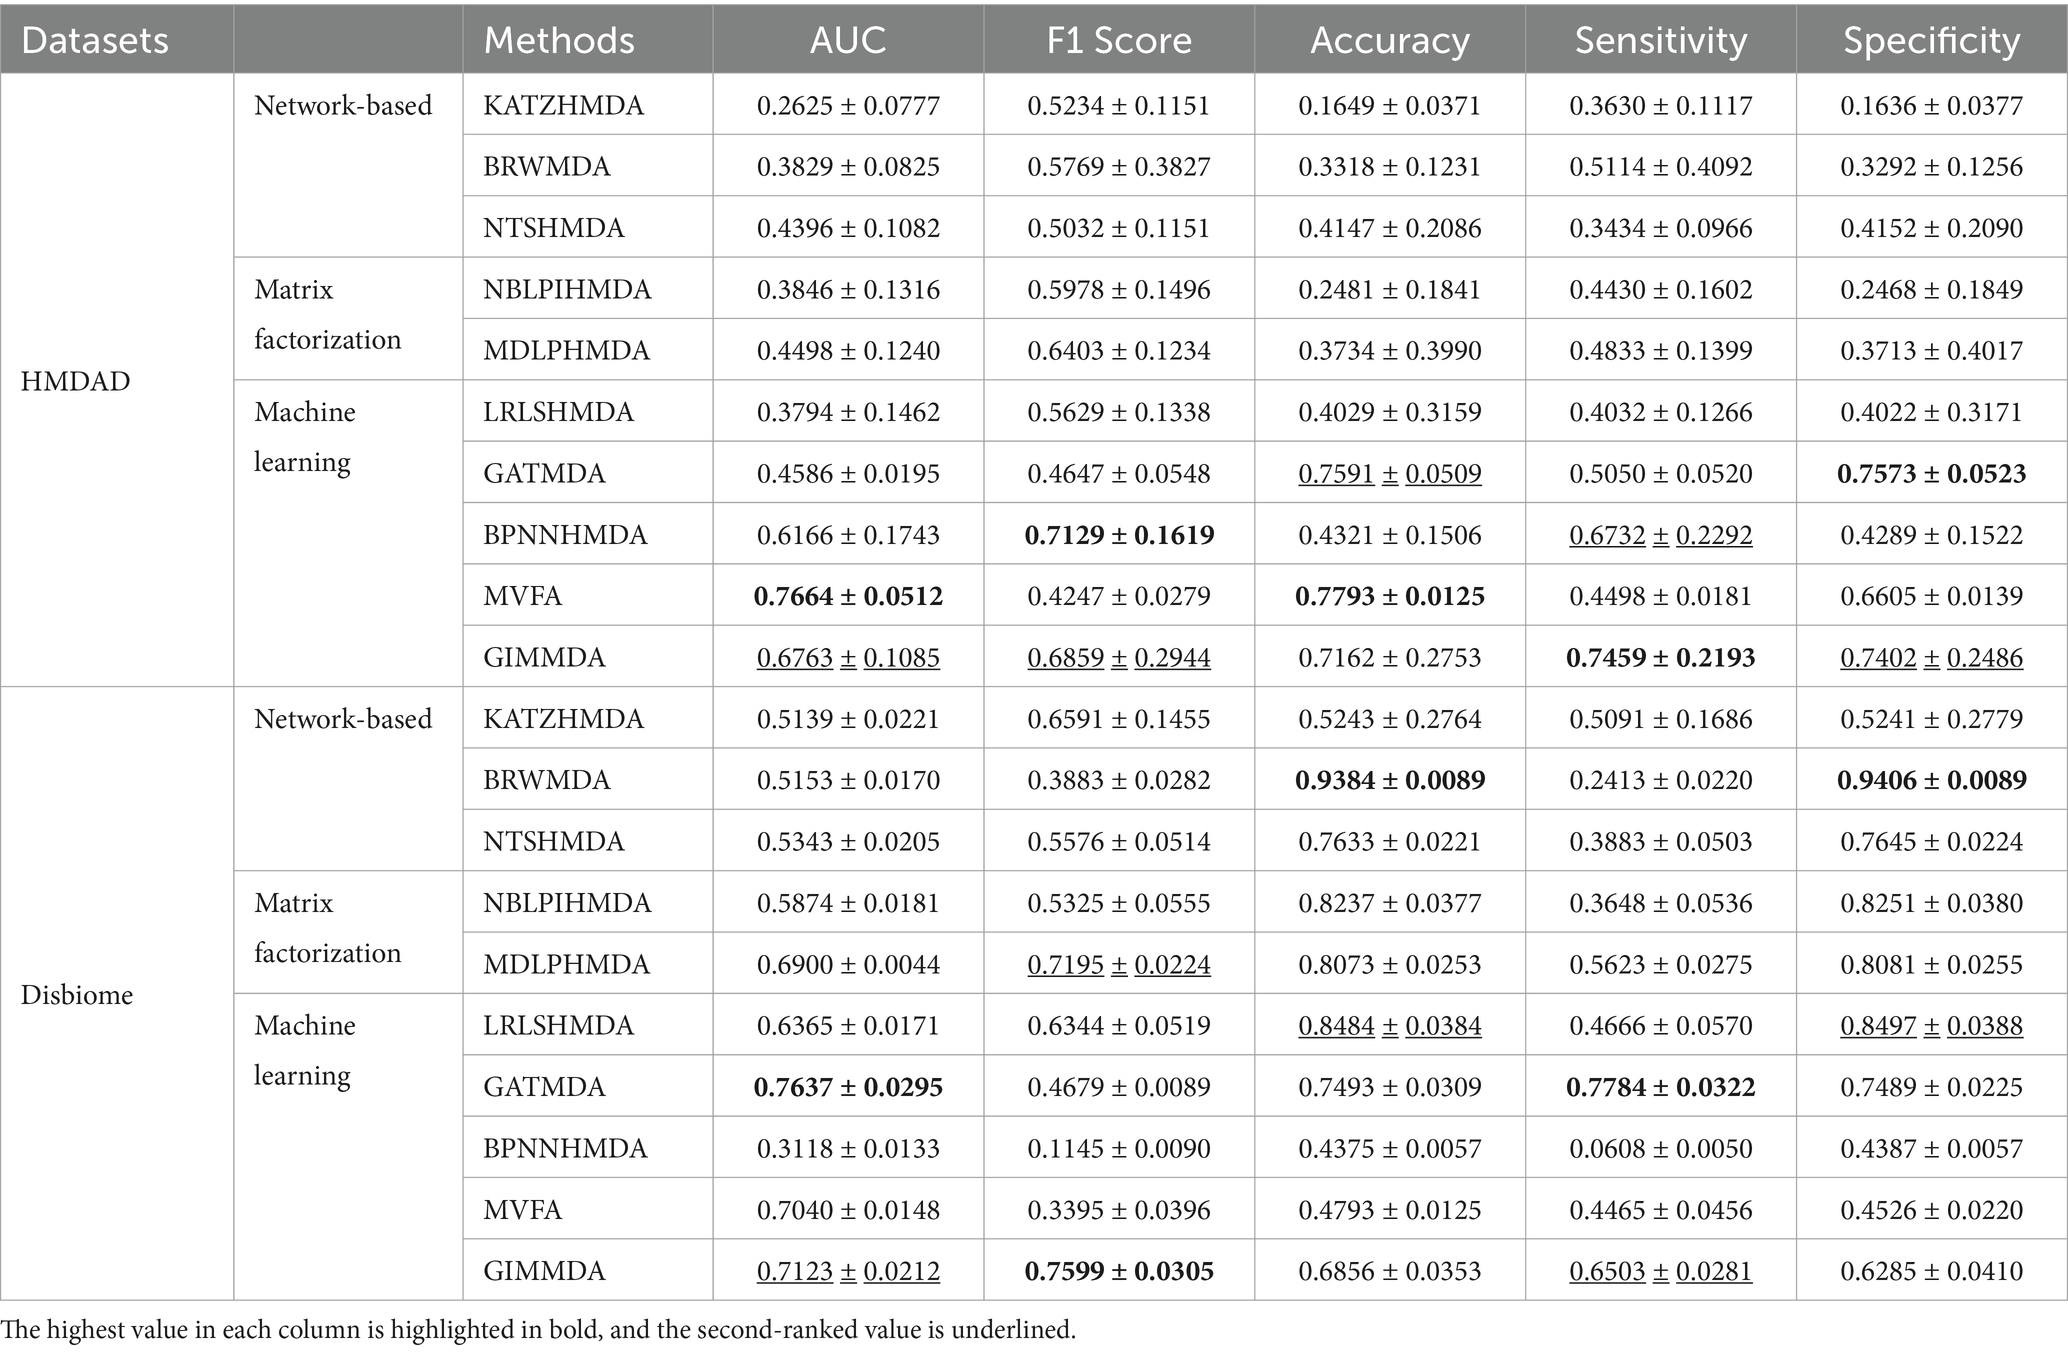
Table 3. Performance comparison of the 10 methods under horizontal test for disease using 5-fold CV on HMDAD and Disbiome datasets.
4.4.2 Performance comparison under CV on microbes
Under CV on microbes, 80% of microbes were taken as the training set and the remaining was used as the test set. Table 4 shows the performance compared with the other nine methods under CV on microbes. The GIMMDA obtained better AUC values of 0.94168 and 0.7685 compared to LRLSHMDA, NTSHMDA, BRWMDA, NBLPIHMDA, MDLPHMDA, and KATZHMDA models.
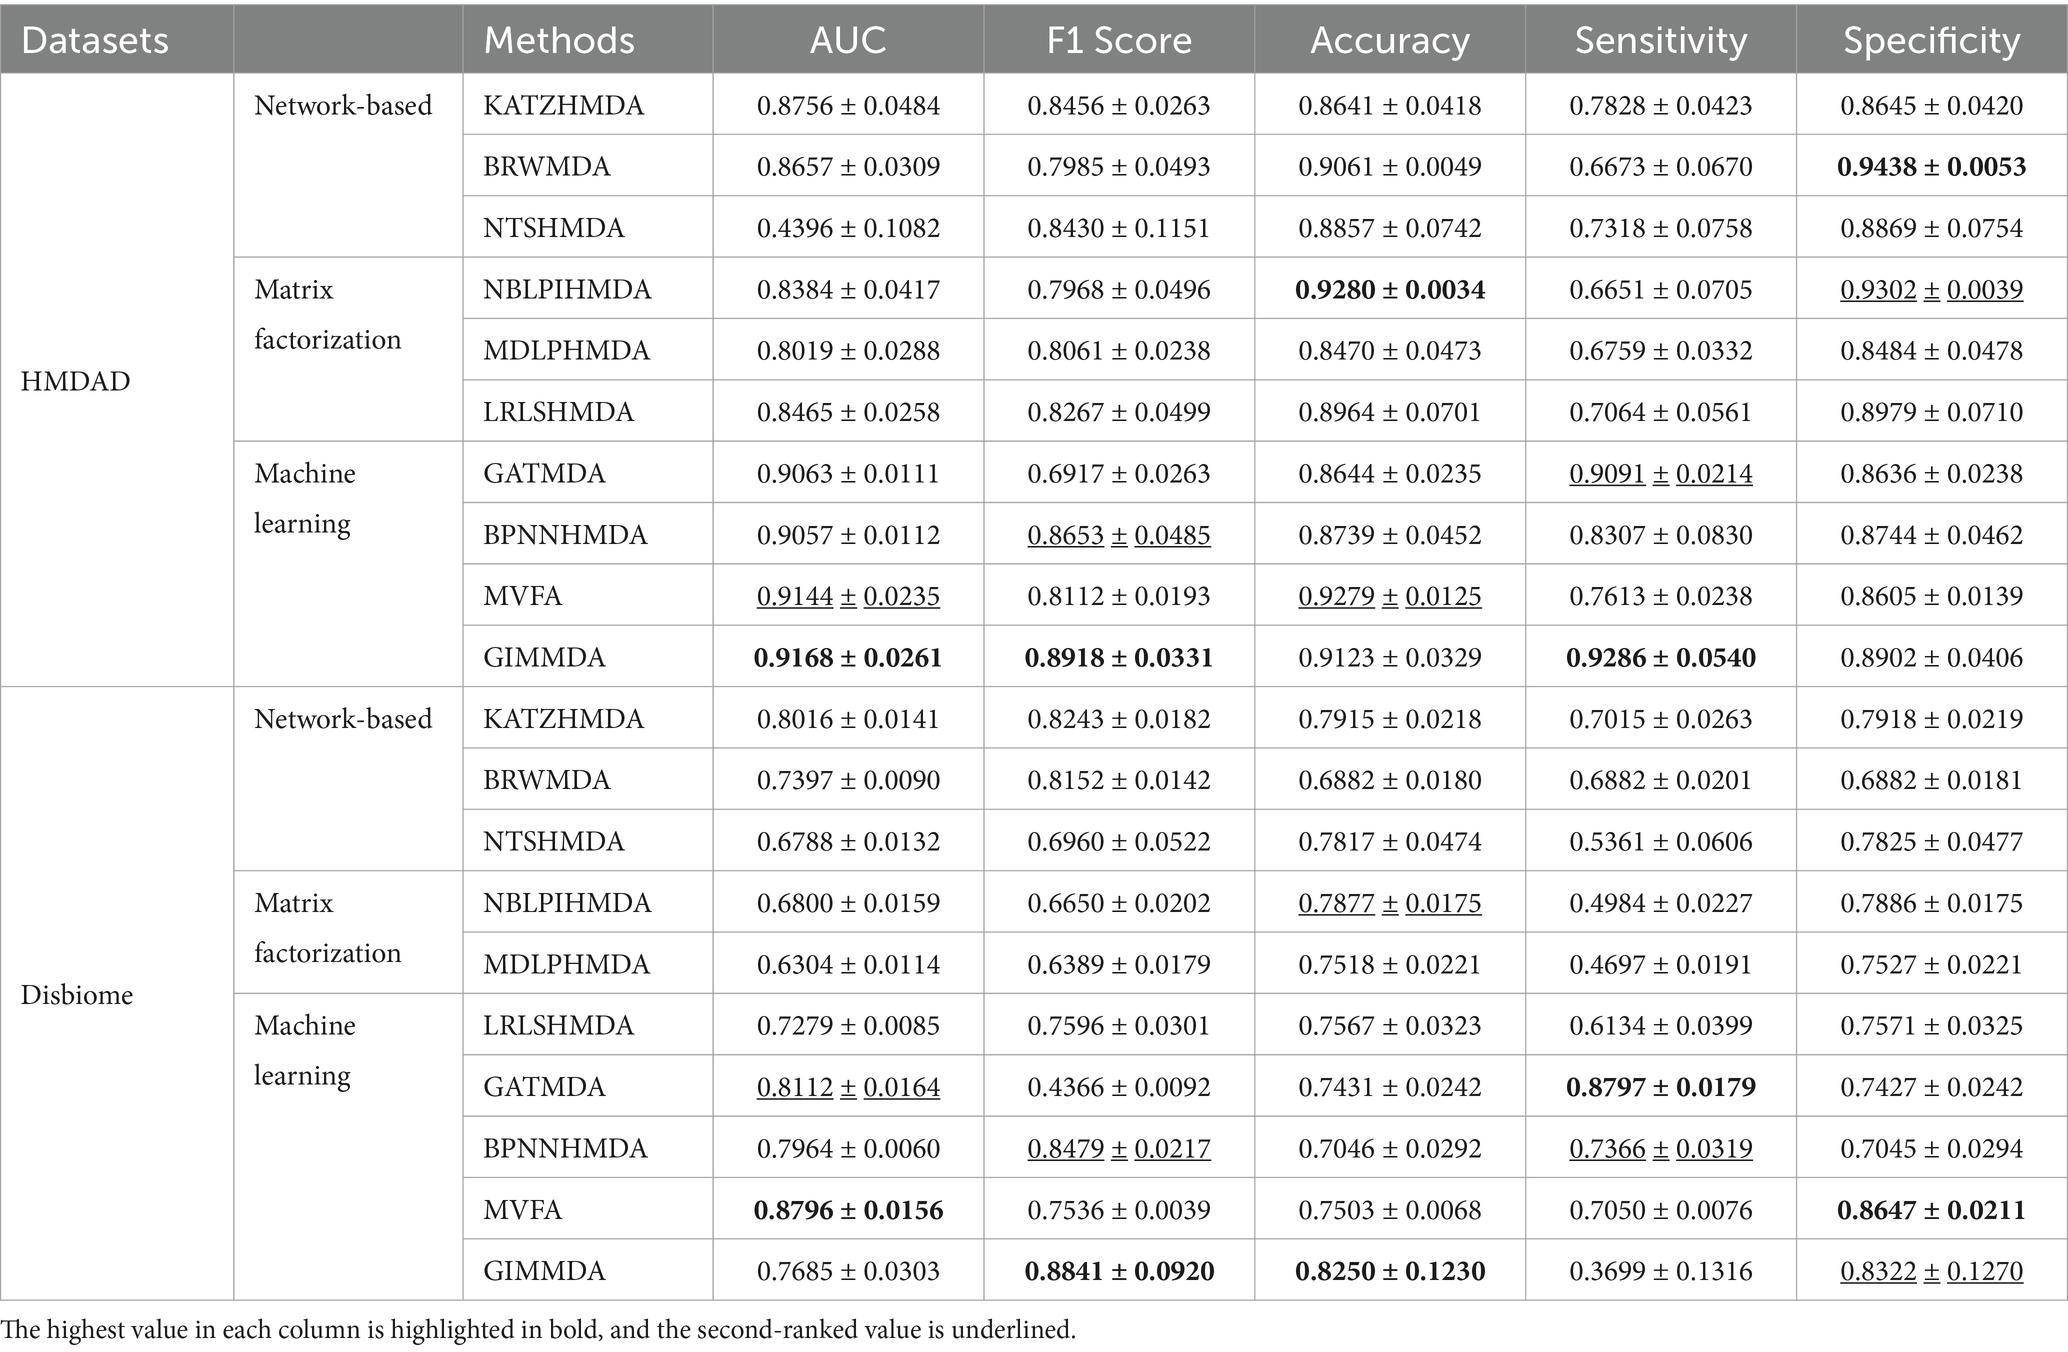
Table 4. Performance comparison of the 10 methods under vertical test for microbes using 5-fold CV on HMDAD and Disbiome datasets.
4.4.3 Performance comparison under different similarity fusion methods
To verify the effectiveness of our proposed similarity fusion method, we compared the model performance while using the proposed strategy and the other 3 similarity fusion methods.
Proposed strategy (SNF-LNF): the proposed similarity fusion strategy was explained in detail in Section 2.4. We set the optimal parameter as 0.5.
Compared strategies:
Strategy 1 (LNF-LNF): for the same attributes within network topology or biological function information and different attributes between network topology and biological function information, we all selected the LNF method to average the similarity matrixes.
Strategy 2 (SNF-SNF): in this strategy, we adopted the SNF method to fusion all similarity matrixes constructed from network topology and biological function information.
Strategy 3 (LNF-SNF): it took the opposite method to our proposed strategy, LNF was applied to fuse the same attributes and SNF was used for similarity fusion between different attributes.
The comparison results of our proposed method and the other three strategies are shown in Figure 4. We can observe that the AUC of strategy 3 was 0.42% higher than our method. However, the F1 score and accuracy of our method were 6.18 and 1.64% higher than the strategy 3.
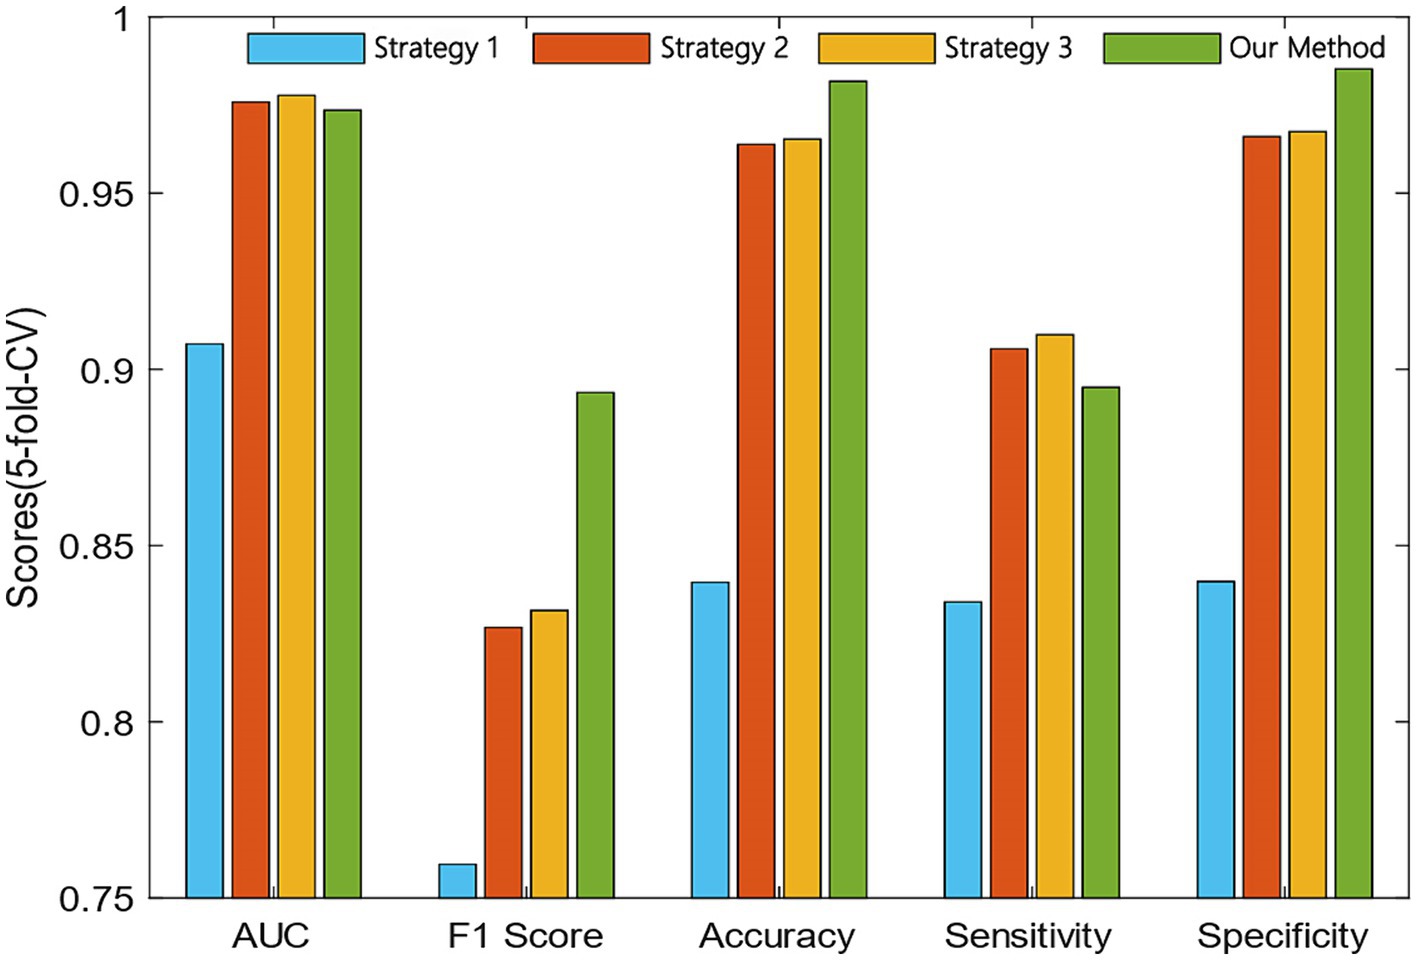
Figure 4. Comparative analysis of the proposed and compared similarity fusion methods.
4.5 Case study
To further validate the predictive performance of the proposed GIMMDA, we selected two common diseases, i.e., asthma and obesity as case studies on the multiMDA dataset. After excluding known related microbes for these two diseases, the top 20 microbe candidates were selected based on the ranking scores for validation by searching previous publications. The results showed that 19 and 14 of the top 20 bacteria linked to asthma and obesity were confirmed by previous literature studies. Tables 5, 6 present the findings of the literature validation of the top 20 predicted microbes linked to obesity and asthma.
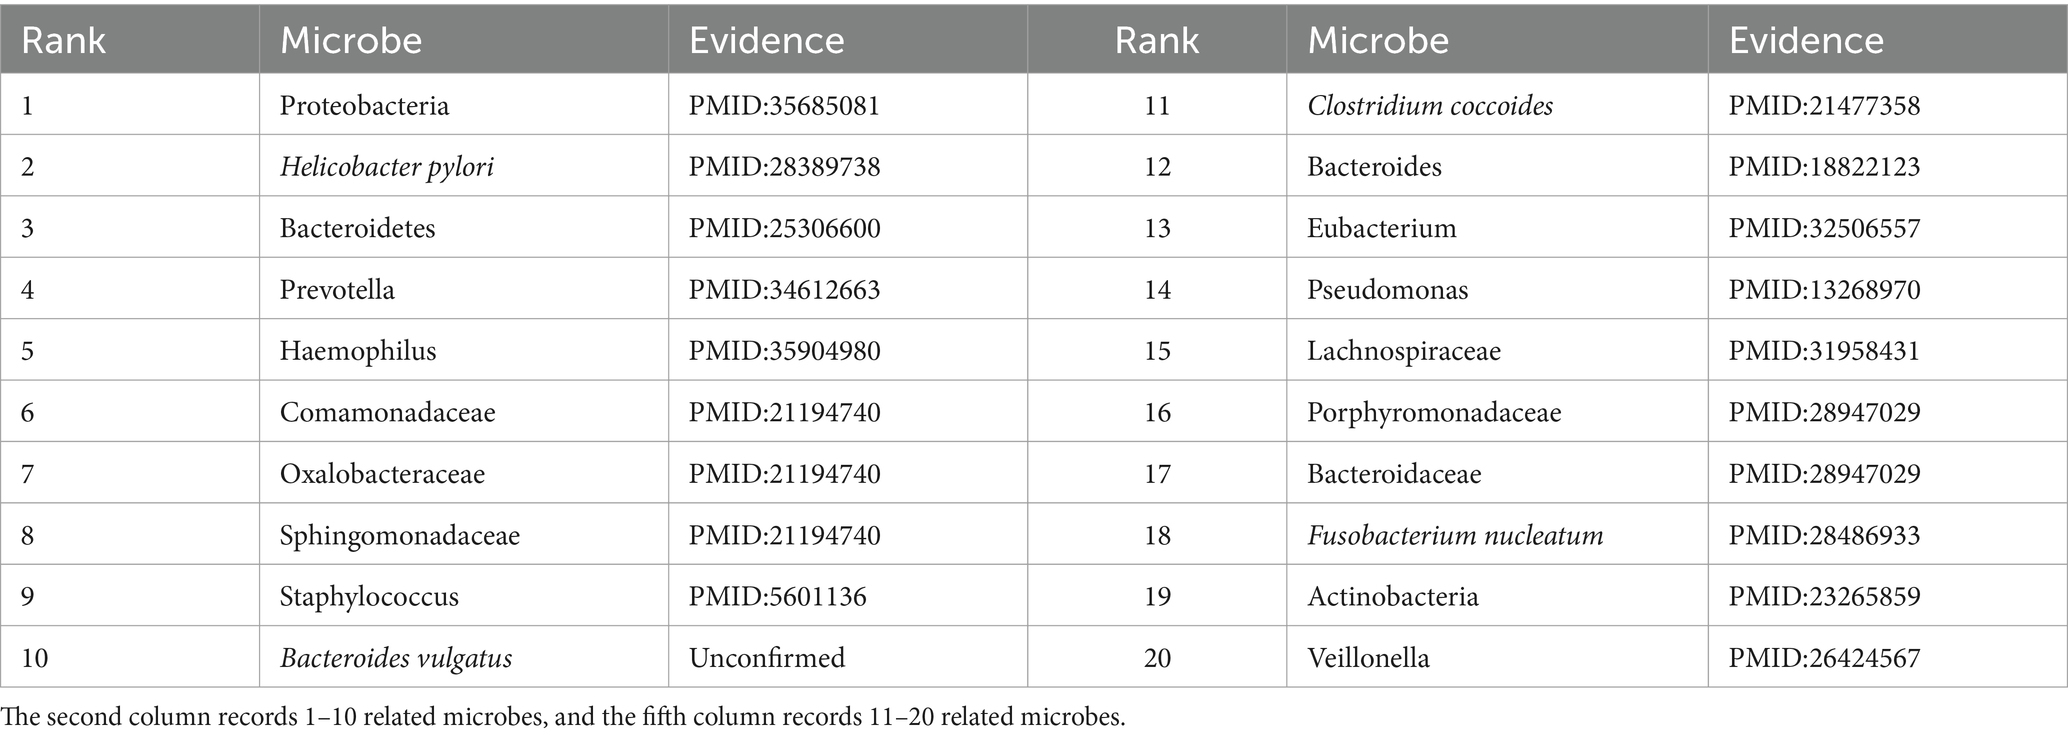
Table 5. Prediction results of the top 20 asthma-associated microbes.
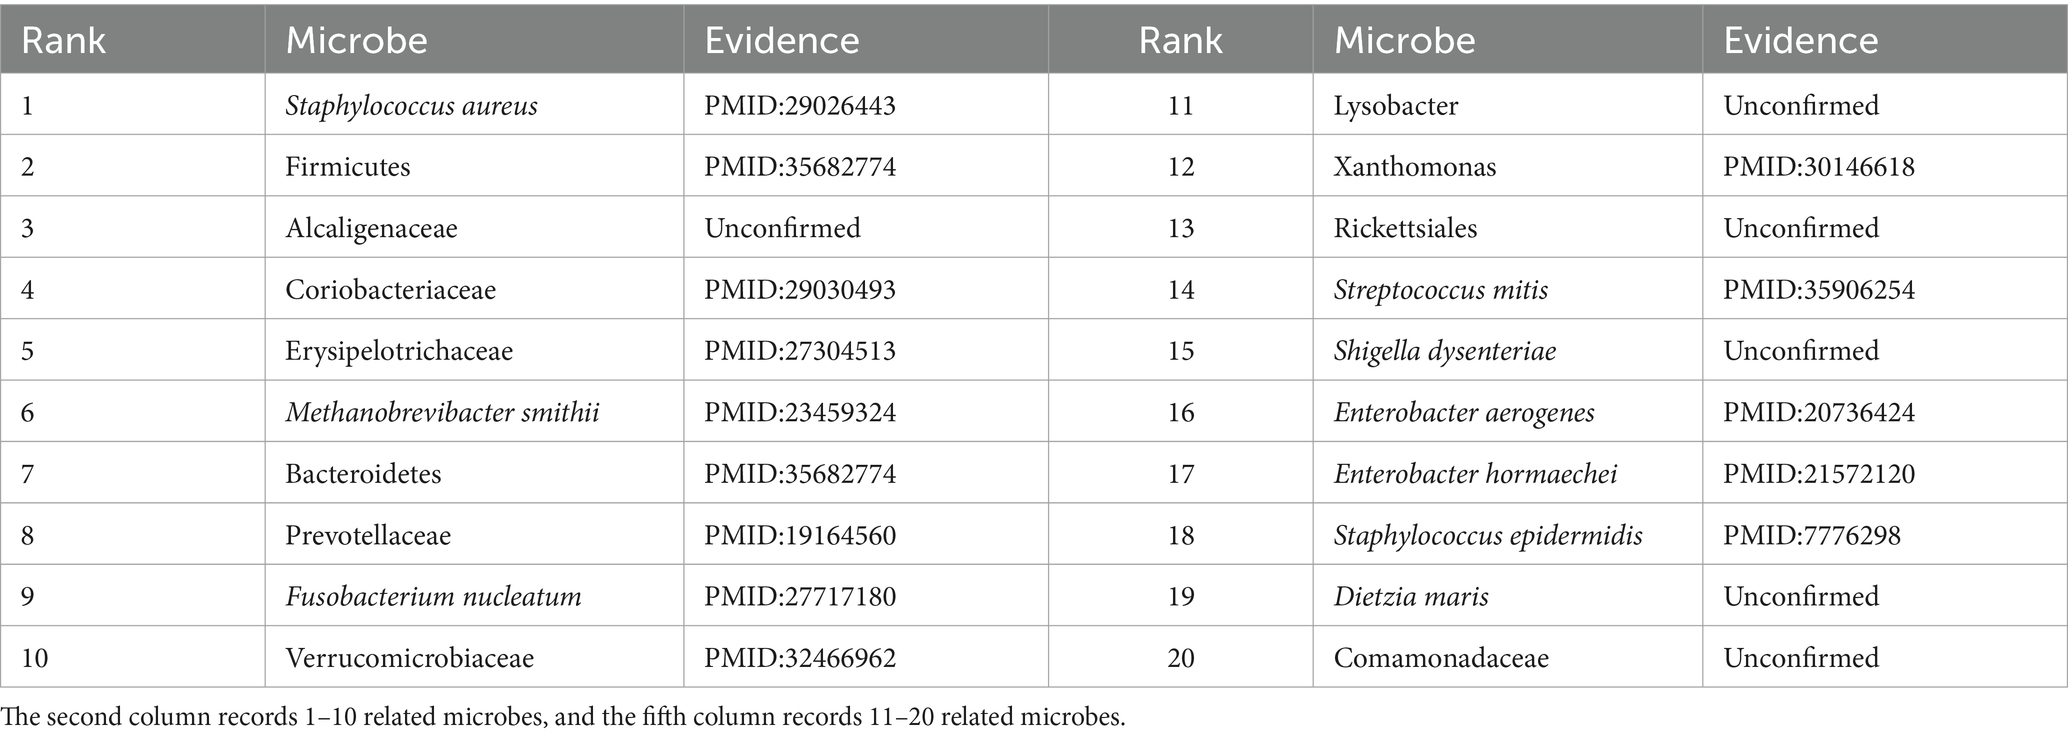
Table 6. Prediction results of the top 20 obesity-associated microbes.
Asthma is a common chronic inflammatory disease of the airways that is estimated to affect more than 300 million people worldwide over the life course (Varkonyi-Sepp et al., 2022). A large literature has reported that the development of asthma is closely related to genes, the environment, and specific microbes in the gut or respiratory tract (Frei et al., 2022). In our predictions, Proteobacteria, Helicobacter pylori, Bacteroidetes, and Prevotella were the most relevant influencing factors for asthma in the top 20 score list. Zhang et al. found that the relative abundance of Proteobacteria was significantly enrichment and lower levels of Bacteroidota (synonym Bacteroidetes) in the asthma patients group compared to that in the control group (Zhang et al., 2022). Wang D. et al. (2022) demonstrated a significant inverse correlation between Helicobacter pylori infection and asthma. Clinical studies have shown that patients with asthma have reduced numbers of Prevotella compared to healthy individuals (Gu et al., 2023). Except for microbes validated by literature, Bacteroides vulgatus has no direct evidence of an association with asthma. There was a report that Bacteroides vulgatus appeared to increase in relative abundance in depression patients (Liang et al., 2022), where depression was a comorbidity of asthma (Tamayo et al., 2024). In other words, conventional biological experiments will further verify the significant role that microbes play in asthma, for which there is currently no direct evidence.
Obesity is another major global health problem determined by genetics and environment, and its incidence is increasing every year (Liu B. N. et al., 2021). Extensive studies have shown that gut microbiota is an important factor in the development of metabolic diseases such as obesity. Megur, Daliri, Baltriukiene, and Burokas (Megur et al., 2022) detected that obesity is associated with an increase in the number of Firmicutes and a decrease in the diversity of Bacteroidetes, where they were all in the top 20 score list. In addition, Alcaligenaceae in the top 20 score list was rarely reported about obesity, but Ishaq, Mohammad, Hussain, Parveen, Shirazi, Fan, Shahzad, Hayat, Li, Ihsan, Muhammad, Usman, Zhang, Yuan, Ullah, Paiva-Santos, and Xu (Ishaq et al., 2022) found that the abundance of Alcaligenaceae was significantly reduced in patients with thyroid cancer compared with healthy individuals, where thyroid cancer had an association with obesity (Rahman et al., 2020). Another less-reported microbe related to obesity was Lysobacter. However, there was evidence that Lysobacter can produce cellulase, which has the potential use in preventing obesity and restoring intestinal homeostasis in obese individuals (Fu et al., 2021). In the future, microbes in our prediction results that have not been validated in literature may also serve as novel biomarkers for obesity. In conclusion, the prediction results illustrated that our proposed method can accurately and reliably predict the microbe–disease, which can contribute to the diagnosis, treatment, and prevention.
5 Discussion
In recent years, researchers have paid more attention to the associations between microbes and diseases. However, biological experiments are expensive and inefficient for screening the microbe–disease associations. Therefore, more and more computational methods are used to predict potential microbe–disease interactions. In addition, the primary challenges of computational models are the reliability of the data, the richness of prior knowledge, and the prediction accuracy of the model.
In this study, we developed an end-to-end deep learning framework GIMMDA based on graph autoencoders and the inductive matrix completion with multiple similarities fusion. First, we integrated and screened a new dataset (multiMDA) from six diverse association databases. Second, we fused the known microbe–disease association and different priori knowledge by SNF and LNF methods to the microbe similarity network and disease similarity network, respectively. Third, we learned the node feature representations by the information from node neighbors and itself based on graph convolutional networks. Finally, we adopted collaborative optimization of the loss to obtain the final microbe–disease association prediction scores. In addition, comparative experiments with nine other models and case studies of two diseases showed that our proposed GIMMDA model achieved superior predictive performance, excellent reliability, and broad application.
However, our proposed model still has some limitations that need to be improved in the future. First, although we integrated six databases, the known associations are still sparse compared with the entire association space, which affected the prediction performance. Self-supervised learning provides a solution to address association sparseness. Second, the proposed GIMMDA model still lacked prior knowledge and needed to be further explored, such as the abundance, metabolism, gene sequence information of microbes, drugs, and metabolites information of diseases. In the future, we will make further improvements to overcome these shortcomings.
Data availability statement
The original contributions presented in the study are publicly available. This data can be found here: [https://ftp.ncbi.nlm.nih.gov/blast/db/].
Author contributions
KS: Data curation, Methodology, Project administration, Resources, Supervision, Writing – original draft, Writing – review & editing. KH: Conceptualization, Data curation, Software, Visualization, Writing – review & editing. LL: Conceptualization, Data curation, Methodology, Software, Visualization, Writing – original draft. QL: Conceptualization, Data curation, Methodology, Software, Validation, Writing – original draft. YZ: Data curation, Writing – original draft, Writing – review & editing. HZ: Conceptualization, Data curation, Methodology, Software, Supervision, Validation, Writing – review & editing.
Funding
The author(s) declare that financial support was received for the research, authorship, and/or publication of this article. This study was supported by the National Natural Science Foundation of China (Grant No. 62162019 and 62166014), Shanghai Municipal Science and Technology Major Project (Grant No. 2018SHZDZX01), Key Laboratory of Computational Neuroscience and Brain-Inspired Intelligence (LCNBI), ZJLab, Guangxi Key Laboratory Fund of Embedded Technology and Intelligent System, Special Funds for Guiding Local Scientific and Technological Development by the Central Government (No. Guike ZY22096025), the startup Grant in Guilin University of Technology, and Innovation Project of Guangxi Graduate Education (YCSW2024357).
Acknowledgments
The authors thank the referees for suggestions that helped improve the article substantially.
Conflict of interest
The authors declare that the research was conducted in the absence of any commercial or financial relationships that could be construed as a potential conflict of interest.
Publisher’s note
All claims expressed in this article are solely those of the authors and do not necessarily represent those of their affiliated organizations, or those of the publisher, the editors and the reviewers. Any product that may be evaluated in this article, or claim that may be made by its manufacturer, is not guaranteed or endorsed by the publisher.
Footnotes
References
Aggarwal, N., Kitano, S., Puah, G. R. Y., Kittelmann, S., Hwang, I. Y., and Chang, M. W. (2023). Microbiome and human health: current understanding, engineering, and enabling technologies. Chem. Rev. 123, 31–72. doi: 10.1021/acs.chemrev.2c00431
Camacho, C., Coulouris, G., Avagyan, V., Ma, N., Papadopoulos, J., Bealer, K., et al. (2009). BLAST+: architecture and applications. BMC Bioinform. 10:421. doi: 10.1186/1471-2105-10-421
Chen, X., Huang, Y. A., You, Z. H., Yan, G. Y., and Wang, X. S. (2017). A novel approach based on KATZ measure to predict associations of human microbiota with non-infectious diseases. Bioinformatics 33, 733–739. doi: 10.1093/bioinformatics/btw715
Chen, Y., and Lei, X. (2022). Metapath aggregated graph neural network and tripartite heterogeneous networks for microbe-disease prediction. Front. Microbiol. 13:919380. doi: 10.3389/fmicb.2022.919380
Cheng, L., Qi, C., Zhuang, H., Fu, T., and Zhang, X. (2020). gutMDisorder: a comprehensive database for dysbiosis of the gut microbiota in disorders and interventions. Nucleic Acids Res. 48, D554–D560. doi: 10.1093/nar/gkz843
Ding, Y., Lei, X., Liao, B., and Wu, F. X. (2021). Machine learning approaches for predicting biomolecule-disease associations. Brief. Funct. Genomics 20, 273–287. doi: 10.1093/bfgp/elab002
Frei, R., Heye, K., and Roduit, C. (2022). Environmental influences on childhood allergies and asthma - the farm effect. Pediatr. Allergy Immunol. 33:e13807. doi: 10.1111/pai.13807
Fu, X., Zhan, Y., Li, N., Yu, D., Gao, W., Gu, Z., et al. (2021). Enzymatic preparation of low-molecular-weight Laminaria japonica polysaccharides and evaluation of its effect on modulating intestinal microbiota in high-fat-diet-fed mice. Front. Bioeng. Biotechnol. 9:820892. doi: 10.3389/fbioe.2021.820892
Gu, B. H., Choi, J. P., Park, T., Kim, A. S., Jung, H. Y., Choi, D. Y., et al. (2023). Adult asthma with symptomatic eosinophilic inflammation is accompanied by alteration in gut microbiome. Allergy 78, 1909–1921. doi: 10.1111/all.15691
Ishaq, H. M., Mohammad, I. S., Hussain, R., Parveen, R., Shirazi, J. H., Fan, Y., et al. (2022). Gut-thyroid axis: How gut microbial dysbiosis associated with euthyroid thyroid cancer. J. Cancer 13, 2014–2028. doi: 10.7150/jca.66816
Janssens, Y., Nielandt, J., Bronselaer, A., Debunne, N., Verbeke, F., Wynendaele, E., et al. (2018). Disbiome database: linking the microbiome to disease. BMC Microbiol. 18:50. doi: 10.1186/s12866-018-1197-5
Jin, C., Shi, Z., Zhang, H., and Yin, Y. (2021). Predicting lncRNA-protein interactions based on graph autoencoders and collaborative training. 2021 IEEE International Conference on Bioinformatics and Biomedicine (BIBM).
Kim, C. Y., Baek, S., Cha, J., Yang, S., Kim, E., Marcotte, E. M., et al. (2022). HumanNet v3: an improved database of human gene networks for disease research. Nucleic Acids Res. 50, D632–D639. doi: 10.1093/nar/gkab1048
Kipf, T., and Welling, M. J. A. (2016). Semi-supervised classification with graph convolutional networks. arXiv. doi: 10.48550/arXiv.1609.02907
Lei, X., and Wang, Y. (2020). Predicting microbe-disease association by learning graph representations and rule-based inference on the heterogeneous network. Front. Microbiol. 11:579. doi: 10.3389/fmicb.2020.00579
Ley, R. (2022). The human microbiome: there is much left to do. Nature 606:435. doi: 10.1038/d41586-022-01610-5
Li, H., Wang, Y., Zhang, Z., Tan, Y., Chen, Z., Wang, X., et al. (2021). Identifying microbe-disease association based on a novel Back-propagation neural network model. IEEE/ACM Trans. Comput. Biol. Bioinform. 18, 2502–2513. doi: 10.1109/TCBB.2020.2986459
Li, J., Zhang, S., Liu, T., Ning, C., Zhang, Z., and Zhou, W. (2020). Neural inductive matrix completion with graph convolutional networks for miRNA-disease association prediction. Bioinformatics 36, 2538–2546. doi: 10.1093/bioinformatics/btz965
Liang, S., Sin, Z. Y., Yu, J., Zhao, S., Xi, Z., Bruzzone, R., et al. (2022). Multi-cohort analysis of depression-associated gut bacteria sheds insight on bacterial biomarkers across populations. Cell. Mol. Life Sci. 80:9. doi: 10.1007/s00018-022-04650-2
Liu, B. N., Liu, X. T., Liang, Z. H., and Wang, J. H. (2021). Gut microbiota in obesity. World J. Gastroenterol. 27, 3837–3850. doi: 10.3748/wjg.v27.i25.3837
Liu, Y., Wang, S. L., Zhang, J. F., Zhang, W., Zhou, S., and Li, W. (2021). DMFMDA: prediction of microbe-disease associations based on deep matrix factorization using Bayesian personalized ranking. IEEE/ACM Trans. Comput. Biol. Bioinform. 18, 1763–1772. doi: 10.1109/TCBB.2020.3018138
Liu, J. X., Yin, M. M., Gao, Y. L., Shang, J., and Zheng, C. H. (2023). MSF-LRR: multi-similarity information fusion through low-rank representation to predict disease-associated microbes. IEEE/ACM Trans. Comput. Biol. Bioinform. 20, 534–543. doi: 10.1109/TCBB.2022.3146176
Loh, J. S., Mak, W. Q., Tan, L. K. S., Ng, C. X., Chan, H. H., Yeow, S. H., et al. (2024). Microbiota-gut-brain axis and its therapeutic applications in neurodegenerative diseases. Signal Transduct. Target. Ther. 9:37. doi: 10.1038/s41392-024-01743-1
Long, Y., Luo, J., Zhang, Y., and Xia, Y. (2021). Predicting human microbe-disease associations via graph attention networks with inductive matrix completion. Brief. Bioinform. 22:bbaa146. doi: 10.1093/bib/bbaa146
Luo, J., and Long, Y. (2020). NTSHMDA: prediction of human microbe-disease association based on random walk by integrating network topological similarity. IEEE/ACM Trans. Comput. Biol. Bioinform. 17, 1341–1351. doi: 10.1109/TCBB.2018.2883041
Ma, Y., Liu, G., Ma, Y., and Chen, Q. (2020). Integrative analysis for identifying co-modules of microbe-disease data by matrix tri-factorization with phylogenetic information. Front. Genet. 11:83. doi: 10.3389/fgene.2020.00083
Ma, W., Zhang, L., Zeng, P., Huang, C., Li, J., Geng, B., et al. (2017). An analysis of human microbe-disease associations. Brief. Bioinform. 18, 85–97. doi: 10.1093/bib/bbw005
Megur, A., Daliri, E. B., Baltriukiene, D., and Burokas, A. (2022). Prebiotics as a tool for the prevention and treatment of obesity and diabetes: classification and ability to modulate the gut microbiota. Int. J. Mol. Sci. 23:6097. doi: 10.3390/ijms23116097
Miyauchi, E., Shimokawa, C., Steimle, A., Desai, M. S., and Ohno, H. (2023). The impact of the gut microbiome on extra-intestinal autoimmune diseases. Nat. Rev. Immunol. 23, 9–23. doi: 10.1038/s41577-022-00727-y
Peng, W., Liu, M., Dai, W., Chen, T., Fu, Y., and Pan, Y. (2023). Multi-view feature aggregation for predicting microbe-disease association. IEEE/ACM Trans. Comput. Biol. Bioinform. 20, 2748–2758. doi: 10.1109/TCBB.2021.3132611
Peng, L., Shen, L., Liao, L., Liu, G., and Zhou, L. (2020). RNMFMDA: a microbe-disease association identification method based on reliable negative sample selection and logistic matrix factorization with neighborhood regularization. Front. Microbiol. 11:592430. doi: 10.3389/fmicb.2020.592430
Peng, L. H., Yin, J., Zhou, L., Liu, M. X., and Zhao, Y. (2018). Human microbe-disease association prediction based on adaptive boosting. Front. Microbiol. 9:2440. doi: 10.3389/fmicb.2018.02440
Qu, J., Zhao, Y., and Yin, J. (2019). Identification and analysis of human microbe-disease associations by matrix decomposition and label propagation. Front. Microbiol. 10:291. doi: 10.3389/fmicb.2019.00291
Rahman, S. T., Pandeya, N., Neale, R. E., McLeod, D. S. A., Bain, C. J., Baade, P. D., et al. (2020). Obesity is associated with (V600E)-mutated thyroid Cancer. Thyroid 30, 1518–1527. doi: 10.1089/thy.2019.0654
Shi, Z., Zhang, H., Jin, C., Quan, X., and Yin, Y. (2021). A representation learning model based on variational inference and graph autoencoder for predicting lncRNA-disease associations. BMC Bioinform. 22:136. doi: 10.1186/s12859-021-04073-z
Skoufos, G., Kardaras, F. S., Alexiou, A., Kavakiotis, I., Lambropoulou, A., Kotsira, V., et al. (2021). Peryton: a manual collection of experimentally supported microbe-disease associations. Nucleic Acids Res. 49, D1328–D1333. doi: 10.1093/nar/gkaa902
Tamayo, J. M., Osman, H. C., Schwartzer, J. J., and Ashwood, P. (2024). The influence of asthma on neuroinflammation and neurodevelopment: from epidemiology to basic models. Brain Behav. Immun. 116, 218–228. doi: 10.1016/j.bbi.2023.12.003
Tamura, K., Stecher, G., and Kumar, S. (2021). MEGA11: molecular evolutionary genetics analysis version 11. Mol. Biol. Evol. 38, 3022–3027. doi: 10.1093/molbev/msab120
van Laarhoven, T., Nabuurs, S. B., and Marchiori, E. (2011). Gaussian interaction profile kernels for predicting drug-target interaction. Bioinformatics 27, 3036–3043. doi: 10.1093/bioinformatics/btr500
Varkonyi-Sepp, J., Freeman, A., Ainsworth, B., Kadalayil, L. P., Haitchi, H. M., and Kurukulaaratchy, R. J. (2022). Multimorbidity in difficult asthma: the need for personalised and non-pharmacological approaches to address a difficult breathing syndrome. J. Pers. Med. 12:1435. doi: 10.3390/jpm12091435
Wang, D., Chen, Y., Ding, Y., and Tu, J. (2022). Inverse association between Helicobacter pylori infection and childhood asthma in a physical examination population: a cross-sectional study in Chongqing, China. BMC Pediatr 22:615. doi: 10.1186/s12887-022-03682-8
Wang, F., Huang, Z. A., Chen, X., Zhu, Z., Wen, Z., Zhao, J., et al. (2017). LRLSHMDA: Laplacian regularized least squares for human microbe-disease association prediction. Sci. Rep. 7:7601. doi: 10.1038/s41598-017-08127-2
Wang, Y., Lei, X., Lu, C., and Pan, Y. (2022). Predicting microbe-disease association based on multiple similarities and LINE algorithm. IEEE/ACM Trans. Comput. Biol. Bioinform. 19, 2399–2408. doi: 10.1109/TCBB.2021.3082183
Wang, B., Mezlini, A. M., Demir, F., Fiume, M., Tu, Z., Brudno, M., et al. (2014). Similarity network fusion for aggregating data types on a genomic scale. Nat. Methods 11, 333–337. doi: 10.1038/nmeth.2810
Wang, L., Tan, Y., Yang, X., Kuang, L., and Ping, P. (2022). Review on predicting pairwise relationships between human microbes, drugs and diseases: from biological data to computational models. Brief. Bioinform. 23:bbac080. doi: 10.1093/bib/bbac080
Wang, L., Wang, Y., Li, H., Feng, X., Yuan, D., and Yang, J. (2019). A bidirectional label propagation based computational model for potential microbe-disease association prediction. Front. Microbiol. 10:684. doi: 10.3389/fmicb.2019.00684
Wang, L., Wang, Y., Xuan, C., Zhang, B., Wu, H., and Gao, J. (2023). Predicting potential microbe-disease associations based on multi-source features and deep learning. Brief. Bioinform. 24:bbad25. doi: 10.1093/bib/bbad255
Wen, Z., Yan, C., Duan, G., Li, S., Wu, F. X., and Wang, J. (2021). A survey on predicting microbe-disease associations: biological data and computational methods. Brief. Bioinform. 22:bbaa157. doi: 10.1093/bib/bbaa157
White, M. T., and Sears, C. L. (2024). The microbial landscape of colorectal cancer. Nat. Rev. Microbiol. 22, 240–254. doi: 10.1038/s41579-023-00973-4
Xu, D., Xu, H., Zhang, Y., Wang, M., Chen, W., and Gao, R. (2021). MDAKRLS: predicting human microbe-disease association based on Kronecker regularized least squares and similarities. J. Transl. Med. 19:66. doi: 10.1186/s12967-021-02732-6
Yan, C., Duan, G., Wu, F. X., Pan, Y., and Wang, J. (2020). BRWMDA: predicting microbe-disease associations based on similarities and bi-random walk on disease and microbe networks. IEEE/ACM Trans. Comput. Biol. Bioinform. 17, 1595–1604. doi: 10.1109/TCBB.2019.2907626
Yao, G., Zhang, W., Yang, M., Yang, H., Wang, J., Zhang, H., et al. (2020). MicroPhenoDB associates metagenomic data with pathogenic microbes, microbial Core genes, and human disease phenotypes. Genomics Proteomics Bioinformatics 18, 760–772. doi: 10.1016/j.gpb.2020.11.001
Yin, M. M., Gao, Y.-L., Shang, J., Zheng, C.-H., and Liu, J.-X. (2022a). Multi-similarity fusion-based label propagation for predicting microbes potentially associated with diseases. Futur. Gener. Comput. Syst. 134, 247–255. doi: 10.1016/j.future.2022.04.012
Yin, M. M., Liu, J. X., Gao, Y. L., Kong, X. Z., and Zheng, C. H. (2022b). NCPLP: a novel approach for predicting microbe-associated diseases with network consistency projection and label propagation. IEEE Trans. Cybern. 52, 5079–5087. doi: 10.1109/TCYB.2020.3026652
Yueyue, W., Xiujuan, L., and Yi, P. (2022). Predicting microbe-disease association based on heterogeneous network and global graph feature learning. Chin. J. Electron. 31, 345–353. doi: 10.1049/cje.2020.00.212
Zeng, X., Yang, X., Fan, J., Tan, Y., Ju, L., Shen, W., et al. (2021). MASI: microbiota-active substance interactions database. Nucleic Acids Res. 49, D776–D782. doi: 10.1093/nar/gkaa924
Zhang, L., Ai, T., Xie, C., Xia, W., Zhang, Y., Liao, H., et al. (2022). Lower airway microbiome of children with recurrent wheezing: a clinical cohort study. Transl. Pediatr. 11, 696–705. doi: 10.21037/tp-22-165
Zhou, X., Menche, J., Barabasi, A. L., and Sharma, A. (2014). Human symptoms-disease network. Nat. Commun. 5:4212. doi: 10.1038/ncomms5212
Keywords: microbe–disease associations, network similarities, similarity fusion, inductive matrix completion, graph autoencoder
Citation: Shi K, Huang K, Li L, Liu Q, Zhang Y and Zheng H (2024) Predicting microbe–disease association based on graph autoencoder and inductive matrix completion with multi-similarities fusion. Front. Microbiol. 15:1438942. doi: 10.3389/fmicb.2024.1438942
Edited by:
Kunal R. Jain, Sardar Patel University, IndiaReviewed by:
Süleyman Yildirim, Istanbul Medipol University, TürkiyeWei Ma, Peking University, China
Copyright © 2024 Shi, Huang, Li, Liu, Zhang and Zheng. This is an open-access article distributed under the terms of the Creative Commons Attribution License (CC BY). The use, distribution or reproduction in other forums is permitted, provided the original author(s) and the copyright owner(s) are credited and that the original publication in this journal is cited, in accordance with accepted academic practice. No use, distribution or reproduction is permitted which does not comply with these terms.
*Correspondence: Huilin Zheng, emhsMTAxNDNAMTYzLmNvbQ==