 Naser Safaie1*
 Mina Salehi2*
 Mona Felegari1
 Siamak Farhadi3Samira Karimzadeh1
 Sadegh Asadi4Jun-Li Yang5
 Mohammad Reza Naghavi6*
- 1Department of Plant Pathology, Faculty of Agriculture, Tarbiat Modares University, Tehran, Iran
- 2Department of Plant Genetics and Breeding, Faculty of Agriculture, Tarbiat Modares University, Tehran, Iran
- 3Seed and Plant Improvement Institute, Agricultural Research, Education and Extension Organization (AREEO), Karaj, Iran
- 4Division of Crop Ecology, Department of Agronomy and Plant Breeding, Faculty of Agriculture & Natural Resources, University of Tehran, Karaj, Iran
- 5CAS Key Laboratory of Chemistry of Northwestern Plant Resources and Key Laboratory for Natural Medicine of Gansu Province, Lanzhou Institute of Chemical Physics, Chinese Academy of Sciences, Lanzhou, China
- 6Division of Biotechnology, Department of Agronomy and Plant Breeding, College of Agriculture and Natural Resources, University of Tehran, Karaj, Iran
A total of 1,348 endophytic fungal strains were isolated from Ferula ovina, F. galbaniflua, and F. persica. They included Eurotiales (16 species), Pleosporales (11 species), Botryosphaeriales (1 species), Cladosporiales (2 species), Helotiales (6 species), Hypocreales (31 species), Sordariales (7 species), Glomerellales (2 species), and Polyporales (1 species). F. ovina had the richest species composition of endophytic fungi, and the endophytic fungi were most abundant in their roots compared to shoots. Chao, Margalef, Shannon, Simpson, Berger–Parker, Menhinick, and Camargo indices showed that F. ovina roots had the most endophytic fungal species. The frequency distribution of fungal species isolated from Ferula spp. fell into the log-series model, and F. ovina roots had the highest Fisher alpha. The dominance indices showed that there are no dominant species in the endophytic fungal community isolated from Ferula spp., indicating community stability. Evenness values were 0.69, 0.90, 0.94, and 0.57 for endophytic fungi isolated from F. ovina roots, F. ovina shoots, F. galbaniflua roots, and F. persica roots, respectively, indicating a species distribution that tends toward evenness. The fungal species community isolated from each of F. ovina roots, F. ovina shoots, F. galbaniflua roots, and F. persica roots was a diverse species group originating from a homogeneous habitat. Their distribution followed a log-normal distribution, suggesting that the interactions of numerous independent environmental factors multiplicatively control species abundances. Principal component analysis showed that the highest species diversity and dominance were observed in the endophytic fungal community isolated from F. ovina and F. persica roots, respectively.
1 Introduction
Plants are not solitary beings but consist of an incredible diversity of microorganisms living nearby, particularly those that live inside them and have coevolved together during billions of years of coexistence. Microorganisms known as endophytes live asymptomatically for at least a period of their life cycles inside plants (Hardoim et al., 2015). Endophytic fungi are frequent and diversified polyphyletic microorganisms inhabiting plant tissues (Faeth and Fagan, 2002). Diverse fungal endophytes living within plants can enhance host fitness, the production of secondary metabolites (Jia et al., 2016; Kaul et al., 2016; Salehi et al., 2021; Salehi and Farhadi, 2022), stress tolerance (Rodriguez et al., 2008), disease resistance (Busby et al., 2016; Nourian et al., 2024; Ranjbar et al., 2024), and biomass accumulation (Mucciarelli et al., 2003). The great diversity of fungal endophytes implies their highly intricate and different functional characteristics (Torres-Cortes et al., 2018). The studies displayed that endophytic fungi communities diversified depending on plant tissues (Wearn et al., 2012) and host genotypes (Matsumura and Fukuda, 2013). There are an estimated 300,000 species of higher plants on earth, and each one harbors one or more obligatory endophytic fungi, some of which colonize particular hosts (Nisa et al., 2015). Only a small number of plant species have been investigated in terms of endophytic fungal communities. Endophytes may be hyperdiverse because it has been suggested that there could be up to a million different endophytic fungal taxa (Nisa et al., 2015). There are only a handful of described populations of endophytic fungi. Indeed, exploring the endophytic fungi is a long way ahead.
Ferula, one of the largest and most popular genera of Apiaceae, has numerous species frequently exploited in traditional medicine and is a prospective source of biologically active compounds including anti-inflammatory, antiviral, antidiabetic, antitumor, cytotoxic, anticancer, estrogenic, anti-ulcerative, antibacterial, acaricidal, antiglycation, and antiprotozoal (Mohammadhosseini et al., 2019; Salehi et al., 2019c; Sonigra and Meena, 2021). Ferula is widely distributed throughout the Mediterranean, the Far East, north India, and southwest and central Asia (particularly Iran and Afghanistan; Sonigra and Meena, 2021). More than 30 Ferula spp. have been identified in Iran, with approximately half of them endemic and/or native, including F. ovina, F. persica, and F. galbaniflua (synonyms of F. gummosa; Safaian and Shokri, 1993; Panahi and Mahmoodi, 2021). Umbelliprenin, auraptene, galbanic acid, ferutinin, daucane esters, ferulenol, sinkiangenorin C, sinkiangenorin E, farnesiferol A, farnesiferol B, and ferprenin are some of the hopeful bioactive compounds found in Ferula spp.; consequently, Ferula species are considered valuable sources for the development of plant-derived medicines, particularly chemopreventive ones (Salehi et al., 2019c).
In light of the wide range of medicinal properties of Ferula spp. and the fact that the exploration of the endophytic fungi is a long way off, and likewise, the endophytic fungi of F. ovina, F. persica, and F. galbaniflua have not been comprehensively surveyed, studying their endophytic fungal diversity is essential.
The aims of this study were (a) to isolate endophytic fungi from F. ovina, F. persica, and F. galbaniflua grown in Iran, (b) to morphologically and molecularly identify the endophytic fungi isolated from roots and shoots of F. ovina, F. persica, and F. galbaniflua, and (c) to investigate the possible effect of different tissues (roots and shoots) and Ferula species on endophytic fungi communities.
2 Materials and methods
2.1 Sampling and fungal isolation
Healthy samples, including the roots and shoots, were collected from F. ovina, F. persica, and F. galbaniflua grown in their major habitats in Iran in June 2022. Asymptomatic roots and shoots were cut by mentioning Ferula species, sample code, and taken in paper bags to the lab. The samples were treated for 1 min with 75% ethanol (v/v) and 2 min with 2.5% sodium hypochlorite (w/v), followed by two rinses with sterile water. To evaluate the surface sterilization effectiveness, the final rinse water (10 mL) was centrifuged at 10,000g for 10 min. The supernatant was taken off and streaked onto potato dextrose agar (PDA) with 250 mg/L of chloramphenicol (CAM) (PDACAM). No mycelial development took place, which validated the surface sterilization. Small (4 mm2) surface-sterilized sections of root and shoot segments were cut and placed on the PDACAM surface in special Petri dishes (100 × 15 mm), then incubated at 25°C to promote the growth of endophytic fungi. The single spore or hyphal tip culture (Tutte, 1969) was used to obtain pure cultures of the fungal isolates. Fo#, Fp#, and Fg# series were used to number all fungal endophytes isolated from F. ovina, F. persica, and F. galbaniflua, respectively. They were stored on PDA at 4°C.
2.2 Morphological identification of endophytic fungi
The macroscopic examination of colony characteristics, by observing topography, color, and texture, as well as color and topography of colony back, and the microscopic investigation of conidia, conidiophores, and spore arrangement, using lactophenol and lactophenol cotton blue staining, under a compound microscope, were both used to study fungal morphology (Aneja, 2007; Dos Reis et al., 2022). Photomicrographs were taken with an Olympus DP72 digital camera attached to an Olympus BX51 microscope equipped with differential interference contrast.
2.3 Molecular identification of endophytic fungi
Endophytic fungi were grown in potato dextrose broth (PDB) at 25°C with continuous shaking. Genomic DNA extraction was performed from freeze-dried mycelia as described previously (Salehi et al., 2018, 2019a,b, 2020a,b; Farhadi et al., 2020a,b; Nourian et al., 2021; Jahedi et al., 2023). The fungal internal transcribed spacer (ITS) region (ITS1-5.8S-ITS2) was amplified, using polymerase chain reaction (PCR), by the universal primers ITS1 and ITS4. One microliter of genomic DNA (~10 ng), 1 μL of forward and reverse primers (10 pM), 12.5 μL of Premix Taq (TaKaRa Biotechnology Ltd., Japan), and 10.5 μL of PCR-grade water were all included in the PCR reaction mixtures (25 μL). The PCR reaction programs were as follows: initial denaturation at 94°C for 3 min, 30 cycles of denaturation (94°C for 30 s), annealing (56°C for 30 s), extension (72°C for 1 min), and final extension (72°C for 5 min). PCR reaction success was assessed through agarose gel electrophoresis, and then the PCR products were purified using a DNA gel extraction kit (Axygen Biotechnology Ltd., China). Direct sequencing of purified PCR products was conducted by the same primers using Bioneer (Shanghai, China).
2.4 Diversity analyses of cultivable endophytic fungi
Two key factors—evenness and richness—should be considered when determining how diverse a sample is (Kim et al., 2017). Diversity typically increases along with increases in species evenness and richness. The diversity of endophytic fungi in the different tissues of F. ovina, F. persica, and F. galbaniflua was examined at the species level. The endophytic fungal composition and abundance of endophytic fungi from each tissue of Ferula spp. must be assessed using the number of endophytic fungal isolates (N) and species as the statistical unit. The macroscopic examination enables the classification of morphotypes.
Here, abundance (N) is the number of isolates, whereas richness (S) signifies the number of species in the endophytic fungal community of a specific sample type (roots and shoots from F. ovina, F. persica, and F. galbaniflua).
To assess the propriety of each tissue type of each Ferula species as a substrate for fungal colonization, colonized samples (i.e., colonized by one endophytic fungus, at minimum) were enumerated and colonization frequency (CF; also known as isolation rate) was calculated according to Eq. 1 (Hata and Futai, 1995). CF was estimated as the number of sections colonized by endophytic fungi divided by the total number of incubated sections (Eq. 1, Huang et al., 2008).
Isolation frequency (IF), the frequency of the occurrence of particular endophytic fungal species in total isolates, is relative abundance (RA%) computed as the number of whole isolates of a particular species divided by the sum of all isolates across all species (Eq. 2; Huang et al., 2008).
A non-parametric method to approximate the species number in a community is Chao1. The foundation of the Chao richness estimator, created by Anne Chao, is the idea that rare species can reveal the greatest information regarding missing species numbers. Since the Chao richness estimator favors the low-abundance species, merely the singleton(s) and doubleton(s) are applied to approximate the missing species number. Consequently, data sets that are biased toward low-abundance species benefit most from this index (Kim et al., 2017).
The Chao richness estimator is estimated by Eq. 3 (Chao, 1984).
Where F1 and F2 denote the number of singleton(s) and doubleton(s), respectively, and Sobs signifies the observed species number.
The Menhinick index (Dmn), which measures species richness among the endophytic fungal isolates, is calculated using Eq. 4 (Whittaker, 1977).
Where S signifies the number of different endophytic fungal species in a given sample and N is the total number of endophytic fungal isolates in a given sample.
The Camargo evenness index (Eq. 5) was calculated to determine fungal dominance.
Where Dmn is species richness.
A species is considered dominant if its RA is greater than the Camargo evenness index (pi >1/ Dmn; Camargo, 1992).
The Shannon diversity index was developed to examine the diversity of the fungal endophyte communities in each tissue (Eq. 6; Shannon, 1948):
Where pi denotes the RA of a species in a given tissue. H′ could range from 0 (there is only one species, and each individual will be of that species, without a doubt) to higher values, indicating high uncertainty because species are distributed fairly evenly.
Pielou’s evenness index was calculated as follows (Eq. 7).
Where J is Pielou’s measure of species evenness, H′ signifies the Shannon–Wiener index in the given sample, and S denotes the total number of species in the given sample.
The evenness index (E) was calculated using Eq. 8 (Muthukrishnan et al., 2012).
Sorenson index of similarity, the proportion of twice the number of the species shared between two communities to the sum of the number of species in each community, was calculated using Eq. 9 (Sorensen, 1948). Where a signifies the number of common species of endophytic fungi in two samples, and b and c denote the species specifically found in each of the samples.
Jaccard similarity index, the ratio of species shared between two communities to the total number of species in all, was estimated by Eq. 10 (Jaccard, 1912), where a denotes the number of common endophytic fungal species in two samples and b and c are the number of species specifically found in each of the samples.
A parametric index called Fisher alpha supposes that species abundances have a log-series distribution. In Eq. 11, S denotes the number of species, n denotes the number of endophytic fungal isolates, and α denotes Fisher alpha (Fisher et al., 1943). Furthermore, species frequency/abundance distribution for endophytic fungal strains isolated from F. ovina, F. galbaniflua, and F. persica was calculated according to a logarithmic series evolved by Fisher et al. (1943).
Berger–Parker dominance index (d; Eq. 12) displays the numerical importance of dominant species (most abundant species).
Where nmax denotes the number of individuals in the dominant species, and N denotes the total number of individuals in the sample.
Reciprocal of Berger–Parker (1/d) is frequently used, and its increment implies diversity increment and dominance decrement.
Furthermore, the Simpson dominance index (Eq. 13; Simpson, 1949) was used for evaluating species diversity. It shows the likelihood that two isolates randomly chosen from a sample will be of the same species.
Where ni is the total number of isolates falling into the species i. N signifies the total number of isolates of all species. Moreover, the complementarity of the Simpson diversity index (1-D) and the reciprocal of the Simpson index (1/D) were calculated.
Probability of interspecific encounter (PIE; Eq. 14) is a metric introduced by Hurlbert (1971) and basically asks, “what is the probability that two individuals randomly selected from a community are of different species?” A community with more even species RAs displays a higher PIE than that with dominant species. Indeed, a low PIE shows that a few species dominate and a high PIE displays community evenness.
Where N is the total number of individuals, and Pi signifies the proportion of species i in the sample.
Species richness was measured by the Margalef index (Eq. 15; Margalef, 1958).
Where S represents the number of species, and N is the total number of isolates.
The data were analyzed using Excel (2013) and Minitab (18.1). GraphPad Prism (GraphPad Prism 5), Excel (Excel, 2013), and PowerPoint (2013) software were used for making graphs.
3 Results
3.1 Isolation rate and classification of endophytic fungi
No fungal colonies were observed on PDACAM plates in the control group (surface sterilization validation), which ascertained the surface of F. ovina, F. galbaniflua, and F. persica tissues were completely disinfected, and consequently, the fungi isolated in the present study were all endophyte. A total of 1,348 endophytic fungal strains, which belonged to 2 phyla, 5 classes, 9 orders, 18 families, and 24 genera (Supplementary Figure S1), were isolated from 3,240 cultured tissue segments of F. ovina, F. galbaniflua, and F. persica tissues growing naturally in Iran (Supplementary Table S1). The endophytic fungal isolates were investigated morphologically, and 77 representative isolates of different morphotypes (Supplementary Figures S2, S3 and Supplementary Table S2) were considered for detailed description and morphological and molecular identification. The RA% of endophytic fungi isolated from the different species of Ferula (F. ovina, F. galbaniflua, and F. persica) is presented in Supplementary Figure S4. One thousand twenty-seven endophytic fungal strains were isolated from F. ovina, with a CF of 22.96% (142 strains from shoots, 12.59%; 885 strains from roots, 33.33%; Supplementary Table S1). One hundred eighty-seven endophytic fungal strains were isolated from F. galbaniflua roots, and CF was 32.78% (Supplementary Table S1). Accordingly, 134 strains were isolated from F. persica, and the CF was 32.22% (Supplementary Table S1). F. ovina had the highest CF (22.96%) and the most isolated endophytic fungal strains (1027), followed by F. galbaniflua (16.39%) and F. persica (16.11%; Supplementary Table S1). In terms of tissue, the most endophytic fungal strains were isolated from the roots of F. ovina, F. galbaniflua, and F. persica (1206). No endophytic fungal strain was isolated from seeds of the three mentioned species of Ferula as well as shoots of F. galbaniflua and F. persica (Supplementary Table S1).
As shown in Figures 1–3, the culturable endophytic fungi in F. ovina displayed rich diversity compared with F. galbaniflua and F. persica. The morphology and molecular identification showed that 1,027 endophytic fungi isolated from F. ovina belonged to 2 Phyla (Ascomycota and Basidiomycota), 5 classes, 8 orders, 17 families, and 21 genera. There were 28 (2.73%) endophytic fungal strains in the phylum of Basidiomycota belonging to the class of Agaricomycetes, order of Polyporales, family of Polyporaceae, and genus of Ganoderma. Sordariomycetes (513 isolates, 49.95%) was the dominant class in Ascomycota, followed by Eurotiomycetes (212 isolates, 20.64%), Dothideomycetes (177 isolates, 17.23%), and Leotiomycetes (97 isolates, 9.44%). Pezizomycotina (999 isolates) was the only subphylum in the phylum of Ascomycota. The relative frequency of Pezizomycotina was 97.27%, including Eurotiales (212 isolates, 20.64%), Pleosporales (157 isolates, 15.29%), Botryosphaeriales (13 strains, 1.27%), Cladosporiales (7 isolates, 0.68%), Helotiales (97 isolates, 9.44%), Hypocreales (506 isolates, 49.27%), and Sordariales (7 isolates, 0.68%). Nectriaceae (286 isolates, 27.85%) and Aspergillaceae (205 isolates, 19.96%) were the dominant families. Fusarium (279 isolates, 27.17%) and Aspergillus (168 isolates, 16.36%) were the dominant genera (Figure 1).
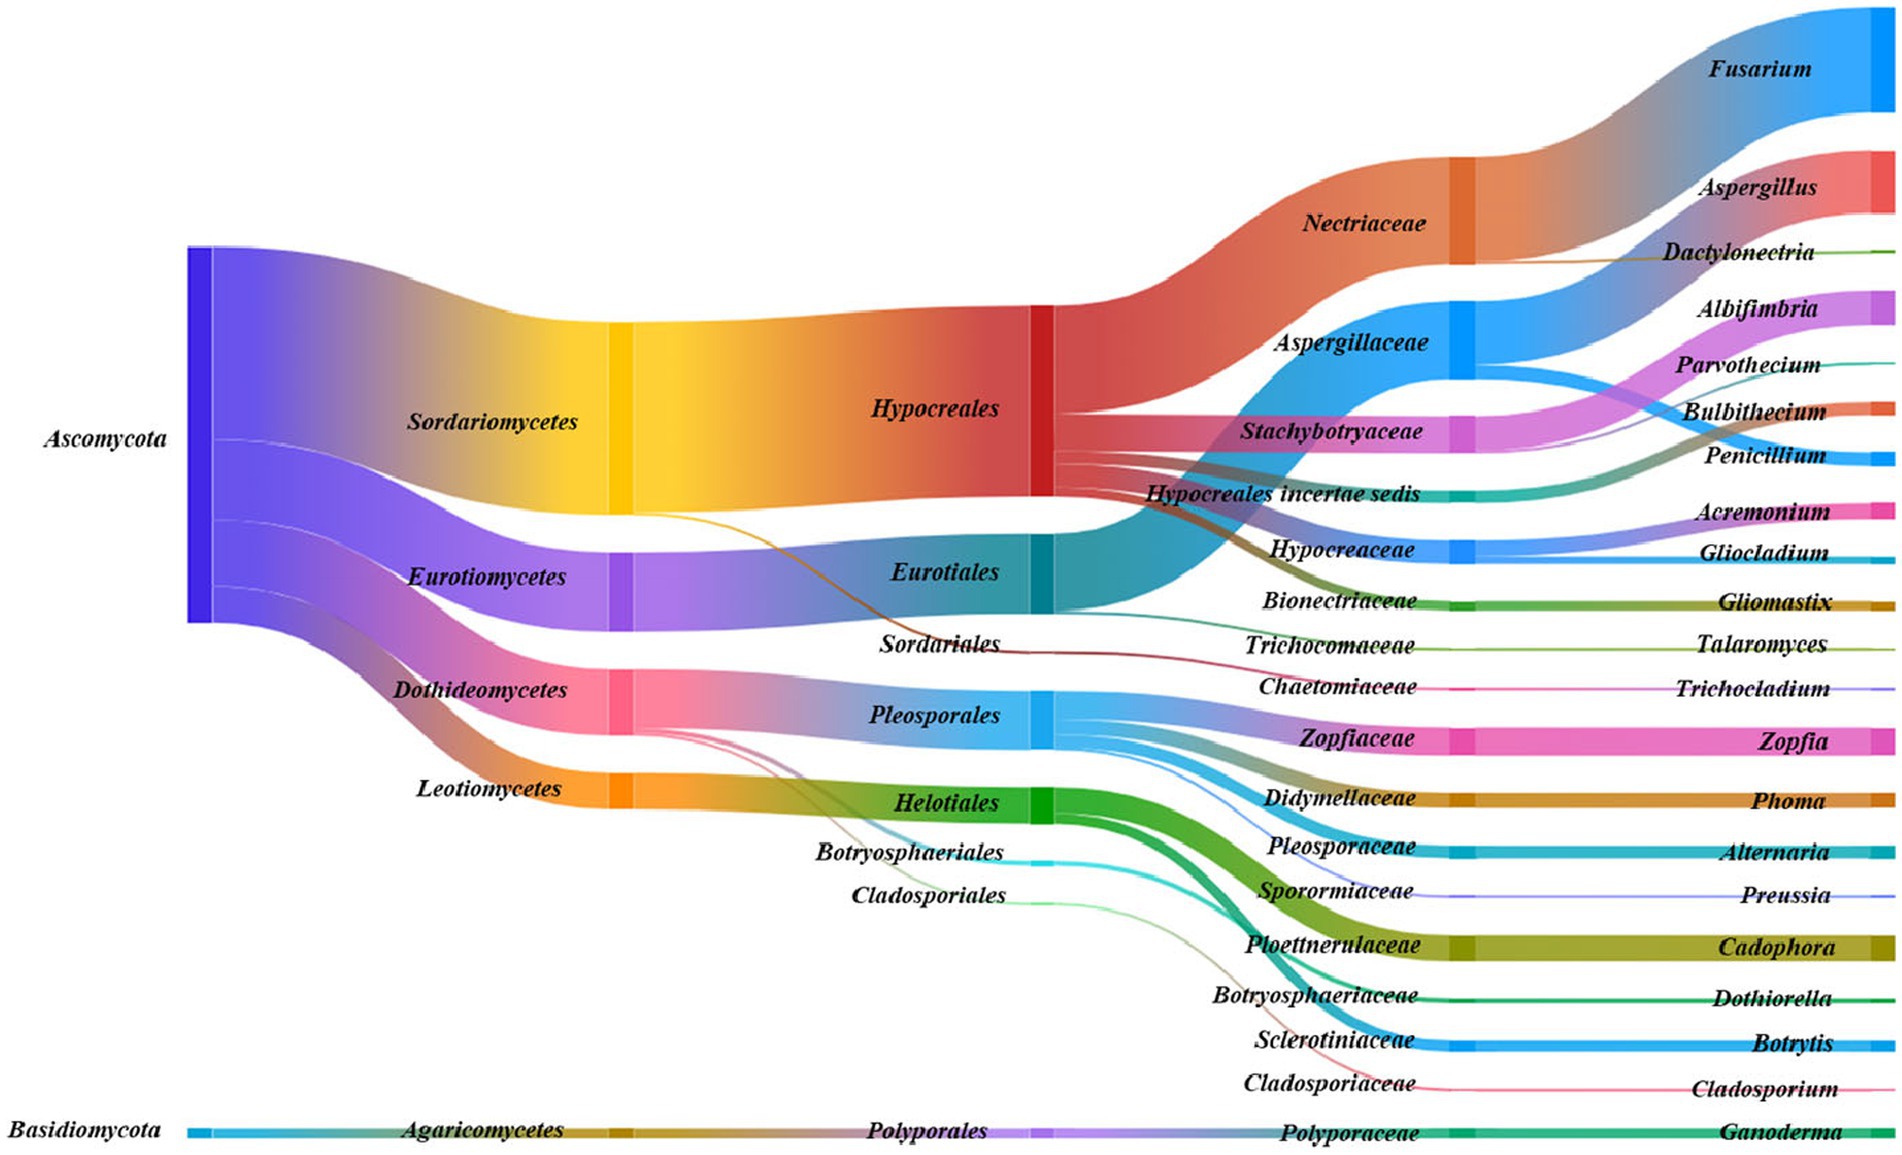
Figure 1. Species taxonomic relationship. The endophytic fungi isolated from Ferula ovina shoots and roots belonged to 2 phyla, 5 classes, 8 orders, 17 families, and 21 genera.
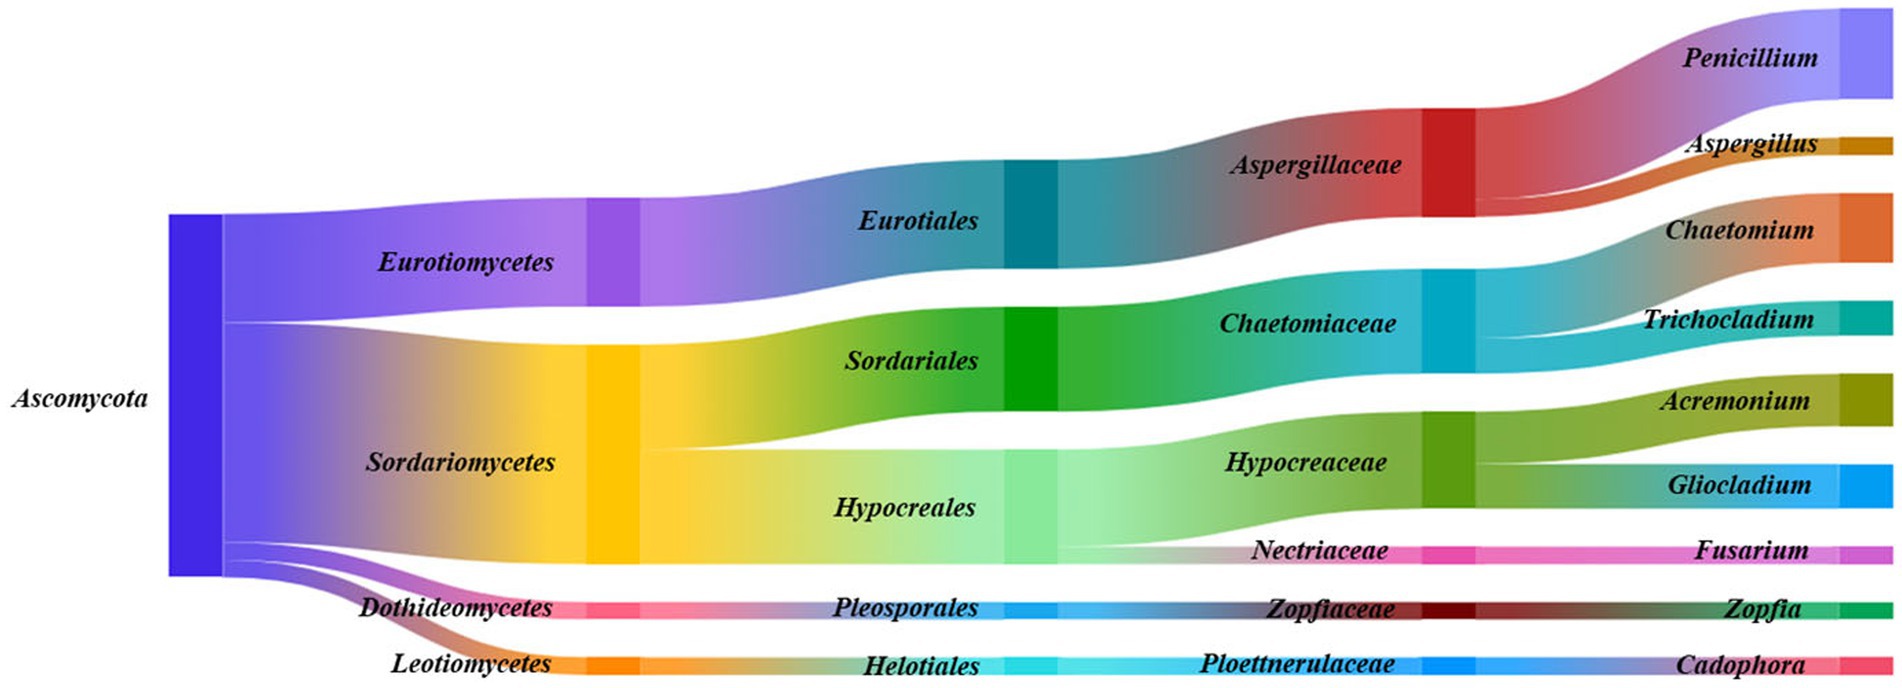
Figure 2. Species taxonomic relationship. The endophytic fungi isolated from Ferula galbaniflua roots belonged to one phylum, four classes, five orders, six families, and nine genera.
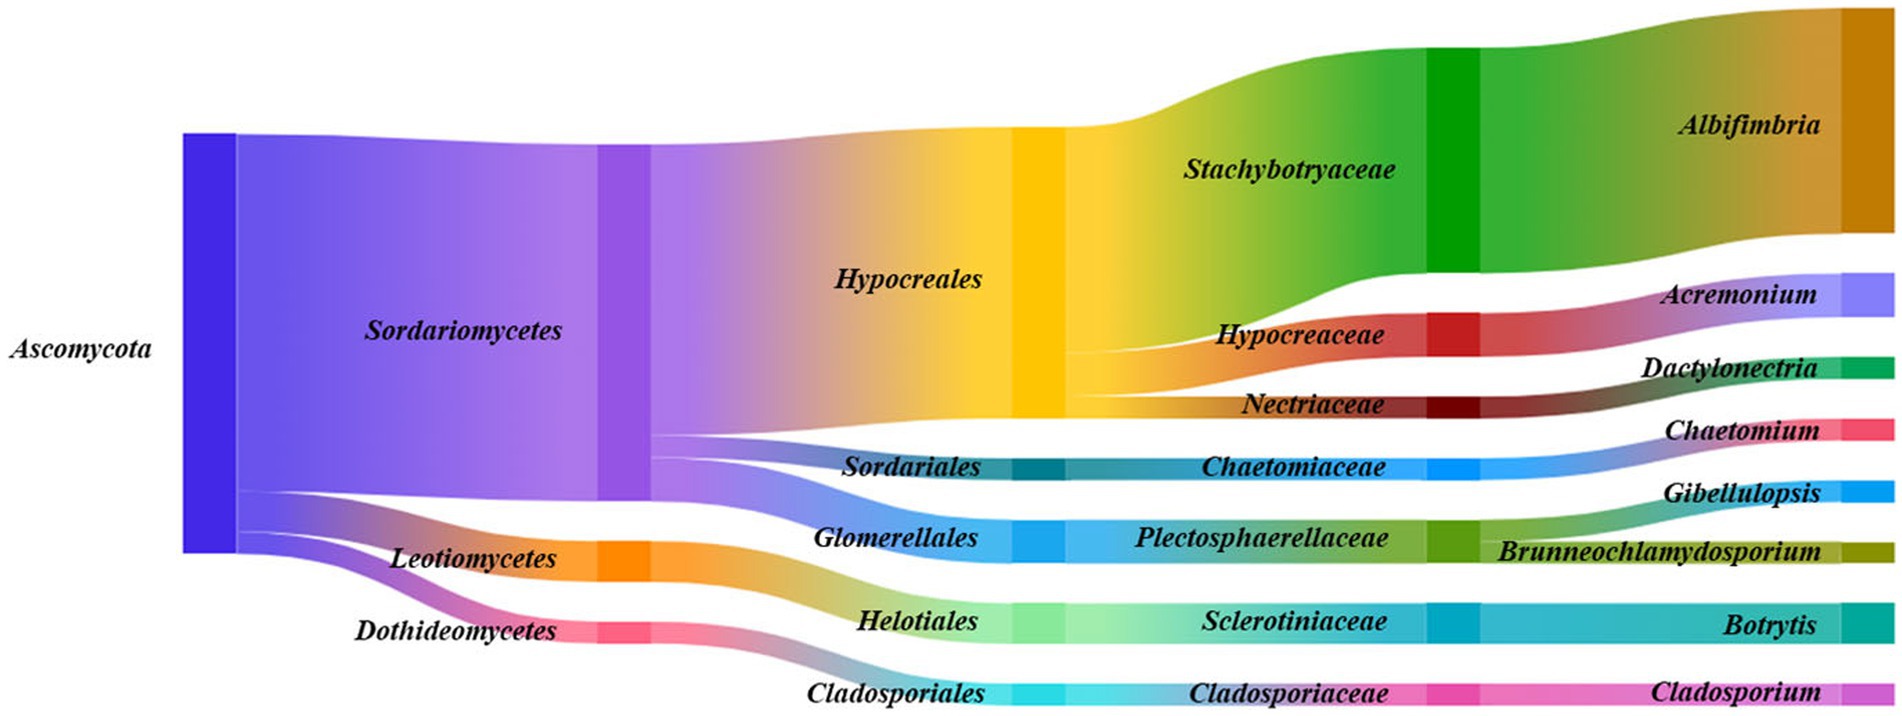
Figure 3. Species taxonomic relationship. The endophytic fungi isolated from Ferula persica roots belonged to one phylum, three classes, five orders, seven families, and eight genera.
Endophytic fungal strains (187) isolated from F. galbaniflua roots were classified into one phylum (Ascomycota), four classes (Sordariomycetes, Eurotiomycetes, Dothideomycetes, and Leotiomycetes), five orders (Hypocreales, Eurotiales, Sordariales, Pleosporales, and Helotiales), six families (Aspergillaceae, Chaetomiaceae, Hypocreaceae, Zopfiaceae, Ploettnerulaceae, and Nectriaceae), and nine genera (Penicillium, Chaetomium, Acremonium, Gliocladium, Trichocladium, Aspergillus, Zopfia, Cadophora, and Fusarium). Sordariomycetes (113 isolates, 60.43%), Hypocreales (59 isolates, 31.55%), Aspergillaceae (56 isolates, 29.95%), and Penicillium sp. (47 isolates, 25.13%) were the dominant phylum, class, order, family, and genus, respectively (Figure 2).
A total of 134 endophytic fungal strains were isolated from F. persica and classified into one phylum (Ascomycota), three classes (Sordariomycetes, Leotiomycetes, and Dothideomycetes), five orders (Hypocreales, Glomerellales, Helotiales, Sordariales, and Cladosporiales), seven families (Stachybotryaceae, Hypocreaceae, Plectosphaerellaceae, Sclerotiniaceae, Nectriaceae, Chaetomiaceae, and Cladosporiaceae), and eight genera (Albifimbria, Acremonium, Botrytis, Dactylonectria, Chaetomium, Gibellulopsis, Brunneochlamydosporium, and Cladosporium; Figure 3). As shown in Figure 3, Sordariomycetes, Hypocreales, Stachybotryaceae, and Albifimbria were the dominant class, order, family, and genus, respectively.
The genus Acremonium was isolated from all Ferula species (F. ovina, F. galbaniflua, and F. persica; Figure 4A), accounting for an RA of 4.09, 14.44, and 10.45%, respectively (Supplementary Figures S5–S7). Alternaria, Bulbithecium, Phoma, Dothiorella, Parvothecium, Talaromyces, Ganoderma, Gliomastix, and Preussia were only isolated from F. ovina (Figure 4A). Furthermore, Gibellulopsis and Brunneochlamydosporium were endemic to F. persica (Figure 4A). Additionally, Aspergillus, Zopfia, Fusarium, Cadophora, Gliocladium, Penicillium, and Trichocladium were only found in F. ovina and F. galbaniflua (Figure 4A). Besides, Botrytis, Albifimbria, Dactylonectria, and Cladosporium were only present in F. ovina and F. persica (Figure 4A). Furthermore, Chaetomium is shared between F. galbaniflua and F. persica roots (Figure 4A). Of 24 genera, 21, 9, and 8 fungal genera were isolated from F. ovina, F. galbaniflua, and F. persica, respectively (Figure 4A).
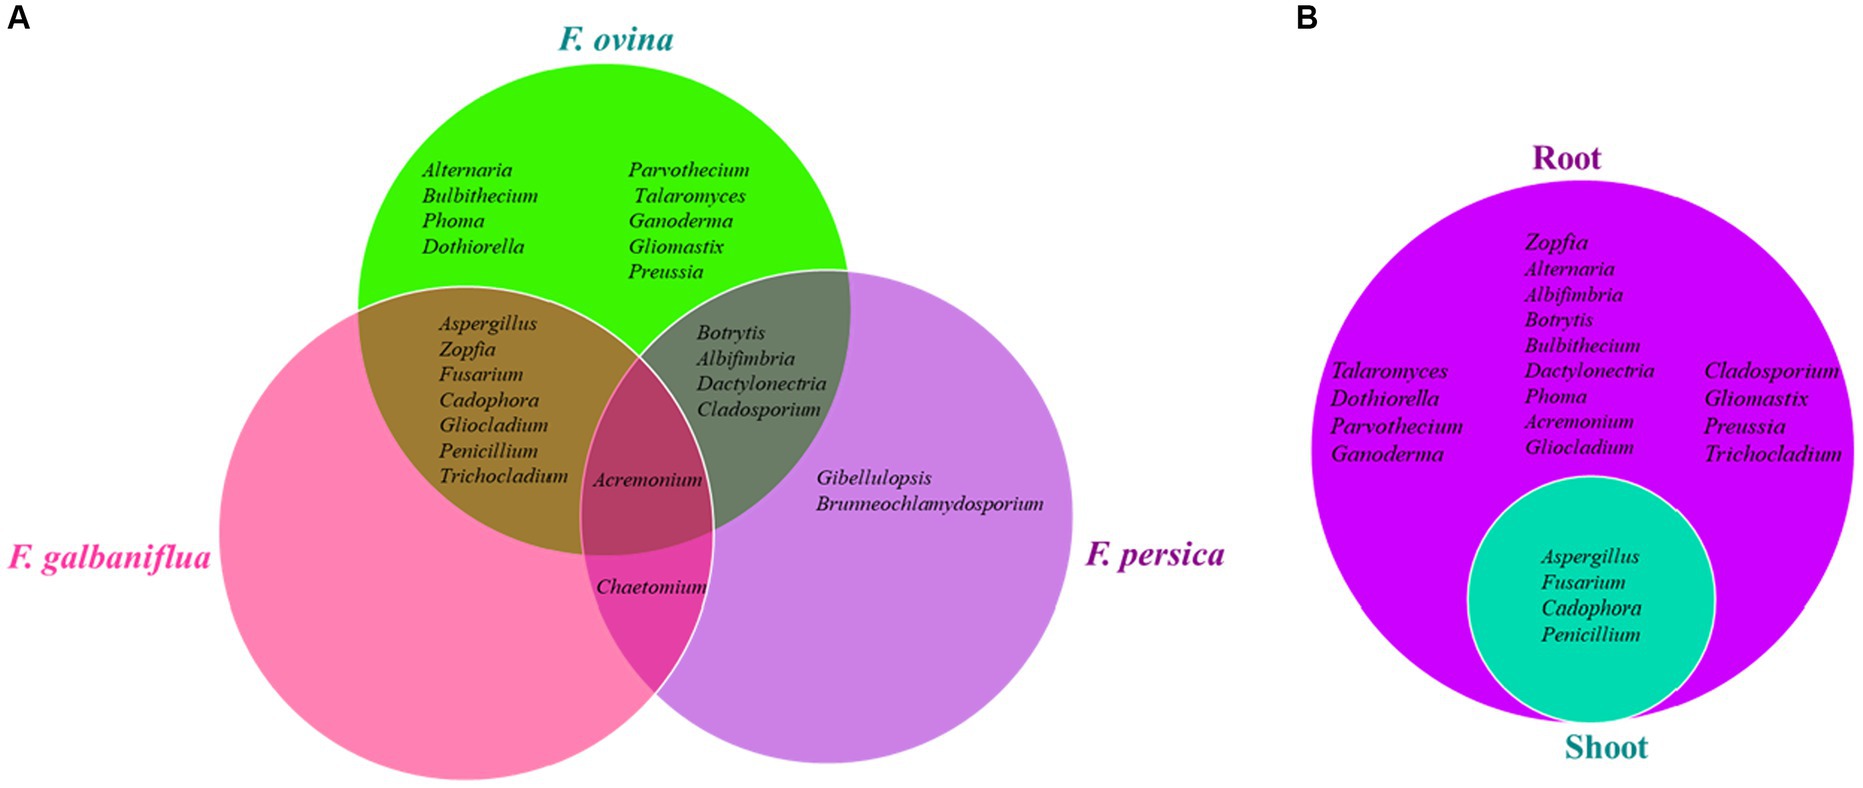
Figure 4. Venn diagram of endemic and common endophytic fungal genera isolated from Ferula ovina, F. galbaniflua, F. persica (A), and F. ovina shoots and roots (B).
As shown in Supplementary Figure S4, 885 (86.17) and 142 (13.83) endophytic fungal strains were isolated from F. ovina roots and shoots, respectively. Among them, the roots and shoots of F. ovina shared only four genera: Aspergillus, Fusarium, Cadophora, and Penicillium (Figure 4B). Talaromyces, Dothiorella, Parvothecium, Ganoderma, Zopfia, Alternaria, Albifimbria, Botrytis, Bulbithecium, Dactylonectria, Phoma, Acremonium, Gliocladium, Cladosporium, Gliomastix, Preussia, and Trichocladium were endemic to F. ovina roots but not isolated from its shoots (Figure 4B). Fusarium was a dominant and common genus isolated from the root and shoot tissues of F. ovina with an RF of 24.75 and 42.25%, respectively (Supplementary Figure S5). Except for Fusarium, the dominant endophytic fungal genus of F. ovina was Aspergillus, showing an RF of 12.43 and 40.85% in roots and shoots, respectively (Supplementary Figure S5). Depending on the type of tissue, the endophytic fungal communities varied greatly (Supplementary Figure S5). No fungal endophytes were isolated from the shoots of F. galbaniflua and F. persica.
The fungal endophytes of F. ovina roots were assigned the most abundant of 21 genera.
3.2 Alpha diversity of endophytic fungi isolated from F. ovina, F. galbaniflua, and F. persica
Fungal species isolated from F. ovina, F. galbaniflua, and F. persica are presented in Supplementary Figure S8. Shannon index, H, is a diversity one considering both the total number of endophytic fungi and the fungal species number. For communities with a single species, it is equal to 0, while for communities with multiple taxa, each with a small number of members, it is higher. Shannon–Wiener index and Simpson dominance index displayed that the endophytic fungal community isolated from F. ovina roots had the highest diversity (H = 3.67 and D = 0.036) and F. persica the lowest (H = 1.64 and D = 0.317). The results implied that the species diversity of culturable endophytic fungi in Ferula was affected by the host.
As shown in Figure 5, species frequency/abundance distribution for fungal endophytic strains isolated from F. ovina, F. galbaniflua, and F. persica conformed to the Poisson series, making a curve that resembled a hyperbola. Fisher alpha is a useful parametric index for log-series models of distribution. Fisher alpha for endophytic fungi isolated from F. ovina roots, F. ovina shoots, F. galbaniflua roots, and F. persica roots was estimated at 13.6, 2.45, 4.54, and 2.17, respectively (Table 1). As shown by Fisher alpha, the diversity of endophytic fungi isolated from F. ovina roots was highest, followed by F. galbaniflua roots.
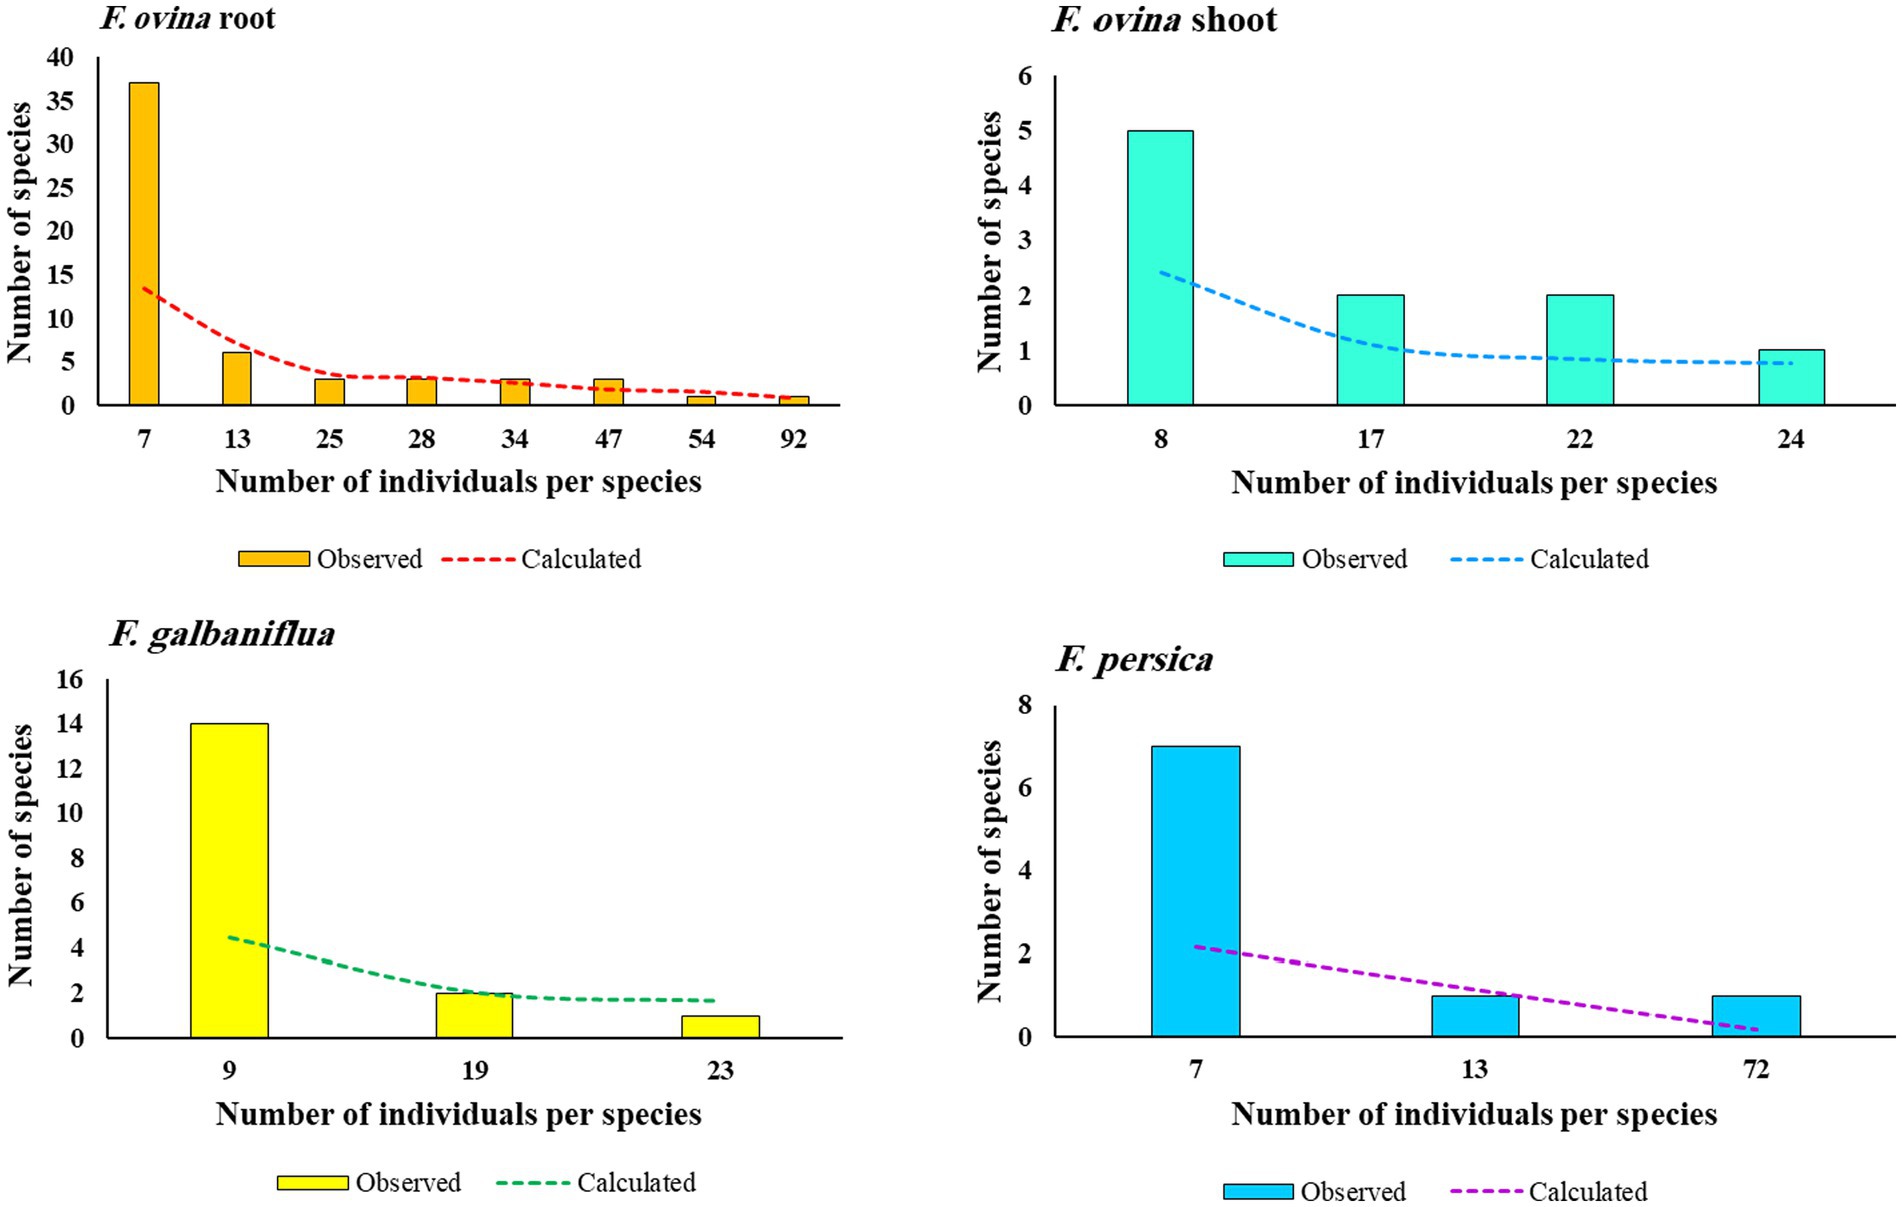
Figure 5. Species frequency-abundance distribution for fungal endophytic strains isolated from Ferula ovina roots and shoots, as well as F. galbaniflua and F. persica roots.
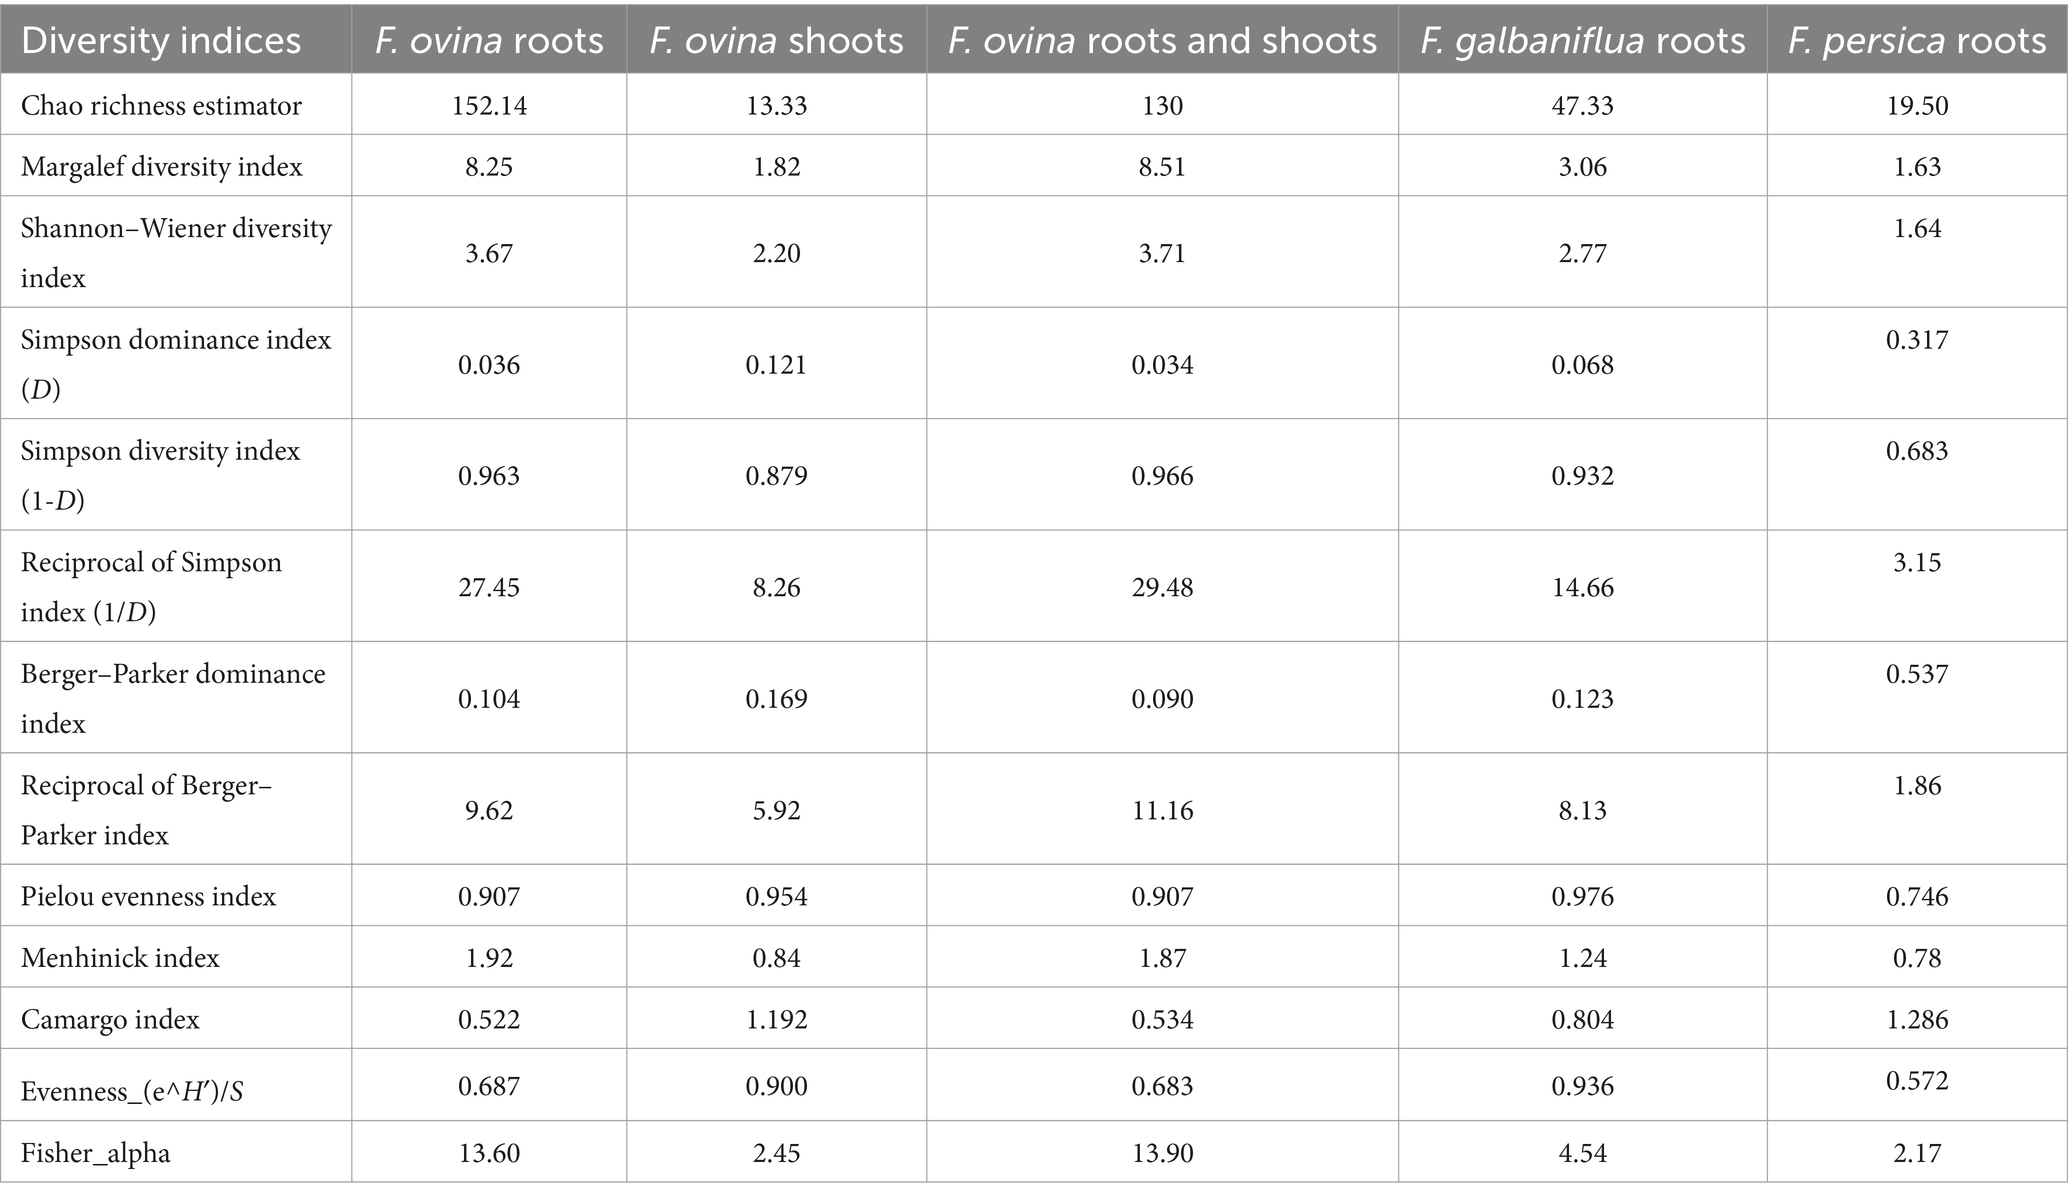
Table 1. Diversity indices calculated for the endophytic fungal species community isolated from F. ovina, F. galbaniflua, and F. persica.
3.3 Species richness
Supplementary Table S3 presents the total number of species, S, a direct measurement of species diversity. The maximum species number was isolated from F. ovina, followed by F. galbaniflua roots and the lowest species number was recorded for F. persica roots. Regarding the total number of individuals, the same trend was observed, so the highest number of endophytic fungi was isolated from F. ovina (Supplementary Table S3). F. ovina roots had the lowest Berger–Parker dominance index, followed by F. galbaniflua roots. Berger–Parker index and its reciprocal showed that the highest dominance and lowest diversity were observed in endophytic fungi isolated from F. persica, followed by F. ovina shoots (Table 1). Chao1 index showed that the endophytic fungal community isolated from F. ovina roots had the highest species abundance (152.14) and F. ovina shoots (13.33) the lowest, followed by F. persica roots (19.50). The total number of species, S, depends on the sample size; therefore, it has limitations as a comparative index. Margalef and Menhinick indices, popular sample size-independent indices, were calculated to measure species richness. The values of these indices were higher for endophytic fungi isolated from F. ovina roots compared with those from F. ovina shoots, F. galbaniflua, and F. persica roots (Table 1).
3.4 Species evenness
Species equitability or evenness—that is, the individual distribution pattern among the species—must be considered when studying species diversity. In other words, the endophytic community composition can be characterized by the dominance and evenness indices. The term “evenness” describes the distribution of species abundance in a community. The evenness index would peak at one when all species in the sample are equally plentiful and would progressively decline toward 0 as the RAs of the species deviate from evenness. The calculated evenness (E) values were 0.69, 0.90, 0.94, and 0.57 for endophytic fungi isolated from F. ovina roots, F. ovina shoots, F. galbaniflua roots, and F. persica roots, respectively, indicating the species distribution was tilted toward evenness. Pielou evenness index (J) values displayed resemble trend, 0.91, 0.95, 0.98, and 0.75 for endophytic fungi isolated from F. ovina roots, F. ovina shoots, F. galbaniflua roots, and F. persica roots, respectively. Pielou index suggested that F. galbaniflua roots have the highest value of fungal community evenness (0.98) and F. persica the lowest (0.75). The complementarity of Simpson diversity index (1-D) values was estimated at 0.96, 0.88, 0.93, and 0.68 for fungi isolated from F. ovina roots, F. ovina shoots, F. galbaniflua roots, and F. persica roots, respectively. Host-specific fungal species dominance calculated using the Camargo index was the highest in F. persica roots (1.29), followed by F. ovina shoots (1.19). The Camargo index for endophytic fungal species isolated from F. ovina roots, F. ovina (roots and shoots), and F. galbaniflua roots was estimated at 0.52, 0.53, and 0.80, respectively (Table 1). As the relative frequency of all endophytic fungal species isolated from F. ovina, F. galbaniflua, and F. persica was less compared with their estimated Camargo index (Table 1; Supplementary Figures S9–S11), no dominant fungal species were observed in these Ferula species. The distribution of species within the fungal community isolated from F. ovina roots was extremely even, as indicated by the low ecological dominance. The value of the Simpson dominance index (D) ranges from 0 to 1. If the index value is close to zero, it means that there is no dominant species, and it shows community stability. Meanwhile, if the value of the index is close to 1, it means the presence of dominant species and indicates that the ecosystem is in unstable conditions and there is ecological pressure (Oktavianti and Purwanti, 2014). The Simpson dominance index (D) for the endophytic fungal community of three Ferula species was close to zero, so it can be concluded that the fungal community structure for three Ferula species is stable and there is no ecological pressure.
Principal components analysis was carried out on F. ovina shoots and roots. F. galbaniflua and F. persica roots showed that the two first principal components explained 99.37% of the total variation, indicating an excellent fit of the data to the model (Figure 6). The first principal component, which explained 76.46% of the variation, has a high positive coefficient for Camargo, Simpson dominance indices, and Berger–Parker dominance, respectively (Figure 6). The second principal component explained 22.91% of the total variation. The coefficients of the eigenvector of the second principal component showed that the weight of the Chao richness estimator had a high positive coefficient (Figure 6). According to the results, the first and second principal components can be named as effective factors in dominance and richness, respectively. As shown in Figure 6, the endophytic fungal community isolated from F. persica roots had the highest species dominance, and endophytic fungi of F. ovina roots displayed the highest species richness and subsequently the highest species diversity (Figure 6).
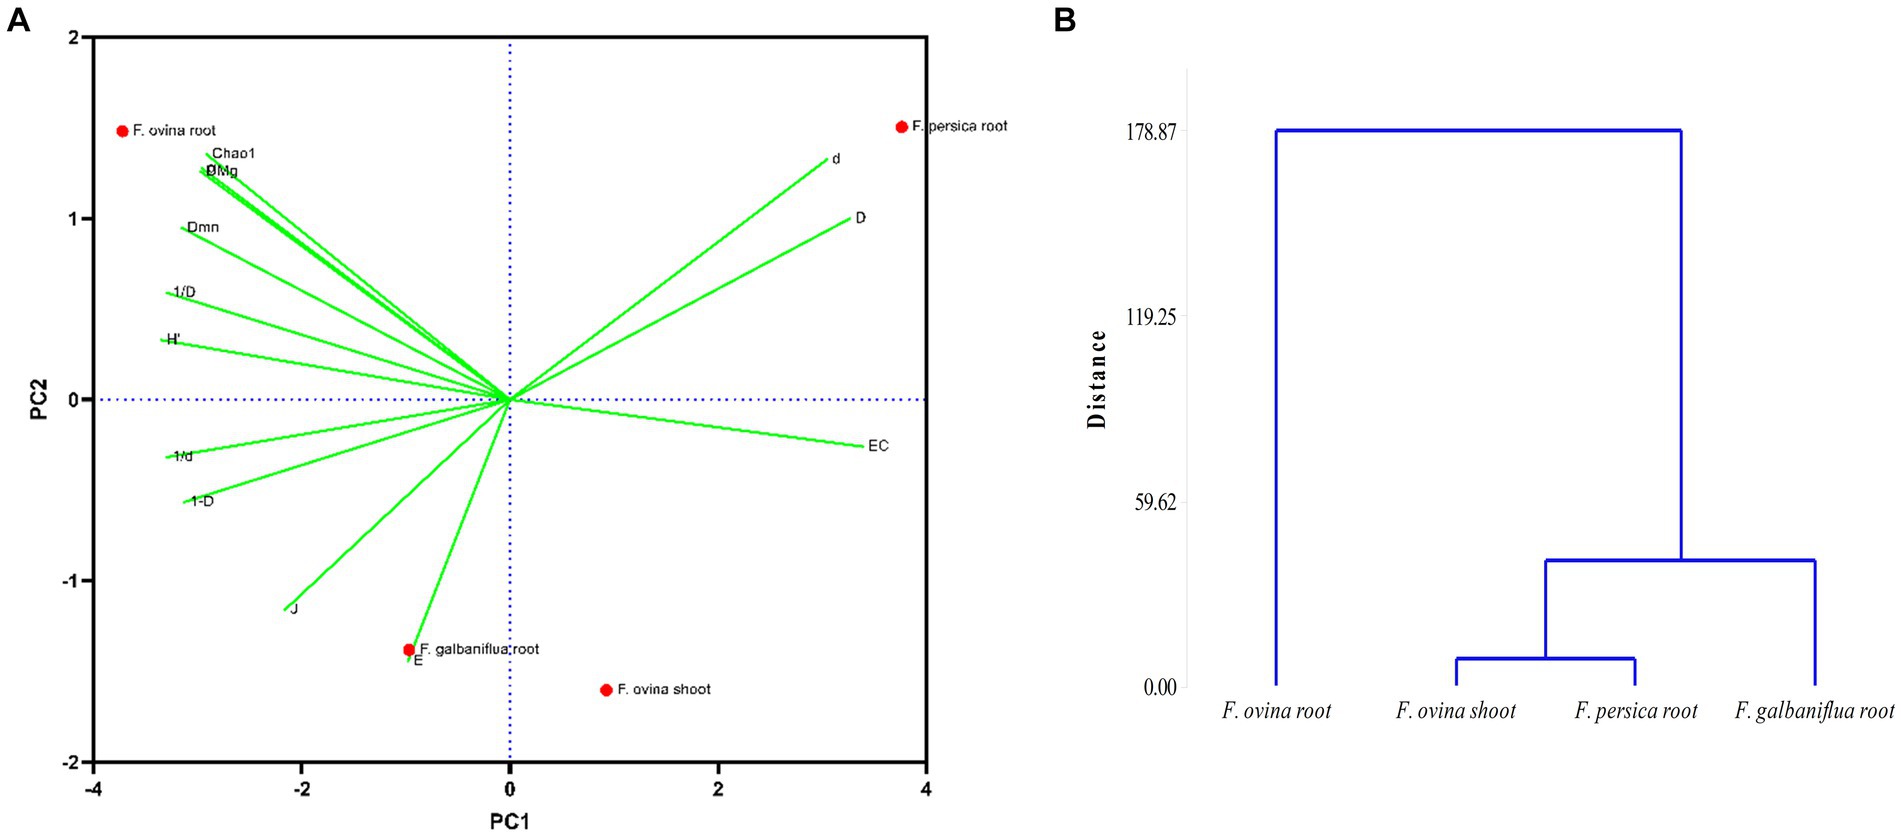
Figure 6. Principal component analysis; the position of Ferula ovina, F. galbaniflua, and F. persica based on diversity indices calculated for the endophytic fungal species community isolated from them (A) and the dendrogram of classifying mentioned Ferula species based on the diversity indices of their endophytic fungal species community (B). Chao1, Chao richness estimator; DMg, Margalef diversity index; H′, Shannon–Wiener diversity index; D, Simpson dominance index; 1-D, Simpson diversity index; 1/D, Reciprocal of Simpson index; d, Berger–Parker dominance index; 1/d, Reciprocal of Berger–Parker index; J, Pielou evenness index; Dmn, Menhinick index; EC, Camargo index; E, Evenness_(e^H′)/S; α, Fisher alpha.
3.5 Extrapolation of fungal endophytic species diversity of F. ovina, F. galbaniflua, and F. persica
A small number of fungal species are typified by many colony-forming units (CFUs), whereas many species are typified by few CFUs. Species frequency/abundance distribution presents the fundamental pattern of niche usage in the community. Plotting the different abundance of fungal endophytic species in the community according to species frequency, from most abundant to least abundant, revealed the distinctive distribution of the fungal species that made up the endophytic fungal community of F. ovina, F. galbaniflua, and F. persica. This blatantly displays a log-normal distribution (Figure 5), suggesting that the interaction of numerous independent environmental factors controls multiplicatively the abundances of the fungal species (Heip et al., 1998).
The frequency of species with different abundance was calculated by the Fisher series for endophytic fungi isolated from three Ferula species (dotted line in Figure 5). The affinity in the observed and calculated series for fungal endophytes isolated from F. ovina roots, except number of species with the least abundance, was very striking. However, the fit for the fungal endophytes isolated from F. galbaniflua roots, F. persica roots, and F. ovina shoots was not good. There were comparatively more rarer species and fewer commoner ones, compared with the calculated series, for fungal endophytes isolated from F. galbaniflua roots. Such results were likewise reported by Fisher et al. (1943).
3.6 Beta diversity analysis of endophytic fungi from F. ovina, F. galbaniflua, and F. persica
Different ecosystems are generally home to various biological communities. Beta diversity, introduced by Whittaker (1960), is defined as differences in species composition among ecosystems within an area of interest. Sorensen (βSor; Sorensen, 1948) and Jaccard (βJac; Jaccard, 1912) indices are the two most widely used non-parametric beta diversity ones. Values of the Jaccard and Sorensen classic indices showed that F. ovina roots had the most similarity in endophytic fungal species with F. galbaniflua roots and then F. ovina shoots (Table 2). The fungal endophytes isolated from F. ovina roots belonged to 57 species (Supplementary Figure S8), 49 species were root-specific (not isolated from F. galbaniflua roots), and 8 species were common with 17 fungal species isolated from F. galbaniflua roots (Supplementary Figure S8). Ten endophytic fungal species were isolated from F. ovina shoots; three fungal species were shoot-specific, but seven of them were also isolated from its roots. As presented in Table 2, F. ovina shoots displayed the highest similarity with its roots in terms of endophytic fungal species. No similarity was observed between endophytic fungal species isolated from F. persica roots than those isolated from F. galbaniflua roots, and F. ovina shoots (Table 2).
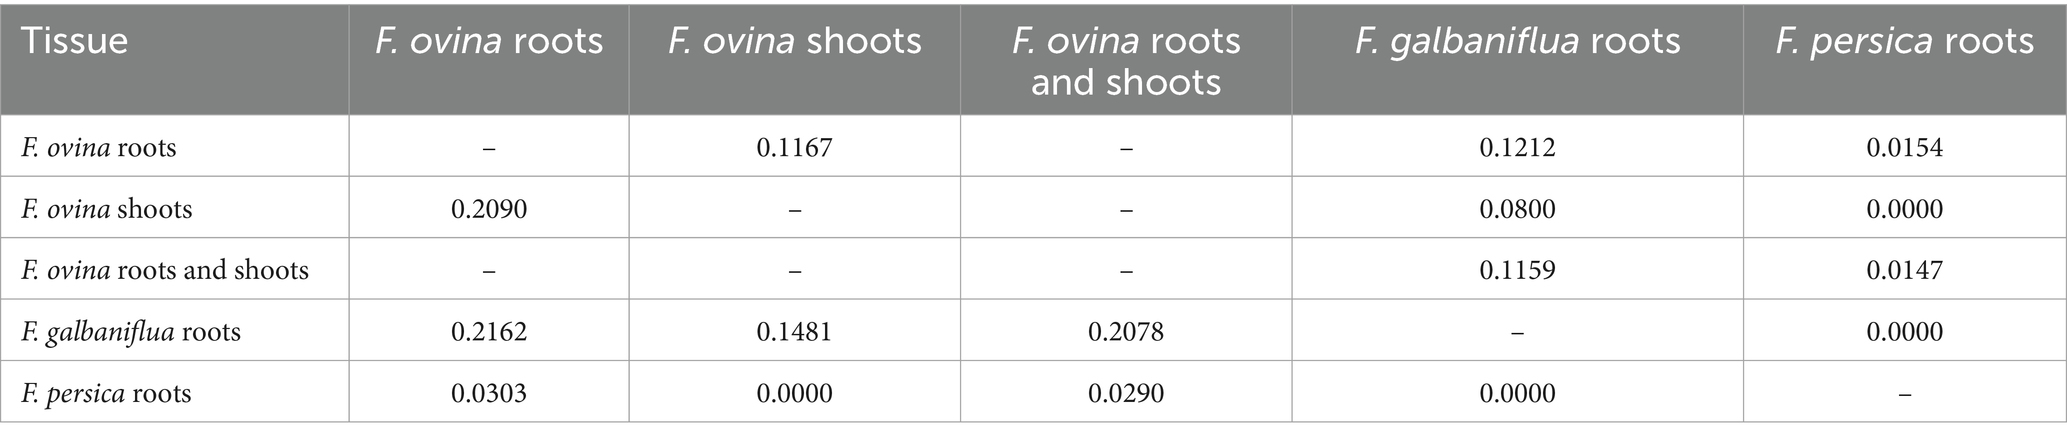
Table 2. Jaccard (above the diameter) and Sorensen (bottom diameter) similarity indices between the fungal species community isolated from Ferula ovina, F. galbaniflua, and F. persica.
3.7 Community ordination and classification
Realizing the natural system that has resulted in the observed grouping of species depends critically on community classification. There are several characteristics shared by all the fungal species in the group that help to distinguish them from other group(s). Cluster analysis was used to classify Ferula spp. based on the Jaccard similarity index of their endophytic fungal species community. F. ovina roots and F. galbaniflua roots clustered together, and they formed a group with F. ovina shoots that was distinct from F. persica roots (Figure 7).
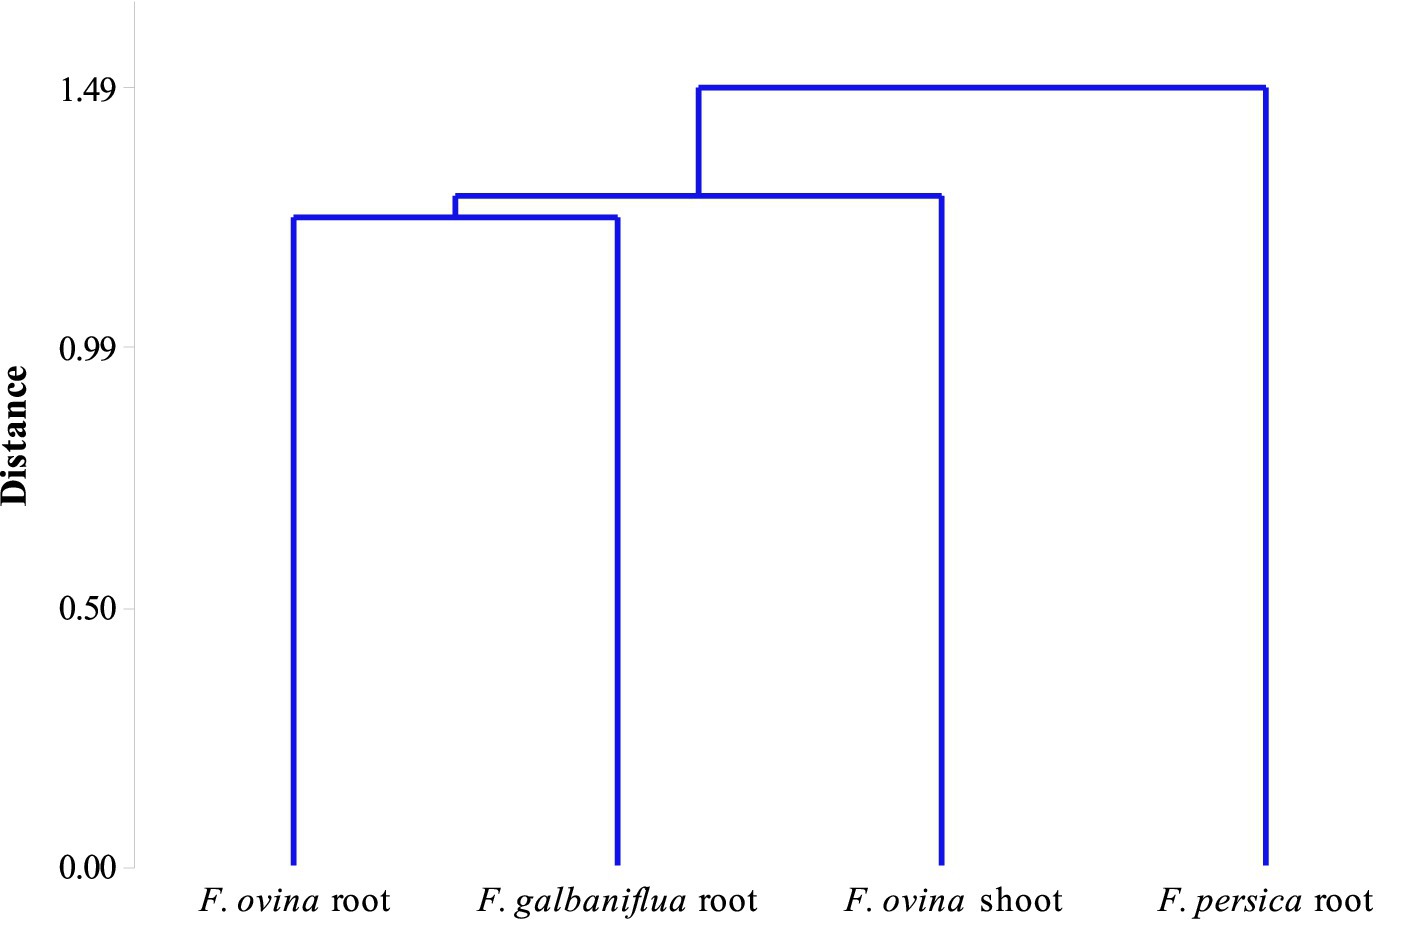
Figure 7. Dendrogram of classifying Ferula ovina, F. galbaniflua, and F. persica based on the Jaccard similarity index of their endophytic fungal species community.
3.8 Specificity of community composition
There is one common genus of endophytic fungus in F. ovina, F. galbaniflua, and F. persica, indicating that Acremonium is the main genus that puts together the culturable fungal community structure of the three mentioned Ferula species (Figure 4). Concurrently, the endemic genera isolated from different Ferula species showed that host genetics might display a remarkable effect on the fungal community structure inhabiting Ferula spp.
The different endophytic fungal genera isolated from F. ovina, F. galbaniflua, and F. persica were classified based on their relative frequency (Figure 8). A genus-level heatmap was made to evaluate possible trends of the relative frequency of endophytic fungal genera by the host (Figure 8); no unidentified fungi were presented in this graph. Fusarium displayed the most abundant genus in F. ovina roots and shoots. Penicillium and Albifimbria were the most abundant genera in F. galbaniflua roots and F. persica roots, respectively (Figure 8).
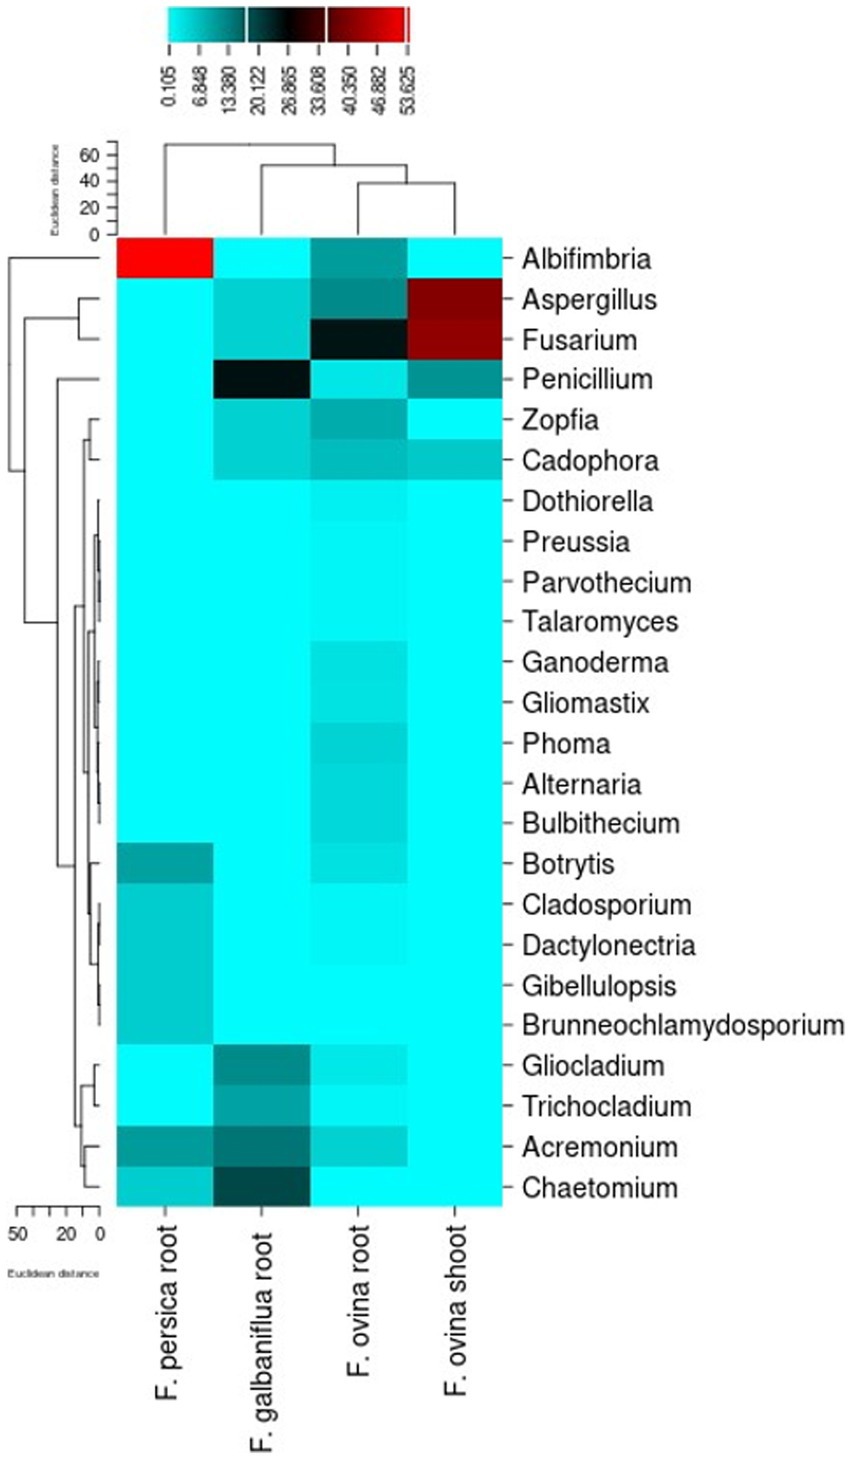
Figure 8. Heat map indicating the relative frequency of the endophytic fungal genera isolated from Ferula ovina, F. galbaniflua, and F. persica.
The various Ferula species were arranged regarding the axes so that relative location to the axes and one another maximized the information on the diversity of endophytic fungal genera isolated from Ferula spp. (Supplementary Figure S12). Principal component analysis performed on 24 endophytic fungal species indicated that the first two principal components explained 80.98% of dataset variation (Supplementary Figure S12). The first and second principal components accounted for 48.42 and 32.56%, respectively, of the total variation and distinguished fungal genus assemblages among F. ovina roots and shoots, F. galbaniflua roots, and F. persica roots. The highest RA of Albifimbria, Botrytis, Cladosporium, Gibellulopsis, Brunneochlamydosporium, and Dactylonectria belonged to F. persica roots (Supplementary Figure S12). As shown in Supplementary Figure S12, F. ovina shoots and F. galbaniflua roots displayed the most similarity in terms of relative endophytic fungal genera. The relative frequency of Zopfia and Bulbithecium in F. ovina roots was the highest compared with F. ovina shoots, F. galbaniflua, and F. persica roots. Alternaria, Bulbithecium, Phoma, Dothiorella, Parvothecium, Talaromyces, Ganoderma, Gliomastix, and Preussia only colonized the roots of F. ovina roots (Supplementary Figure S12).
3.9 Occurrence percentage of endophytic fungal species in F. ovina, F. galbaniflua, and F. persica
Based on the percentage of occurrence of endophytic fungi—the proportion of Ferula species from which each endophytic fungal species was isolated to the number of studied Ferula spp.—they were grouped somewhat arbitrarily in this study. There were three categories; fungal species with 1–33%, 34–67%, and 68–100% were considered sporadic, occasional, and common, respectively. Although this classification is not perfect, it was believed to shed light on the fungal species occurrence in Ferula spp. and simplify the description. Although some fungal species were common members of the mycoflora of two Ferula species studied, each Ferula species was found to have a unique mycoflora. Overall, many endophytic fungal species (88.31%) were sporadically (33%; one of three species) in Ferula spp. Only a smaller number of fungal species (11.69) were isolated occasionally (67%; two of three species) from Ferula species.
4 Discussion
The present study is unique because no particular research has been conducted on the fungal species diversity inhabiting the tissues of Ferula spp. Furthermore, this is the first report on fungal communities isolated from Ferula spp. growing naturally in Iran. Fungal communities exhibit geographical heterogeneity, which has been attributed to factors including host domain range, dispersion limitations, environmental selection, and regional adaptation development. The endophytic community is mostly affected by rainfall. The dispersion of fungal spores and the colonization of endophytes may be aided by rainfall, and high humidity plays an important role in spore germination. Furthermore, a moderate annual temperature may prolong the fungal lifespan and boost the colonization rate of endophytic fungi (Peay et al., 2010).
The results indicated that a range of fungal species are symbiotic with Ferula spp.; all 1,348 isolates were morphologically and molecularly classified into 77 species, and the majority of isolates fell into the phylum of Ascomycetes (Figures 1–3). F. ovina, F. galbaniflua, and F. persica exhibited different patterns in terms of the presence of endophytic fungal species, suggesting a diversity of host-specific endophytic fungi. The diversity of host-specific endophytic microbiomes has been previously reported (Singha et al., 2021). Such exclusive distribution of endophytic fungal species in different plant hosts may indicate the special niche requirements of the endophytic species as well as their specific functional role in their host, including promoting the growth and development, tolerating the environmental stress, and protecting against the herbivores and phytopathogens (Nourian et al., 2024; Ranjbar et al., 2024; Salehi and Safaie, 2024).
The fungal frequency and diversity indices in the shoots and roots of F. ovina, F. galbaniflua, and F. persica showed that the endophytic fungal frequency in the roots was remarkably higher compared to that in the shoots. The roots are in direct contact with the soil as a microbial reservoir. Additionally, the soil medium plays a buffering role against temperature and humidity fluctuations, allowing for the greatest richness of endophytic fungi in the roots. Besides, Ferula spp. are herbaceous perennial plants, and their roots have longer durability compared with shoots. It could explain why F. ovina, F. galbaniflua, and F. persica roots had higher fungal diversity and species richness compared with their shoots. Moreover, endophytic fungal frequency and distribution are likely affected by the content of biologically active compounds in tissues. Certain fungal species are able to survive in a specific tissue (Carroll and Petrini, 1983). Endophytic tissue-specific diversity has been previously reported (Fang et al., 2019). The higher CF and fungal species diversity of the roots of these Ferula species compared with shoots can also be explained by the transmission route of endophytic fungi in arid and semi-arid areas. Most endophytes reside in roots, belong to class 4 of the non-clavicipitaceous (NC) endophytes, and are horizontally transmitted from one host plant to another (Rodriguez et al., 2009). In arid and semi-arid areas, flora is sporadic and has low density and diversity, but plants have well-developed underground systems that form nutrient-rich resource patches (Zuo et al., 2020). Because there are more hosts and substrates for these fungi to infect, the distribution of expanded root systems and nutritional status in a desert environment may therefore result in higher CF and fungal species diversity in the roots compared with the shoots.
However, there are inevitably inherent biases in both culture-independent and culture-dependent methods of studying fungal diversity (Wijayawardene et al., 2021). In the present study, culture-dependent methods were used to allow these endophytic fungi to be used in co-culture with Ferula cell culture for enhancing secondary metabolite production and in bioformulation for coping with biotic and abiotic stress in Ferula.
5 Conclusion
The internal environments of Ferula spp. affected the diversity of endophytic fungi they harbored, indicating host specificity. The investigation of the diversity of endophytic fungi in Ferula not only provides fungal endophytic resources for exploiting beneficial relations among endophytic fungi and Ferula spp., including the synthesis of bioactive compounds, growth promotion, and plant protection against biotic and abiotic stress but also facilitates the effective artificial cultivation of Ferula spp. native to Iran on a large scale and their quality control.
Data availability statement
The original contributions presented in the study are included in the article/Supplementary material, further inquiries can be directed to the corresponding authors.
Author contributions
NS: Conceptualization, Methodology, Project administration, Resources, Supervision, Validation, Writing – review & editing. MS: Conceptualization, Data curation, Formal analysis, Investigation, Methodology, Project administration, Software, Validation, Visualization, Writing – original draft, Writing – review & editing. MF: Investigation, Writing – review & editing. SF: Data curation, Formal analysis, Methodology, Software, Validation, Writing – review & editing. SK: Investigation, Writing – review & editing. SA: Investigation, Writing – review & editing. J-LY: Funding acquisition, Writing – review & editing. MN: Funding acquisition, Writing – review & editing.
Funding
The author(s) declare financial support was received for the research, authorship, and/or publication of this article. The authors acknowledged the Iran National Science Foundation (INSF, no. 4001289) and the National Natural Science Foundation of China (no. 32161143019) for their financial support of this study.
Conflict of interest
The authors declare that the research was conducted in the absence of any commercial or financial relationships that could be construed as a potential conflict of interest.
The author(s) declared that they were an editorial board member of Frontiers, at the time of submission. This had no impact on the peer review process and the final decision.
Publisher’s note
All claims expressed in this article are solely those of the authors and do not necessarily represent those of their affiliated organizations, or those of the publisher, the editors and the reviewers. Any product that may be evaluated in this article, or claim that may be made by its manufacturer, is not guaranteed or endorsed by the publisher.
Supplementary material
The Supplementary material for this article can be found online at: https://www.frontiersin.org/articles/10.3389/fmicb.2024.1363158/full#supplementary-material
References
Aneja, K. (2007). Experiments in microbiology, plant pathology and biotechnology. New Age Int. 4, 157–162,
Busby, P. E., Ridout, M., and Newcombe, G. (2016). Fungal endophytes: modifiers of plant disease. Plant Mol. Biol. 90, 645–655. doi: 10.1007/s11103-015-0412-0
Camargo, J. A. (1992). Temporal and spatial variations in dominance, diversity and biotic indices along a limestone stream receiving a trout farm effluent. Water Air Soil Pollut. 63, 343–359. doi: 10.1007/BF00475501
Carroll, G., and Petrini, O. (1983). Patterns of substrate utilization by some fungal endophytes from coniferous foliage. Mycologia 75, 53–63. doi: 10.1080/00275514.1983.12021637
Chao, A. (1984). Non-parametric estimation of the number of classes in a population. Scand. J. Stat. 11, 265–270,
Dos Reis, J. B. A., Lorenzi, A. S., and do Vale, H. M. M. (2022). Methods used for the study of endophytic fungi: a review on methodologies and challenges, and associated tips. Arch. Microbiol. 204:675. doi: 10.1007/s00203-022-03283-0
Faeth, S. H., and Fagan, W. F. (2002). Fungal endophytes: common host plant symbionts but uncommon mutualists. Integr. Comp. Biol. 42, 360–368. doi: 10.1093/icb/42.2.360
Fang, K., Miao, Y.-F., Chen, L., Zhou, J., Yang, Z.-P., Dong, X.-F., et al. (2019). Tissue-specific and geographical variation in endophytic fungi of Ageratina adenophora and fungal associations with the environment. Front. Microbiol. 10:2919. doi: 10.3389/fmicb.2019.02919
Farhadi, S., Moieni, A., Safaie, N., Sabet, M. S., and Salehi, M. (2020a). Fungal cell wall and methyl-β–cyclodextrin synergistically enhance paclitaxel biosynthesis and secretion in Corylus avellana cell suspension culture. Sci. Rep. 10:5427. doi: 10.1038/s41598-020-62196-4
Farhadi, S., Salehi, M., Moieni, A., Safaie, N., and Sabet, M. S. (2020b). Modeling of paclitaxel biosynthesis elicitation in Corylus avellana cell culture using adaptive neuro-fuzzy inference system-genetic algorithm (ANFIS-GA) and multiple regression methods. PLoS One 15:e0237478. doi: 10.1371/journal.pone.0237478
Fisher, R. A., Corbet, A. S., and Williams, C. B. (1943). The relation between the number of species and the number of individuals in a random sample of an animal population. J. Anim. Ecol. 12, 42–58. doi: 10.2307/1411
Hardoim, P. R., Van Overbeek, L. S., Berg, G., Pirttilä, A. M., Compant, S., Campisano, A., et al. (2015). The hidden world within plants: ecological and evolutionary considerations for defining functioning of microbial endophytes. Microbiol. Mol. Biol. Rev. 79, 293–320. doi: 10.1128/MMBR.00050-14
Hata, K., and Futai, K. (1995). Endophytic fungi associated with healthy pine needles and needles infested by the pine needle gall midge, Thecodiplosis japonensis. Can. J. Bot. 73, 384–390. doi: 10.1139/b95-040
Heip, C. H., Herman, P. M., and Soetaert, K. (1998). Indices of diversity and evenness. Oceanis 24, 61–88,
Huang, W., Cai, Y., Hyde, K., Corke, H., and Sun, M. (2008). Biodiversity of endophytic fungi associated with 29 traditional Chinese medicinal plants. Fungal Divers. 33, 61–75,
Hurlbert, S. H. (1971). The nonconcept of species diversity: a critique and alternative parameters. Ecology 52, 577–586. doi: 10.2307/1934145
Jaccard, P. (1912). The distribution of the flora in the alpine zone. New Phytol. 11, 37–50. doi: 10.1111/j.1469-8137.1912.tb05611.x
Jahedi, A., Salehi, M., Goltapeh, E. M., and Safaie, N. (2023). Multilayer perceptron-genetic algorithm as a promising tool for modeling cultivation substrate of Auricularia cornea native to Iran. PLoS One 18:e0281982. doi: 10.1371/journal.pone.0281982
Jia, M., Chen, L., Xin, H. L., Zheng, C. J., Rahman, K., Han, T., et al. (2016). A friendly relationship between endophytic fungi and medicinal plants: a systematic review. Front. Microbiol. 7:906. doi: 10.3389/fmicb.2016.00906
Kaul, S., Sharma, T., and Dhar, M. K. (2016). “Omics” tools for better understanding the plant–endophyte interactions. Front. Plant Sci. 7:955. doi: 10.3389/fpls.2016.00955
Kim, B. R., Shin, J., Guevarra, R. B., Lee, J. H., Kim, D. W., Seol, K. H., et al. (2017). Deciphering diversity indices for a better understanding of microbial communities. J. Microbiol. Biotechnol. 27, 2089–2093. doi: 10.4014/jmb.1709.09027
Margalef, R. (1958). “Temporal succession and spatial heterogeneity in phytoplankton” in Perspectives in marine biology. ed. A. A. Buzzati-Traverso (Berkeley: Univ. Calif. Press), 323–347.
Matsumura, E., and Fukuda, K. (2013). A comparison of fungal endophytic community diversity in tree leaves of rural and urban temperate forests of Kanto district, eastern Japan. Fungal Biol. 117, 191–201. doi: 10.1016/j.funbio.2013.01.007
Mohammadhosseini, M., Venditti, A., Sarker, S. D., Nahar, L., and Akbarzadeh, A. (2019). The genus Ferula: ethnobotany, phytochemistry and bioactivities–a review. Ind. Crops Prod. 129, 350–394. doi: 10.1016/j.indcrop.2018.12.012
Mucciarelli, M., Scannerini, S., Bertea, C., and Maffei, M. (2003). In vitro and in vivo peppermint (Mentha piperita) growth promotion by nonmycorrhizal fungal colonization. New Phytol. 158, 579–591. doi: 10.1046/j.1469-8137.2003.00762.x
Muthukrishnan, S., Sanjayan, K., and Jahir, H. (2012). Species composition, seasonal changes and community ordination of alkalotolerant micro fungal diversity in a natural scrub jungle ecosystem of Tamil Nadu, India. Mycosphere 3, 92–109. doi: 10.5943/mycosphere/3/2/1
Nisa, H., Kamili, A. N., Nawchoo, I. A., Shafi, S., Shameem, N., and Bandh, S. A. (2015). Fungal endophytes as prolific source of phytochemicals and other bioactive natural products: a review. Microb. Pathog. 82, 50–59. doi: 10.1016/j.micpath.2015.04.001
Nourian, A., Salehi, M., Safaie, N., and Khelghatibana, F. (2024). Biocontrol of Diplodia bulgarica, the causal agent of apple canker, using Trichoderma zelobreve. Arch. Microbiol. 206:120. doi: 10.1007/s00203-024-03852-5
Nourian, A., Salehi, M., Safaie, N., Khelghatibana, F., and Abdollahzadeh, J. (2021). Fungal canker agents in apple production hubs of Iran. Sci. Rep. 11:22646. doi: 10.1038/s41598-021-02245-8
Oktavianti, R., and Purwanti, F. (2014). Kelimpahan echinodermata pada ekosistem padang lamun di Pulau Panggang, Kepulauan Seribu, Jakarta. MAQUARES 3, 243–249. doi: 10.14710/marj.v3i4.7105
Panahi, M., and Mahmoodi, M. (2021). Species distribution patterns of Ferula sect. Merwia. Rostaniha 22, 159–185. doi: 10.22092/BOTANY.2021.354488.1243
Peay, K. G., Bidartondo, M. I., and Arnold, A. E. (2010). Not every fungus is everywhere: scaling to the biogeography of fungal–plant interactions across roots, shoots and ecosystems. New Phytol. 185, 878–882. doi: 10.1111/j.1469-8137.2009.03158.x
Ranjbar, Z., Salehi, M., and Safaie, N. (2024). An endophytic Trichoderma-based wettable powder formulation for biocontrol of apple stem cankers. J. Phytopathol. 172:e13266. doi: 10.1111/jph.13266
Rodriguez, R. J., Henson, J., Van Volkenburgh, E., Hoy, M., Wright, L., Beckwith, F., et al. (2008). Stress tolerance in plants via habitat-adapted symbiosis. ISME J. 2, 404–416. doi: 10.1038/ismej.2007.106
Rodriguez, R. J., White, J. F. Jr., Arnold, A. E., and Redman, A. R. A. (2009). Fungal endophytes: diversity and functional roles. New Phytol. 182, 314–330. doi: 10.1111/j.1469-8137.2009.02773.x
Safaian, N., and Shokri, M. (1993). Botanical and ecological study of species of the genus Ferula (medicinal plants) in Mazandaran province. Acta Hortic. 333, 159–164. doi: 10.17660/ActaHortic.1993.333.18
Salehi, M., and Farhadi, S. (2022). “Strategies for enhancing paclitaxel bioavailability for cancer treatment. In paclitaxel” in Paclitaxel: Sources, chemistry, anticancer actions, and current biotechnology. eds. M. K. Swamy, T. Pullaiah, and Z. S. Chen (United Kingdom: Academic Press, Elsevier), 129–153.
Salehi, M., Farhadi, S., Moieni, A., Safaie, N., and Ahmadi, H. (2020a). Mathematical modeling of growth and paclitaxel biosynthesis in Corylus avellana cell culture responding to fungal elicitors using multilayer perceptron-genetic algorithm. Front. Plant Sci. 11:545556. doi: 10.3389/fpls.2020.01148
Salehi, M., Farhadi, S., Moieni, A., Safaie, N., and Hesami, M. (2021). A hybrid model based on general regression neural network and fruit fly optimization algorithm for forecasting and optimizing paclitaxel biosynthesis in Corylus avellana cell culture. Plant Methods 17:13. doi: 10.1186/s13007-021-00714-9
Salehi, M., Moieni, A., and Safaie, N. (2018). Elicitors derived from hazel (Corylus avellana L.) cell suspension culture enhance growth and paclitaxel production of Epicoccum nigrum. Sci. Rep. 8:12053. doi: 10.1038/s41598-018-29762-3
Salehi, M., Moieni, A., Safaie, N., and Farhadi, S. (2019a). Elicitors derived from endophytic fungi Chaetomium globosum and Paraconiothyrium brasiliense enhance paclitaxel production in Corylus avellana cell suspension culture. Plant Cell Tissue Organ Cult. 136, 161–171. doi: 10.1007/s11240-018-1503-9
Salehi, M., Moieni, A., Safaie, N., and Farhadi, S. (2019b). New synergistic co-culture of Corylus avellana cells and Epicoccum nigrum for paclitaxel production. J. Ind. Microbiol. Biotechnol. 46, 613–623. doi: 10.1007/s10295-019-02148-8
Salehi, M., Moieni, A., Safaie, N., and Farhadi, S. (2020b). Whole fungal elicitors boost paclitaxel biosynthesis induction in Corylus avellana cell culture. PLoS One 15:e0236191. doi: 10.1371/journal.pone.0236191
Salehi, M., Naghavi, M. R., and Bahmankar, M. (2019c). A review of Ferula species: biochemical characteristics, pharmaceutical and industrial applications, and suggestions for biotechnologists. Ind. Crops Prod. 139:111511. doi: 10.1016/j.indcrop.2019.111511
Salehi, M., and Safaie, N. (2024). Endophytic fungi: secondary metabolites and plant biotic and abiotic stress management. Front. Microbiol. 15:1345210. doi: 10.3389/fmicb.2024.1345210
Shannon, C. E. (1948). A mathematical theory of communication. Bell Syst. Tech. J. 27, 379–423. doi: 10.1002/j.1538-7305.1948.tb01338.x
Singha, K. M., Singh, B., and Pandey, P. (2021). Host specific endophytic microbiome diversity and associated functions in three varieties of scented black rice are dependent on growth stage. Sci. Rep. 11:12259. doi: 10.1038/s41598-021-91452-4
Sonigra, P., and Meena, M. (2021). Metabolic profile, bioactivities, and variations in the chemical constituents of essential oils of the Ferula genus (Apiaceae). Front. Pharmacol. 11:608649. doi: 10.3389/fphar.2020.608649
Sorensen, T. (1948). A method of establishing groups of equal amplitude in plant sociology based on similarity of species content and its application to analyses of the vegetation on Danish commons. Biol. Skr. 5, 1–34,
Torres-Cortes, G., Bonneau, S., Bouchez, O., Genthon, C., Briand, M., Jacques, M. A., et al. (2018). Functional microbial features driving community assembly during seed germination and emergence. Front. Plant Sci. 9:902. doi: 10.3389/fpls.2018.00902
Tutte, J. (1969). Plant pathological methods: Fungi and Bacteria. Minneapolis, MN, USA: Burgess Publishing Company, 229.
Wearn, J. A., Sutton, B. C., Morley, N. J., and Gange, A. C. (2012). Species and organ specificity of fungal endophytes in herbaceous grassland plants. J. Ecol. 100, 1085–1092. doi: 10.1111/j.1365-2745.2012.01997.x
Whittaker, R. H. (1960). Vegetation of the Siskiyou mountains, Oregon and California. Ecol. Monogr. 30, 279–338. doi: 10.2307/1943563
Whittaker, R. H. (1977) in Evolution of species diversity in land communities. eds. M. K. Hecht and B. W. N. C. Steere, vol. 10 (New York: Evolutionary Biology, Plenum Press), 1–67.
Wijayawardene, N. N., Bahram, M., Sánchez-Castro, I., Dai, D.-Q., Ariyawansa, K. G., Jayalal, U., et al. (2021). Current insight into culture-dependent and culture-independent methods in discovering Ascomycetous taxa. J. Fungi. 7:703. doi: 10.3390/jof7090703
Keywords: dominance and evenness indices, mycoflora, Ferula ovina , F. galbaniflua , F. persica , species richness
Citation: Safaie N, Salehi M, Felegari M, Farhadi S, Karimzadeh S, Asadi S, Yang J-L and Naghavi MR (2024) Culture-based diversity of endophytic fungi of three species of Ferula grown in Iran. Front. Microbiol. 15:1363158. doi: 10.3389/fmicb.2024.1363158
Edited by:
Prem Lal Kashyap, Indian Institute of Wheat and Barley Research (ICAR), IndiaReviewed by:
Sakineh Abbasi, Institut National de recherche pour l’agriculture, l’alimentation et l’environnement (INRAE), FranceDebdulal Banerjee, Vidyasagar University, India
Copyright © 2024 Safaie, Salehi, Felegari, Farhadi, Karimzadeh, Asadi, Yang and Naghavi. This is an open-access article distributed under the terms of the Creative Commons Attribution License (CC BY). The use, distribution or reproduction in other forums is permitted, provided the original author(s) and the copyright owner(s) are credited and that the original publication in this journal is cited, in accordance with accepted academic practice. No use, distribution or reproduction is permitted which does not comply with these terms.
*Correspondence: Naser Safaie, bnNhZmFpZUBtb2RhcmVzLmFjLmly; Mina Salehi, c2FsZWhpLm1pbmFzbUBnbWFpbC5jb20=; Mohammad Reza Naghavi, bW5hZ2hhdmlAdXQuYWMuaXI=