
94% of researchers rate our articles as excellent or good
Learn more about the work of our research integrity team to safeguard the quality of each article we publish.
Find out more
ORIGINAL RESEARCH article
Front. Microbiol. , 29 January 2024
Sec. Food Microbiology
Volume 14 - 2023 | https://doi.org/10.3389/fmicb.2023.1328824
 Yuenan Wang1,2,3†
 Qingting Peng1,2,3†
 Yang Liu1,2,3
 Na Wu1,2,3
 Yanyan He1,2,3
 Xinrui Cui1,2,3
 Tong Dan1,2,3*
Exopolysaccharides (EPSs), which are produced by lactic acid bacteria, have been found to improve the texture and functionality of fermented dairy products. In a previous study, four nitrogen sources were identified as affecting the yield, molecular weight and structure of EPSs produced by Streptococcus thermophilus IMAU20561 in M17 medium. In this genomic and transcriptomics study, a novel eps gene cluster responsible for assembly of repeating units of EPS is reported. This eps cluster (22.3 kb), consisting of 24 open reading frames, is located in the chromosomal DNA. To explore the biosynthetic mechanisms in EPS, we completed RNA-seq analysis of S. thermophilus IMAU20561 grown in four different nitrogen sources for 5 h (log phase) or 10 h (stationary phase). GO functional annotation showed that there was a significant enrichment of differentially expressed genes (DEGs) involved in: amino acid biosynthesis and metabolism; ribonucleotide biosynthesis and metabolism; IMP biosynthesis and metabolism; and phosphorus metabolism. KEGG functional annotation also indicated enrichment of DEGs involved in amino acid biosynthesis, glycolysis, phosphotransferase system, fructose, and mannose metabolism. Our findings provide a better understanding the genetic traits of S. thermophilus, the biosynthetic pathways needed for the production of EPS, and a theoretical basis for screening dairy starter cultures.
Many lactic acid bacteria (LAB) are widely used in medicine, dairy products, and biotechnology due to their generally recognized as safe (GRAS) status (Plavec and Berlec, 2020). Exopolysaccharides (EPS) are one of the most important secondary metabolites produced by LAB during metabolism; they are secreted externally to the cell surface and contribute to growth promotion and retardation of water loss from microbial cells (Angelin and Kavitha, 2020). As organic macromolecules, EPSs have complex and diverse structures and are widely employed in the fermented dairy products industry as thickeners, stabilizers, emulsifiers, and gelling agents (Daba et al., 2021; Tiwari et al., 2021). LAB EPSs also have beneficial effects on human health because of their antioxidant and antitumor properties and cholesterol-lowering abilities and also known for enhancing immunity and improving the gastrointestinal environment (Maeda et al., 2004; Laiño et al., 2016; Chen et al., 2022).
Several factors influence the yield and phenotypic characteristics of EPSs, such as carbon sources, nitrogen sources and incubation conditions (e.g., temperature, pH, agitation, oxygen levels and aeration) (Abd-Alla et al., 2018; Wu and Shah, 2018; Cheng et al., 2019). Recently researchers have focused their attention on EPS production by LAB on different carbon sources as essential components of the growth media (Oleksy-Sobczak and Klewicka, 2020). For example, the chemical composition, structure, morphology, and physicochemical properties of EPSs produced by Lactobacillus rhamnosus varied depending on the carbon source (Polak-Berecka et al., 2015). Yang et al. (2010) also reported that L. rhamnosus JAAS8 was capable of producing two forms of EPS, capsular and slime-polysaccharides, when grown in MRS broth or semi-defined medium with glucose as a carbon source. Similarly, nitrogen sources are important components in media and act as essential elements for growth (Karadeniz et al., 2021). Zhang et al. (2011) reported that growth and polymerization exopolysaccharides by Streptococcus thermophilus ST1 can be promoted by adding the protein concentrate to skimmed milk medium. However, the biosynthetic mechanisms responsible for exopolysaccharide production under different nitrogen sources are not clear. Hence, in this study, we used detailed multi-omics techniques to investigate EPS production mechanisms in S. thermophilus IMAU20561 (S. thermophilus IMAU20561) when grown in the presence of different nitrogen sources that influence the production of EPS.
In a previous study, we showed that the type of nitrogen source significantly affected yield, chemical composition and molecular weight of EPSs produced by S. thermophilus IMAU20561 (Liu et al., 2022). When soybean peptone was employed as the single nitrogen source, the amount of exopolysaccharide produced by this strain was 480.7 mg/L. When casein peptone was used as the single nitrogen source, the EPS produced had the largest molecular weight. There were significant differences in the structure of EPS when grown using different nitrogen sources. The EPS obtained on soybean medium mainly consisted of glucuronic acid, glucose, and galactose. The EPS obtained on micro tryptone medium was mainly made up of glucuronic acid, glucose, and galactose. The EPS obtained on casein peptone medium and basic medium M17 mainly comprised mannose, glucose, and galactose. This motivated us to study intracellular changes in relation to biosynthesis of bacterial EPSs. The phenotypic characteristics of EPS are complicated and regulated by genes associated with EPS biosynthesis, which are poorly understood in S. thermophilus IMAU20561. Therefore, in this study, we completed a genomic and transcriptomic analysis of S. thermophilus IMAU20561 grown in M17 medium using different nitrogen sources (soy peptone, tryptone, casein peptone) to examine the key regulatory genes involved in the EPS biosynthesis pathway and resulting EPS phenotypic characteristics in the S. thermophilus IMAU20561.
Based on the results for S. thermophilus ASCC 1275 (Padmanabhan et al., 2018) and preliminary observations of large differences in EPS production in the presence of different nitrogen sources, two time points (5, 10 h) were chosen for studying transcriptomics. The primary goal of this study was to investigate nitrogen source-associated changes in mRNA expression levels of S. thermophilus IMAU20561 to understand the regulatory mechanism driving the phenotypic characteristics of EPS. This research lays a new theoretical and practical foundation for further studies on the regulation of phenotypic characteristics of bacterial EPS.
Streptococcus thermophilus IMAU20561 originated from yogurt sampled in the Zavkhan Province, Mongolia, and was used throughout this study (Liu et al., 2022). The S. thermophilus isolate was cultured at 37°C for 24 h in M17 liquid broth and then incubated under the same conditions in 50 and 500 ml M17 medium, at a 2% inoculation rate. Cells were collected as a pellet following centrifugation for 5 min at 4,000 g (4°C), washed twice with phosphate-buffered saline (PBS) at pH 7.4 containing 0.8% NaCl, 0.02% KCl, 0.02% KH2PO4, 0.115% Na2HPO4 and then suspended in PBS buffer.
Streptococcus thermophilus IMAU20561 was activated and then incubated at a 2% inoculation rate in either M17 medium, which contains a complex nitrogen source (5 g/L of soy peptone, 2.5 g/L of casein peptone, 2.5 g/L of peptone, 2.5 g/L of beef peptone, 5 g/L of yeast extract powder), or in medium in which the complex nitrogen source was replaced with either soy peptone (17.5 g/L), tryptone (17.5 g/L) or casein peptone (17.5 g/L) as sole nitrogen sources. After 24 h of incubation at 37°C, OD600 values were then recorded every hour and the growth curve of S. thermophilus IMAU20561 plotted for each medium.
The Wizard® Genomic DNA Purification Kit (Promega) was used to extract DNA from cells according to the manufacturer's instructions (Smith et al., 2003). Then, the integrity and quality of the extracted DNA fragments were confirmed by 1% agarose gel electrophoresis.
The S. thermophilus IMAU20561 genome was sequenced using Glimmer v3.02 software (http://www.cbcb.umd.edu/software/glimmer/) (Delcher et al., 2007). Amino acid sequences were extracted from the annotated coding sequences and used for assignment and searched against Rapid Annotation using Subsystem Technology (RAST) (Brettin et al., 2015). Clusters of Orthologous Groups of proteins (COG) annotations were made to explore unigenes (http://www.ncbi.nlm.nih.gov/COG/) (Tatusov et al., 2003; Hyatt et al., 2010). Next, functional assignments were described by Gene Ontology (GO; http://www.geneontology.org) using Blast2GO software (Qi et al., 2016). Pathway assignments were mapped according to the Kyoto encyclopedia of genes and genomes (KEGG) database (http://www.genome.jp/kegg) (Li et al., 2021). A circular graphical map of S. thermophilus IMAU20561 was drawn using CGView (http://stothard.afns.ualberta.ca/cgview_server/) (Stothard et al., 2019) software.
Total RNA was extracted from S. thermophilus IMAU20561 grown on M17 medium containing different nitrogen sources using TRIzol reagent (Invitrogen) following the manufacturer's instructions. RNA extracts were treated with DNase I (Ambion) as recommended by the manufacturer and were measured at an absorbance of 260 nm using ND-2000 (NanoDrop Technologies). The purity of RNA was checked with an Agilent 2100 bioanalyzer (Agilent Technologies, Santa Clara, CA, United States). For cDNA synthesis, First Strand Master Mix and Super Script II reverse transcriptase (Invitrogen) were employed according to the manufacturer's instructions. The mixture was incubated at 50°C for 15 min followed by inactivation at 80°C for 2 min. The primers were designed by primer premier 5.0 software (Table 1) designed based on S. thermophilus IMAU20561 eps cluster sequences and other known genes involved in EPS biosynthesis. Quantitative real-time PCR was performed using the LineGene 9600 Plus RT-PCR detection system (Hangzhou Bori Technology Co., Ltd., China) and SYBR green PCR master mix (Applied Biosystems) as recommended by the manufacturer. Cycle conditions were 94°C for 2 min, followed by 40 cycles of denaturation at 94°C for 30 s, annealing at 60°C for 60 s, extension at 68°C for 120 s, and a final extension at 68°C for 7 min. The 16S rDNA gene was used as a reference gene for expression analysis, and the comparative critical threshold method (2−ΔΔCt) method was used to calculate the relative expression of each target gene.
Transcriptional analysis was performed on genes involved in EPS biosynthesis in S. thermophilus IMAU20561 grown for 5 h and 10 h in M17 medium containing different nitrogen sources, such as either soy peptone, tryptone, casein peptone as the sole sources or the complex nitrogen source typical of the M17 medium. The construction of the transcriptome library was done by the Shanghai Meiji Biological Analysis and Testing Co., Ltd. (Meiji, Shanghai) with the TruSeqTM RNA sample preparation Kit (Illumina, San Diego, CA). The mRNA was fragmented using metal ions and double-stranded cDNA was reverse transcribed with random primers using the SuperScript double-stranded cDNA kit (Invitrogen, CA). The second cDNA strand was synthesized, with dUTP instead of deoxythymidine triphosphate (dTTP), cDNA ends were patched with End Repair Mix and phosphorylated at the 5′ end and adenylated at the 3′ end. The cDNA library-enriched and the PCR were amplified using Phusion DNA polymerase (NEB). RNA-seq sequencing was done using Illumina HiSeq X Ten (2 × 150 bp).
The raw image signal obtained by high-throughput sequencing (Illumina HiSeq X Ten) was transformed into sequenced reads in the FASTQ format and filtered to obtain clean reads by removing adapter sequences, low-quality sequences (QV <Q20), sequences with more than 10% N. Genomic localization analysis of filtered sequences of S. thermophilus IMAU20561 (GenBank accession: GCA_021294245.1) was performed using Bowtie2 (http://bowtie-bio.sourceforge.net/bowtie2/index.Shtml) (Nie et al., 2021). Moreover, the expected number of Fragments Per Kilobase of transcript sequence per Million base pairs sequenced (FPKM) value was used to represent the expression level. Functional pathway enrichment analysis was performed on the KEGG pathway including analysis of the metabolic network. GO analysis of DEGs were done using Goatools (https://github.com/tanghaibao/GOatools). GO terms with the corrected p-values <0.05 were considered as significantly enriched in DEGs.
The results were expressed as the mean ± SD of three replicates. All digital analyses were carried out using the SPSS (IBM, USA). A p value <0.05 was deemed statistically significant.
The complete genome sequence of S. thermophilus IMAU20561 contains a circular 1,716,258 bp chromosome with 39.03% GC content, with N50 and N90 values of 127,615 bp and 31,779 bp, respectively; no plasmids were identified (Figure 1). The total length of 1,914 CDS coding genes, four rRNA operons and 42 tRNAs was 1,436,388 bp, accounting for 83.69% of the total genome (DDBJ accession no. GCA_021294245.1). From outer to inner rings, the first and fourth circles were on the forward strand, the second and third circles represented the reverse of CDS, tRNA, rRNA, the fifth circle represented GC content and the sixth circle represented GC-Skew. Using the original genome of the model strain S. thermophilus NCTC 12958 as reference, the average nucleotide (ANI) value of the two strains was calculated. The results showed that the average ANI value of the two strains was 98.42%. The strains showed a high similarity with the reference genome, indicating that S. thermophilus IMAU20561 belonged to the same species as the reference strain.
All generated unigenes were aligned against COG, GO, and KEGG databases and annotated with function (Figures 2–4). The COG annotation (Figure 2) indicated that a total of 1,549 genes were obtained from the predicted coding region of the genome; among the identified genes, 345 were of unknown function, 199 were involved in amino acid transport and metabolism, 144 were associated with ribosome structure, translation and biosynthesis, 139 appeared to be involved in replication, recombination and repair, 99 were involved in carbohydrate transport and metabolism, and 365 genes with potential biological functions were not annotated. For the COG annotations, 1,414 genes in the genome were annotated using the GO database and assigned to three major functional classifications (Figure 3), including “biological processes,” “cellular components,” and “molecular function.” A total of 1,108 genes were obtained by KEGG annotation, which included 127 genes for amino acid metabolism (11.5%) and 114 for regulation of the carbohydrate metabolism (10.4%; Figure 4). In addition, some genes associated with membrane transport, nucleotide metabolism and translation were also enriched.
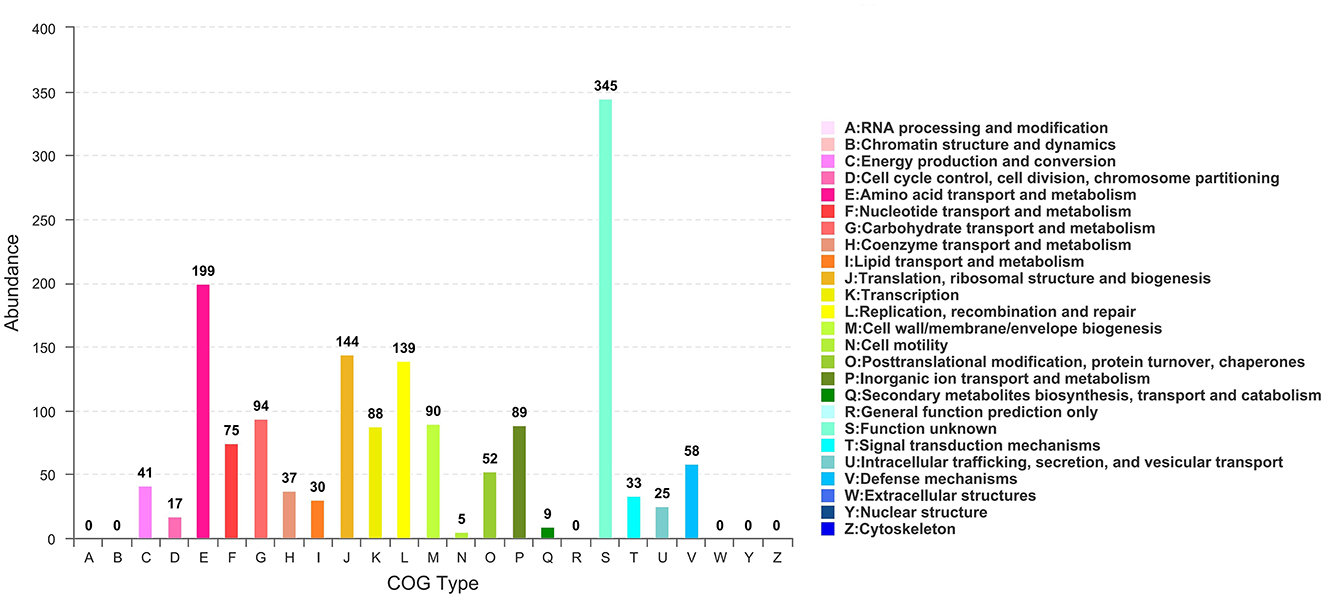
Figure 2. COG functional classification of Streptococcus thermophilus IMAU20561. The x-axis is the COG type. The y-axis shows the number of unigenes.
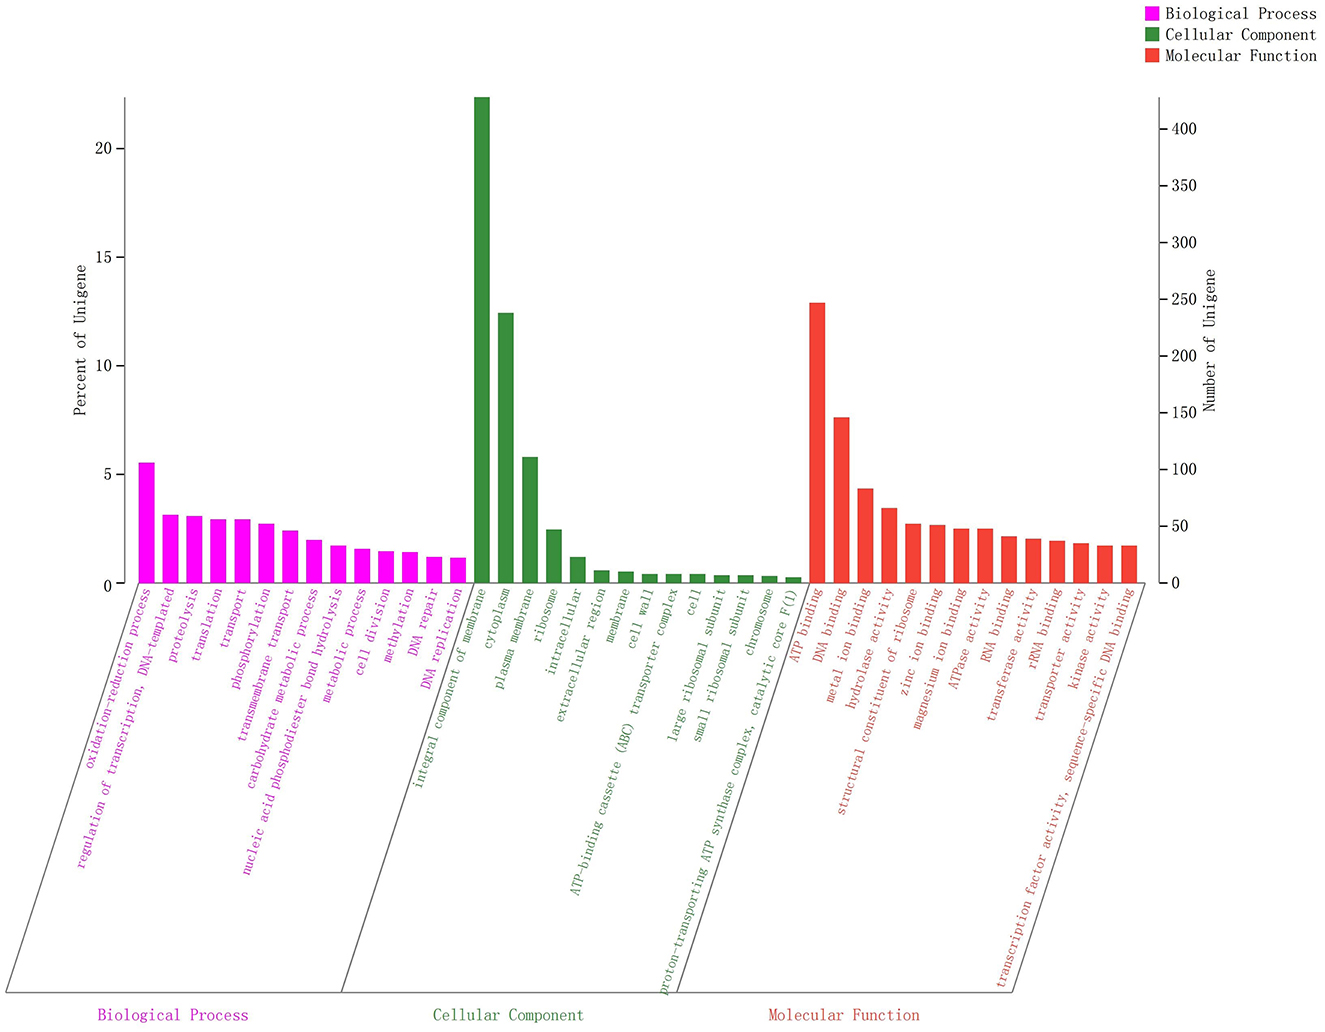
Figure 3. GO functional classification of Streptococcus thermophilus IMAU20561. The x-axis indicates the three main ontologies including biological processes, cellular components, and molecular function. The y-axis represents the number of genes in each category.
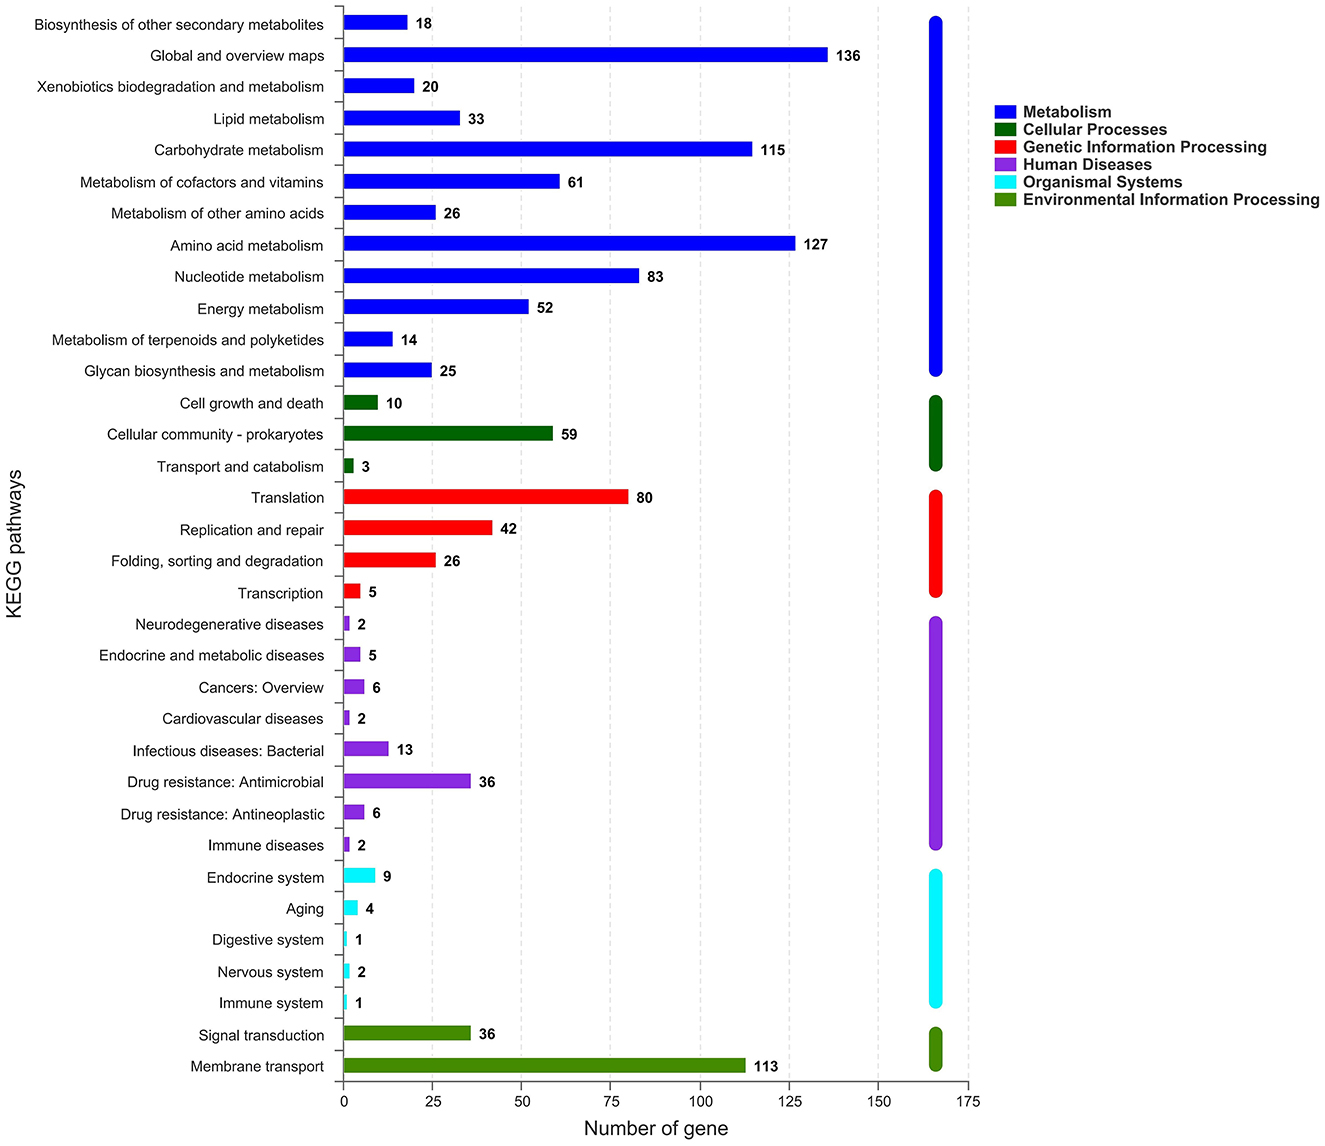
Figure 4. KEGG metabolic pathways of Streptococcus thermophilus IMAU20561. The x-axis indicates the number of genes. The y-axis indicates the KEGG pathways.
The nucleotide sequence of the eps gene cluster in S. thermophilus IMAU20561 (22.3 kb) was determined by gene annotation. In the gene cluster, 24 ORFs were found by computational analysis (Figure 5). The gene deoD was located upstream of gene epsA, followed by epsB, epsC, epsD, epsE, eps9F, and gene 0919. Two capsule biosynthetic proteins (gene 0918, gene 0916) were present between gene 0919, epsH, and epsF. After epsF, gene 0914, gene 0913, gene 0912, and gene 0911 were found in this eps cluster. A transposase-like gene (gene 0910) and orf 14.9 were found to inserted in the cluster in the opposite orientation. Downstream of orf 14.9, two hypothetical proteins, three phosphoglycerate mutases and a putative membrane spanning protein were found.
The predicted functions of eps genes were divided into four regions covering regulation, determining chain length, biosynthesis of the repeating unit, polymerization, and export. Upstream of the eps gene cluster was deoD, encoding purine nucleotide phosphorylase, involved in the biosynthesis and catabolism of nucleotides, and similar to a purine nucleoside phosphatase in S. thermophilus LMD-9 (ID: Q03K54.1), with 100% sequence identity (Goh et al., 2011). As a transcriptional regulator of the LytR family, epsA had 97.81% homology with epsA (ID: ADQ63266.1) identified from S. thermophilus ND03 (Sun et al., 2011); epsB also showed a significant identity with epsB (97.62%) from S. thermophilus MN-ZLW-002 (ID: AFJ83638.1) (Luo et al., 2022). The gene epsC displayed a 99% identity with epsC in S. thermophilus M17PTZA496 (ID: ETW89010.1) and epsD showed a 99.86% identity with the epsD in S. thermophilus MTCC-5461 (ID: ELW74268.1) (Prajapati et al., 2013; Da Silva Duarte et al., 2018). The genes epsE, eps9F, epsH and epsF encoding glycosyltransferases are responsible for synthesis of EPS repeating units. Among These epsE, those encoding a priming glycosyltransferase showed a 100% homology with the glycosyltransferase gene of S. thermophilus TH1436 (ID: 1423145), which is responsible for transferring sugar nucleotides to the isoprenoid glycolipid carrier and considered the first step in synthesis of the repeat unit (Giaretta et al., 2018). The gene eps9F, encoding a glycosyltransferase, showed a 99.21% homology with the glycosyltransferase gene in S. thermophilus TH1435 (D: ETE41202.1) (Treu et al., 2014). To build the repeating units, epsF and epsH transferred sugar nucleotides to the epsE one after another. epsF and epsH showed a high similarity (99.73%, 99.79%) to the glycosyltransferase in S. thermophilus ND03 (ID: ADQ63266.1). In addition, three genes encoding glycosyltransferases were found, namely gene 0919, gene 0914, and gene 0911. Gene 0916 and gene 0918 are responsible for encoding capsular polysaccharide biosynthesis protein and respectively had a 98.83 and 99.74% sequence identity with the capsular synthesis protein gene in S. thermophilus ASCC 1275 (ID: AIC24645.1) and S. thermophilus MN-ZLW-002 (ID: AFJ83638.1) (Padmanabhan et al., 2020; Luo et al., 2022). Downstream of the eps gene cluster was orf 14.9 with a direction opposite to the eps gene cluster, which is associated with cell growth. The genes epsO and epsX, located downstream of orf 14.9, are involved in the transfer and export of EPS and showed a 99.62 and 100% sequence identity to the S. thermophilus M17PTZA496 (ID: ETW89010.1) and S. thermophilus LMD-9 (ID: Q03K54.1), respectively (Goh et al., 2011; Da Silva Duarte et al., 2018). Gene 0906 had a 99.77% homology to the phosphatase gene in S. thermophilus LMG 18311 (ID: AAV60888.1) (Blomqvist et al., 2010). Gene 0910 had a 100% similarity to a putative transposase in S. thermophilus MTCC-5461 (ID: ELW74268.1) (Prajapati et al., 2013). Gene 0904 and gene 0912 respectively had a 100% and 99.53% similarity to the putative phosphoglycerate mutase and teichoic acid transporter in S. thermophilus LMD-9 (ID: Q03K54.1) (Goh et al., 2011).
Streptococcus thermophilus IMAU20561 initially grew slowly and then its growth began to accelerate after 2 h of culture (Figure 6). After 6 h, the cells entered the stationary phase (Figure 6). Therefore, the end of the exponential phase at 5 h and the stationary phase at 10 h were chosen for transcriptional analysis.
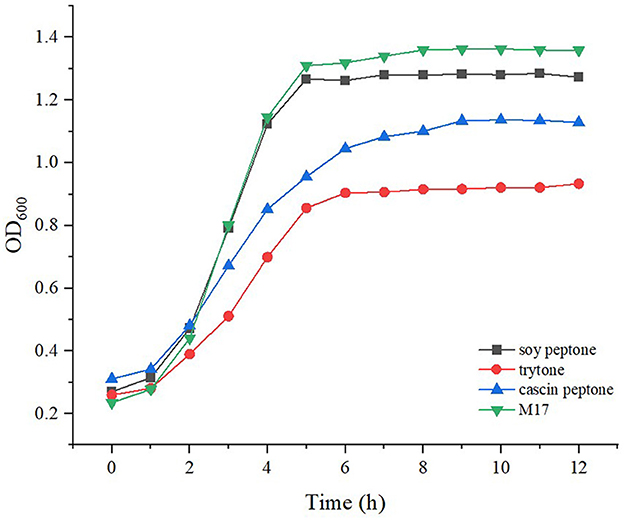
Figure 6. Growth curves of Streptococcus thermophilus IMAU20561 grown under different nitrogen sources.
Transcriptome profiles enabled the investigation of the variation in gene expression in the presence of different nitrogen sources in S. thermophilus IMAU20561. The cDNA library construction and sequencing of S. thermophilus MAU20561 generated 26,698,687 to 32,902,934 reads. A minimum of 83.57% of the genome could be mapped to the reference genome of this species. Gene expression during the growth in M17 media supplemented with different nitrogen sources at the logarithmic growth phase (5 h) and stationary growth phase (10 h) are presented as a Venn diagram of genes (Figure 7). Volcano plots revealed clear distinctions in the differential gene expression between different nitrogen sources under the above conditions (Supplementary Figure S1). Among these genes, there were 715 significantly regulated transcripts; 352 genes were upregulated and 363 genes were downregulated in the presence of soy peptone. In the presence of tryptone, 198 genes were upregulated while 255 were downregulated. In the presence of casein peptone, there were 578 significantly regulated transcripts; 255 genes were upregulated while 323 genes were downregulated. In the presence of the complex medium (M17), 315 genes were upregulated and 375 genes were downregulated.
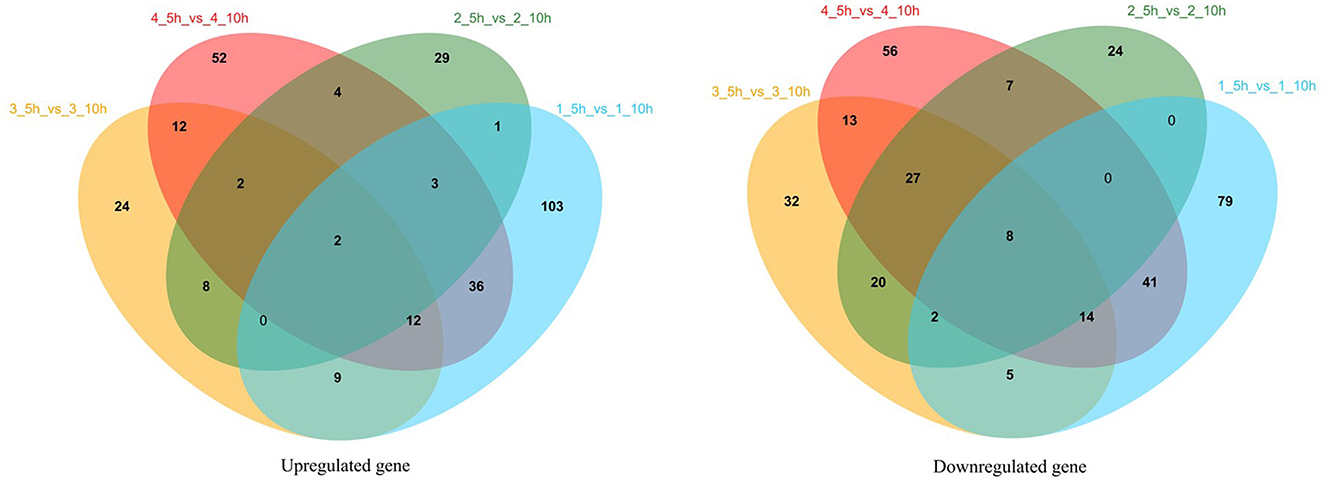
Figure 7. Venn analysis of gene expression during growth in M17 media with different nitrogen sources at logarithmic growth phase (5 h) and stationary growth phase (10 h). 1_5 h_vs_1_10 h represents the 5 and 10 h gene expression analysis results of IMAU20561 in soy protein medium; 2_5 h_vs_2_10 h represents the 5 and 10 h gene expression analysis results of IMAU20561 in tryptone medium; 3_5 h_vs_3_10 h represents the 5 and 10 h gene expression analysis results of IMAU20561 in casein peptone medium; 4_5 h_vs_4_10 h represents the 5 and 10 h gene expression analysis results of IMAU20561 in M17 medium.
The 16 groups of DEGs from the KEGG enrichment analysis are graphically displayed in a scatter plot (Supplementary Figure S2). The “rich factor” refers to the ratio of the number of DEGs enriched and the number of annotated background genes in the KEGG pathway and this factor is often used to represent the degree of KEGG enrichment. In Supplementary Figure S2, the highest rich factor, gene numbers and lower FDR value indicates greater enrichment. When soy peptone was the sole nitrogen source, the significantly enriched DEGs were mainly related to biosynthesis of histidine, phenylalanine, tyrosine, and tryptophan. When tryptone was the sole nitrogen source, the significantly enriched DEGs were mainly related to metabolic pathways of ribosomes, and some secondary metabolites such as the biosynthesis of streptomycin, neomycin, and gentamicin. When casein peptone was the sole nitrogen source, the significantly enriched DEGs were mainly in ribosome, histidine, and tyrosine biosynthesis. In the entire M17 medium with a complex nitrogen source, the significantly enriched DEGs were mainly related to histidine biosynthesis, peptidoglycan biosynthesis and the glycolysis/gluconeogenesis pathway. The most significantly involved pathways during nitrogen enrichment were the metabolism and biosynthesis pathway of nitrogen metabolism. Among them, histidine metabolism, tryptophan metabolism and phenylalanine metabolism are closely related to the biosynthesis of exopolysaccharides. Biosynthesis and metabolism of histidine involves the glycolytic pathway (EMP), the tricarboxylic acid pathway (TCA) and the pentose phosphate metabolism pathway (HMP). Anthranilic acid as a precursor for tryptophan synthesis in the carbohydrate metabolism can be beneficial to the production of tryptophan.
We found that the exopolysaccharide yield of M17 was 150.8 and 480.7 mg/L when soy protein was the only nitrogen source, which was more than two times higher than that of M17. In addition, the EPS yield of trypsin medium was 175 mg/L, while the minimum EPS yield of casein peptone medium was only 28.1 mg/L (Liu et al., 2022). Therefore, we will continue to study exopolysaccharides under different culture conditions and analyze the expression of genes related to exopolysaccharide synthesis.
Glycolysis or gluconeogenesis is the main pathway of monosaccharide metabolism in LAB. In S. thermophilus MAU20561 culture at 5 and 10 h, a total of 32 genes involved in the glycolytic processes and gluconeogenesis were identified and 18 genes were significantly differentially expressed (Table 2). Of them, 15 genes were upregulated and three genes were downregulated when soy peptone was the sole nitrogen source; galM, pyk, pfkA, and bglA were upregulated by 1.8, 1, 1.2, and 1.4 times, respectively. Similar results were also found when tryptone was the sole nitrogen source where 15 genes were upregulated and three genes were downregulated; adhE was upregulated by 1.1 times. When casein peptone was the sole nitrogen source, 14 genes were upregulated and four genes were downregulated; adhE, adhE, and adhP were upregulated by 2.1, 1.8, and 1.1 times, respectively. When full M17 with a complex nitrogen source was used, 15 genes were upregulated and three were downregulated; ldh was upregulated by 1.5 times while pgm, pyk, and glk were upregulated by 0.82, 0.76, and 0.82 times, respectively. Phosphoglucomutase and glucose-6-phosphate isomerase were the key enzymes active in the glycolytic pathway. After glucose is converted to glucose-6-phosphate, glucose-1-phosphate and fructose-6-phosphate are generated under the catalytic action of phosphoglucomutase and glucose-6-phosphate isomerase, respectively (Cui et al., 2017). In this study, the phosphoglucomutase gene (pgm) was significantly upregulated while glucose-6-phosphate isomerase gene (gpi) was downregulated in the media with different nitrogen sources, indicating that, after 10 h of incubation, the production of precursor of UDP-glucose was found to have increased yields during the biosynthesis of precursor metabolites, glucose-1-phosphate, in S. thermophilus IMAU20561 (Figure 8). This result is consistent with the RT-qPCR gene expression analysis results (Section 3.7).
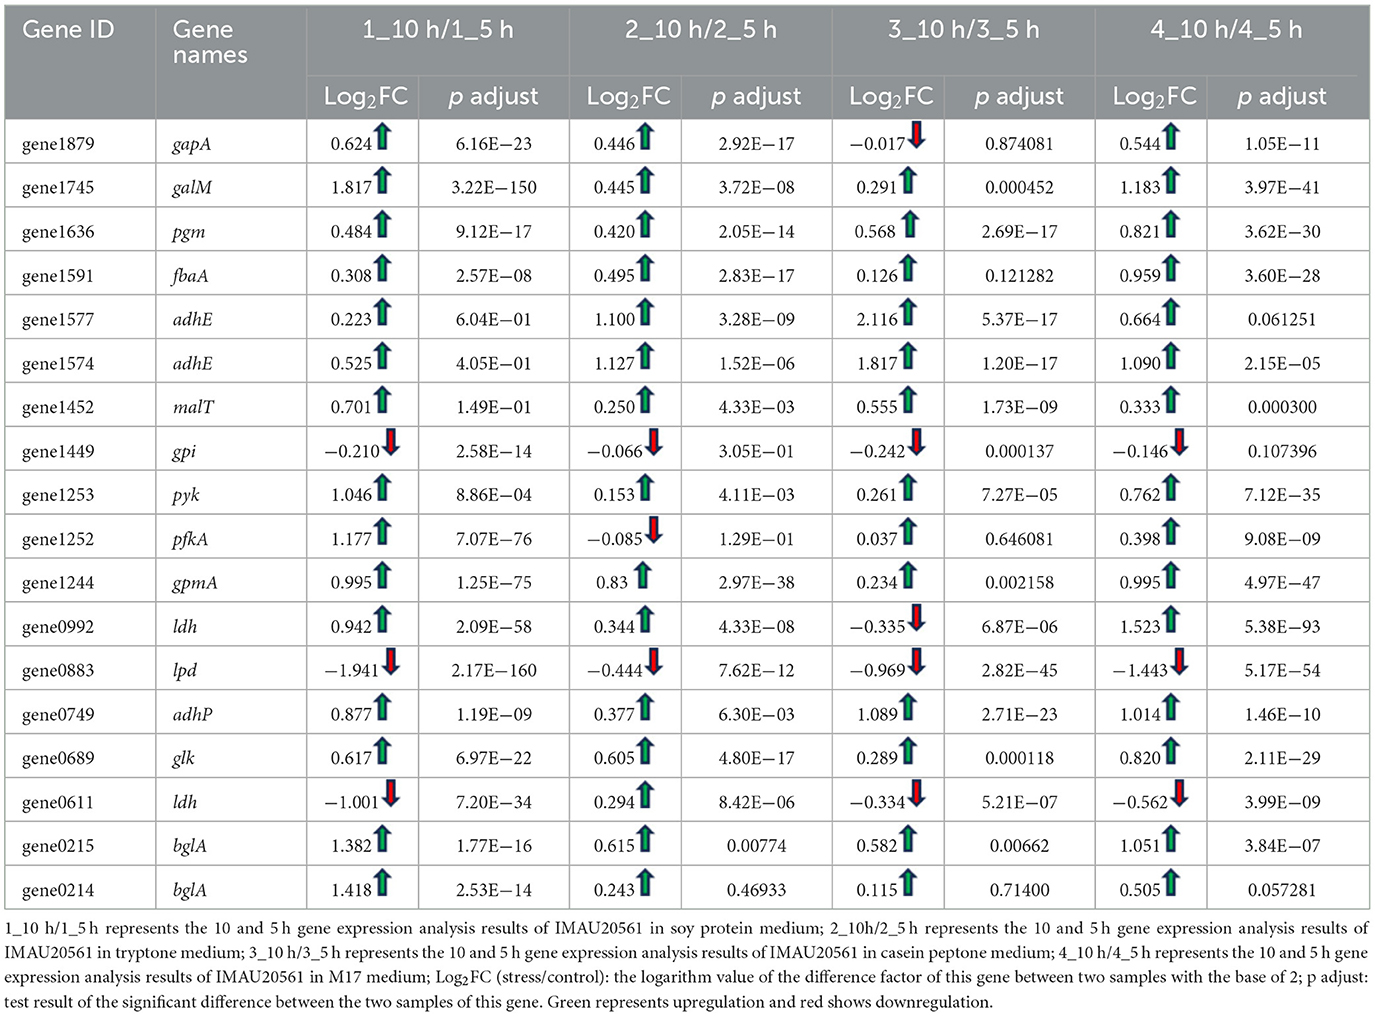
Table 2. Expression of gluconeogenic key genes in M17 medium with soy peptone, tryptone or casein peptone as the only nitrogen source.
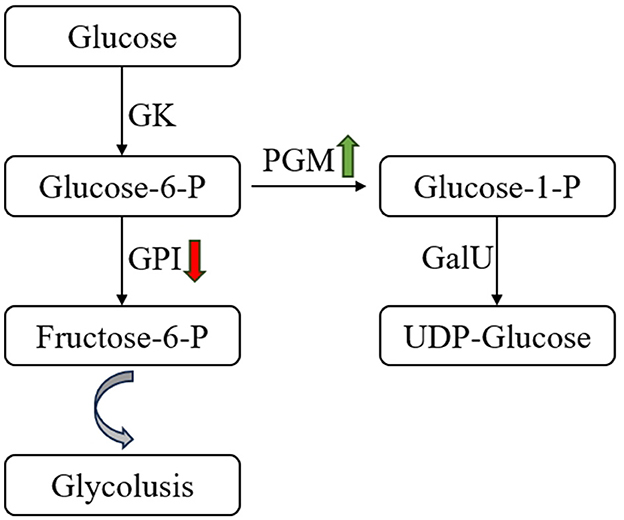
Figure 8. Changes in glucose metabolism pathway of Streptococcus thermophilus IMAU20561 during continuous culture. GK, glucokinase; GPI, glucose-6-phosphate isomerase; PGM, α-phosphoglucomutase; GalU, UDP-glucose pyrophosphorylase.
To become nucleotide sugars, monosaccharides must be activated by a high-energy donor, which enables them to be used in exopolysaccharide biosynthesis (Fan et al., 2015). Amino sugars that are present in exopolysaccharides are derived from sugar phosphate or sugar–nucleotide, and the corresponding amino sugar derivative is catalyzed by a specific aminotransferase or an amido transferase (Skarbek and Milewska, 2016). Some DEGs were involved in amino and nucleotide sugar metabolism in S. thermophilus MAU20561 under the influence of four selected nitrogen sources. Comparing the cultures at 5 and 10 h, 28 genes related to amino sugar and nucleotide sugar metabolism were identified. A total of 15 genes involved in amino and nucleotide sugar metabolism were significantly differentially expressed (Table 3). When soy peptone was the sole nitrogen source, 14 genes were upregulated and one gene was downregulated; galE, galT, galK, glmU, nagA, and manA were upregulated by 1.12, 1.04, 0.97, 1.06, 1.06, and 0.93 times, respectively. Similar results were also found when tryptone was the sole nitrogen source in which case five genes were upregulated and three genes were downregulated genes; among them, pgm was slightly upregulated. When casein peptone was the sole nitrogen source, four genes were upregulated and three genes were downregulated; galE and nagA were upregulated by 0.822 and 0.766 times, respectively. When the M17 medium with a complex nitrogen source was used for the culture, eight genes were significantly upregulated and four genes were downregulated; galE, galT, and pgm were upregulated by 0.878, 0.835, and 0.821 times, respectively.
Among the upregulated genes expressed in the media with different nitrogen sources, some were responsible for formation of the precursor nucleotide sugars that provide elements of oligosaccharide units (Table 3). For example, pgm encoding phosphoglucomutase is a key enzyme in sugar–nucleotide biosynthesis that catalyzes the interconversion of glucose-6-phosphate to glucose-1-phosphate, and then generates the precursor nucleotide sugars to participate in the biosynthesis of EPS in S. thermophilus MAU20561 (Levander and Rådström, 2001). GalK encodes galactokinase in the Leloir pathway, which catalyzes the synthesis of sugar-1-phosphates.
The results of the expression analysis of genes in the eps gene cluster involved in EPS biosynthesis are shown in Table 4. Genes encoding glycosyl transferases and transporter proteins were downregulated when soy peptone was the sole nitrogen source, while the expression of gene 0924, gene 0925 involved in regulating EPS biosynthesis were upregulated. The expression of gene 0924, gene 0922, gene 0907, gene 0909, and gene 0910i was upregulated when tryptone was the sole nitrogen source. A total of five genes involved in phosphorylation and transposase were upregulated when casein peptone was the sole nitrogen source. When full M17 medium with a complex nitrogen source was used for the culture, the expression of gene 0912, gene 0911, and gene 0903 was downregulated, while the expression of gene 0910 encoding transposase was upregulated. Comparing the cultures at 10 h vs. 5 h, gene 0911, gene 0914, and gene 0919 were downregulated, indicating that the expression of these genes was higher at 5 h than at 10 h.
Twelve genes involved in sugar synthesis, glycolysis and sugar transport were investigated to determine the accuracy of the transcriptome data by qRT-PCR (Table 5). According to the results of the transcriptome data analysis, at 10 h vs. 5 h, 12 genes were upregulated, which was consistent with the RT-qPCR analysis results, indicating that the above transcriptome data is valid.
We report a circular graphical map and an eps gene cluster in S. thermophilus MAU20561 isolated from a naturally fermented dairy product. The large quantity of data obtained from the transcriptomic analysis when different nitrogen sources were used allowed us to systematically investigate the mechanisms of EPS biosynthesis in S. thermophilus MAU20561. Alexandraki et al. (2019) noted the presence of EPS gene clusters that are present in all the S. thermophilus strains when investigating 23 S. thermophilus and the EPS clusters of different strains were compared suggesting variations in the gene content of these loci. Previously, the size of the S. thermophilus genome was estimated to be 1.82–1.85 Mb and about 2,000 genes involved in cell growth and metabolism were encoded (O'Sullivan and Fitzgerald, 1998). The biosynthesis of EPS is controlled by the eps gene cluster in S. thermophilus (Lavelle et al., 2022). It is generally considered that the S. thermophilus eps gene cluster is almost located on the chromosomal DNA and therefore the probability of losing the eps gene involved in the biosynthesis of EPS during the passage is low (Lavelle et al., 2022). In this study, using genomic resequencing and bioinformatics analysis, a complete eps gene cluster (22.3 kb), including 24 genes, was identified on the S. thermophilus IMAU20561 chromosomal DNA, which is responsible for the regulation of EPS biosynthesis, output, and aggregation (Figure 5).
Streptococcus thermophilus ND07, CNRZ1066, and CS6 were used as controls to compare the eps gene cluster among the experimental strains (Figure 9). The genes epsA, epsB, epsC, and epsD were highly conserved in all the eps gene clusters and are responsible for EPS regulation, chain length and polymerization. These genes were found in both S. thermophilus IMAU20561 and the other three S. thermophilus eps gene clusters and they were also found to appear in the same order. Glycosyltransferases play a key role in the biosynthesis of the EPS repeating unit, and the type and numbers of these enzymes in the eps gene cluster determines the diversity of EPS structure (Dan et al., 2009; Wu et al., 2014). A diversity of glycosyltransferases can transfer the sugar residues of nucleotide sugars to an acceptor, thus suggesting that the biosynthesis of EPS probably requires a lot of glycosyltransferase genes (Breton et al., 2006). Seven putative glycosyltransferase genes that had been identified previously were similar in S. thermophilus IMAU20561 as well. The number and type of genes regulating polymerization and translocation varied among the strains. Among them, epsO was oriented in the opposite direction to the eps gene cluster. The preliminary chemical evaluation of the EPS of S. thermophilus IMAU20561 indicated that the monosaccharaides mannose, glucose, and galactose were present in the EPS (Liu et al., 2022).
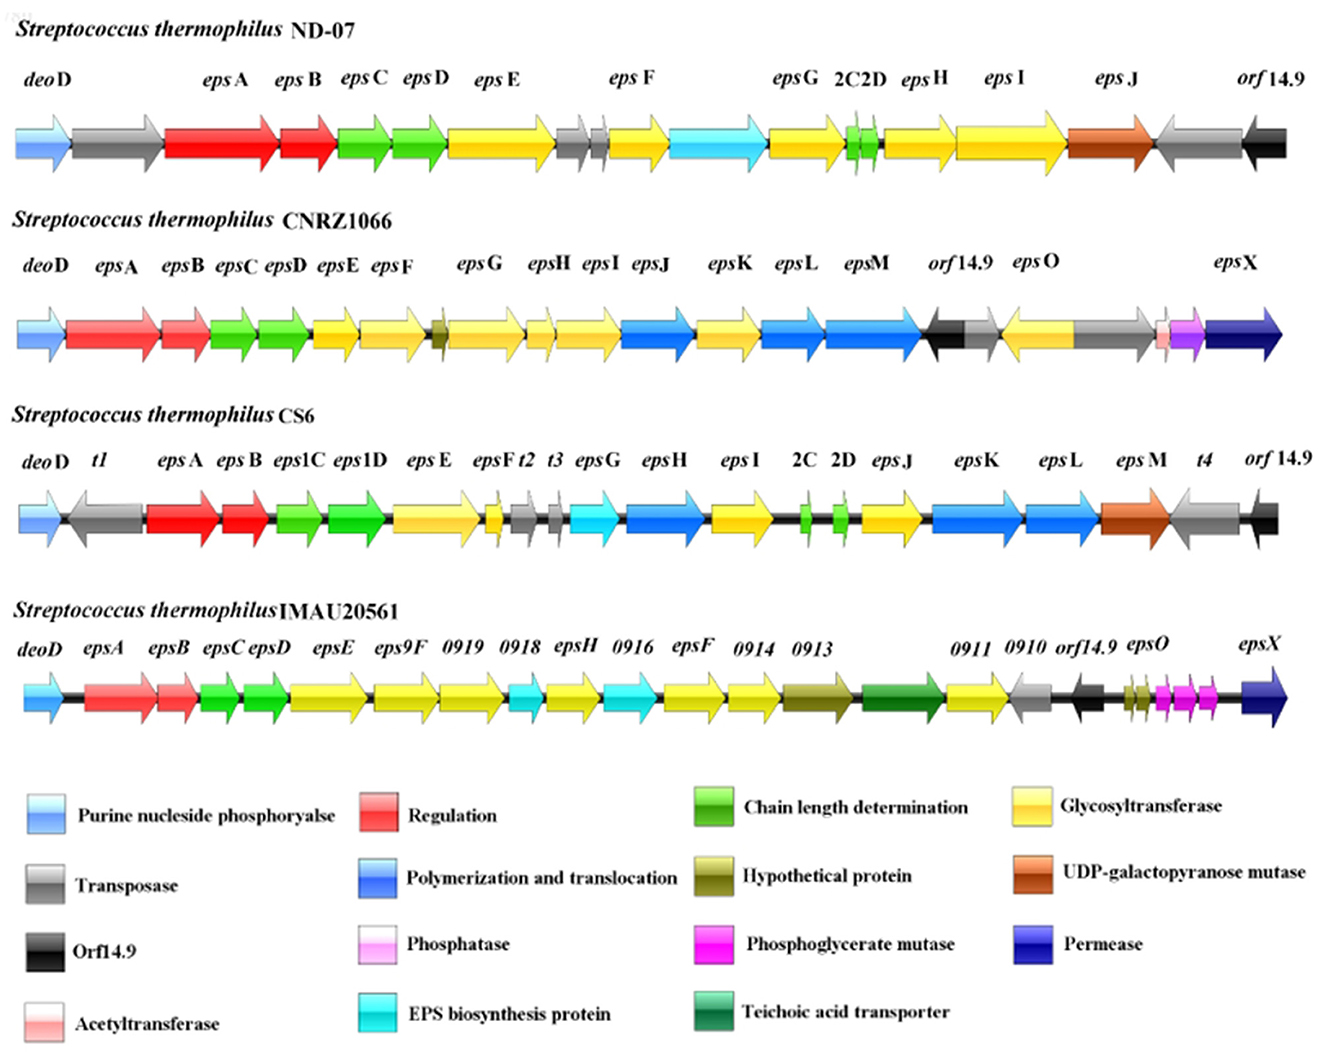
Figure 9. Schematic genetic organization of the eps gene cluster of Streptococcus thermophilus IMAU20561 compared with three other sequenced Streptococcus. thermophilus eps gene clusters. The predicated functions of each gene are indicated in the bottom panel in different colors.
The annotated DEGs responsible for the production of EPS under different nitrogen sources in S. thermophilus IMAU20561 were investigated using GO and KEGG pathway analysis. From the results of the enrichment analysis of DEGs with GO function, the top 10 significant GO terms are visualized in Supplementary Table S1 based on FDR values. From GO enrichment analysis, it is found that DEGs between different nitrogen sources were mainly enriched in amino acid biosynthesis and metabolism; biosynthesis and metabolism of ribonucleotides; IMP biosynthesis and metabolism; and phosphorus metabolism processes. KEGG enrichment analysis also showed significant enrichment of pathways involved in amino acid metabolism under different nitrogen sources. Furthermore, qPCR technology can accurately describe the gene expression level and has become a common method for the detection of gene expression. In this study, 12 genes related to sugar transport, sugar synthesis and glycolysis were selected and their expressions were analyzed by RT-qPCR. The up-regulation trend of 12 genes was consistent with the up-regulation trend of differential genes analyzed in transcriptome data. The qPCR analytic results confirmed the accuracy of RNA-seq data.
EPSs from LAB have a broad application potential in agri-food as a substitute for food-grade bioamendments and additives. In the dairy industry, EPSs are used as biothickeners due to their stabilizing, emulsifying or gel properties. However, the commercial output of EPS is relatively low and further research is needed to improve the yield of EPS and promote its development in the field of food and agri-culture. Currently, the structure and biological activity of EPS derived from LAB and the relationship between EPS genes, phenotype, structure, and function have been receiving increased research attention. This provides a theoretical basis for the practical application in future and also information that could improve the yield and structure of EPS through a genetic means.
In summary, we report the complete genome sequence of S. thermophilus MAU20561, which contains 1,716,258 bp encoding 1,914 coding sequences (CDSs). Among them, a 22.3-kb eps gene cluster that also includes 24 genes was identified. The results of GO and KEGG functional annotation showed that upregulated DEGs were mainly involved in amino acids, ribonucleotide, glycolysis, phosphotransferase system, fructose, and mannose metabolism and accounted for improving the production of EPS by S. thermophilus MAU20561. This work provides new insights into genetic characteristics of S. thermophilus, biosynthetic pathways for the production of EPS and a theoretical basis for screening dairy starter cultures.
The original contributions presented in the study are included in the article/Supplementary material, further inquiries can be directed to the corresponding author.
YW: Methodology, Resources, Supervision, Writing—original draft, Writing—review & editing, Investigation, Software. QP: Conceptualization, Investigation, Methodology, Visualization, Writing—original draft, Formal analysis, Validation. YL: Data curation, Methodology, Validation, Writing—original draft. NW: Data curation, Methodology, Writing—original draft. YH: Methodology, Software, Writing—original draft. XC: Formal analysis, Methodology, Writing—original draft. TD: Conceptualization, Data curation, Funding acquisition, Investigation, Methodology, Project administration, Resources, Writing—review & editing.
The author(s) declare financial support was received for the research, authorship, and/or publication of this article. This research was supported by the National Natural Science Foundation of China (Beijing; No. 31860448).
The authors declare that the research was conducted in the absence of any commercial or financial relationships that could be construed as a potential conflict of interest.
All claims expressed in this article are solely those of the authors and do not necessarily represent those of their affiliated organizations, or those of the publisher, the editors and the reviewers. Any product that may be evaluated in this article, or claim that may be made by its manufacturer, is not guaranteed or endorsed by the publisher.
The Supplementary Material for this article can be found online at: https://www.frontiersin.org/articles/10.3389/fmicb.2023.1328824/full#supplementary-material
Abd-Alla, M. H., Bashandy, S. R., Nafady, N. A., and Hassan, A. A. (2018). Enhancement of exopolysaccharide production by Stenotrophomonas maltophilia and Brevibacillus parabrevis isolated from root nodules of Cicer arietinum L., Vigna unguiculata L. (Walp.) plants. Rend. Fis. Acc. Lincei. 29, 117–129. doi: 10.1007/s12210-018-0671-1
Alexandraki, V., Kazou, M., Blom, J., Pot, B., Papadimitriou, K., Tsakalidou, E., et al. (2019). Comparative genomics of Streptococcus thermophilus support important traits concerning the evolution, biology and technological properties of the species. Front. Microbiol. 10:2916. doi: 10.3389/fmicb.2019.02916
Angelin, J., and Kavitha, M. (2020). Exopolysaccharides from probiotic bacteria and their health potential. Int. J. Biol. Macromol. 162, 853–865. doi: 10.1016/j.ijbiomac.2020.06.190
Blomqvist, T., Steinmoen, H., and Håvarstein, L. S. (2010). A food-grade site-directed mutagenesis system for Streptococcus thermophilus LMG 18311. Lett. Appl. Microbiol. 50, 314–319. doi: 10.1111/j.1472-765X.2009.02794.x
Breton, C., Šnajdrová, L., Jeanneau, C., Koča, J., and Imberty, A. (2006). Structures and mechanisms of glycosyltransferases. Glycobiology 16, 29R−37R. doi: 10.1093/glycob/cwj016
Brettin, T., Davis, J. J., Disz, T., Edwards, R. A., Gerdes, S., Olsen, G. J., et al. (2015). RASTtk: a modular and extensible implementation of the RAST algorithm for building custom annotation pipelines and annotating batches of genomes. Sci. Rep. 5:8365. doi: 10.1038/srep08365
Chen, W., Wang, J., Du, L., Chen, J., Zheng, Q., Li, P., et al. (2022). Kefir microbiota and metabolites stimulate intestinal mucosal immunity and its early development. Crit. Rev. Food Sci. Nutr. 30, 1–14. doi: 10.1080/10408398.2022.2115975
Cheng, X., Huang, L., and Li, K.-t. (2019). Antioxidant activity changes of exopolysaccharides with different carbon sources from Lactobacillus plantarum LPC-1 and its metabolomic analysis. World J. Microbiol. Biotechnol. 35:68. doi: 10.1007/s11274-019-2645-6
Cui, Y., Jiang, X., Hao, M., Qu, X., and Hu, T. (2017). New advances in exopolysaccharides production of Streptococcus thermophilus. Arch. Microbiol. 199, 799–809. doi: 10.1007/s00203-017-1366-1
Da Silva Duarte, V., Giaretta, S., Campanaro, S., Treu, L., Armani, A., Tarrah, A., et al. (2018). A cryptic non-inducible prophage confers phage-immunity on the Streptococcus thermophilus M17PTZA496. Viruses 11:7. doi: 10.3390/v11010007
Daba, G. M., Elnahas, M. O., and Elkhateeb, W. A. (2021). Contributions of exopolysaccharides from lactic acid bacteria as biotechnological tools in food, pharmaceutical, and medical applications. Int. J. Biol. Macromol. 173, 79–89. doi: 10.1016/j.ijbiomac.2021.01.110
Dan, T., Fukuda, K., Sugai-Bannai, M., Takakuwa, N., Motoshima, H., Urashima, T., et al. (2009). Characterization and expression analysis of the exopolysaccharide gene cluster in Lactobacillus fermentum TDS030603. Biosci. Biotechol. Biochem. 73, 2656–2664. doi: 10.1271/bbb.90502
Delcher, A. L., Bratke, K. A., Powers, E. C., and Salzberg, S. L. (2007). Identifying bacterial genes and endosymbiont DNA with glimmer. Bioinformatics 23, 673–679. doi: 10.1093/bioinformatics/btm009
Fan, Y., Jimenez Del Val, I., Müller, C., Lund, A. M., Sen, J. W., Rasmussen, S. K., et al. (2015). A multi-pronged investigation into the effect of glucose starvation and culture duration on fed-batch CHO cell culture. Biotechnol. Bioeng. 112, 2172–2184. doi: 10.1002/bit.25620
Giaretta, S., Treu, L., Vendramin, V., da Silva Duarte, V., Tarrah, A., Campanaro, S., et al. (2018). Comparative transcriptomic analysis of Streptococcus thermophilus TH1436 and TH1477 showing different capability in the use of galactose. Front. Microbiol. 9:1765. doi: 10.3389/fmicb.2018.01765
Goh, Y. J., Goin, C., O'Flaherty, S., Altermann, E., and Hutkins, R. W. (2011). Specialized adaptation of a lactic acid bacterium to the milk environment: the comparative genomics of Streptococcus thermophilus LMD-9. Microb. Cell Fact. 10, 1–17. doi: 10.1186/1475-2859-10-S1-S22
Hyatt, D., Chen, G.-L., LoCascio, P. F., Land, M. L., Larimer, F. W., and Hauser, L. J. (2010). Prodigal: prokaryotic gene recognition and translation initiation site identification. BMC Bioinform. 11, 1–11. doi: 10.1186/1471-2105-11-119
Karadeniz, D. G., Kaskatepe, B., Kiymaci, M. E., Tok, K. C., Gumustas, M., Karaaslan, C., et al. (2021). Microbial exopolysaccharide production of Streptococcus thermophilus and its antiquorum sensing activity. Arch. Microbiol. 203, 3331–3339. doi: 10.1007/s00203-021-02313-7
Laiño, J., Villena, J., Kanmani, P., and Kitazawa, H. (2016). Immunoregulatory effects triggered by lactic acid bacteria exopolysaccharides: new insights into molecular interactions with host cells. Microorganisms 4:27. doi: 10.3390/microorganisms4030027
Lavelle, K., Sadovskaya, I., Vinogradov, E., Kelleher, P., Lugli, G. A., Ventura, M., et al. (2022). Bipartite rgp locus diversity in Streptococcus thermophilus corresponds to backbone and side chain differences of its rhamnose-containing cell wall polysaccharide. Appl. Environ. Microb. 88:e01504-22. doi: 10.1128/aem.01504-22
Levander, F., and Rådström, P. (2001). Requirement for phosphoglucomutase in exopolysaccharide biosynthesis in glucose- and lactose-utilizing Streptococcus thermophilus. Appl. Environ. Microb. 67, 2734–2738. doi: 10.1128/AEM.67.6.2734-2738.2001
Li, H., Fu, J., Hu, S., Li, Z., Qu, J., Wu, Z., et al. (2021). Comparison of the effects of acetic acid bacteria and lactic acid bacteria on the microbial diversity of and the functional pathways in dough as revealed by high-throughput metagenomics sequencing. Int. J. Food Microbiol. 346:109168. doi: 10.1016/j.ijfoodmicro.2021.109168
Liu, Y., Qiao, S., Li, J., Tian, J., Dan, T., and Sun, T. (2022). Effects of nitrogen sources on the phenotypic characteristics of exopolysaccharide from Streptococcus thermophilus. Food Sci. Tech. 22, 58–66. doi: 10.16429/j.1009-7848.2022.01.007
Luo, Y., Cheng, R., Liang, H., Miao, Z., Wang, J., Zhou, Q., et al. (2022). Influence of high-fat diet on host animal health via bile acid metabolism and benefits of oral-fed Streptococcus thermophilus MN-ZLW-002. Exp. Anim. 71, 468–480. doi: 10.1538/expanim.21-0182
Maeda, H., Zhu, X., Omura, K., Suzuki, S., and Kitamura, S. (2004). Effects of an exopolysaccharide (kefiran) on lipids, blood pressure, blood glucose, and constipation. Biofactors. 22, 197–200. doi: 10.1002/biof.5520220141
Nie, Z.-Y., Li, Y.-H., Li, L., and Zhao, X. (2021). Characterization and transcriptomic analysis of Streptococcus thermophilus strain EU01 promoted by Eucommia ulmoides Oliv. extract. Sci. Asia. 47, 19–29. doi: 10.2306/scienceasia1513-1874.2021.002
Oleksy-Sobczak, M., and Klewicka, E. (2020). Optimization of media composition to maximize the yield of exopolysaccharides production by Lactobacillus rhamnosus strains. Probiotics Antimicrob. Proteins 12, 774–783. doi: 10.1007/s12602-019-09581-2
O'Sullivan, T. F., and Fitzgerald, G. F. (1998). Comparison of Streptococcus thermophilus strains by pulse field gel electrophoresis of genomic DNA. FEMS Microbiol. Lett. 168, 213–219. doi: 10.1111/j.1574-6968.1998.tb13276.x
Padmanabhan, A., Tong, Y., Wu, Q., Lo, C., and Shah, N. P. (2020). Proteomic analysis reveals potential factors associated with enhanced EPS production in Streptococcus thermophilus ASCC 1275. Sci. Rep. 10:807. doi: 10.1038/s41598-020-57665-9
Padmanabhan, A., Tong, Y., Wu, Q., Zhang, J., and Shah, N. P. (2018). Transcriptomic insights into the growth phase-and sugar-associated changes in the exopolysaccharide production of a high EPS-producing Streptococcus thermophilus ASCC 1275. Front. Microbiol. 9:1919. doi: 10.3389/fmicb.2018.01919
Plavec, T. V., and Berlec, A. (2020). Safety aspects of genetically modified lactic acid bacteria. Microorganisms 8:297. doi: 10.3390/microorganisms8020297
Polak-Berecka, M., Choma, A., Waśko, A., Górska, S., Gamian, A., Cybulska, J., et al. (2015). Physicochemical characterization of exopolysaccharides produced by Lactobacillus rhamnosus on various carbon sources. Carbohydr. Polym. 117, 501–509. doi: 10.1016/j.carbpol.2014.10.006
Prajapati, J. B., Nathani, N. M., Patel, A. K., Senan, S., and Joshi, C. G. (2013). Genomic analysis of dairy starter culture Streptococcus thermophilus MTCC 5461. Microbiol. Biotechnol. 23, 459–466. doi: 10.4014/jmb.1210.10030
Qi, L., Fang, Q., Zhao, L., Xia, H., Zhou, Y., Xiao, J., et al. (2016). De novo assembly and developmental transcriptome analysis of the small white butterfly Pieris rapae. PLoS ONE 11, e0159258. doi: 10.1371/journal.pone.0159258
Skarbek, K., and Milewska, M. J. (2016). Biosynthetic and synthetic access to amino sugars. Carbohydr. Res. 434, 44–71. doi: 10.1016/j.carres.2016.08.005
Smith, K., Diggle, M. A., and Clarke, S. C. (2003). Comparison of commercial DNA extraction kits for extraction of bacterial genomic DNA from whole-blood samples. J. Clin. Microbiol. 41, 2440–2443. doi: 10.1128/JCM.41.6.2440-2443.2003
Stothard, P., Grant, J. R., and Van Domselaar, G. (2019). Visualizing and comparing circular genomes using the CGView family of tools. Brief. Bioinform. 20, 1576–1582. doi: 10.1093/bib/bbx081
Sun, Z., Chen, X., Wang, J., Zhao, W., Shao, Y., Wu, L., et al. (2011). Complete genome sequence of Streptococcus thermophilus strain ND03. J. Bacteriol. 193, 793–794. doi: 10.1128/JB.01374-10
Tatusov, R. L., Fedorova, N. D., Jackson, J. D., Jacobs, A. R., Kiryutin, B., Koonin, E. V., et al. (2003). The COG database: an updated version includes eukaryotes. BMC Bioinform. 4, 1–14. doi: 10.1186/1471-2105-4-41
Tiwari, S., Kavitake, D., Devi, P. B., and Shetty, P. H. (2021). Bacterial exopolysaccharides for improvement of technological, functional and rheological properties of yogurt. Int. J. Biol. Macromol. 183, 1585–1595. doi: 10.1016/j.ijbiomac.2021.05.140
Treu, L., Vendramin, V., Bovo, B., Campanaro, S., Corich, V., Giacomini, A., et al. (2014). Whole-genome sequences of Streptococcus thermophilus strains TH1435 and TH1436, isolated from raw goat milk. Genome Announc. 2:e01129-13. doi: 10.1128/genomeA.01129-13
Wu, Q., and Shah, N. P. (2018). Comparative mRNA-Seq analysis reveals the improved EPS production machinery in Streptococcus thermophilus ASCC 1275 during optimized milk fermentation. Front. Microbiol. 9:445. doi: 10.3389/fmicb.2018.00445
Wu, Q., Tun, H. M., Leung, F. C.-C., and Shah, N. P. (2014). Genomic insights into high exopolysaccharide-producing dairy starter bacterium Streptococcus thermophilus ASCC 1275. Sci. Rep. 4:4974. doi: 10.1038/srep04974
Yang, Z., Li, S., Zhang, X., Zeng, X., Li, D., Zhao, Y., et al. (2010). Capsular and slime-polysaccharide production by Lactobacillus rhamnosus JAAS8 isolated from Chinese sauerkraut: potential application in fermented milk products. J. Biosci. Bioeng. 110, 53–57. doi: 10.1016/j.jbiosc.2009.12.010
Keywords: Streptococcus thermophilus, different nitrogen media, exopolysaccharide biosynthesis, genome analysis, transcriptomic analysis
Citation: Wang Y, Peng Q, Liu Y, Wu N, He Y, Cui X and Dan T (2024) Genomic and transcriptomic analysis of genes involved in exopolysaccharide biosynthesis by Streptococcus thermophilus IMAU20561 grown on different sources of nitrogen. Front. Microbiol. 14:1328824. doi: 10.3389/fmicb.2023.1328824
Received: 27 October 2023; Accepted: 31 December 2023;
Published: 29 January 2024.
Edited by:
Stefano Raimondi, University of Modena and Reggio Emilia, ItalyReviewed by:
Tingting Guo, Shandong University, ChinaCopyright © 2024 Wang, Peng, Liu, Wu, He, Cui and Dan. This is an open-access article distributed under the terms of the Creative Commons Attribution License (CC BY). The use, distribution or reproduction in other forums is permitted, provided the original author(s) and the copyright owner(s) are credited and that the original publication in this journal is cited, in accordance with accepted academic practice. No use, distribution or reproduction is permitted which does not comply with these terms.
*Correspondence: Tong Dan, ZGFudG9uZzgxMzIxOEBhbGl5dW4uY29t
†These authors have contributed equally to this work
Disclaimer: All claims expressed in this article are solely those of the authors and do not necessarily represent those of their affiliated organizations, or those of the publisher, the editors and the reviewers. Any product that may be evaluated in this article or claim that may be made by its manufacturer is not guaranteed or endorsed by the publisher.
Research integrity at Frontiers

Learn more about the work of our research integrity team to safeguard the quality of each article we publish.