- 1State Key Laboratory of Plateau Ecology and Agriculture, Academy of Agriculture and Forestry Sciences, Qinghai University, Xining, China
- 2Key Laboratory of Resource Biology and Biotechnology in Western China (Ministry of Education), College of Life Sciences, Northwest University, Xi’an, China
Morels (Morchella, Ascomycota) are an extremely desired group of edible mushrooms with worldwide distribution. Morchella eohespera is a typical black morel species, belonging to the Elata clade of Morchella species. The biological and genetic studies of this mushroom are rare, largely hindering the studies of molecular breeding and evolutionary aspects. In this study, we performed de novo sequencing and assembly of the M. eohespera strain m200 genome using the third-generation nanopore sequencing platform. The whole-genome size of M. eohespera was 53.81 Mb with a contig N50 of 1.93 Mb, and the GC content was 47.70%. A total of 9,189 protein-coding genes were annotated. Molecular dating showed that M. eohespera differentiated from its relative M. conica at ~19.03 Mya (million years ago) in Burdigalian. Evolutionary analysis showed that 657 gene families were contracted and 244 gene families expanded in M. eohespera versus the related morel species. The non-coding RNA prediction results showed that there were 336 tRNAs, 76 rRNAs, and 45 snRNAs in the M. eohespera genome. Interestingly, there was a high degree of repetition (20.93%) in the M. eohespera genome, and the sizes of long interspersed nuclear elements, short interspersed nuclear elements, and long terminal repeats were 0.83 Mb, 0.009 Mb, and 4.56 Mb, respectively. Additionally, selection pressure analysis identified that a total of 492 genes in the M. eohespera genome have undergone signatures of positive selection. The results of this study provide new insights into the genome evolution of M. eohespera and lay the foundation for in-depth research into the molecular biology of the genus Morchella in the future.
1 Introduction
Morchella is a member of the Morchellaceae family in the Pezizales order of the Pezizomycetes class (Du, 2019). The genus Morchella species has a beauteous cap with a honeycomb-like structure and a brown, yellow, black, or pale color that looks similar to open lamb tripe, giving it the name “morels.” According to the color and shape characteristics of the fruit body, the genus Morels can be divided into four major groups: black, yellow, red, and half-open morels (Bunyard et al., 1995) The results of recent molecular systematic studies showed that Morels can be divided into three branches, namely Esculenta Clade, Elata Clade (including two groups of black and half-open morel), and Rufobrunnea Clade support (Bunyard et al., 1995; Guzmán and Tapia, 1998). Among them, the Esculenta Clade and Elata Clade branches are sister groups and constitute the main group of the Morel genus (Min et al., 2017). There are currently 32 species identified in the Elata Clade branch (Du, 2019). True morels (Morchella) are supposed to have evolved in the early Cretaceous in the northern hemisphere, where they now show a high degree of continental endemicity (Murat et al., 2018). Biogeographical studies have shown that the species of the Elata Clade branch were mainly distributed in Europe, North America, South America, and Asia (Du et al., 2012; Du, 2019). There are at least 16 species of black morels in China (Du, 2019). Some species, such as Mel-14 (Sichuan), Mel-33 (Gansu), and Mel-34 (Yunnan), showed regional geographic distribution characteristics. It is reported that Morchella has a high edible value because it contains enough basic amino acids, vitamins, mineral elements, and proteins (Irfan et al., 2017; He et al., 2018). Furthermore, the Morchella species has important medicinal values for its multiple pharmacological effects, including anticarcinogenic (Hu et al., 2013), antioxidant (Cai et al., 2018; Li et al., 2018), and immunomodulatory activities (Su et al., 2013; Yang et al., 2019).
Genomics research is a window to understanding a concrete species. Some species in the genus Morchella were sequenced and analyzed. The genome study of Morchella septimelata M. Kuo is the first example of the Morchella genome, the size of which was 49.81 Mb (Li et al., 2018). The genome sequence deepened our understanding of the mechanisms of secondary metabolite biosynthesis and provided some insights into the growth, development, and carbohydrate degradation of this species. Subsequently, the genome sequence of another cultivated species, Morchella sextelata M. Kuo, has also been published (Mei-Han et al., 2019). The genome of M. sextelata is larger than that of M. septimelata, with a size of 52.93 Mb. The M. sextelata genome facilitates the study of gene components, protein-coding genes, annotated biological functions, and secondary metabolite gene clusters. Two different polar monospore strains of Morchella importuna, M. Kuo, O’Donnell, and T.J. Volk, were used for genomics research (Masaphy, 2010; Liu et al., 2018), further expanding our understanding of morel biology and evolution and facilitating the molecular genetic analysis and breeding of M. importuna.
In recent years, the cultivation of several Morchella species has been successfully commercialized in China. However, Morchella eohespera Beug, Voitk, and O’Donnell (Mel-19), as a wild morel, is still harvested from the wild at sites distributed in Qinghai, Xinjiang, Yunnan, and Gansu Provinces, as well as in other places in China. There is no cultivation record or genomic analysis of this species (Du et al., 2017). M. eohespera is a typical black morel species with a black pileus, honeycomb-like surface, conical to widely conical, and a white hollow stalk. The main habitats are moist, sandy, calcareous soil, or calcareous bedrock under grass or trees (Voitk et al., 2016).
To investigate the genetic organization and provide data for further studies of the biological functions of M. eohespera, a de novo whole-genome sequence analysis was conducted, and the genome was assembled. Additionally, the protein-coding genes, gene components, and related biological functions were analyzed. At the same time, a comparative study was carried out with the genomes of other closely related fungi, aiming to provide genomic data for further research on the evolutionary aspects and biological functions of M. eohespera.
2 Materials and methods
2.1 Strain selection and molecular identification
In this study, the fruiting body of wild M. eohespera strain m200 was collected from Makehe Forest Farm in Qinghai Province, China (E 100°86′70″, N32°69′74″). The mycelium of the m200 strain was cultured on potato dextrose agar (PDA) medium for 2 weeks at a temperature of 25 ± 1°C. The Ezup column Fungal Genomic DNA Extraction Kit (Sangon Biotech, Shanghai, China) was used to extract genomic DNA from the m200 strain. The integrity of the DNA was assessed by electrophoresis on a 0.7% (w/v) agarose gel. The quality of the extracted genomic DNA was determined from the A280/A260 ratio using a NanoDrop One spectrophotometer (NanoDrop Technologies, Wilmington, DE, United States) and a Qubit 3.0 fluorometer (Life Technologies, Carlsbad, CA, United States). The genes for the m200 strain’s rRNA internal transcribed spacer (ITS), translation elongation factor 1-alpha (ef1-α), RNA polymerase II subunit 1 (rpb1), and RNA polymerase II (rpb2) were amplified and sequenced to aid species identification by comparing this sequence with known fungal sequences in the NCBI GenBank database with BLASTX (Supplementary Table S1). DNA sequences were aligned, and species were identified. Molecular Evolutionary Genetic Analysis (MEGA) version 7.0 was used for species evolutionary distance analysis (Wattam et al., 2014; Kumar et al., 2016; Wattam et al., 2017).
2.2 Genome sequencing and assembly
The genome of the m200 strain was sequenced using the third-generation Nanopore Sequencing Technology on the Oxford Nanopore platforms at Goalgene (Wuhan, China) (Lu et al., 2016). A library comprising >1 kb fragments met the requirements for sequencing. Finally, after the sequencing data of Nanopore were obtained, the high-quality nanopore reads were corrected and assembled using Canu v1.5 (Koren et al., 2017) software. The minimap 2 2.17 (Li, 2018) comparison method and racon v1.3.1 (Chen et al., 2020) error correction method were used to paste the original third-generation off-machine data back to the assembled genome for error correction analysis. The software purge haplotigs (Roach et al., 2018) were used to de-redundant the genome after initial assembly error correction and identify and remove redundant heterozygous contigs based on the depth distribution of reads and sequence similarity.
The genome is compared with the second- and third-generation data in the NCBI nucleotide (NT) database. Additionally, the completeness of the genome was assessed using BUSCO v5.1.2 (Benchmarking Universal Single-Copy Orthologs) with fungi_odb10 (Simão et al., 2015).
2.3 Genomic prediction and genome annotation
2.3.1 Repeat sequence prediction and annotation
After obtaining the whole-genome data of the m200 strain, transposon sequence analysis was carried out for the assembled gene sequences with the transposon Repbase database (Bao et al., 2015), using RepeatMasker (Tarailo-Graovac and Chen, 2009) and RepeatProteinMasker software. Meanwhile, based on its own sequence ratio [Software: RepeatModeler (Zeng et al., 2018)] and repeat sequence characteristics [Software: Trf (Benson, 1999) and LTR-FINDER (Ou and Jiang, 2019)] were used for de novo prediction (Saha et al., 2008). Default parameters were used.
2.3.2 Gene prediction and function annotation
Two strategies were used for gene prediction: (1) based on Ab initio gene prediction, with GlimmerM (Majoros et al., 2003) and Augustus v 3.3.1 (Nachtweide and Stanke, 2019) software, the gene model was predicted ab initio and (2) based on homology-based prediction (Hamp et al., 2013), where we selected five closely related species (Ascobolus immersus Pers, Choiromyces venosus (Fr.) Th. Fr., Sphaerosporella brunnea (Alb. & Schwein.) Svrček & Kubička, Terfezia boudieri Chatin, and Tuber magnatum Picco) to predict the genomic genes of the M200 strain. Then, with the help of MAKER2 (Campbell et al., 2014) software, we integrated the gene sets predicted by the two methods into a non-redundant and more complete gene set. Additionally, the results of CEGMA v2.5 was also integrated (Parra et al., 2007).
Several complementary methods were used to annotate the assembled sequences. The genes were annotated by aligning the sequence with those previously stored in different protein databases including the Gene Ontology (GO) (Ashburner et al., 2000), Kyoto Encyclopedia of Genes and Genomes (KEGG) (Kanehisa et al., 2006), Nr (Non-Redundant Protein Database) (Yu and Zhang, 2013), Swiss-Prot (Magrane and Consortium, 2011), TrEMBL (O’Donovan et al., 2002), and KOG (Eukaryotic Orthologous Groups) (Tatusov et al., 2003). Transcription factors were annotated according to their InterPro IDs in the Fungal Transcription Factor Database (Wilson et al., 2008).
2.3.3 Non-coding RNA annotation
The tRNA sequences in the genome were identified using the tRNAscan-SE software (Chan and Lowe, 2019). Since rRNA is highly conserved, we chose the rRNA sequence of a closely related species as the reference sequence and utilized BLASTN (Rivas and Eddy, 2001) comparison to search for rRNA in the genome. Rfam (Kalvari et al., 2018) predicted other non-coding RNAs, such as microRNA (miRNAs) and small nuclear RNAs (snRNAs).
2.4 Gene family construction
The sequences of proteins ≥30 aa (amino acids) of M. eohespera and 14 other fungi were employed to compute pairwise similarities using BLASTP 2.7.1 (Altschul et al., 1990) (E-value ≤10−5). Using the OrthoMCL v2.0.9 pipeline with an inflation value of 2.0, gene families were constructed. Default parameters were used.
2.5 Phylogeny reconstruction and divergence time estimation
The m200 strain was analyzed with 13 Ascomycota Morchella conica Pers. (Lütkenhaus et al., 2019), Morchella crassipes (Vent.) Per. (Liu et al., 2020), Morchella eximia Boud. (Liu et al., 2020), M. importuna (Du et al., 2017), M. septimelata (Liu et al., 2018), M. sextelata (Masaphy, 2010), Ascodesmis nigricans Tiegh. (Liu et al., 2020), Beauveria brongniartii (Sacc.) Petch (Shang et al., 2016), Neurospora crassa Shear & B.O. Dodge (Baker et al., 2015), Parastagonospora nodorum (Berk.) Quaedvl., Verkley & Crous (McDonald et al., 2019), Rhynchosporium agropyri Zaffarano, B.A. McDonald & A. Linde (Penselin et al., 2016), Tuber melanosporum Vittad. (Martin et al., 2010), and Aspergillus niger Tiegh. (Gebru et al., 2020). One Basidiomycota [Gloeophyllum trabeum (Pers.) Murrill (Floudas et al., 2012)] was added to root the phylogenetic trees. Based on orthoMCL clustering, single-copy ortholog gene groups from 15 fungal species were selected randomly and aligned separately using MUSCLE v3.8.31.1 Gblocks were used to identify and remove poorly aligned regions.2 Then, maximum-likelihood tree estimation and bootstrap analyses were performed with RAxML v8.0.24 (Stamatakis, 2015) (m: GTRGAMMA). The maximum-likelihood (ML) analysis uses the default settings, and statistical support values were obtained through 100 replicates using non-parametric bootstrapping.
According to the ML tree, the species differentiation time provided by the TimeTree database3 was referred to as the fossil time (Kumar et al., 2017), and the BEAST v1.8.0 (Drummond and Rambaut, 2007) software was used to estimate the differentiation time of these eight species. We applied a general time reversible (GTR) model for nucleotide substitution and the “Yule process” tree prior model with three calibration points. The divergence time was estimated by Markov Chain Monte Carlo (MCMC) analysis for 80,000,000 generations. Based on fossil calibrations at the two calibrated nodes, including the divergence time of Morchella and the Tuberaceae, black morels (Elata clade) and yellow morels (Esculenta clade) (O’Donnell et al., 2011). According to the molecular clock theory, this study used the coding sequence (CDS) alignment of 1,220 single-copy gene family sequences to estimate the differentiation time (Liu et al., 2019). The orthologous genes of T. melanosporum were used as the outgroup.
2.6 Analysis of expansion and contraction of gene families and positive selection gene analysis
Using the cluster analysis results from gene families, the CAFE v4.2.1 software (Lu et al., 2017) was employed to examine gene family expansion and contraction with a significance level of 0.05.
To detect whether a gene family is affected by positive selection, the PAML software package’s CODEML PAML4.9/CODEML (model 4, kappa 0, codon2, blen 0) tool was utilized for each gene family (Yang, 2007).
2.7 Synteny analysis
The software minimap2 2.17 was utilized for conducting pairwise genome comparisons (Li, 2018) and for visualizing the comparison outcomes. We initially created an index, subsequently compared it, and ultimately obtained the comparison result in the same format. After comparing the results, it was determined that the R package ‘pafr’ was best suited for visualization purposes, and a collinear point diagram was consequently drawn.
2.8 Large fragment copy analysis and genome-wide replication
The lastz 1.04.004 software (Gao and Miller, 2020) developed by rsharris/lastz was utilized to search for the syntenic segments within the genome and to compare the repetitive fragments contained within it with the statistics of the genome.
Two analytical methods were chosen for genome-wide replication. One is synteny analysis (4DTV, Fourfold Degenerate Synonymous Site Synteny), while the other is grounded on the Ks distribution map (Huang et al., 2009). The MCscanX software was utilized to search for gene pairs in the syntenic region of the genome for synteny analysis (Wang et al., 2012), followed by MUSCLE for gene comparison, which eventually calculated its 4DTV value and generated a distribution map. Another approach involved identifying gene pairs within the genome through homologous clustering. MUSCLE was employed to perform gene comparison, calculate the Ks value, and generate a distribution map.
3 Results
3.1 Species identification
We identified the fungal species by analyzing the sequences of four nuclear gene fragments of the m200 DNA: ITS, ef1-α, rpb1, and rpb2. Species identification was performed by comparing the sequence with the sequence of known fungi in the NCBI GenBank. Finally, combined with the morphological analysis, the Morchella strain m200 was confirmed as M. eohespera.
3.2 Molecular sequencing and de novo assembly
In this study, whole-genome sequencing was performed for M. eohespera, based on third-generation nanopore sequencing technology. After filtering out the low-quality reads, a total of 64.19 Gb of Oxford Nanopore long reads was obtained (Supplementary Table S2). The largest read length was 191,615 bp. The average read length is 12,668.38 bp, and the N50 read length is 27,302 bp.
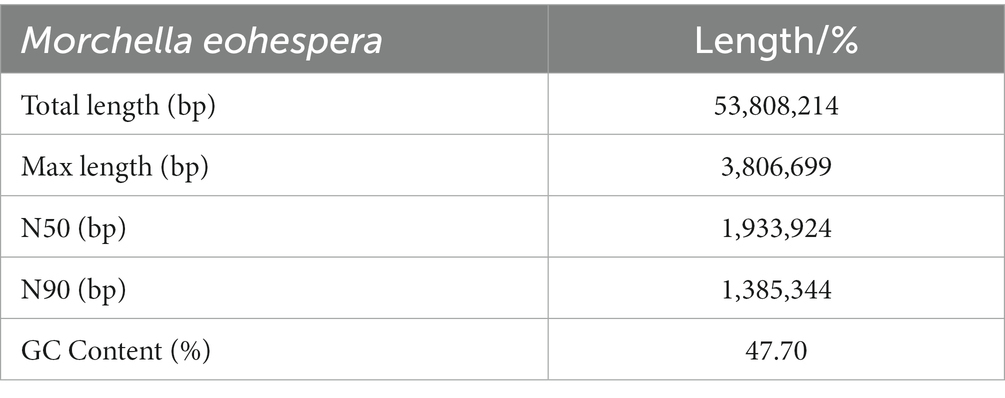
Due to the unavailability of reference information about the genome of Morchella, a de novo assembly strategy was used to assemble the M. eohespera genome. The result shows that the size of the assembled genome is approximately 59.66 Mb; after correction, it is approximately 53.81 Mb, and the GC content of the sample genome is approximately 47.70% (Table 1). In addition, based on the second-generation and third-generation data of the M. eohespera genome, we constructed a complete genome map of M. eohespera (Figure 1).
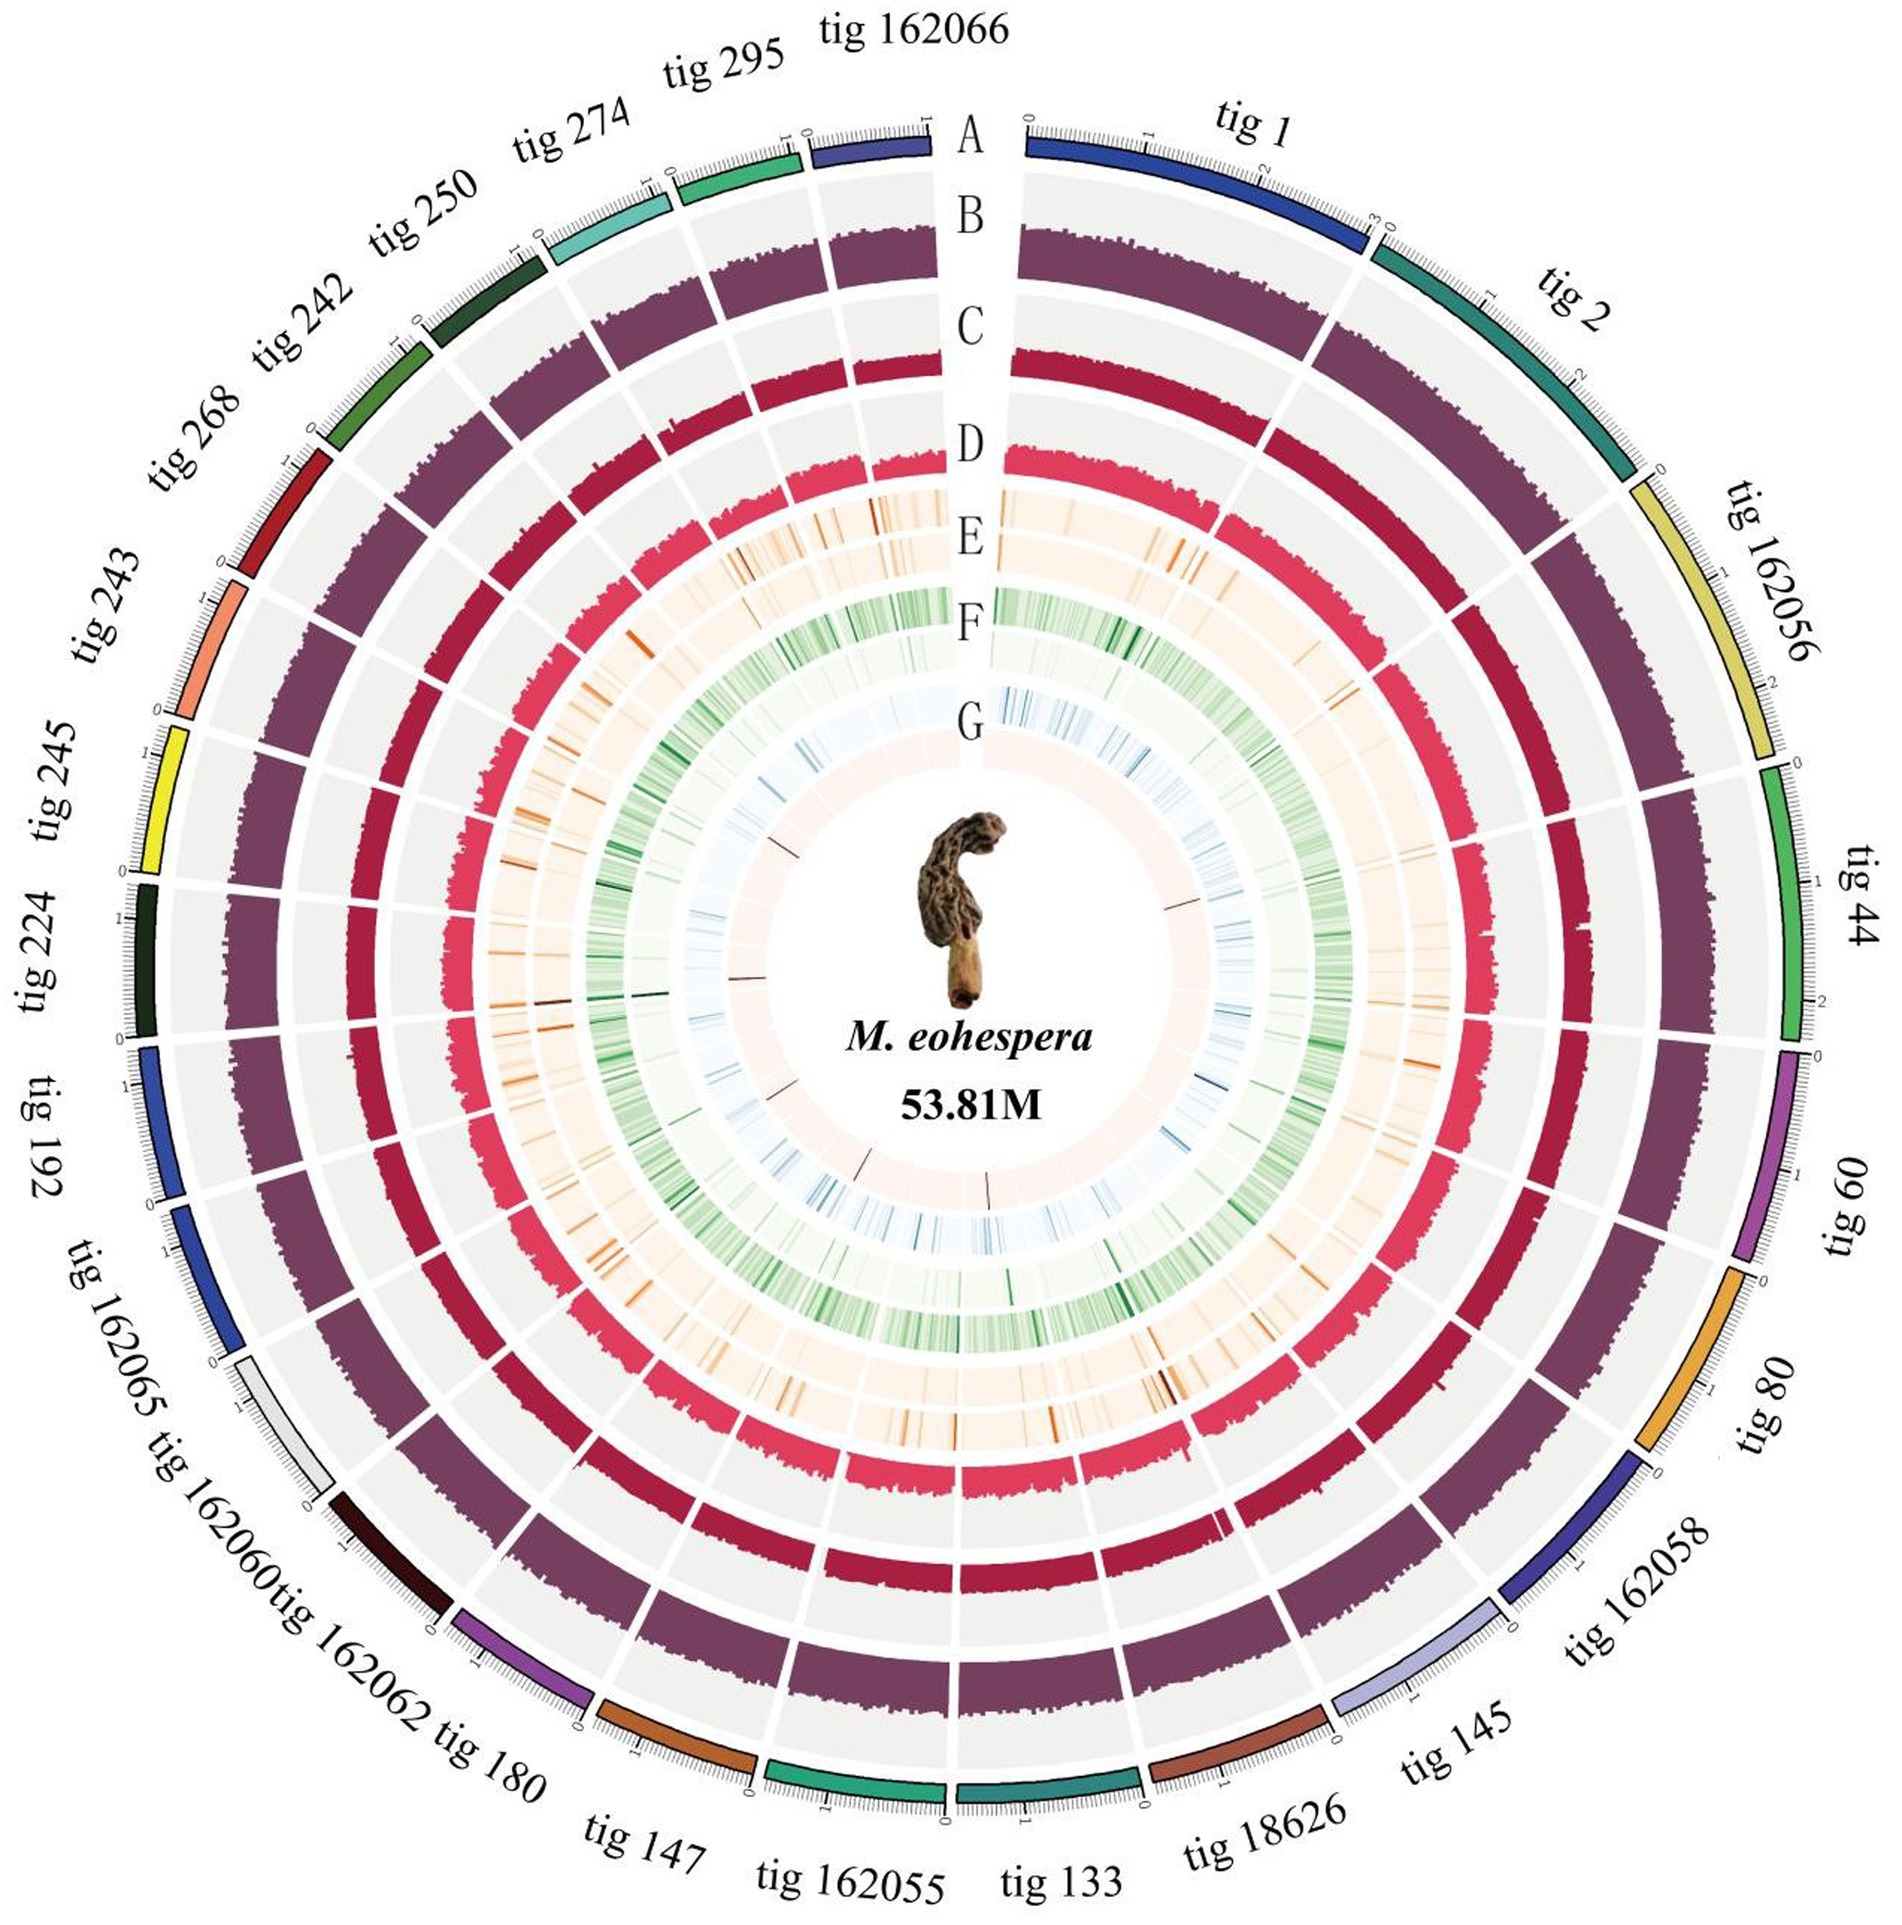
Figure 1. Morchella eohespera whole-genome map. From outside to inside, in order: (A) genomic information; (B) GC content distribution; (C) second-generation reads depth distribution; (D) depth distribution of three generations of reads; (E) outer circle is a homozygous SNP distribution, and the inner circle is a heterozygous SNP distribution; (F) outer circle is a homozygous InDel distribution, and the inner circle is a heterozygous InDel distribution; and (G) complete comparison of BUSCO gene distribution on the genome: blue is single-copy BUSCO and red is duplicated BUSCO.
By comparing with the genome data of other species of Morchella, we obtained a high-quality genome sequence through the Nanopore sequencing platform, with a sequencing depth of 1,193× with the N50 length reaching 1.93 Mb (Table 2).
3.3 Repeat sequence prediction annotation
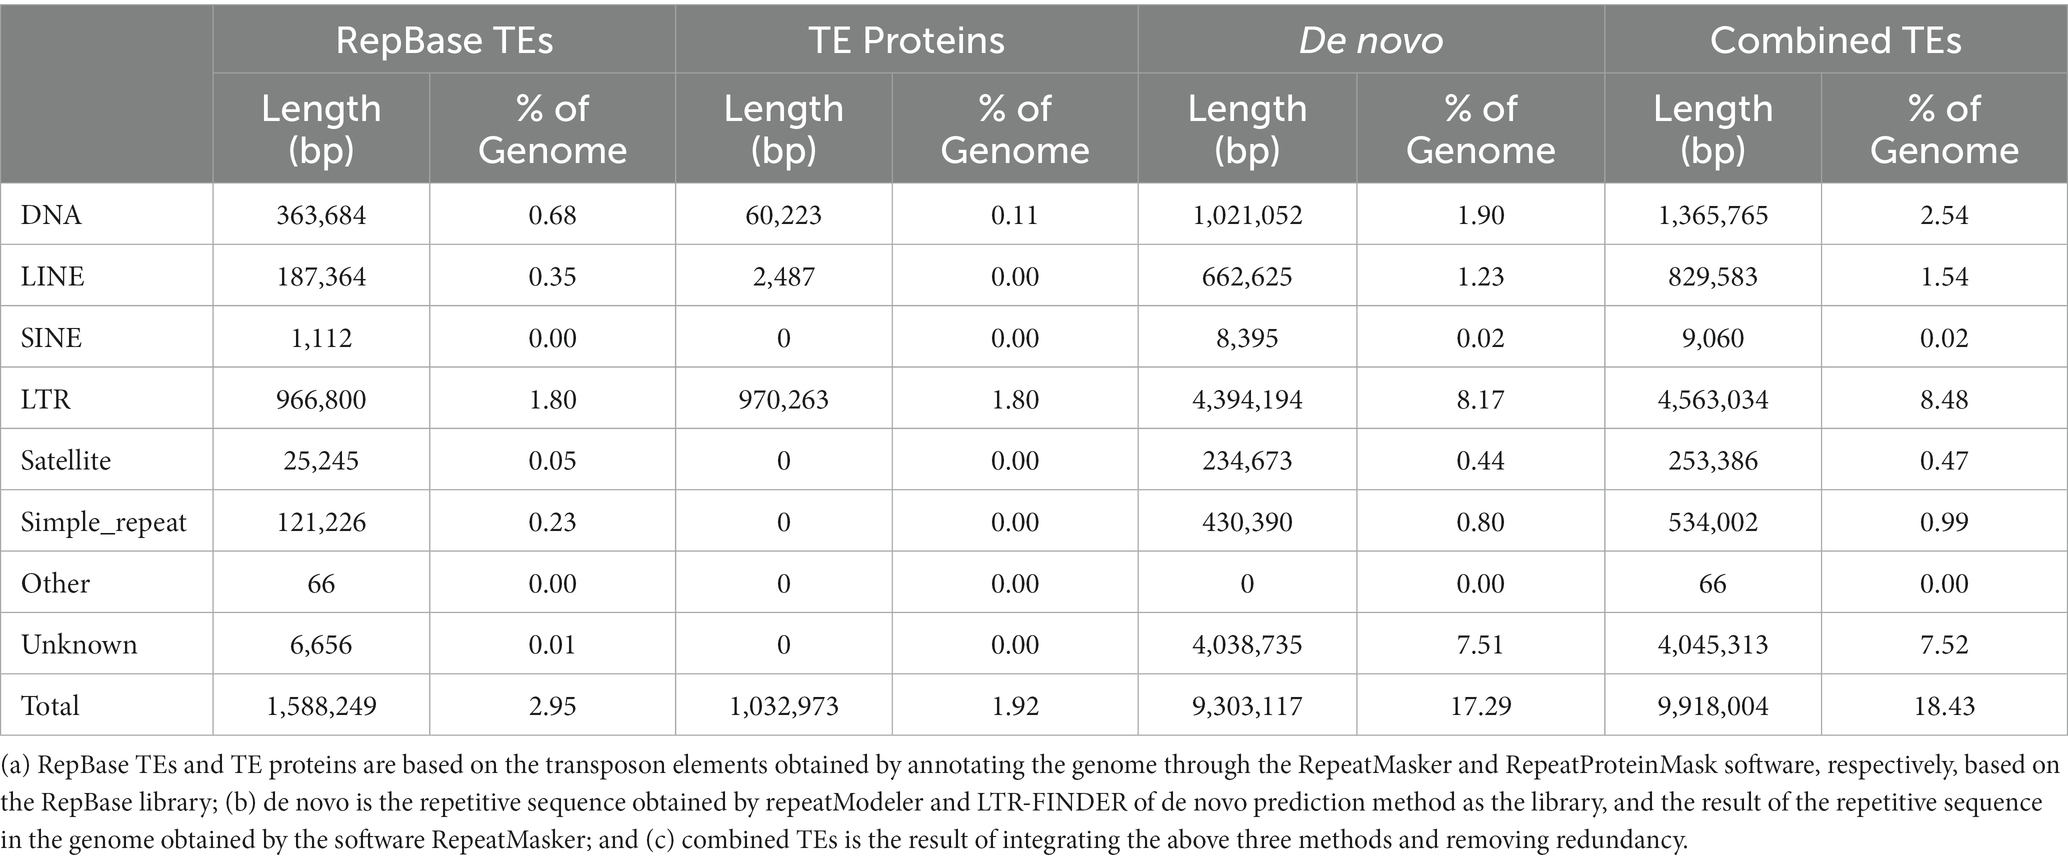
In this study, de novo prediction and comparison of homologous sequences were used to annotate the repetitive sequences of M. eohespera. There are 11.26 Mb of repetitive sequences in M. eohespera, accounting for approximately 20.93% of the genome (Table 3). The type and content analysis results of transposable elements (TEs) in the genome of M. eohespera showed that almost all plant genome transposons exist in the genomes of M. eohespera, with long terminal repeats (LTRs) being the main type of TE. The M. eohespera genome contains approximately 4.56 Mb long terminal repeats, accounting for approximately 8.48% of the whole M. eohespera genome, indicating that the expansion of LTR may have caused the expansion of the genome of M. eohespera (Table 4).
3.4 Gene prediction and function annotation
Finally, 9,189 genes were annotated in the genome. The average gene length of the predicted genes of M. eohespera is 1,822 bp, the average CDS length is 1,317 bp, and the average exon length is 402.77 bp (Supplementary Table S3).
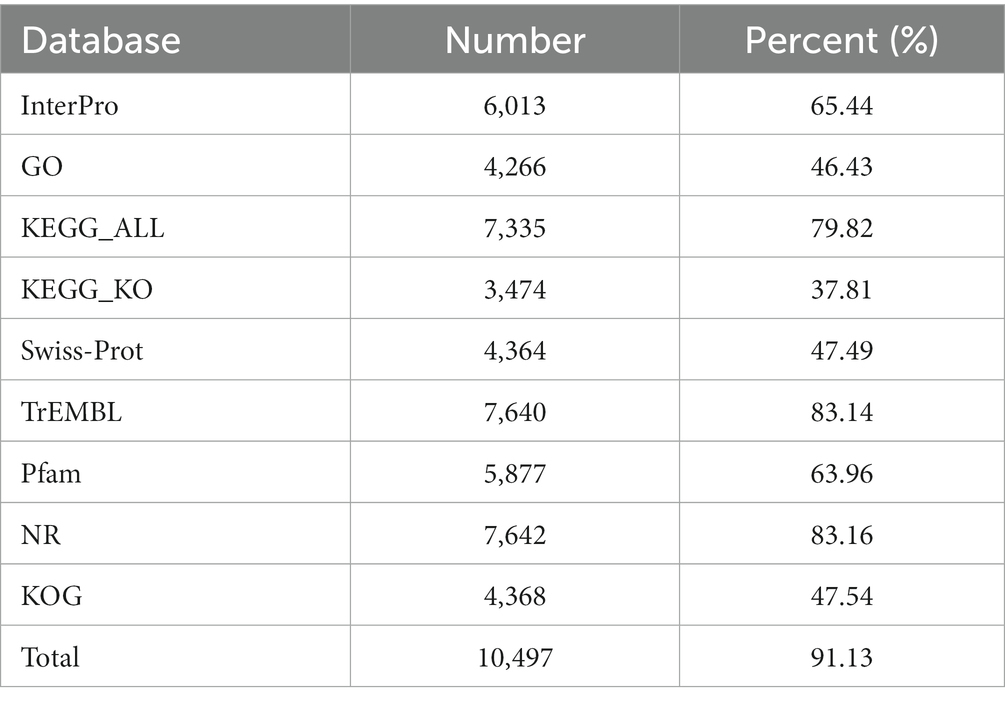
The whole genome of M. eohespera was annotated using the InterPro, GO, KEGG_ALL, KEGG_KO, Swiss-Prot, TrEMBL, Pfam, Nr, and KOG databases. The total number of M. eohespera genes with predicted functions was found to be 7,825, accounting for 85.16% of the total number of M. eohespera genes through functional cluster analysis (Table 5). Among them, there were 4,266 GO-annotated genes, accounting for 46.43% of the total. KEGG annotated 7,335 genes, accounting for 79.82% of the total. The remaining 15% of the genes could not be found in the currently known databases and belong to the unique genes of M. eohespera. These genes are likely to play an important role in the growth of M. eohespera.
3.5 Non-coding RNA
Non-coding RNA (ncRNA) plays a vital role in biological processes. The non-coding RNA prediction results showed that a total of 336 tRNAs were predicted in the M. eohespera genome, accounting for 0.053% of the entire genome. Compared with the amount of tRNA, the numbers of rRNA and snRNA were much lower, only 76 and 45, respectively. However, miRNA and snRNA were not predicted (Supplementary Table S4). The total number of ncRNA was 457, representing 0.94% of the genome assembly; this suggested that ncRNA formed only a small proportion of the overall genome size.
3.6 Identification of specific gene families and specific genes of Morchella Eohespera
Based on the sequence similarity of genes, the orthologous and paralogous relationships of 15 fungal genomes (M. eohespera, M. conica, M. crassipes, M. eximia, M. importuna, M. septimelata, M. sextelata, A. nigricans, B. brongniartii, N. crassa, P. nodorum, R. agropyri, T. melanosporum, A. niger, and G. trabeum) gene families were constructed. A total of 9,189 genes of the predicted genes of M. eohespera were clustered into 7,996 families, of which 48 gene families were unique to M. eohespera (Supplementary Table S5).
3.7 Phylogenetic analysis and divergence time estimation
A total of 1,220 single-copy orthologous genes were identified in the 15 fungal species (Morchella eohespera, Morchella conica, Morchella crassipes, Morchella eximia, Morchella importuna, Morchella septimelata, Morchella sextelata, Ascodesmis nigricans, Beauveria brongniartii, Neurospora crassa, Parastagonospora nodorum, Gloeophyllum trabeum, Rhynchosporium agropyri, Aspergillus niger, and Tuber melanosporum). A phylogenetic tree was constructed using the maximum-likelihood method and the GTRGAMMA model with 1,220 single-copy genes identified in the orthology analysis (Figure 2).
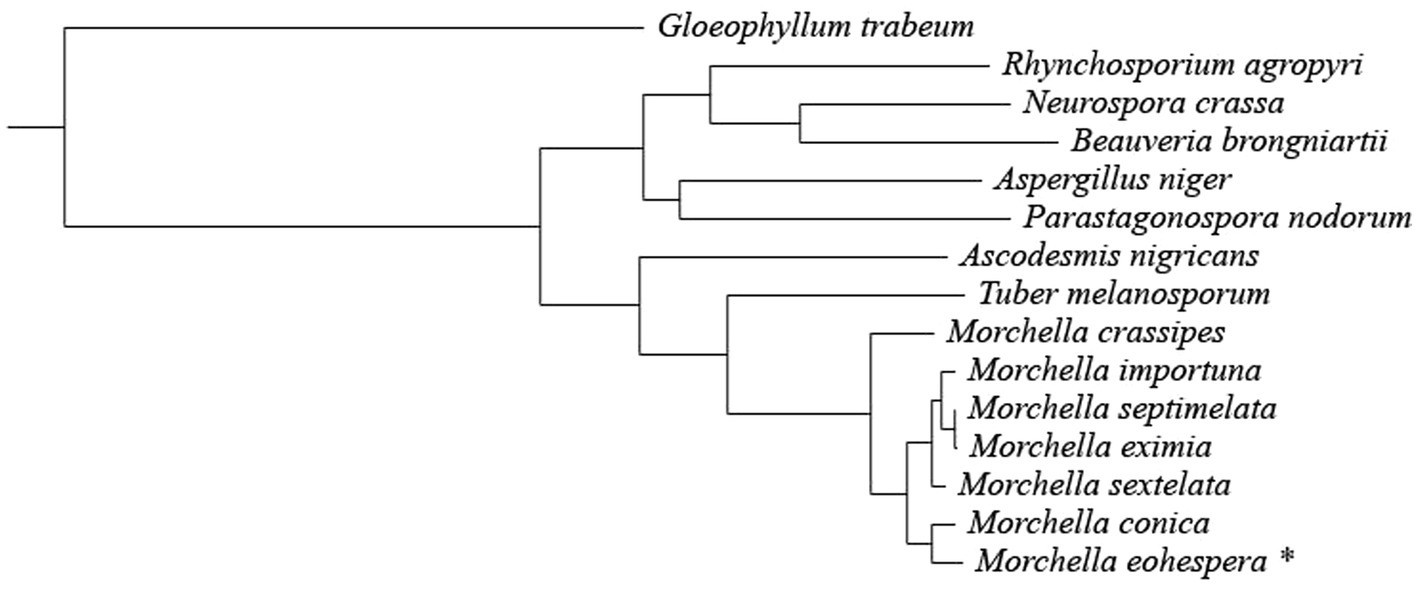
Figure 2. Phylogenetic tree constructed from seven Morchella species and eight related fungi. The taxon with * is the research object of this research.
It can be seen from Figure 2 that all Morchella species are clustered on a single evolutionary branch, with black morel and yellow morel (M. crassipes) being divided into two branches. Among them, M. conica was the closest relative to the M. eohespera species in one clade. M. eohespera is phylogenetically closest to M. conica, diverging ~19.03 million years ago (Figure 3).
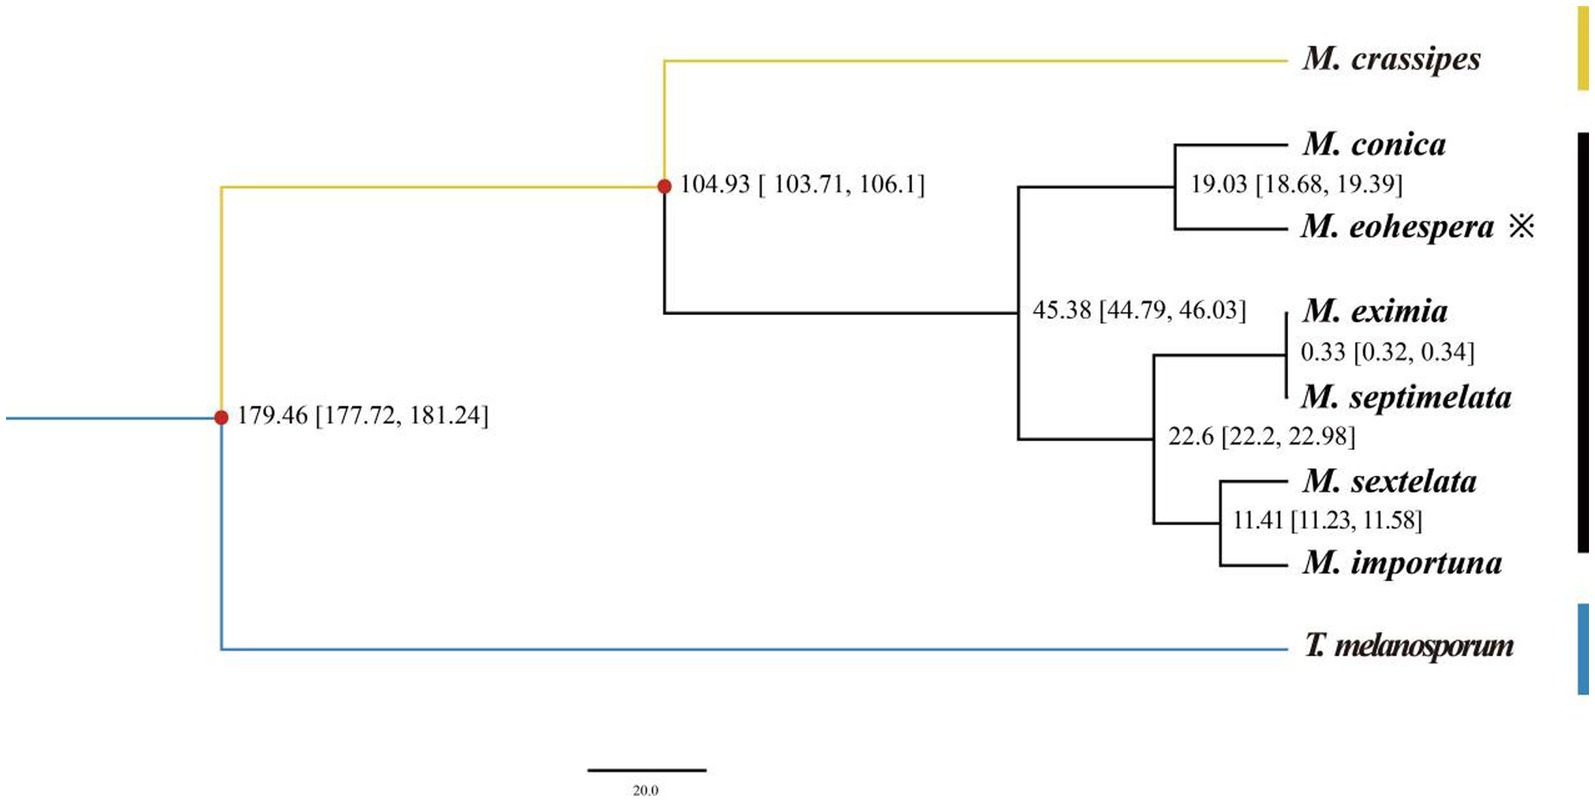
Figure 3. Evolutionary divergence time in eight species. The numbers on the branches indicate the estimated time of differentiation (million years ago, Mya), XXX-XXX differentiation time (X ~ X million years ago), and the red dots indicate fossil evidence.
3.8 Contraction and expansion of gene families
A phylogenetic tree was constructed using 1,220 single-copy genes from eight related fungi and seven species of Morchella. Among the 15 species, the gene families of M. eximia expanded more than contracted, whereas the other 14 species all showed more contraction than expansion (Figure 4). The number (657) of contraction gene families in M. eohespera is greater than the number (244) of expanded gene families, among which there are 244 expanded gene families and 657 contraction gene families. We performed an enrichment analysis on shrinkage genes (Supplementary Table S6). The contracted genes of M. eohespera are mostly involved in the “metabolic process” (GO:0008152), “cellular process” (GO:0009987), “organic substance metabolic process” (GO:0071704), and “primary metabolic process” (GO:0044238).
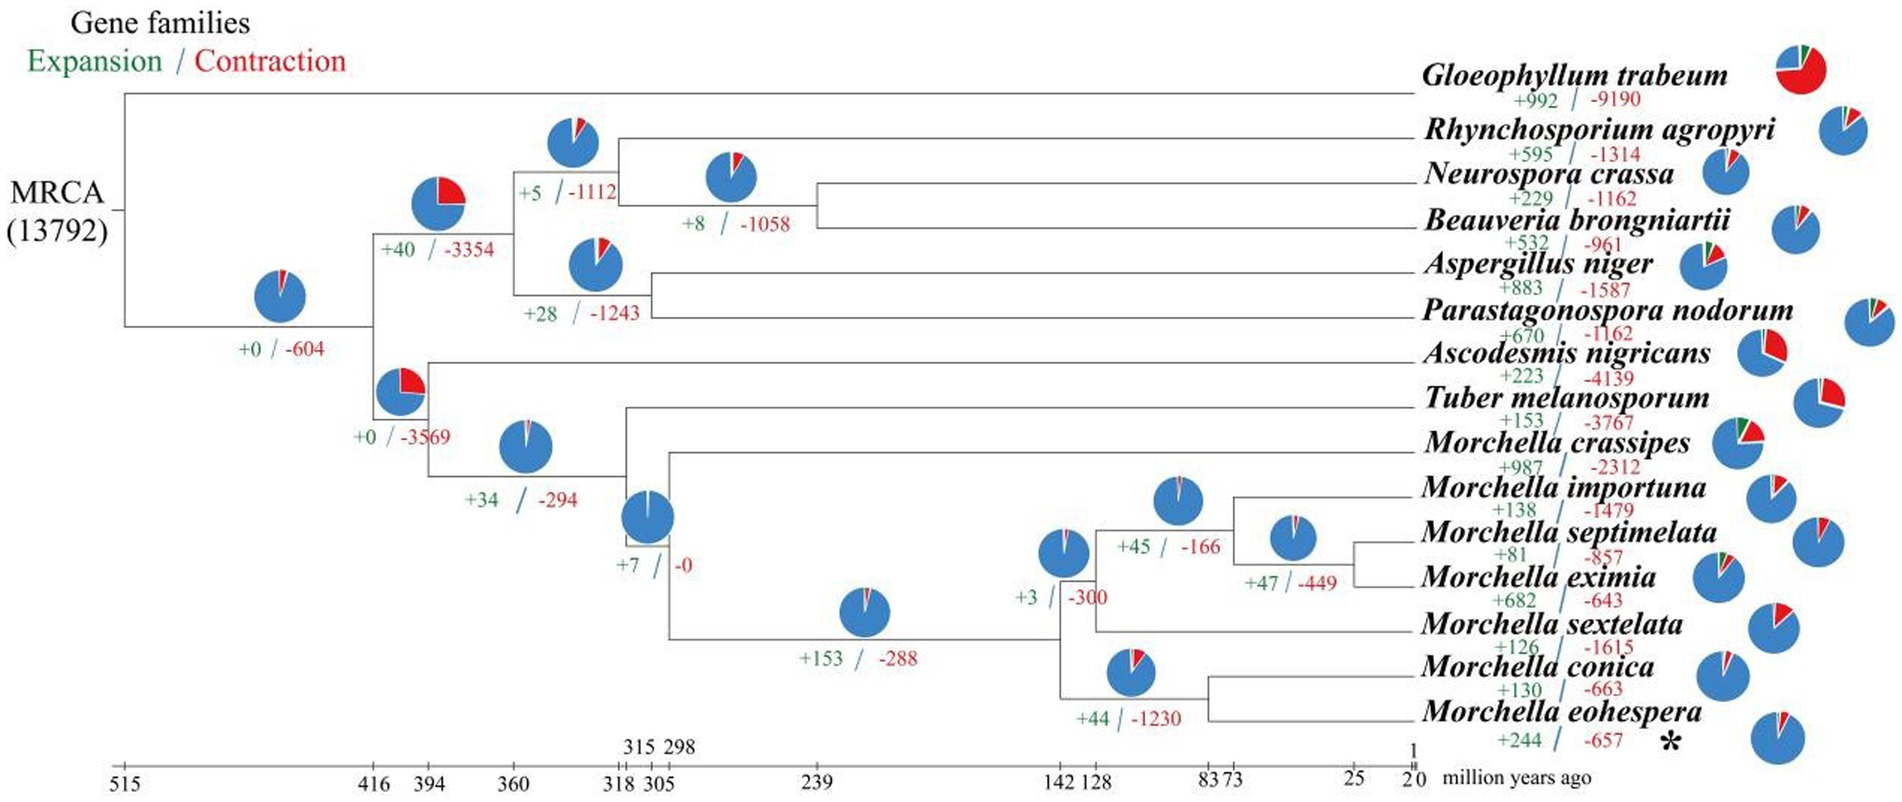
Figure 4. Expansion and contraction of Morchella eohespera gene families. The numbers on the branches of the phylogenetic tree indicate gene deletion (red) and gain (green). The pie chart to the right of each species name indicates the percentage of gene family amplification (green) and shrinkage (red) of that species. The pie chart to the right of the developmental tree shows the percentage of families that have changed (orange) and stayed the same (blue) among all species.
3.9 Enrichment analysis of positive selection genes
The CODEML tool in the PAML software package was used to select a branch-site model to detect whether a certain gene family of M. eohespera was subject to positive selection. A total of 492 genes in the M. eohespera genome displayed signatures of positive selection (see Figure 5).
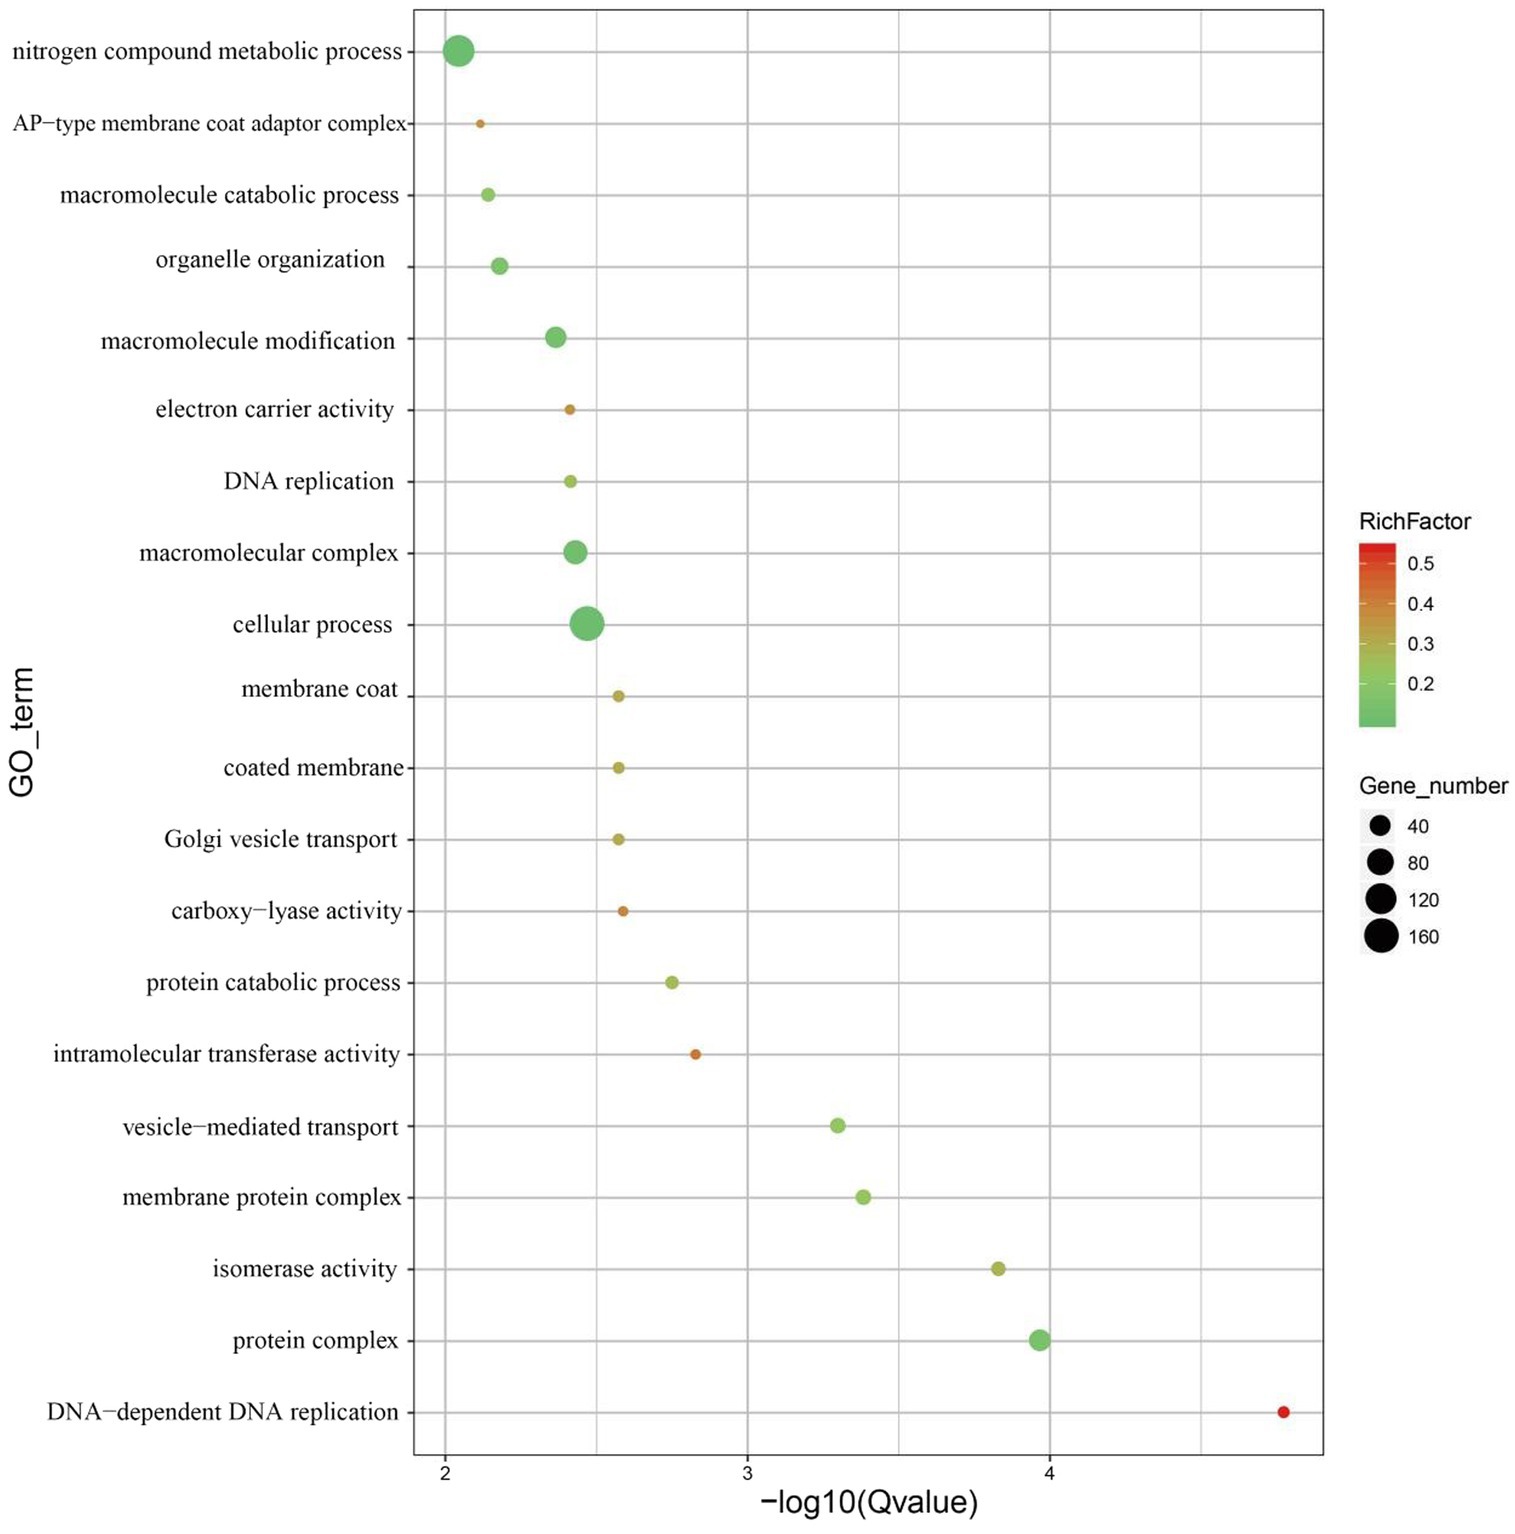
Figure 5. Display of GO enrichment results for positive selection genes. The abscissa is −log10 of the enriched Q-value, the ordinate is the GO term, the abscissa represents the number of genes in each category, and the ordinate represents the enriched genes.
According to the GO database, genes subject to positive selection were mainly distributed in four functional entries: “Binding” (GO:0005488), “Catalytic activity” (GO:0003824), “Metabolic process” (GO:0008152), and “Cellular process” (GO:0009987) (Supplementary Figure S1). To better understand the gene functions in M. eohespera, we successfully assigned putative proteins to their orthologs in the KEGG database. The KEGG function classification is shown in Supplementary Figure S2. Analysis of the M. eohespera species-specific genes revealed that 15 genes were significantly enriched in various KEGG pathways, including “Proteasome” (ko03050), “Autophagy-animal” (ko04140), “mTOR signaling pathway” (ko04150), and “Cell cycle” (ko04110) (Supplementary Figure S3).
3.10 Gene synteny analysis
The synteny analysis was performed using minimap2 software. We selected two related species (M. conica and M. sextelata) of M. eohespera based on the phylogenetic tree and performed syntenic analysis (Supplementary Figures S4, S5). According to the results of the synteny analysis of the three Mochella species, we can infer that the synteny between M. eohespera and M. conica is high, which is consistent with the phylogenetic analysis results we constructed earlier, and the relationship between them is close (Supplementary Figure S6).
3.11 Large fragment copy analysis whole-genome replication
The lastz 1.04.00 software was used to count the number of repetitive fragment pairs contained in the synteny segment of the M. eohespera genome. The total number of M. eohespera SD fragments is 176, the median length is 2,403 bp, and the total length is 878,958 bp (Table 6).
We used two methods for detection, one being synteny analysis (4DTV distribution of gene pairs in the synteny region), and the other being based on the Ks distribution map (Ks distribution of best hit gene pairs on the whole genome). According to the 4DTV distribution map (Supplementary Figure S7) and the Ks distribution map (Supplementary Figure S8) of M. eohespera, combined with the statistical results of large fragment replication, it was found that no genome-wide replication occurred in the M. eohespera genome.
4 Discussion
The draft genome of M. eohespera (53.81 Mb) is slightly larger than that of the closely related species, M. conica and M. sextelata, which are 52.43 Mb and 52.93 Mb, respectively (Murat et al., 2018). The average gene length of M. eohespera (1,643 bp) is also slightly larger than that of M. sextelata (1,372 bp) and M. septimelata (1,571 bp). Furthermore, the GC content of the M. eohespera genome (47.70%) is also greater than that of M. sextelata (47.37%) and M. septimelata (47.40%) (Li et al., 2018; Liu et al., 2018). The M. eohespera genome was predicted to contain 699 complete BUSCO genes and 35 fragmented BUSCO genes, and the completeness of the genes was 92.2% (699/758) (Supplementary Table S7). Through the above comparison, we can see that the results of this study are true and credible. The differences in genome size, average gene length, and GC content among closely related species of M. eohespera are not very obvious. With the development of sequencing technology, our future research data will be more authentic. The results of this study provide sequence data resources for the molecular biology of Morchella fungi and lay the foundation for further research into improving this genus, which is characterized by its significance in medicine and gastronomy.
Repetitive DNA sequences are widely distributed in the genomes of eukaryotes, and repetitive sequences are closely related to the evolution, inheritance, and variation of species (Aguileta et al., 2008). The genome of Morchella crassipes, representing the first yellow morel genome published, was slightly larger than that of M. eohespera, but the proportion of the genome that represented repeat sequences in M. eohespera (20.93%) was clearly greater than that of M. crassipes (15.34%) (Liu et al., 2020). Transposons are of great significance in the study of species formation, biological evolution, gene expression regulation, and transgenic technology. The four most common types of transposons, namely DNA, long interspersed nuclear elements (LINEs), long terminal repeats (LTRs), short interspersed nuclear elements (SINEs), and a small number of other unknown types of transposons, were predicted in the M. eohespera genome.
Phylogenetic trees based on a single gene or several genes may produce inconsistent topological structures, whereas phylogenetic trees based on the series of available genes in the whole genome can provide relatively high resolution (Dooner and Weil, 2007). In the current study, we used 1,220 genome-wide single-copy orthologous protein-encoding sequences combined with data from 14 reference fungal species to construct the maximum-likelihood tree at the higher level of M. eohespera. The evolutionary tree showed that M. eohespera and M. conica were clustered into the smallest group, with synteny analysis by minimap2 showing a greater synteny between them.
The BEAST v1.8.0 software was used to estimate the differentiation time of Morchella species and related species (Figure 3). Based on the fossil calibration point, the divergence time of each species could also be calculated. Seven morel species were clustered in one branch, and two black morels, M. eohespera and M. conica, had the closest genetic relationship, with a differentiation time of approximately 19.03 Mya. A yellow morel species, M. crassipes, had a greater genetic distance from the six black morel species and differentiated at approximately 104.93 Mya. The Morchellaceae (seven morel species) were differentiated from the Tuberaceae (T. melanosporum) at the family level at approximately 179.46 Mya, a finding that was consistent with those from a previous study (Liu et al., 2020). On the contrary, the number of expanded gene families was greater than the number of contracted gene families in the M. crassipes genome in the previous study. The number of expanded and contracted genes in the current study of M. crassipes was 149 and 2,152, respectively, more than were reported in previous studies.
Gene family contraction and expansion analysis showed that M. eohespera and M. crassipes differed markedly in gene types. It was calculated that 987 genes expanded in M. crassipes, sharply more than the 743 genes in M. eohespera (Liu et al., 2020). On the other hand, 657 genes were contracted in M. eohespera, clearly less than 1,655 genes in M. eohespera. The number of contracted and expanded genes in M. crassipes was the largest of the seven Morchella species in this current study. Functional enrichment analysis reflected that the main function of the contracted genes of M. eohespera was related to the “metabolic process” (GO:0008152).
The genome sequencing in this study provides the first annotation of the whole-genome sequence of M. eohespera. This study may provide important data for evaluating the species of Morchella, improving culture techniques, and discovering bioactive compounds. This can help meet the increasing demand for M. eohespera, but it is also significant for ongoing research into M. eohespera. To provide additional information, the gene annotation file generated in this study was uploaded and may provide useful data in the future for further research on the differences between various Morchella species and their biological functions.
5 Conclusion
The importance of fungi in agriculture, human health, and ecology emphasizes their potential for biotechnological applications. Third-generation sequencing technology was used to sequence a high-quality M. eohespera genome. Using the relevant information from the M. eohespera genome, an accurate picture was generated of the phylogenetic relationship and evolution of M. eohespera and related species, providing a new reference genome for the evolutionary analysis of ascomycete fungi. The generation of the genome sequence of M. eohespera will help us to study the phylogenetic status of M. eohespera at the genome level and to mine the sequence for key candidate genes for valuable biological traits, laying a theoretical foundation for the artificial cultivation of M. eohespera for high-value food production and herbal medicines, and to conserve wild populations from extinction.
Data availability statement
The original contributions presented in the study are publicly available. This data can be found here: https://www.ncbi.nlm.nih.gov/bioproject/; PRJNA1034038.
Author contributions
YL: Writing – original draft, Data curation. TY: Software, Writing – original draft. JQ: Methodology, Writing – review & editing. JL: Formal analysis, Methodology, Writing – review & revision. ZL: Supervision, Writing – original draft. WS: Funding acquisition, Writing – original draft. QS: Formal analysis, Visualization, Writing – review & editing.
Funding
The author(s) declare financial support was received for the research, authorship, and/or publication of this article. The Key R&D and Transformation Projects of Science and Technology Department of Qinghai Province (Grant no. 2022-NK-107).
Acknowledgments
The authors acknowledge the technical assistance of Qiyuan Gao in the laboratory.
Conflict of interest
The authors declare that the research was conducted in the absence of any commercial or financial relationships that could be construed as a potential conflict of interest.
Publisher’s note
All claims expressed in this article are solely those of the authors and do not necessarily represent those of their affiliated organizations, or those of the publisher, the editors and the reviewers. Any product that may be evaluated in this article, or claim that may be made by its manufacturer, is not guaranteed or endorsed by the publisher.
Supplementary material
The Supplementary material for this article can be found online at: https://www.frontiersin.org/articles/10.3389/fmicb.2023.1309703/full#supplementary-material
Footnotes
1. ^http://www.drive5.com/muscle/
2. ^http://molevol.cmima.csic.es/castresana/Gblocks.html
References
Aguileta, G., Marthey, S., Chiapello, H., Lebrun, M. H., Rodolphe, F., and Fournier, E. (2008). Assessing the performance of single-copy genes for recovering robust phylogenies. Syst. Biol. 57, 613–627. doi: 10.1080/10635150802306527
Altschul, S. F., Gish, W., Miller, W., et al. (1990). Basic local alignment search tool. J. Mol. Biol. 215, 403–410. doi: 10.1016/S0022-2836(05)80360-2
Ashburner, M., Ball, C. A., Blake, J. A., et al. (2000). Gene ontology: tool for the unification of biology. Gene Ontol. Consortium. Nat. Genet. 25, 25–29. doi: 10.1038/75556
Baker, S. E., Schackwitz, W., Lipzen, A., Martin, J., et al. (2015). Draft genome sequence of Neurospora crassa strain FGSC 73. Genome Announc. 3:e00074. doi: 10.1128/genomeA.00074-15
Bao, W. D., Kojima, K. K., and Kohany, O. (2015). Repbase update, a database of repetitive elements in eukaryotic genomes. Mob. DNA 6:11. doi: 10.1186/s13100-015-0041-9
Benson, G. (1999). Tandem repeats finder: a program to analyze DNA sequences. Nucleic Acids Res. 27, 573–580. doi: 10.1093/nar/27.2.573
Bunyard, B. A., Nicholson, M. S., and Royse, D. J. (1995). Phylogenetic resolution of Morchella, Verpa and Disciotis (Pezizales: Morchellaceae) based on restriction enzyme analysis of the 28S ribosomal gene. Exp. Mycol. 19, 223–233. doi: 10.1006/emyc.1995.1027
Cai, Z. N., Li, W., Mehmood, S., Pan, W., Wang, Y., and Meng, F. J. (2018). Structural characterization, in vitro and in vivo antioxidant activities of a heteropolysaccharide from the fruiting bodies of Morchella esculenta. Carbohydr. Polym. 195, 29–38. doi: 10.1016/j.carbpol.2018.04.069
Campbell, M. S., Holt, C., Moore, B., and Yandell, M. (2014). Genome annotation and curation using MAKER and MAKER-P. Curr. Protoc. Bioinformatics 48:e48. doi: 10.1002/0471250953.bi0411s48
Chan, P. P., and Lowe, T. M. (2019). tRNAscan-SE: searching for tRNA genes in genomic sequences. Methods Mol. Biol. 1962, 1–14. doi: 10.1007/978-1-4939-9173-0_1
Chen, Z., David, L. E., and Meng, J. H. (2020). Benchmarking long-read assemblers for genomic analyses of bacterial pathogens using oxford nanopore sequencing. Int. J. Mol. Sci. 21:9161. doi: 10.3390/ijms21239161
Dooner, H. K., and Weil, C. F. (2007). Give-and-take: interactions between DNA transposons and their host plant genomes. Curr. Opin. Genet. Dev. 17, 486–492. doi: 10.1016/j.gde.2007.08.010
Drummond, A. J., and Rambaut, A. (2007). BEAST: Bayesian evolutionary analysis by sampling trees. BMC Evol. Biol. 7:214. doi: 10.1186/1471-2148-7-214
Du, X. H. (2019). Review on species resources, reproductive modes and genetic diversity of black morels. J. Fungal Res. 17, 240–251. doi: 10.13341/j.jfr.2019.8016
Du, X. H., Zhao, Q., O’Donnell, K., Rooney, A. P., and Yang, Z. L. (2012). Multigene molecular phylogenetics reveals true morels (Morchella) are especially species-rich in China. Fungal Genet. Biol. 49, 455–469. doi: 10.1016/j.fgb.2012.03.006
Du, X. H., Zhao, Q., Xia, E. H., et al. (2017). Mixed-reproductive strategies, competitive mating-type distribution and life cycle of fourteen black morel species. Sci. Rep. 7:1493. doi: 10.1038/s41598-017-01682-8
Floudas, D., Binder, M., Riley, R., Barry, K., Blanchette, R. A., and Henrissat, B. (2012). The Paleozoic origin of enzymatic lignin decomposition reconstructed from 31 fungal genomes. Science 336, 1715–1719. doi: 10.1126/science.1221748
Gao, K., and Miller, J. (2020). Primary orthologs from local sequence context. BMC. Bioinform. 21:48. doi: 10.1186/s12859-020-3384-2
Gebru, S. T., Gangiredla, J., Tournas, V. H., Tartera, C., and Mammel, M. K. (2020). Draft genome sequences of Alternaria strains isolated from grapes and apples. Microbiol Resour Announc. 9:e01491. doi: 10.1128/MRA.01491-19
Guzmán, G., and Tapia, F. (1998). The known morels in Mexico, a description of a new blushing species, Morchella rufobrunnea, and new data onM. Guatemalensis. Mycologia 90, 705–714. doi: 10.1080/00275514.1998.12026960
Hamp, T., Kassner, R., Seemayer, S., Vicedo, E., Schaefer, C., and Achten, D. (2013). Homology-based inference sets the bar high for protein function prediction. BMC. Bioinform. 14:S7. doi: 10.1186/1471-2105-14-S3-S7
He, S. L., Zhao, K. T., Ma, L. F., Yang, J., and Chang, Y. (2018). Effects of different cultivation material formulas on the growth and quality of Morchella spp. Biol. Sci. 25, 719–723. doi: 10.1016/j.sjbs.2017.11.021
Hu, M. L., Chen, Y., Wang, C., Cui, H., Duan, P., and Zhai, T. (2013). Induction of apoptosis in HepG2 cells by polysaccharide MEP-II from the fermentation broth of Morchella esculenta. Biotechnol. Lett. 35, 1–10. doi: 10.1007/s10529-012-0917-4
Huang, S., Li, R., Zhang, Z., Li, L., Gu, X., and Fan, W. (2009). The genome of the cucumber, Cucumis sativus L. Nat. Genet. 41, 1275–1281. doi: 10.1038/ng.475
Irfan, M., Yang, S., Luo, Y. X., and Sun, J. X. (2017). Genetic diversity analysis of Morchella spp. by RAPD. Mol. Bio. Res. Commun. 6, 27–31.
Kalvari, I., Nawrocki, E. P., Argasinska, J. N., Quinones-Olvera, N., Finn, R. D., and Bateman, A. (2018). Non-coding RNA analysis using the Rfam database. Curr. Protoc. Bioinformatics 62:e51. doi: 10.1002/cpbi.51
Kanehisa, M., Goto, S., Hattori, M., Aoki-Kinoshita, K. F., Itoh, M., and Kawashima, S. (2006). From genomics to chemical genomics: new developments in KEGG. Nucleic Acids Res. 34, D354–D357. doi: 10.1093/nar/gkj102
Koren, S., Walenz, B. P., Berlin, K., Miller, J. R., Bergman, N. H., and Phillippy, A. M. (2017). Canu: scalable and accurate long-read assembly via adaptive k-mer weighting and repeat separation. Genome Res. 27, 722–736. doi: 10.1101/gr.215087.116
Kumar, S., Stecher, G., Suleski, M., and Hedges, S. B. (2017). TimeTree: a resource for timelines, timetrees, and divergence times. Mol. Biol. Evol. 34, 1812–1819. doi: 10.1093/molbev/msx116
Kumar, S., Stecher, G., and Tamura, K. (2016). MEGA7: molecular evolutionary genetics analysis version 7.0 for bigger datasets. Mol. Biol. Evol. 33, 1870–1874. doi: 10.1093/molbev/msw054
Li, H. (2018). Minimap2: pairwise alignment for nucleotide sequences. Bioinformatics 34, 3094–3100. doi: 10.1093/bioinformatics/bty191
Li, W., Cai, Z. N., Mehmood, S., Wang, Y., Pan, W. J., and Zhang, W. N. (2018). Polysaccharide FMP-1 from Morchella esculenta attenuates cellular oxidative damage in human alveolar epithelial A549 cells through PI3K/AKT/Nrf2/HO-1 pathway. Int. J. Biol. Macromol. 120, 865–875. doi: 10.1016/j.ijbiomac.2018.08.148
Li, H. Y., Wu, S. R., Ma, X., Chen, W., Zhang, J., and Duan, S. (2018). The genome sequences of 90 mushrooms. Sci. Rep. 8, 9982–9223. doi: 10.1038/s41598-018-28303-2
Liu, W., Cai, Y. L., Zhang, Q. Q., Shu, F., Chen, L., and Ma, X. (2020). Subchromosome-scale nuclear and complete mitochondrial genome characteristics of Morchella crassipes. Int. J. Mol. Sci. 21:483. doi: 10.3390/ijms21020483
Liu, W., Chen, L. F., and Cai, Y. L. (2018). Opposite polarity monospore genome de novo sequencing and comparative analysis reveal the possible heterothallic life cycle of Morchella importuna. Int. J. Mol. Sci. 19:2525. doi: 10.3390/ijms19092525
Liu, Y. J., Wang, X. R., and Zeng, Q. Y. (2019). De novo assembly of white poplar genome and genetic diversity of white poplar population in Irtysh River basin in China. Sci. China Life Sci. 62, 609–618. doi: 10.1007/s11427-018-9455-2
Lu, H. Y., Giordano, F., and Ning, Z. M. (2016). Oxford nanopore minION sequencing and genome assembly. Genomics Proteom. Bioinform. 14, 265–227. doi: 10.1016/j.gpb.2016.05.004
Lu, Y. Y., Tang, K., Ren, J., Fuhrman, J. A., Waterman, M. S., and Sun, F. (2017). CAFE: aCcelerated alignment-FrEe sequence analysis. Nucleic Acids Res. 45, W554–W559. doi: 10.1093/nar/gkx351
Lütkenhaus, T., Traeger, S., Breuer, J., Carreté, L., Kuo, A., and Lipzen, A. (2019). Comparative genomics and transcriptomics to analyze fruiting body development in filamentous ascomycetes. Genetics 213, 1545–1563. doi: 10.1534/genetics.119.302749
Magrane, M., and Consortium, U., (2011) UniProt knowledgebase: a hub of integrated protein data. Database. (Oxford). 2011, bar009
Majoros, W. H., Pertea, M., Antonescu, C., et al. (2003). Exonomy and unveil: three ab initio eukaryotic genefinders. Nucleic. Acids. Res. 31, 3601–3604. doi: 10.1093/nar/gkg527
Martin, F., Kohler, A., Murat, C., Balestrini, R., Coutinho, P. M., and Jaillon, O. (2010). Périgord black truffle genome uncovers evolutionary origins and mechanisms of symbiosis. Nature 464, 1033–1038. doi: 10.1038/nature08867
Masaphy, S. (2010). Biotechnology of morel mushrooms: successful fruiting body formation and development in a soilless system. Biotechnol. Lett. 32, 1523–1527. doi: 10.1007/s10529-010-0328-3
McDonald, M. C., Taranto, A. P., Hill, E., Schwessinger, B., Liu, Z., and Simpfendorfer, S. (2019). Transposon-mediated horizontal transfer of the host-specific virulence protein ToxA between three fungal wheat pathogens. MBio 10:e01515. doi: 10.1128/mBio.01515-19
Mei-Han,, Qingshan-Wang,, Baiyintala, S., and Wuhanqimuge, (2019). The whole-genome sequence analysis of Morchella sextelata. Sci. Rep. 9:15376. doi: 10.1038/s41598-019-51831-4
Min, Y. X., Dai, C. H., and Mao, Y. P. (2017). Research progress on Morchella spp. in Gannan. Gansu Province. Edible. And. Medicinal. Mushrooms. 25, 166–170.
Murat, C., Payen, T., Noel, B., Kuo, A., Morin, E., and Chen, J. (2018). Pezizomycetes genomes reveal the molecular basis of ectomycorrhizal truffle lifestyle. Nat Ecol Evol 2, 1956–1965. doi: 10.1038/s41559-018-0710-4
Nachtweide, S., and Stanke, M. (2019). Multi-genome annotation with AUGUSTUS. Methods Mol. Biol. 1962, 139–160. doi: 10.1007/978-1-4939-9173-0_8
O’Donnell, K., Rooney, A. P., Mills, G. L., Kuo, M., Weber, N. S., and Rehner, S. A. (2011). Phylogeny and historical biogeography of true morels (Morchella) reveals an early cretaceous origin and high continental endemism and provincialism in the Holarctic. Fungal Genet. Biol. 48, 252–265. doi: 10.1016/j.fgb.2010.09.006
O’Donovan, C., Martin, M. J., Gattiker, A., Gasteiger, E., Bairoch, A., and Apweiler, R. (2002). High-quality protein knowledge resource: SWISS-PROT and TrEMBL. Brief. Bioinform. 3, 275–284. doi: 10.1093/bib/3.3.275
Ou, S. J., and Jiang, N. (2019). LTR_FINDER_parallel: parallelization of LTR_FINDER enabling rapid identification of long terminal repeat retrotransposons. Mob. DNA 10:48. doi: 10.1186/s13100-019-0193-0
Parra, G., Bradnam, K., and Korf, I. (2007). CEGMA: a pipeline to accurately annotate core genes in eukaryotic genomes. Bioinformatics 23, 1061–1067. doi: 10.1093/bioinformatics/btm071
Penselin, D., Münsterkötter, M., Kirsten, S., Felder, M., Taudien, S., and Platzer, M. (2016). Comparative genomics to explore phylogenetic relationship, cryptic sexual potential and host specificity of Rhynchosporium species on grasses. BMC Genomics 17:953. doi: 10.1186/s12864-016-3299-5
Rivas, E., and Eddy, S. R. (2001). Noncoding RNA gene detection using comparative sequence analysis. BMC. Bioinform. 2:8. doi: 10.1186/1471-2105-2-8
Roach, M. J., Schmidt, S. A., and Borneman, A. (2018). Purge Haplotigs: allelic contig reassignment for third-gen diploid genome assemblies. BMC. Bioinform. 19:460. doi: 10.1186/s12859-018-2485-7
Saha, S., Bridges, S., Magbanua, Z. V., and Peterson, D. G. (2008). Empirical comparison of ab initio repeat finding programs. Nucleic Acids Res. 36, 2284–2294. doi: 10.1093/nar/gkn064
Shang, Y. F., Xiao, G. H., Zheng, P., Cen, K., Zhan, S., and Wang, C. (2016). Divergent and convergent evolution of fungal pathogenicity. Genome Biol. Evol. 8, 1374–1387. doi: 10.1093/gbe/evw082
Simão, F. A., Waterhouse, R. M., Ioannidis, P., Kriventseva, E. V., and Zdobnov, E. M. (2015). BUSCO: assessing genome assembly and annotation completeness with single-copy orthologs. Bioinformatics 31, 3210–3212. doi: 10.1093/bioinformatics/btv351
Stamatakis, A. (2015). Using RAxML to infer phylogenies. Curr. Protoc. Bioinform. 51:s51. doi: 10.1002/0471250953.bi0614s51
Su, C. A., Xu, X. Y., Liu, D. Y., Wu, M., Zeng, F. Q., and Zeng, M. Y. (2013). Isolation and characterization of exopolysaccharide with immunomodulatory activity from fermentation broth of Morchella conica. Daru 21:5. doi: 10.1186/2008-2231-21-5
Tarailo-Graovac, M., and Chen, N. S. (2009). Using repeat masker to identify repetitive elements in genomic sequences. Curr. Protoc. Bioinformatics 4:s25. doi: 10.1002/0471250953.bi0410s25
Tatusov, R. L., Fedorova, N. D., Jackson, J. D., Jacobs, A. R., Kiryutin, B., and Koonin, E. V. (2003). The COG database: an updated version includes eukaryotes. BMC. Bioinform. 4, 41–54. doi: 10.1186/1471-2105-4-41
Voitk, A., Beug, M. W., O’Donnell, K., and Burzynski, M. (2016). Two new species of true morels from Newfoundland and Labrador: cosmopolitan Morchella eohespera and parochial M. Laurentiana. Mycologia 108, 31–37. doi: 10.3852/15-149
Wang, P., Tang, H. B., DeBarry, J. D., Tan, X., Li, J., and Wang, X. (2012). MCScanX: a toolkit for detection and evolutionary analysis of gene synteny and collinearity. Nucleic Acids Res. 40:e49. doi: 10.1093/nar/gkr1293
Wattam, A. R., Abraham, D., Dalay, O., Disz, T. L., Driscoll, T., and Gabbard, J. L. (2014). PATRIC, the bacterial bioinformatics database and analysis resource. Nucleic Acids Res. 42, D581–D591. doi: 10.1093/nar/gkt1099
Wattam, A. R., Davis, J. J., Assaf, R., Boisvert, S., Brettin, T., and Bun, C. (2017). Improvements to PATRIC, the all-bacterial bioinformatics database and analysis resource center. Nucleic Acids Res. 45, D535–D542. doi: 10.1093/nar/gkw1017
Wilson, D., Charoensawan, V., Kummerfeld, S. K., and Teichmann, S. A. (2008). DBD-taxonomically broad transcription factor predictions: new content and functionality. Nucleic Acids Res. 36, D88–D92. doi: 10.1093/nar/gkm964
Yang, Z. H. (2007). PAML 4: phylogenetic analysis by maximum likelihood. Mol. Biol. Evol. 24, 1586–1591. doi: 10.1093/molbev/msm088
Yang, Y. X., Chen, J. L., Lei, L., Li, F., Tang, Y., and Yuan, Y. (2019). Acetylation of polysaccharide from Morchella angusticeps peck enhances its immune activation and anti-inflammatory activities in macrophage RAW264.7 cells. Food Chem. Toxicol. 125, 38–45. doi: 10.1016/j.fct.2018.12.036
Yu, K., and Zhang, T. (2013). Construction of customized sub-databases from NCBI-nr database for rapid annotation of huge metagenomic datasets using a combined BLAST and MEGAN approach. PLoS One 8:e59831. doi: 10.1371/journal.pone.0059831
Keywords: Morchella eohespera, genome evolution, phylogeny, positive selection analysis, gene expansion, gene contraction
Citation: Li Y, Yang T, Qiao J, Liang J, Li Z, Sa W and Shang Q (2024) Whole-genome sequencing and evolutionary analysis of the wild edible mushroom, Morchella eohespera. Front. Microbiol. 14:1309703. doi: 10.3389/fmicb.2023.1309703
Edited by:
Vasco Ariston De Carvalho Azevedo, Federal University of Minas Gerais, BrazilReviewed by:
John G. Gibbons, University of Massachusetts Amherst, United StatesChenyang Huang, Chinese Academy of Agricultural Sciences, China
Copyright © 2024 Li, Yang, Qiao, Liang, Li, Sa andShang. This is an open-access article distributed under the terms of the Creative Commons Attribution License (CC BY). The use, distribution or reproduction in other forums is permitted, provided the original author(s) and the copyright owner(s) are credited and that the original publication in this journal is cited, in accordance with accepted academic practice. No use, distribution or reproduction is permitted which does not comply with these terms.
*Correspondence: Wei Sa, c2F3ZWkzNjk5QDE2My5jb20=; Qianhan Shang, cWhzaGFuZ0BsemIuYWMuY24=
†These authors have contributed equally to this work
 Yixin Li1†
 Jinxia Qiao
 Zhonghu Li
 Qianhan Shang