
95% of researchers rate our articles as excellent or good
Learn more about the work of our research integrity team to safeguard the quality of each article we publish.
Find out more
ORIGINAL RESEARCH article
Front. Microbiol. , 28 November 2023
Sec. Systems Microbiology
Volume 14 - 2023 | https://doi.org/10.3389/fmicb.2023.1289110
 Ze-Shen Liu1†
 Ke-Huan Wang1,2†
 Man Cai3
 Mei-Ling Yang1,2Xiao-Kang Wang1,2Hong-Lin Ma1,2Yi-Han Yuan4
 Lin-Huan Wu3
 De-Feng Li1,2*
 Shuang-Jiang Liu1,2,5*
There are many unidentified microbes in polluted soil needing to be explored and nominated to benefit the study of microbial ecology. In this study, a taxonomic research was carried out on five bacterial strains which were isolated and cultivated from polycyclic aromatic hydrocarbons, and heavy metals polluted soil of an abandoned coking plant. Phylogenetical analysis showed that they belonged to the phyla Proteobacteria and Actinobacteria, and their 16S rRNA gene sequence identities were lower than 98.5% to any known and validly nominated bacterial species, suggesting that they were potentially representing new species. Using polyphasic taxonomic approaches, the five strains were classified as new species of the families Microbacteriaceae and Sphingomonadaceae. Genome sizes of the five strains ranged from 3.07 to 6.60 Mb, with overall DNA G+C contents of 63.57–71.22 mol%. The five strains had average nucleotide identity of 72.38–87.38% and digital DNA-DNA hybridization of 14.0–34.2% comparing with their closely related type strains, which were all below the thresholds for species delineation, supporting these five strains as novel species. Based on the phylogenetic, phylogenomic, and phenotypic characterizations, the five novel species are proposed as Agromyces chromiiresistens (type strain H3Y2-19aT = CGMCC 1.61332T), Salinibacterium metalliresistens (type strain H3M29-4T = CGMCC 1.61335T), Novosphingobium album (type strain H3SJ31-1T = CGMCC 1.61329T), Sphingomonas pollutisoli (type strain H39-1-10T = CGMCC 1.61325T), and Sphingobium arseniciresistens (type strain H39-3-25T = CGMCC 1.61326T). Comparative genome analysis revealed that the species of the family Sphingomonadaceae represented by H39-1-10T, H39-3-25T, and H3SJ31-1T possessed more functional protein-coding genes for the degradation of aromatic pollutants than the species of the family Microbacteriaceae represented by H3Y2-19aT and H3M29-4T. Furthermore, their capacities of resisting heavy metals and metabolizing aromatic compounds were investigated. The results indicated that strains H3Y2-19aT and H39-3-25T were robustly resistant to chromate (VI) and/or arsenite (III). Strains H39-1-10T and H39-3-25T grew on aromatic compounds, including naphthalene, as carbon sources even in the presence of chromate (VI) and arsenite (III). These features reflected their adaptation to the polluted soil environment.
Microbacteriaceae and Sphingomonadaceae are families belonging to Actinobacteria and Proteobacteria, respectively, and have been frequently detected in diverse environments, including polluted environments with polycyclic aromatic hydrocarbons (PAHs) and heavy metals. The species of the family Microbacteriaceae, for example, Agromyces and Salinibacterium, were repeatedly detected in polluted environments (Papale et al., 2017; Parab and Phadke, 2020; Huang et al., 2022; Sazykina et al., 2022). Agromyces and Salinibacterium were also detected in habitats such as caves, marine environments, soil, sediments, and rhizosphere (Jurado et al., 2005; Hamada et al., 2014; Wang et al., 2016; Lu et al., 2023). At the time of writing the article, Agromyces harbors 42 validly nominated species and 4 subspecies (https://lpsn.dsmz.de/genus/agromyces), with Agromyces ramosus DSM 43045T as the type strain (Gledhill and Casida, 1969). Salinibacterium harbors three validly nominated species (https://lpsn.dsmz.de/genus/salinibacterium), with Salinibacterium amurskyense KMM 3673T as the type strain (Han et al., 2003).
The family Sphingomonadaceae (https://lpsn.dsmz.de/family/sphingomonadaceae) is ubiquitous in environments, and members of this family are active degraders of pollutants, including PAHs (Brito et al., 2006; Shokrollahzadeh et al., 2008; Waigi et al., 2015). Its type genus Sphingomonas was first proposed in 1990 and then split into four taxa, namely, Sphingomonas sensu stricto (Spm), Sphingobium (Spb), Novosphingobium, and Sphingopyxis (Takeuchi et al., 2001). Sphingomonadaceae species share the unique cellular component of sphingoglycolipids (Singh et al., 2015). At the time of writing the article, Novosphingobium harbors 58 validly published and correct species names (https://lpsn.dsmz.de/genus/novosphingobium), with Novosphingobium capsulatum as the type species. Sphingobium harbors 44 validly nominated species, with Sphingobium yanoikuyae as the type species (https://lpsn.dsmz.de/genus/sphingobium). Sphingomonas harbors 152 validly published and correct species names, with Sphingomonas paucimobilis (Yabuuchi et al., 1990) as the type species (https://lpsn.dsmz.de/genus/sphingomonas).
Many soil microbes remain uncultivated (Daniel, 2005; Lok, 2015), and microbes dwelling in polluted soil may adapt themselves by evolution for resistance or even assimilation of chemical pollutants such as PAHs and heavy metals for energy or carbon sources (Gou et al., 2020; Thakur et al., 2022). We previously explored the microbial diversity of polluted sites of the coking plant and found that the microbial taxa responded differently to PAHs and heavy metals (Yang et al., 2022). This communication reports the isolation and genotypic and phenotypic characterization of five bacterial strains, namely, H3Y2-19aT, H3M29-4T, H39-1-10T, H39-3-25T, and H3SJ31-1T, from the polluted soil samples. With polyphasic taxonomic approaches, those strains were identified and classified into five novel species pertaining to the genera Agromyces and Salinibacterium of the family Microbacteriaceae and genera Novosphingobium, Sphingobium, and Sphingomonas of the family Sphingomonadaceae.
Soil samples were collected from an abandoned coking plant that operated for 60 years in Hangzhou City, Zhejiang Province, China. The sampling site is located near the center of the plant area and a mass of black and sticky contaminants was observed from the soil section of the sampling site. Five different soil types from the upper-30 cm layer were mixed to obtain one composite sample. The samples show a visibly black appearance and a crude oil smell. The climate of Hangzhou is a subtropical monsoon with four distinct seasons, which is warm and humid. Sampling was conducted in December 2020, when it was wintertime with the local temperature of 5–9°C. After collecting the soil samples, they were immediately stored in sterile PE bags and transported to the laboratory. The soil samples were analyzed for PAHs and heavy metals in the laboratory using HPLC and ICP-OES, and the results showed that the soil was severely polluted by PAHs with concentrations as high as 12,558.06±611.19 mg/kg and was slightly polluted by heavy metals (Yang et al., 2022).
Soils were suspended in a sterile phosphate buffer solution and shaken for 2 h to prepare the cell suspension. The cell suspensions after being diluted were spread onto agar plates and cultured in different conditions. To make M1 medium, the concentrations of K2HPO4 and MgSO4.7H2O were in accordance with that of R2A (Lee and Whang, 2020), while other components were diluted five times. The final pH was adjusted to 7.2 by adding K2HPO4 or KH2PO4. The medium was autoclaved for 30 min at 105°C. To make M2 medium, 200 μl of a PAH matrix was spread on the mineral salt medium (MSM) agar plates (Samsu et al., 2020). A mixed solution of benz(a)anthracene and benzo(a)pyrene dissolved in acetone (1 g/L, respectively) was used as the PAH matrix. The matrix was sterilized by a 0.22-μm sterile filter. Before spreading the cell suspension, the acetone was volatilized. To make M3 medium, the soil extract solution was added into M1 with 10% dosage and then autoclaved for 30 min at 105°C. The soil extract solution was prepared by the addition of 5.0 g soil into 150 ml distilled water, rotatory shaking at 150 rpm for 30 min, and then centrifuged to obtain supernatant. The agar plates were cultivated at room temperature (20–25°C) or 30°C. Colonies were picked up following their gradual appearance. Colonies were re-streaked on M1 agar plates until obtaining the pure strain.
The five bacterial strains were cultured in R2A medium to prepare the seed cultures for heavy metal resistance and aromatic compound metabolism experiments. The seed cultures were washed twice using sterile PBS. After sterilization, the R2A medium was supplemented with 0.5, 2.0, 5.0, and 10.0 mM sterilized sodium arsenite or 5, 20, 50, and 100 mg/L sterilized potassium dichromate. To each well of 96 microwell plates, 150 μl heavy metal-containing R2A medium and inoculated 5 μl washed cells was added. The 96 microwell plates were cultured at 30°C for 13 days, and OD600 was recorded at intervals using a microplate reader. The maximum increased OD600 from the initial values of each well was picked out to determine the growth of bacteria. In aromatic compound metabolism experiments, 100 mg/L of 2,5-dihydroxybenzoic acid, 4-hydroxybenzoic acid, protocatechuic acid, salicylic acid, phthalic acid, benzoic acid, naphthalene, or phenanthrene were added into MSM medium, respectively. Each well of 96 microwell plates was infused with 150 μl MSM medium and inoculated with 5 μl washed cells. The 96 microwell plates were cultured at 30°C for 30 days. OD600 was recorded at intervals using a microplate reader. All the tests were carried out in duplicate.
To examine the PAH-degrading ability of isolates, phenanthrene (200 mg/L) or naphthalene (200 mg/L) accompanied with or without heavy metals was added into 5 ml MSM medium, respectively. The heavy metal was 0.5 mM sodium arsenite or 5 mg/L of potassium dichromate. PAH degradation was tested in the presence of arsenite or dichromate. Bacterial cells were washed and inoculated into the medium at 2% (v/v) and incubated for 3 days for naphthalene degradation and 10 days for phenanthrene degradation. At the end of cultivation, the residual PAHs were extracted using dichloromethane and detected by HPLC (Sakshi et al., 2022; Yang et al., 2022). The tubes without inoculation were set as control. The reduction of PAH content compared with control was calculated to determine the degradation percent. All the degradation tests were carried out in triplicates.
Morphology of bacterial colony was observed after aerobically culturing on R2A agar plates at 30°C for 2–5 days. The single-cell morphology was observed by transmission electron microscopy (JEM-1400, Joel). The metabolic profiling of the carbon source was investigated using BiologTM GEN III microplate systems according to the manufacturer protocol, which contained 71 different carbon source utilization assays and 23 chemical sensitivity assays. To make significative comparisons, the cell biomass for fatty acid identification of each bacterial strain was cultured in the corresponding medium reported for their reference type strains. H39-3-25T was cultured in R2A medium. H3M29-4T was cultured in a marine agar medium (Han et al., 2003). H39-1-10T was cultured in an NA medium (Singh et al., 2015). H3SJ31-1T and H3Y2-19aT were cultured in TSA medium (Gupta et al., 2009). Cells were harvested during the exponential growth phase. Cellular fatty acids were then extracted, methylated according to the standard MIDI protocol (Sherlock Microbial Identification System, version 6.0), and analyzed with a gas chromatograph (HP 6890 Series GC System, Agilent) (Sasser, 1990). Polar lipids were separated by two-dimensional thin-layer chromatography on silica TLC plates (10 × 10cm; Merck), for which chloroform/methanol/water (65:25:4, in volume) and chloroform/methanol/acetic acid/water (80:12:15:4, in volume) were used as the first- and second-dimensional spreading agents, respectively (Minnikin et al., 1984). After separation, the polar lipids were detected by spraying reagents as follows: 10% ethanolic molybdophosphoric acid for total lipids, 0.4% ninhydrin solution in butanol for aminolipids, 1.3% molybdenum blue spray reagent for phospholipids, and 0.5% α-naphthol sulfuric acid reagent for glycolipids.
The complete 16S rRNA genes were amplified using the universal primers 27F (5′- AGAGTTTGATCCTGGCTCAG−3′) and 1492R (5′- GGTTACCTTGTTACGACTT-3′) (Soergel et al., 2012). The gene similarities to previously reported type strains were determined using the EzBioCloud server (Yoon et al., 2017). The 16S rRNA gene sequences of type strains were downloaded from the EzBioCloud server and aligned using CLUSTAL W (Thompson et al., 1994). Phylogenetic trees were constructed using MEGA 11 software based on the neighbor-joining (NJ) method according to Kimura's two-parameter model (Kimura, 1980), maximum-likelihood (ML) method based on the Tamura–Nei model (Tamura and Nei, 1993), and maximum-parsimony (MP) algorithms based on the Subtree-Pruning-Regrafting (SPR) search method (Fitch, 1971). The statistical reliability of these trees was conducted using bootstrap analysis with 1,000 replications (Felsenstein, 1985).
Genomic DNA was extracted using commercial TIANamp bacteria DNA kits and sequenced on an Illumina Hiseq X-ten platform. After quality control, the reads were assembled with multiple assemblers to obtain the best assembly, and the predicted genes were annotated using DIAMOND software by referring to databases (including KEGG, COG, NR, SwissProt, and Pfam), as described in the Global Catalog of Type Strain (gcType) Platform Manual v2 (https://gctype.wdcm.org/manual.jsp#detail). The RAST annotation engine (http://rast.nmpdr.org/) was also used to annotate genes. To assess the genome-based phylogeny, whole-genome-based phylogenomic trees were constructed using the up-to-date bacterial core genes (UBCGs) set pipeline (www.ezbiocloud.net/tools/ubcg) (Na et al., 2018). Average nucleotide identity (ANI) values and digital DNA–DNA hybridization (dDDH) were calculated using the ANI calculator (https://www.ezbiocloud.net/tools/orthoani) and Genome-to-Genome Distance Calculator 3.0 (GGDC; https://ggdc.dsmz.de/ggdc.php#) along with UPGMA dendrogram (unweighted pair group method with arithmetic mean) (Meier-Kolthoff et al., 2013; Lee et al., 2016). The DNA G+C contents were also determined by GGDC 3.0. Genome analysis by Check M showed that the genomes of all strains were not contaminated (Parks et al., 2015).
For comparative genome and genomic synteny analyses, the nearest phylogenomic relatives to the five strains with available genome sequences were chosen, and their genomes were retrieved from the NCBI database. The coding sequences of the genomes were predicted using GeneMarkS and Glimmer 3.02 software (http://ccb.jhu.edu/software/glimmer/index.shtml). The comparison of orthologous gene clusters was carried out using OrthoVenn2 software (https://orthovenn2.bioin fotoolkits.net/home). The genomic synteny analyses were carried out using MUMmer software by Promer way and visualized in a dot plot (Kurtz et al., 2004). Syntenic blocks of DNA sequence were analyzed using Mauve software (Darling et al., 2004). The KEGG pathways were predicted through the KEGG automatic annotation server (KAAS), and the richness of functional genes based on KEGG pathway level 3 was visualized in a heatmap. The distribution of homologous gene clusters was displayed using the Bioplot module of Chiplot (https://www.chiplot.online/).
All the assigned type strains in this study were deposited at the China General Microbiological Culture Collection Center (CGMCC). The accession numbers of these strains are provided in the section of the species description.
Five bacterial strains, namely, H3Y2-19aT, H3M29-4T, H39-1-10T, H39-3-25T, and H3SJ31-1T, that were phylogenetically related to previously known and validly nominated species of the families Microbacteriaceae and Sphingomonadaceae (16S rRNA gene sequence identities ranging from 97.22% to 98.36%) were obtained. Specifically, H3Y2-19aT was close to Agromyces marinus H23-8T (97.22%), H3M29-4T was close to Salinibacterium hongtaonis 194T (97.51%), H39-1-10T was close to Sphingomonas panacis DCY99T (98.36%), H39-3-25T was close to Sphingobium aquiterrae SKLS-A10T (97.95%), and H3SJ31-1T was close to Novosphingobium mathurense SM117T (97.53%). Strains H3Y2-19aT and H3M29-4T were obtained from M1 agar plates after cultivating at 30°C and room temperature, respectively. Strains H39-1-10T and H39-3-25T were obtained from M2 agar plates after cultivating both at room temperature. H3SJ31-1T was obtained from M3 agar plates after cultivating at room temperature. All strains grew on R2A agar plates and generated visible colonies in 2–3 days. The cells of H3M29-4T, H39-3-25T, H39-1-10T, and H3Y2-19aT were rod, and H3SJ31-1T was ovoid-shaped. Cells of H3SJ31-1T and H39-3-25T showed polar flagella (Figure 1).
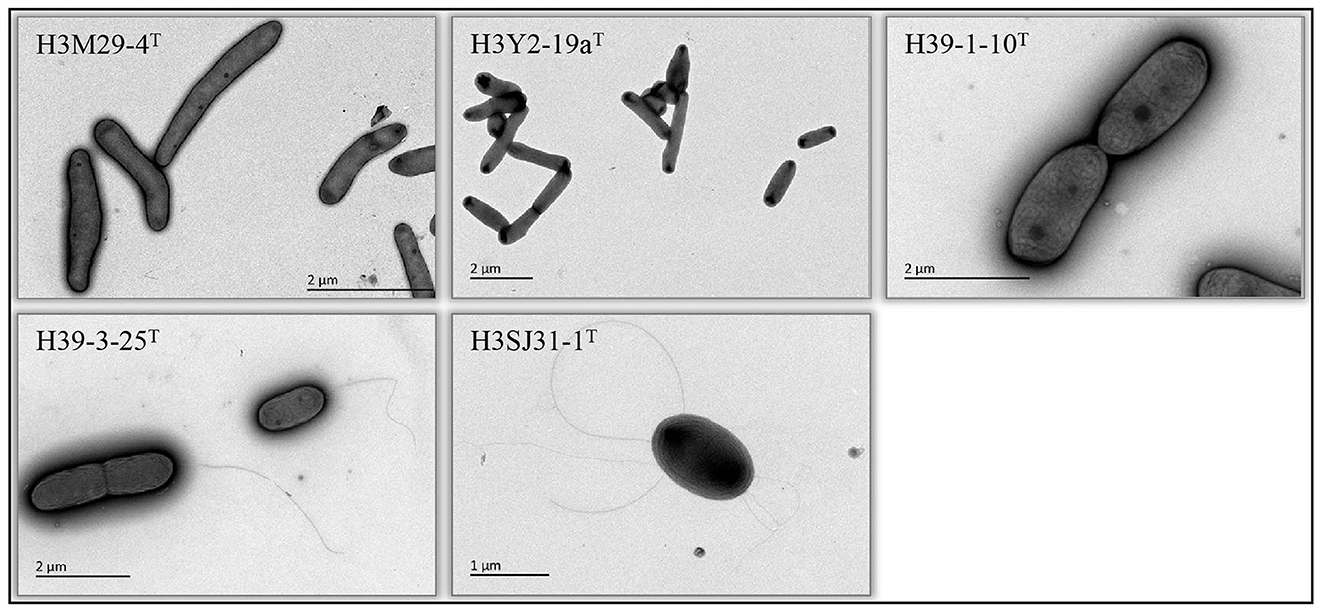
Figure 1. Cellular morphology (transmission electron microscopy) of the five bacteria isolated from polluted soil. The names of each bacterium and the scale bars of cellular size are shown in the pictures.
The genomes of the five strains were sequenced and annotated. The genome sizes and annotated gene numbers are provided in Tables 1, 2. Interpretation of genome annotation and their physiology such as carbon source assimilation, resistances to heavy metals and chemicals, and biodegradation of aromatic compounds are described in the following paragraphs. The genomic DNA G+C molar contents of H3Y2-19aT, H3M29-4T, H39-1-10T, H39-3-25T, and H3SJ31-1T were 71.22, 69.07, 66.15, 63.57, and 66.16 mol%, respectively.
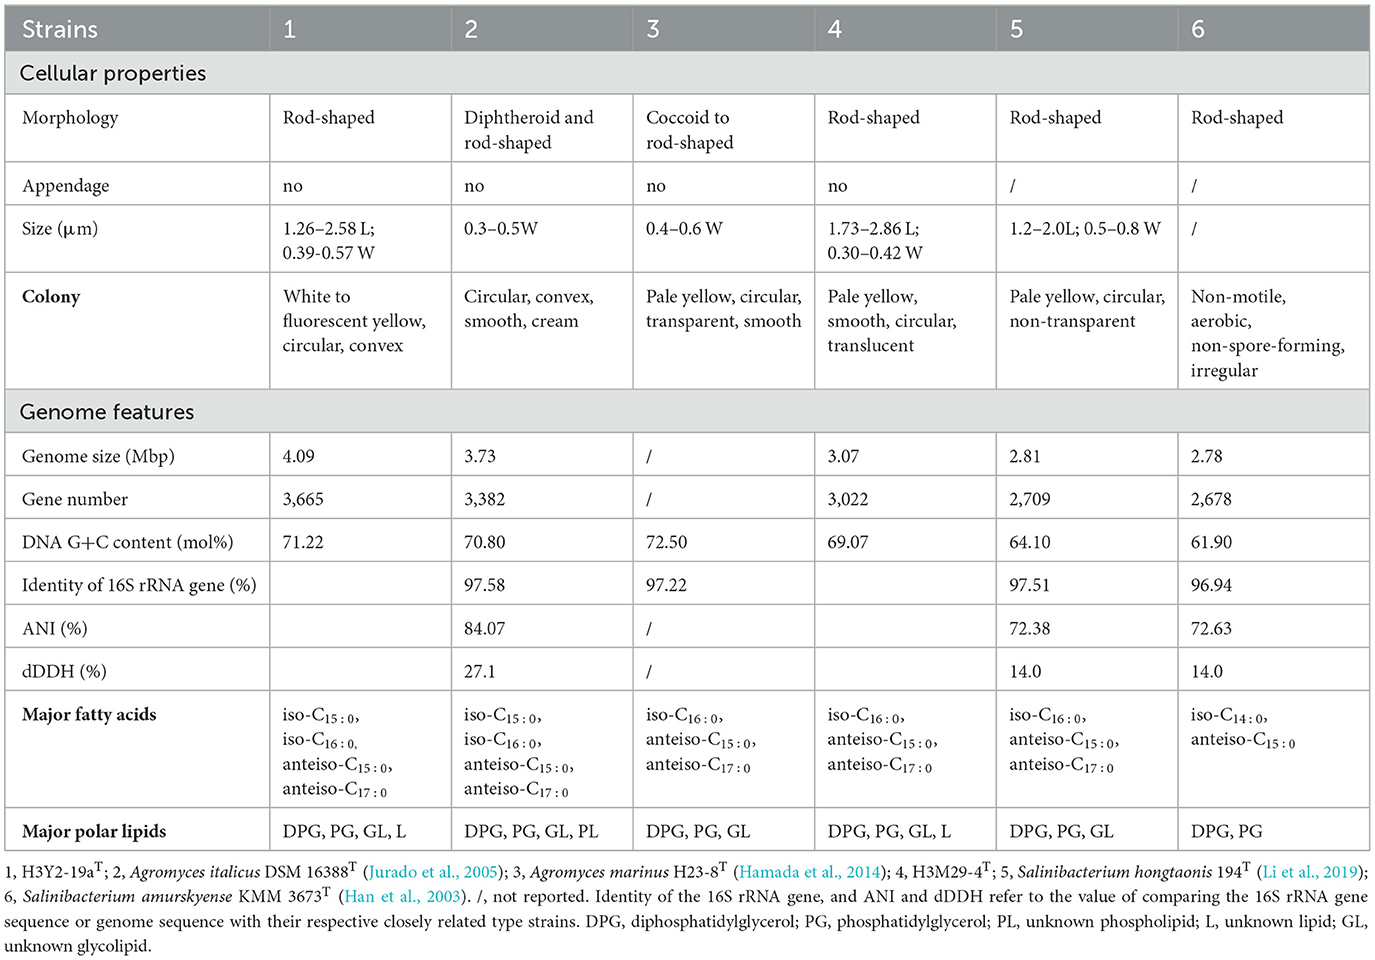
Table 1. Phenotypic, chemotaxonomic, and genomic features of two novel species of Microbacteriaceae, and differentiation to their closely related species.
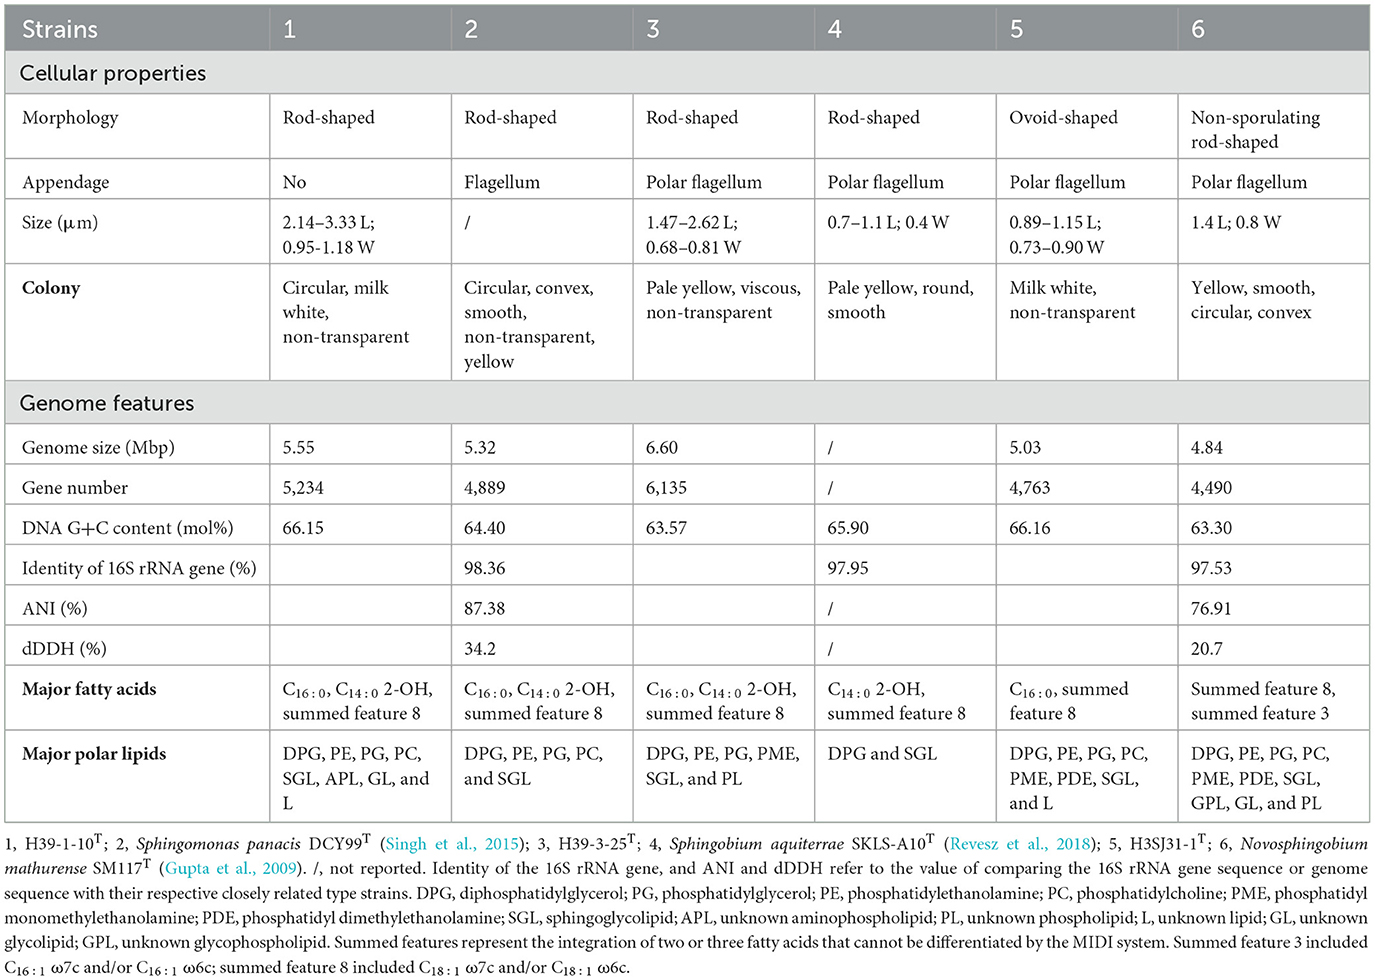
Table 2. Phenotypic, chemotaxonomic, and genomic features of three novel species of Sphingomonadaceae, and differentiation to their closely related species.
The results of 71 carbon source assimilation and 23 chemical sensitivity assays on BiologTM GEN III microplates are shown in Figure 2. H3Y2-19aT, H39-3-25T, H3M29-4T, and H39-1-10T showed similar metabolic profiles to monosaccharides (α-D-glucose, D-mannose, D-fructose, D-galactose, L-fucose, and L-rhamnose), disaccharides (D-maltose, D-trehalose, D-cellobiose, sucrose, and D-turanose), and oligosaccharides (dextrin). Among the five bacteria, H39-3-25T exhibited the most potent metabolic ability of carbon sources and utilized a total of 44 carbon sources. H3Y2-19aT, H3M29-4T, and H39-1-10T utilized 29, 20, and 26 carbon sources, respectively. By contrast, H3SJ31-1T could only utilize eight carbon sources. Particularly, H3SJ31-1T could not metabolize saccharides. This was in accordance with the genome annotation results that H3Y2-19aT, H39-3-25T, H3M29-4T, and H39-1-10T possessed 71, 43, 33, and 76 genes for metabolizing monosaccharides, disaccharides, and oligosaccharides, respectively, while H3SJ31-1T possessed only 7 related genes, as shown in Supplementary Table S1.
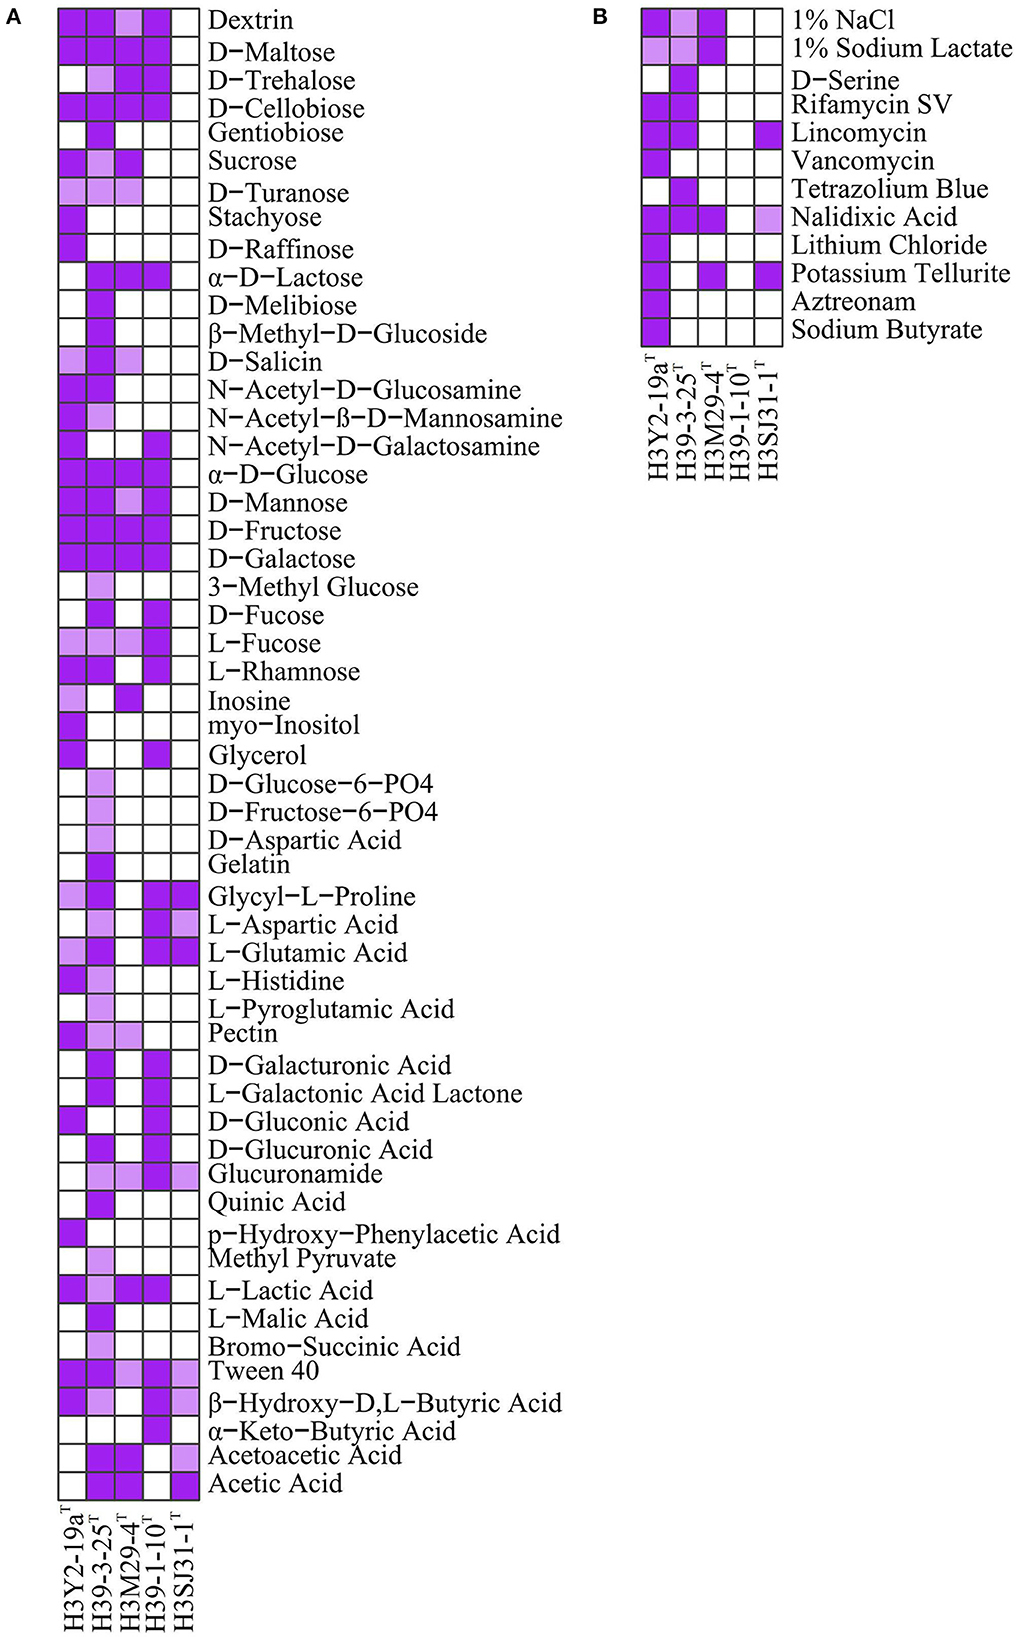
Figure 2. Assimilation of carbon sources (A) and responses to chemical sensitivity assays (B) of the five strains on BiologTM GEN III microplates. Deep purple indicates strong positive, light purple indicates weak positive, and white indicates negative. All strains had no growth on the carbon sources of N-acetyl neuraminic acid, D-sorbitol, D-mannitol, D-arabitol, D-serine, L-alanine, L-arginine, L-serine, mucic acid, D-saccharic acid, D-lactic acid methyl ester, citric acid, α-keto-glutaric acid, D-malic acid, γ-amino-butryric acid, α-hydroxy-butyric acid, propionic acid, and formic acid and was negative to 4% NaCl, 8% NaCl, fusidic acid, troleandomycin, minocycline, guanidine HCl, niaproof 4, tetrazolium violet, and sodium bromate at pH 5.0. All strains showed positive to Tween 40 and pH 6.0.
The overall results from chemical sensitivity assays showed that strains H3M29-4T, H39-1-10T, and H3SJ31-1T were more sensitive to chemical agents than H3Y2-19aT and H39-3-25T. In the 23 chemical agents, H3M29-4T was sensitive to 18 agents, and tolerated pH 6.0, 1% NaCl, 1% sodium lactate, nalidixic acid and potassium tellurite. It did not show growth at the conditions of pH lower than 5.0, and sodium chloride higher than 4%. H3SJ31-1T was sensitive to 19 agents, and tolerated pH 6.0, lincomycin, nalidixic acid and potassium tellurite. It did not show growth at the condition of pH lower than 5.0. H39-1-10T was sensitive to 22 agents. By contrast, H3Y2-19aT showed the strongest tolerance (resisting 11 chemical agents). According to genome annotation, all bacteria had genes for resistance to fluoroquinolones (Supplementary Table S1), and H3Y2-19aT, H39-3-25T, H3M29-4T, and H3SJ31-1T showed growth in nalidixic acid. Genes encoding for β-lactamase (Bonomo, 2017) were annotated in the genomes of H39-1-10T, H39-3-25T, and H3SJ31-1T, but they did not show experimentally resistance to aztreonam. H3Y2-19aT was annotated two genes for encoding multidrug resistance efflux pumps (Alibert et al., 2017) and showed resistance to five antibiotics, namely, rifamycin SV, lincomycin, vancomycin, nalidixic acid, and aztreonam. Unexpectedly, strain H39-1-10T was annotated by nine genes of multidrug resistance efflux pumps, but it did not resist any antibiotics tested with the BiologTM GEN III microplate.
Major cellular fatty acids and polar lipids of the five bacteria are summarized in Tables 1, 2, and detailed results are provided in Supplementary Tables S2, S3 and Supplementary Figure S1. Taking 10% as the cutoff value for predominant cellular fatty acids, strain H3Y2-19aT had iso-C15:0, iso-C16:0, anteiso-C15:0, and anteiso-C17:0, strain H3M29-4T had iso-C16:0, anteiso-C15:0, and anteiso-C17:0, strains H39-1-10T and H39-3-25T had C16:0, C14:0 2-OH, and summed feature 8 (C18:1 ω7c and/or C18:1 ω6c), and strain H3SJ31-1T had C16:0 and summed feature 8 as the major fatty acids. Polar lipid profiles showed that all five bacteria had diphosphatidylglycerol and phosphatidylglycerol but were different in the presence or absence of phosphatidylethanolamine, phosphatidylcholine, sphingoglycolipid, aminophospholipid, phosphatidyl monomethylethanolamine, phosphatidyl dimethylethanolamine, unknown phospholipids, unknown glycolipids, and unknown lipids.
As the five strains were isolated from heavy metals and/or PAH-polluted soil samples, we tested their abilities to resist heavy metals and degrade PAHs. The results showed that strains H39-3-25T, H39-1-10T, and H3M29-4T also displayed arsenite resistance, and H39-3-25T and H3M29-4T displayed dichromate resistance (Table 3). The strain H3Y2-19aT was the most resistant one and tolerated up to 10 mM of arsenite and 100 mg/L of potassium dichromate. We observed that strain H3SJ31-1T did not show any growth in the presence of arsenite or dichromate. The genome annotations indicated that strain H39-1-10T possessed the gene homologs to arsB (Kaur et al., 2011), chrB, and chrR (Ackerley et al., 2004; He et al., 2018), which played the roles of arsenite and dichromate resistance, respectively (Supplementary Table S4). Surprisingly, we did not identify any homologs to known chromium resistance genes from the most tolerant H3Y2-19aT. Agromyces was detected as an abundant member in the rhizosphere microbial community and was positively related to Zn and Cd accumulation in plants growing in polluted soils (De Maria et al., 2011). The arsenite and dichromate-resistant strain H3Y2-19aT, which was a potential new species of Agromyces, would expand its bioresources and would be beneficial for the phytoremediation of heavy metals.
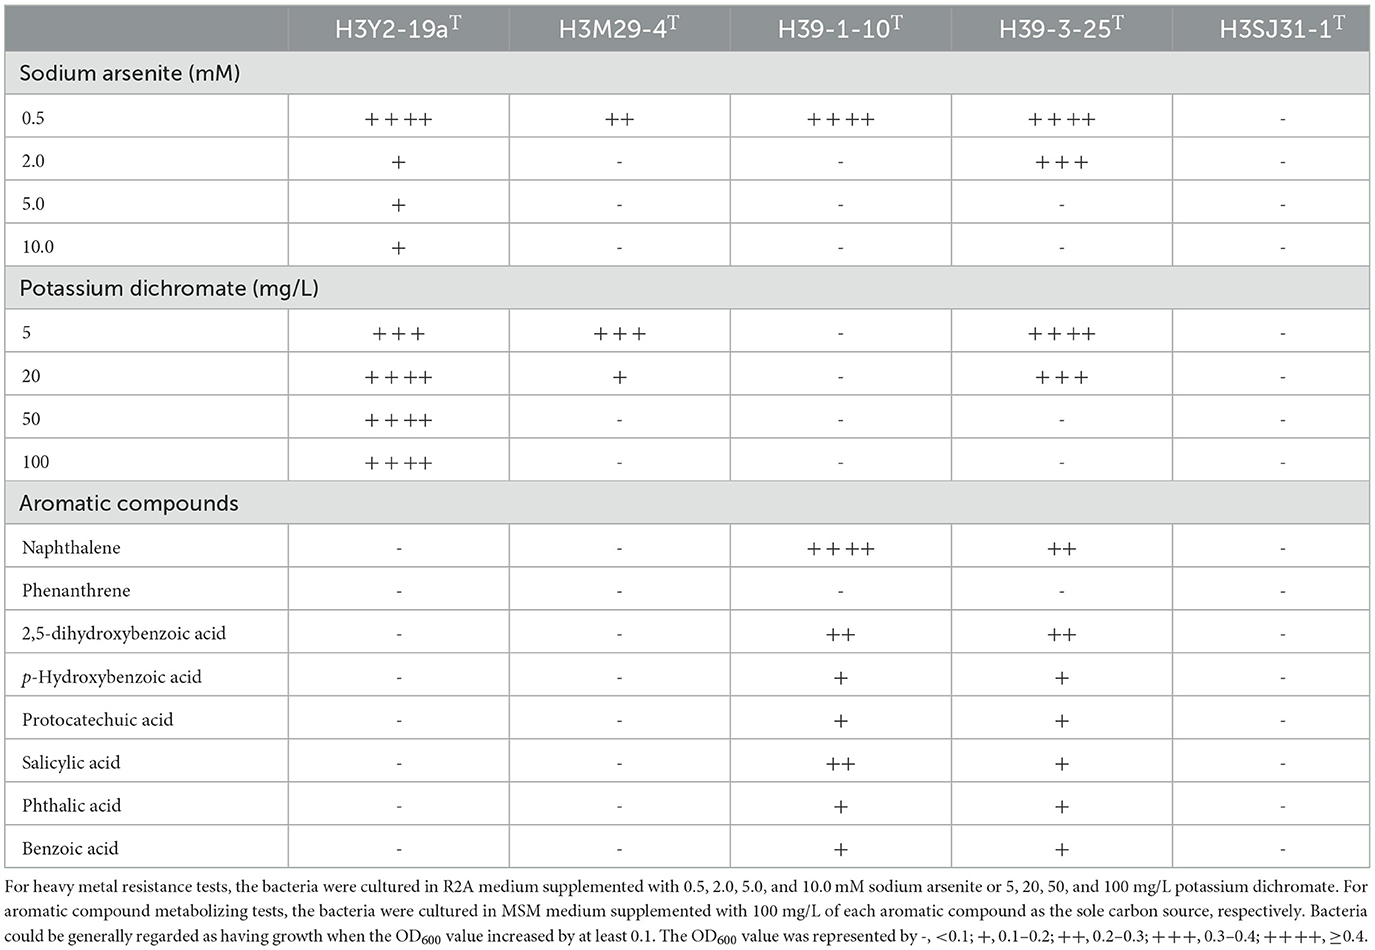
Table 3. Characteristics of heavy metal resistance and aromatic compound metabolization of the five novel species.
Although originated from polluted soil samples, strains H3Y2-19aT, H3SJ31-1T, and H3M29-4T could not use any of the tested aromatic compounds. Strains H39-1-10T and H39-3-25T showed observable growth as the sole carbon source using naphthalene, 2,5-dihydroxybenzoic, p-hydroxybenzoic, protocatechuic, salicylic, phthalic, and benzoic acids, and they were further tested for degradation of naphthalene in the presence of arsenite or dichromate (Figure 3). The results showed that H39-1-10T could catabolize 80.2% of naphthalene in the presence of 0.5mM arsenite, and H39-3-25T eliminated more than 92% of naphthalene, regardless of adding heavy metals or not. According to the genome annotation (Supplementary Table S4), H39-1-10T and H39-3-25T were annotated naphthalene 1,2-dioxygenase (Selifonov et al., 1996), which is the critical enzyme for the first catalytic reaction step of degrading PAHs. The genotypes of H39-1-10T and H39-3-25T agreed with the growth phenotype of utilizing naphthalene as a carbon source. H39-1-10T and H39-3-25T were later identified as species of Sphingomonas and Sphingobium that are well known for pollutant degraders (Ghosal et al., 2016).
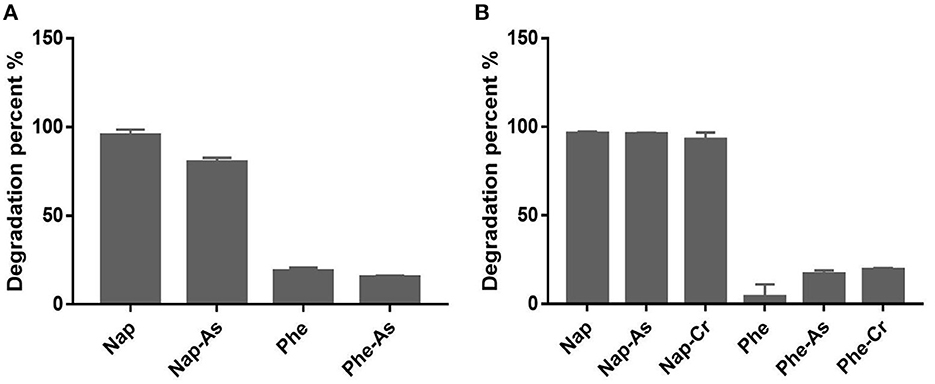
Figure 3. Degradation of naphthalene and phenanthrene by H39-1-10T (A) and H39-3-25T (B) in the presence or absence of heavy metals. Nap, naphthalene; Phe, phenanthrene; Nap-As and Phe-As mean the medium for PAH degradation was added 0.5 mM sodium arsenite; Nap-Cr and Phe-Cr indicate that the medium for PAH degradation was added 5 mg/L potassium dichromate.
The comparative genomic analyses were carried out to reveal the genomic synteny and diversity between the five strains and their relatives. The nearest phylogenomic type strain neighbors, namely, Agromyces italicus DSM 16388T to H3Y2-19aT, Salinibacterium hongtaonis 194T to H3M29-4T, Sphingomonas panacis DCY99T to H39-1-10T, Sphingobium psychrophilum AR-3-1T to H39-3-25T, and Novosphingobium aquimarinum M24A2MT to H3SJ31-1T, which were isolated from catacombs, feces of Tibetan antelopes, rhizosphere, Arctic soil, and seawater samples, respectively, were chosen for comparative genomic analysis. Through comparative analysis of the orthologous relationship of predicted protein-coding genes, we found remarkable gene overlaps among these investigated strains' genomes (Figure 4A). At the level of protein sequence, analysis using OrthoVenn2 revealed that there are 2667, 1565, 3298, 2935, and 2399 orthologous clusters shared by H3Y2-19aT, H3M29-4T, H39-1-10T, H39-3-25T, and H3SJ31-1T compared to their relatives, respectively. All the five strains in this study possess more unique orthologous clusters than their relatives. Among the unique clusters of the five studied strains, the annotated known genes account for 46.2%–75.0% (data not shown). Thus, there are still many unknown protein-coding genes in their genomes that need to be explored. From the dot plot of genomic synteny analysis based on protein sequences, we observed the syntenic regions of DNA sequence shared by the studied strains and their respective relatives (Figure 4C). The overall results showed that H3Y2-19aT, H3M29-4T, and H39-1-10T shared more syntenic blocks (12, 13, and 9 for each) with their respective relatives than H39-3-25T and H3SJ31-1T. Although H39-3-25T has a much more analogous sequence with Spm. panacis DCY99T, no remarkable syntenic blocks were observed. The observations are also supported by the synteny analysis using Mauve software based on DNA sequences, as shown in Supplementary Figure S2. The results suggest that the level of genomic synteny for H3Y2-19aT, H3M29-4T, and H39-1-10T with their respective relatives is much higher than that for H39-3-25T and H3SJ31-1T. The fact that the majority of the genome regions of H39-3-25T and H3SJ31-1T were not in syntenic blocks suggests that dramatic gene rearrangements occurred in their genomes after they diverged from their most recent common ancestor. On the other hand, there are still extensive syntenic DNA sequence orders existing between them and their relatives. These syntenic and dislocated genes may be caused by selective aggregation under evolutionary pressures (Wan, 2019).
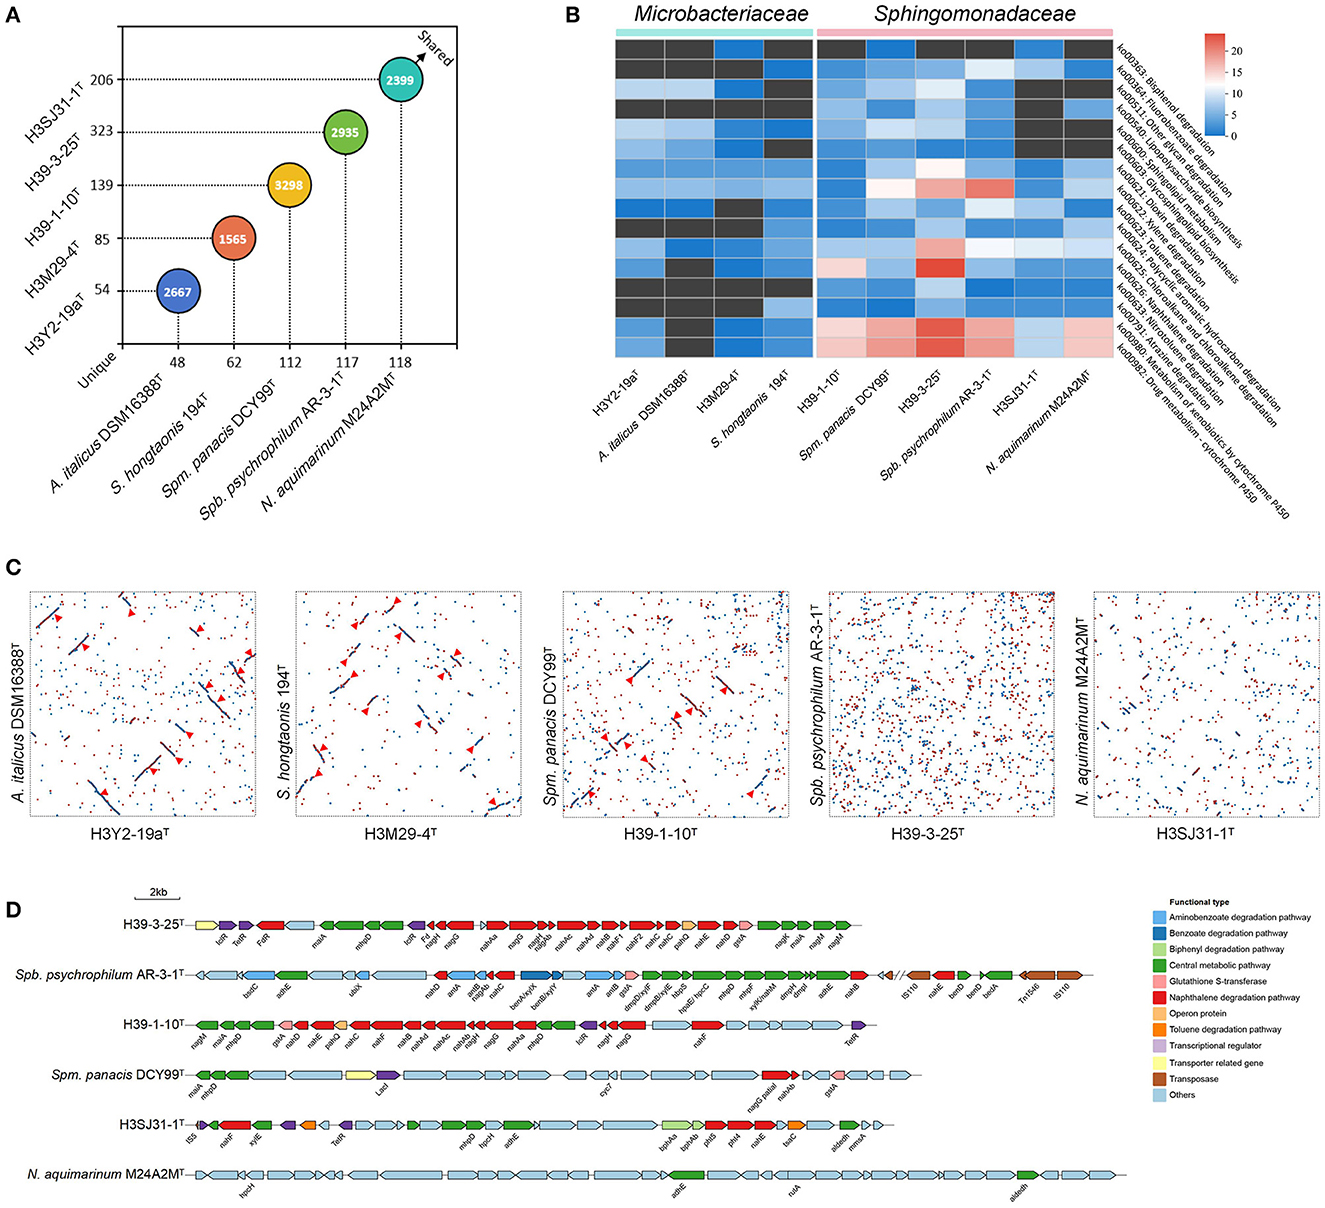
Figure 4. Analysis of orthologous genes and genomic synteny between the five strains and their nearest phylogenomic type strain neighbors. (A) The distribution of shared and unique orthologous gene clusters between the five queried strains (y-axis) and their respective reference strains (x-axis). The numbers on the axis indicate the unique orthologous clusters of each strain. The numbers in the circles indicate the shared orthologous clusters between two comparative strains. (B) The richness of functional genes related to the biodegradation and metabolism of xenobiotics based on the KEGG annotation in pathway level 3. The richness is illustrated by heatmap analysis. The color indicates the number of annotated genes. The pathway KO number and their functional descriptions are shown on the right side of the heatmap diagram. (C) The genomic synteny between the five queried strains (x-axis) and their respective reference strains (y-axis). The syntenic regions are displayed by the dot plot analysis using MUMmer software in a Promer way. Red dots represent forward synteny. Blue dots represent reverse synteny. The syntenic blocks are signed with a red triangle. (D) The functional gene clusters for metabolizing xenobiotics in the strains H39-1-10T, H39-3-25T, H3SJ31-1T, and their respective reference strains. The genes that perform roles in one pathway are shown with the same color. The arrows point in the direction of gene expression.
As the five strains were isolated from polluted soils, we further comparatively investigated the distribution of functional genes related to the degradation of xenobiotic pollutants between them and their relatives based on the KEGG annotation. The richness of annotated functional genes is shown in Figure 4B. The overall results showed that the bacterial species from the family Sphingomonadaceae represented by H39-1-10T, H39-3-25T, and H3SJ31-1T possess much more functional protein-coding genes than the species from the family Microbacteriaceae represented by H3Y2-19aT and H3M29-4T, such as genes in the pathways of ko00364, ko00623, ko00624, ko00625, ko00626, and ko00633 for the degradation of fluorobenzoate, toluene, PAHs, chloroalkane and chloroalkene, naphthalene, and nitrotoluene, respectively. These sphingomonads also have numerous genes encoding cytochrome P450 in the pathways of ko00980 and ko00982 to deal with other xenobiotics and drugs. The previous studies showed that strains of sphingomonads usually showed great contaminant-degrading efficiency (Waigi et al., 2015), and thus, they had been widely considered as excellent decomposers of pollutants (Ghosal et al., 2016). The results of this study agree with this opinion at the molecular level. Among the three sphingomonads, the studied species of the genera Sphingomonas and Sphingobium have more genes than Novosphingobium in the pathways of ko00540, ko00603, and ko00600 for lipopolysaccharide and glycosphingolipid biosynthesis and sphingolipid metabolism, which were probably responsible for producing surfactants such as rhamnolipid (Ma et al., 2018; Posada-Baquero et al., 2019), to accelerate the degradation of xenobiotics. The strain H39-1-10T has 15 genes in the ko00626 pathway responsible for naphthalene degradation. The strain H39-3-25T has the most functional genes in the pathways of ko00621 (13), ko00625 (18), ko00626 (24), ko00980 (23), and ko00982 (23) than other strains to degrade dioxin, chloroalkane and chloroalkene, naphthalene, other xenobiotics, and drugs, respectively. It also has 18 functional genes for xylene degradation. Moreover, to investigate the particular mechanism of pollutant degradation of these sphingomonads, specifically the pathway of naphthalene degradation, the functionally related gene clusters were drawn in Figure 4D. As can be observed, both the strains H39-3-25T and H39-1-10T have intact upstream metabolic pathway with the required genes nahA, nahB, nahC, nahD, nahE, and nahF progressively transforming naphthalene to salicylate. The salicylate was then transformed to gentisate using nagG and nagH and afterward entered the tyrosine metabolism pathway to be mineralized or assimilated. There are also some genes of the central metabolic pathway of PAHs existing around the gene cluster such as maiA, nagM, nagK, and mhpD. In contrast, their closest relatives Spm. panacis DCY99T and Spb. psychrophilum AR-3-1T all lack the intact metabolic pathway of naphthalene. Although Spb. psychrophilum AR-3-1T have some scattered genes such as nahB, nahC, nahD, and nahE, it is lack of the most critical gene nahA that encodes the naphthalene 1,2-dioxygenase for the first oxidation step of naphthalene degradation (Selifonov et al., 1996). Strain H3SJ31-1T only possesses nahE and nahF in the cluster that could not solely complete the degradation process of naphthalene, and no upstream metabolic pathway gene clusters were found in its closest relative N. aquimarinum M24A2MT. The interpretations of the comparative genome analysis are in agreement with the results of the phenotype test of naphthalene degradation, as described above. Compared with their respective closest relatives which were isolated from non-polluted samples, H39-1-10T and H39-3-25T evolve much more genes to construct the intact pathway of naphthalene degradation, suggesting that the genes for pollutants degradation were enriched in the heavy PAH-polluted soil environments.
Based on the 16S rRNA gene and genome sequences analysis, we further studied the phylogenetic relationships of each bacterial isolate with their closely related and validly nominated bacterial taxa, and the phylogenetic trees are shown in Figure 5. The UPGMA dendrogram trees based on the ANI scores of their genomes were generated and are shown in Figure 6. The dDDH values were calculated and are shown in Supplementary Tables S2, S3. According to the chemotaxonomic characteristics and the results from DNA molecule analysis, we proposed that H3Y2-19aT, H3M29-4T, H39-1-10T, H39-3-25T, and H3SJ31-1T represent novel species.
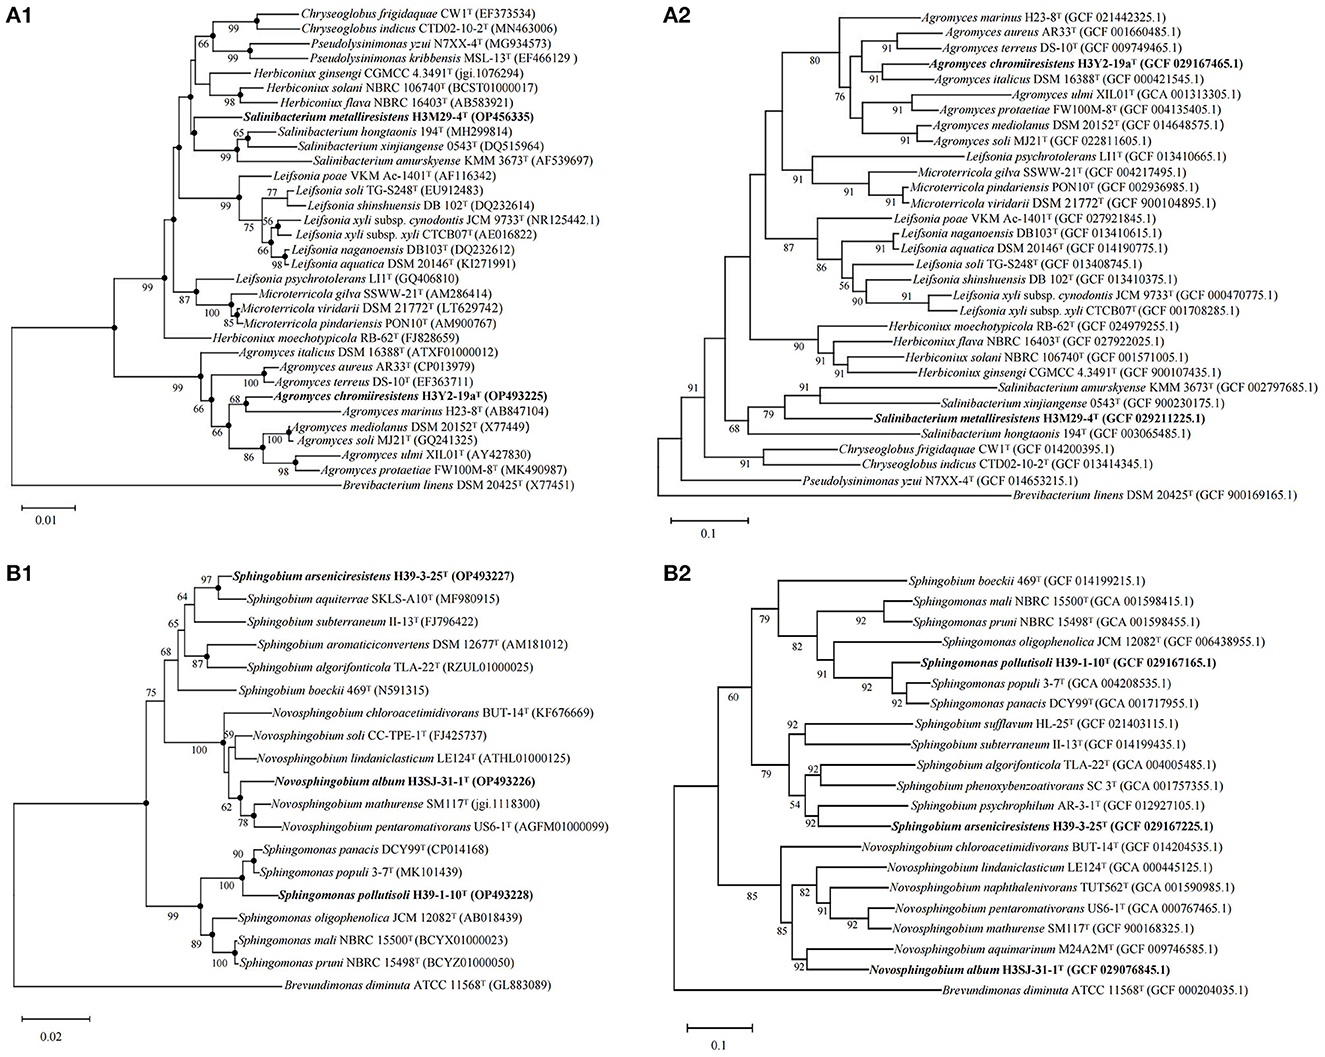
Figure 5. Phylogenetic and phylogenomic trees of the five bacteria constructed on the basis of the 16S rRNA gene sequences and whole genomes using the neighbor-joining algorithm showing the relationships of the five novel taxa to their closely related type bacterial strains. (A) The phylogenetic (A1) and phylogenomic (A2) trees of strains H3Y2-19aT, H3M29-4T, and their closely related species in the family Microbacteriaceae, and the sequence of Brevibacterium linens DSM 20425T (X77451) was used as an out-group; (B) the phylogenetic (B1) and phylogenomic (B2) trees of strains H39-1-10T, H39-3-25T, H3SJ-31-1T, and their closely related species in the family Sphingomonadaceae, and the sequence of Brevundimonas diminuta ATCC 11568T (GL883089) was used as an out-group. GenBank accession numbers are given in parentheses. Bootstrap percentages (>50%) based on 1,000 replicates are shown at the nodes. Phylogenetic trees based on the maximum-likelihood and the maximum-parsimony methods with 1,000 bootstraps were also reconstructed (see Supplementary Figure S3). The filled circles indicate the nodes supported by all three methods regardless of bootstrap percentages. Bar, 0.01 substitutions per nucleotide position for (A1); bar, 0.02 substitutions per nucleotide position for (B1); bar, 0.1 substitutions per nucleotide position for (A2, B2).
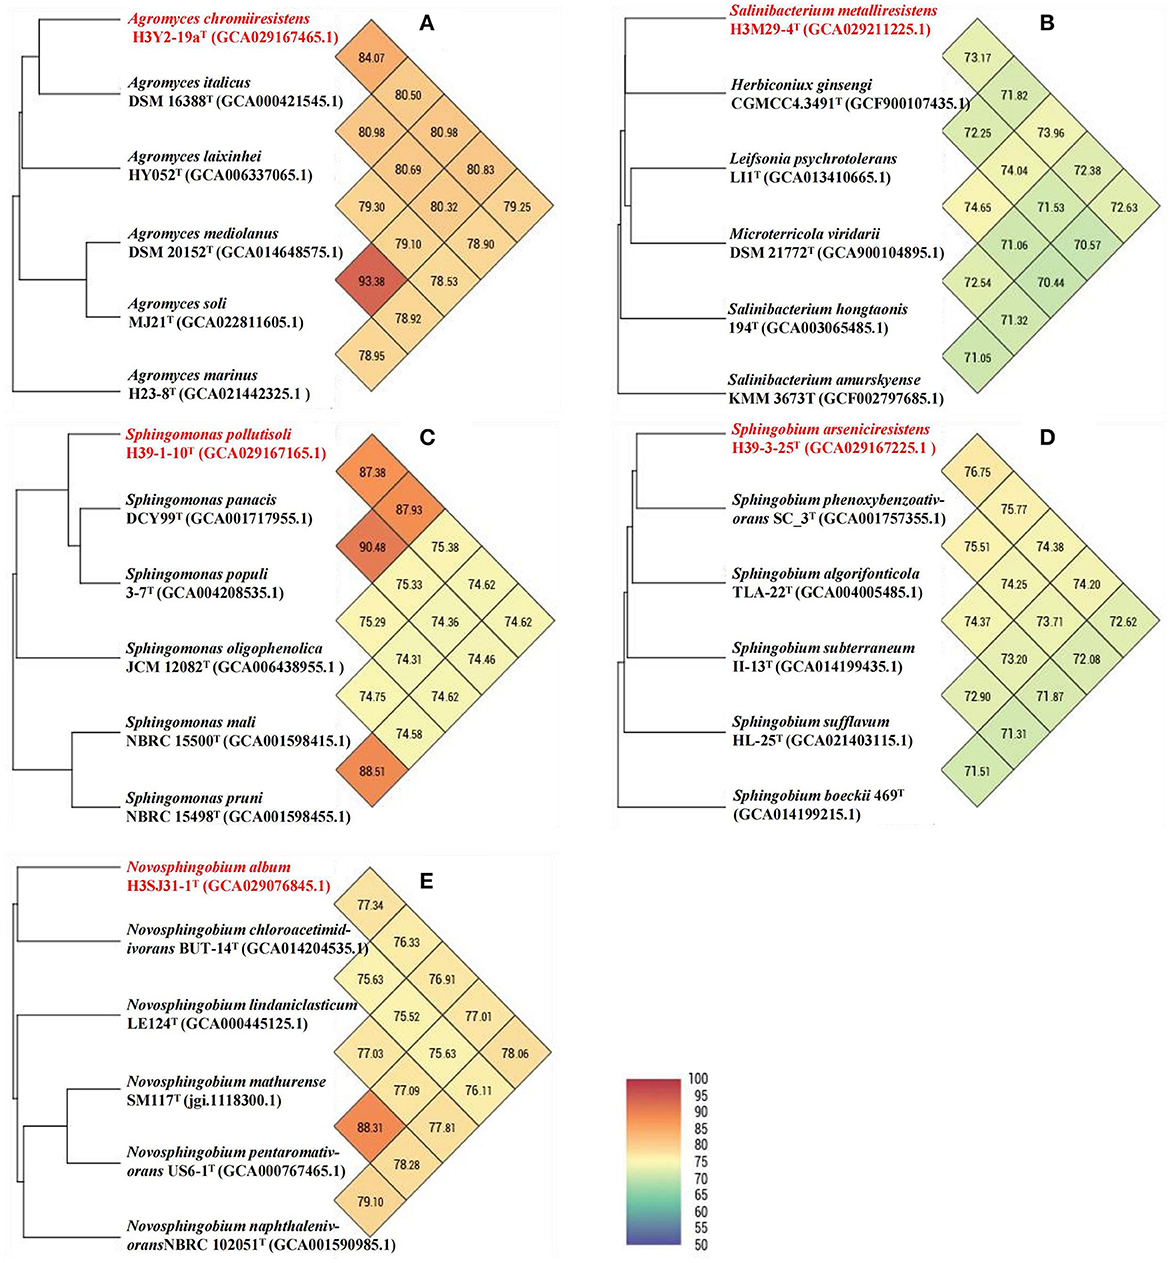
Figure 6. UPGMA phylogenetic trees and ANI heat maps based on whole genomes. Each of the UPGMA phylogenetic trees and the ANI heat maps displays the connections between a novel bacterial taxon and their respective close relatives: (A) H3Y2-19aT; (B) H3M29-4T; (C) H39-1-10T; (D) H39-3-25T; and (E) H3SJ31-1T. The novel taxon names proposed in this study are shown in red. GenBank accession numbers of the genomes are shown in parentheses.
The phylogenetic trees revealed that H3Y2-19aT clustered members of Agromyces genus (Figures 5A1, A2). The close relatives to H3Y2-19aT were A. italicus DSM 16388T (97.58%, 16S rRNA gene identity), A. marinus H23-8T (97.22%), A. mediolanus DSM 20152T (97.72%), and A. soli MJ21T (97.61%). The ANI and dDDH values between H3Y2-19aT and A. italicus DSM 16388T were 84.07% and 27.1 %, respectively (Table 1 and Figure 6A), which were all below the threshold for differentiating two species (ANI, 95% and dDDH, 70%; Goris et al., 2007; Richter and Rosselló-Móra, 2009). The major cellular fatty acids of H3Y2-19aT were iso-C15:0 (13.20%), iso-C16:0 (20.77%), anteiso-C15:0 (35.17%), and anteiso-C17:0 (23.34%) (Supplementary Table S2), which were consistent with the description of the genus Agromyces. H3Y2-19aT contained polar lipids of diphosphatidylglycerol, phosphatidylglycerol, and unknown glycolipids (Supplementary Figure S1). The DNA G+C content was 71.22 mol%, which is in the range (>70 mol%; Jurado et al., 2005) of the Agromyces genus (Supplementary Table S2). Based on the results of phylogenetic, phylogenomic, and phenotypic characterizations, we concluded that strain H3Y2-19aT represents a novel species affiliated to the genus Agromyces, and the name Agromyces chromiiresistens sp. nov. is proposed.
Agromyces chromiiresistens (chro.mi.i.re.sis.tens. N.L. neut. n. chromium, chromium (Cr); L. pres. part. resistens, resisting; N.L. part. adj. chromiiresistens, chromium resisting, denoting the type strain is chromium-resistant).
Cells are Gram-positive, aerobic, non-endospore-forming, and rods with a size of approximately 1.26–2.58 × 0.39–0.57 μm. Colonies grown on R2A agar plates are circular, convex, and white after cultivating for 2 days, and the color changes to fluorescent yellow as the cultivation prolongs. The cells metabolize dextrin, D-maltose, D-cellobiose, sucrose, stachyose, D-raffinose, N-acetyl-D-glucosamine, N-acetyl-β-D-mannosamine, α-D-glucose, D-mannose, N-acetyl-D-galactosamine, D-fructose, D-galactose, L-rhamnose, myo-inositol, glycerol, L-histidine, pectin, D-gluconic acid, p-hydroxy-phenylacetic acid, L-lactic acid, Tween 40, β-hydroxy-D, L-butyric acid, D-turanose, D-salicin, L-fucose, inosine, glycyl-L-proline, and L-glutamic acid. They grow at pH 6.0 but fail to grow when pH is lower than pH 5.0. The cells tolerate 1% NaCl but not 4–8% NaCl and tolerate 1% sodium lactate, rifamycin SV, lincomycin, vancomycin, nalidixic acid, lithium chloride, potassium tellurite, aztreonam, and sodium butyrate. They resist 0.5–10.0 mM sodium arsenite and 5–100 mg/L potassium. The major polar lipids are diphosphatidylglycerol, phosphatidylglycerol, unknown glycolipids, and unknown lipid. The genome size is 4.09 Mbp, and the DNA G+C content is 71.22 mol%.
The type strain is H3Y2-19aT (=CGMCC 1.61332T), isolated from a polluted soil sample. The GenBank accession numbers for the 16S rRNA gene sequence and genome sequence of the type strain are OP493225 and JARFNL000000000, respectively.
The phylogenetic trees revealed that H3M29-4T clustered members of Salinibacterium genus (Figures 5A1, A2). The close relatives to H3M29-4T were S. hongtaonis 194T (97.51 %, 16S rRNA gene identity), S. amurskyense KMM 3673T (96.94%), and S. xinjiangense 0543T (96.61%). The ANI and dDDH values between H3M29-4T and S. hongtaonis 194T were 72.38 and 14.0 %, respectively (Table 1 and Figure 6B), which were all below the threshold for differentiating two species. At the date of this description, three species of the Salinibacterium genus have been described. The major cellular fatty acids of H3M29-4T were anteiso-C15:0 (41.05%), iso-C16:0 (25.60%), and anteiso-C17:0 (27.46%) (Supplementary Table S2), which were consistent with the description of the genus Salinibacterium. H3M29-4T contained polar lipids of diphosphatidylglycerol, phosphatidylglycerol, unknown glycolipids, and unknown lipid (Supplementary Figure S1). The DNA G+C content was 69.07 mol%, which was consistent with other members of the Salinibacterium genus (Supplementary Table S2). Based on the results of phylogenetic, phylogenomic, and phenotypic characterizations, we concluded that strain H3M29-4T represents a novel species affiliated to the genus Salinibacterium, and thus the name Salinibacterium metalliresistens sp. nov. is proposed.
Salinibacterium metalliresistens (me.tal.li.re.sis'tens. L. neut. n. metallum, metal; L. pres. part. resistens, resisting; N.L. part. adj. metalliresistens, metal-resistant, referring to the ability of the bacterium to resist heavy metals).
Cells are Gram-positive, aerobic, and rods with a size of approximately 1.73–2.86 × 0.30–0.42 μm. Colonies grown on R2A agar plates are smooth, translucent, pale yellow, and circular after cultivating 3–4 days. The cells metabolize dextrin, D-maltose, D-trehalose, D-cellobiose, sucrose, D-turanose, α-D-lactose, D-salicin, α-D-glucose, D-mannose, D-fructose, D-galactose, L-fucose, inosine, pectin, glucuronamide, L-lactic acid, Tween 40, acetoacetic acid, and acetic acid. They grow at pH 6.0 but fail to grow when pH is lower than pH 5.0. The cells tolerate 1% NaCl but not 4-8% NaCl and tolerate 1% sodium lactate, nalidixic acid, and potassium tellurite. They resist 0.5 mM sodium arsenite and 5-20 mg/L potassium dichromate. The major cellular fatty acids are anteiso-C15:0, iso-C16:0, and anteiso-C17:0. The major polar lipids are diphosphatidylglycerol, phosphatidylglycerol, unknown glycolipids, and unknown lipid. The genome size is 3.07 Mbp, and the DNA G+C content is 69.07 mol%.
The type strain is H3M29-4T (=CGMCC 1.61335T), isolated from a polluted soil sample. The GenBank accession numbers for the 16S rRNA gene sequence and genome sequence of the type strain are OP456335 and JARGEM000000000, respectively.
The phylogenetic trees revealed that H39-1-10T clustered members of Sphingomonas genus (Figures 5B1, B2). The close relatives to H39-1-10T were Spm. panacis DCY99T (98.36%, 16S rRNA gene identity), Spm. populi 3-7T (97.61%), Spm. oligophenolica JCM 12082T (96.30%), and Spm. mali NBRC 15500T (96.36%). The ANI and dDDH values between H39-1-10T and Spm. panacis DCY99T were 87.38% and 34.2%, respectively (Table 2 and Figure 6C), which were all below the threshold for differentiating two species. At the date of this description, 152 species of the Sphingomonas genus have been described. The major cellular fatty acids of H39-1-10T were summed feature 8 (C18:1 ω7c/C18:1 ω6c, 51.19%), C14:0 2-OH (30.14%), and C16:0 (9.85%) (Supplementary Table S3), which were consistent with the description of the genus Sphingomonas. H39-1-10T contained polar lipids of diphosphatidylglycerol, phosphatidylglycerol, phosphatidylethanolamine, phosphatidylcholine, sphingoglycolipid, unknown aminophospholipid, unknown lipid, and unknown glycolipid (Supplementary Figure S1). The DNA G+C content was 66.15 mol%, which is in the range (62–68 mol%; Ohta et al., 2004) of the Sphingomonas genus (Supplementary Table S3). Based on the results of phylogenetic, phylogenomic, and phenotypic characterizations, we concluded that strain H39-1-10T represents a novel species affiliated to the genus Sphingomonas and the name Sphingomonas pollutisoli sp. nov. is proposed.
Sphingomonas pollutisoli (pol.lu.ti.so'li. L. masc. perf. part. pollutus, contaminated, soiled; L. neut. adj. solum, soil; N.L. gen. neut. n. pollutisoli, of polluted soil).
Cells are Gram-negative, aerobic, and rods with a size of approximately 2.14–3.33 × 0.95–1.18 μm. Colonies grown on R2A agar plates are circular, milk-white, and non-transparent. The cells metabolize dextrin, D-maltose, D-trehalose, D-cellobiose, α-D-lactose, α-D-glucose, D-mannose, N-acetyl-D-galactosamine, D-fructose, D-galactose, D-fucose, L-fucose, L-rhamnose, glycerol, glycyl-L-proline, L-aspartic acid, L-glutamic acid, D-galacturonic acid, L-galactonic acid lactone, D-gluconic acid, D-glucuronic acid, glucuronamide, L-lactic acid, Tween 40, β-hydroxy-D, L-butyric acid, α-keto-butyric acid, 2,5-dihydroxybenzoic acid, p-hydroxybenzoic acid, protocatechuic acid, salicylic acid, phthalic acid, and benzoic acid. They grow at pH 6.0 but fail to grow when pH is lower than pH 5.0. The cells do not tolerate 1–8% NaCl but resist 0.5 mM sodium arsenite. They degrade naphthalene even in the presence of sodium arsenite. The major cellular fatty acids are sphingoglycolipid, diphosphatidylglycerol, phosphatidylethanolamine, phosphatidylglycerol, phosphatidylcholine, unknown glycolipids, unknown aminophospholipid, and unknown lipids. The major fatty acids are C16:0, summed feature 8 (C18:1 ω7c/C18:1 ω6c), and C14:0 2-OH. The genome size is 5.55 Mbp, and DNA G+C content is 66.15 mol%.
The type strain is H39-1-10T (=CGMCC 1.61325T), isolated from a polluted soil sample. The GenBank accession numbers for the 16S rRNA gene sequence and genome sequence of the type strain are OP493228 and JARFNJ000000000, respectively.
The phylogenetic trees revealed that H39-3-25T clustered members of Sphingobium genus (Figures 5B1, B2). The close relatives to H39-3-25T were Spb. aquiterrae SKLS-A10T (97.95%, 16S rRNA gene identity), Spb. aromaticiconvertens DSM 12677T (97.15%), Spb. algorifonticola TLA-22T (96.86%), and Spb. subterraneum II-13T (96.64%). The ANI and dDDH values between H39-3-25T and Spb. algorifonticola TLA-22T were 74.38 and 20.8%, respectively (Table 2 and Figure 6D), which were all below the threshold for differentiating two species. At the date of this description, 44 species of the Sphingobium genus have been described. The major cellular fatty acids of H39-3-25T were summed feature 8 (C18:1 ω7c/C18:1 ω6c, 50.50%), C14:0 2-OH (15.94%), and C16:0 (10.80%) (Supplementary Table S3), which were consistent with the description of the genus Sphingobium. H39-3-25T contained polar lipids of diphosphatidylglycerol, phosphatidylethanolamine, phosphatidylglycerol, phosphatidyl monomethylethanolamine, sphingoglycolipid, and unknown phospholipids (Supplementary Figure S1). The DNA G+C content was 63.57 mol%, which is in the range (62–67 mol%; Lee et al., 2015) of the Sphingobium genus (Supplementary Table S3). Based on the results of phylogenetic, phylogenomic, and phenotypic characterizations, we concluded that strain H39-3-25T represents a novel species affiliated to the genus Sphingobium and the name Sphingobium arseniciresistens sp. nov. is proposed.
Sphingobium arseniciresistens (ar.se.ni.ci.re.sis'tens. N.L. neut. adj. arsenicum, arsenic; L. pres. part. resistens, resisting; N.L. part. adj. arseniciresistens, arsenic resisting, referring to the arsenic resistance of the bacterium).
Cells are Gram-negative, aerobic, motile by means of polar flagellum, and rods with a size of approximately 1.47–2.62 × 0.68–0.81 μm. Colonies grown on R2A agar plates are pale yellow, viscous, and non-transparent. The cells metabolize dextrin, D-maltose, D-cellobiose, gentiobiose, α-D-lactose, D-melibiose, β-methyl-D-glucoside, D-salicin, N-acetyl-D-glucosamine, α-D-glucose, D-mannose, D-fructose, D-galactose, D-fucose, L-rhamnose, gelatin, glycyl-L-proline, L-glutamic acid, D-galacturonic acid, L-galactonic acid lactone, D-glucuronic acid, quinic acid, L-malic acid, Tween 40, acetoacetic acid, acetic acid, D-trehalose, sucrose, D-turanose, N-acetyl-β-D-mannosamine, 3-methyl glucose, L-fucose, D-glucose-6-PO4, D-fructose-6-PO4, D-aspartic acid, L-aspartic acid, L-histidine, L-pyroglutamic acid, pectin, glucuronamide, methyl pyruvate, L-lactic acid, bromo-succinic acid, β-hydroxy-D, L-butyric acid, 2,5-dihydroxybenzoic acid, p-hydroxybenzoic acid, protocatechuic acid, salicylic acid, phthalic acid, and benzoic acid. They grow at pH 6.0 but fail to grow when pH is lower than pH 5.0. The cells tolerate 1% NaCl but not 4–8% NaCl and tolerate 1% sodium lactate, D-serine, rifamycin SV, lincomycin, tetrazolium blue, and nalidixic acid. They resist 0.5–2.0 mM sodium arsenite and 5–20 mg/L potassium dichromate. The cells degrade naphthalene even in the presence of sodium arsenite or potassium dichromate. The major polar lipids are sphingoglycolipid, diphosphatidylglycerol, phosphatidylethanolamine, phosphatidylglycerol, phosphatidyl monomethylethanolamine, and unknown phospholipids. The major cellular fatty acids include summed feature 8 (C18:1 ω7c/C18:1 ω6c), C14:0 2-OH, and C16:0. The genome size is 6.60 Mbp, and the DNA G+C content is 63.57 mol%.
The type strain is H39-3-25T (=CGMCC 1.61326T), isolated from a polluted soil sample. The GenBank accession numbers for the 16S rRNA gene sequence and genome sequence of the type strain are OP493227 and JARFNK000000000, respectively.
The phylogenetic trees revealed that H3SJ31-1T clustered members of Novosphingobium genus (Figures 5B1, B2). The close relatives to H3SJ31-1T were N. mathurense SM117T (97.53%, 16S rRNA gene identity) and N. soli CC-TPE-1T (97.60%). The ANI and dDDH values between H3SJ31-1T and N. mathurense SM117T were 76.91 and 20.7%, respectively (Table 2 and Figure 6E), which were all below the threshold for differentiating two species. At the date of this description, 58 species of the Novosphingobium genus have been described. The major cellular fatty acids of H3SJ31-1T were summed feature 8 (C18:1 ω7c/C18:1 ω6c, 30.74%) and C16:0 (47.67%), and the component of C16:0 distinguished this organism from other members of the Novosphingobium genus as shown in Supplementary Table S3. H3SJ31-1T contained polar lipids of sphingoglycolipid, diphosphatidylglycerol, phosphatidylethanolamine, phosphatidyl dimethylethanolamine, phosphatidylglycerol, phosphatidylcholine, phosphatidyl monomethylethanolamine, and unknown lipid (Supplementary Figure S1). The DNA G+C content was 66.16 mol%, which is in the range (62–67 mol%; Takeuchi et al., 2001) of the Novosphingobium genus (Supplementary Table S3). Based on the results of phylogenetic, phylogenomic, and phenotypic characterizations, we concluded that strain H3SJ31-1T represents a novel species affiliated to the genus Novosphingobium and the name Novosphingobium album sp. nov. is proposed.
Novosphingobium album (al'bum. L. neut. adj. album white).
Cells are Gram-positive, aerobic, motile by means of polar flagellum, and ovoid-shaped with a size of approximately 0.89–1.15 × 0.73–0.90 μm. Colonies grown on R2A agar plates are circular, non-transparent, and milk-white after cultivating for 2 days. The cells metabolize glycyl-L-proline, L-glutamic acid, acetic acid, L-aspartic acid, glucuronamide, Tween 40, β-hydroxy-D, L-butyric acid, and acetoacetic acid. They grow at pH 6.0 but fail to grow when pH is lower than pH 5.0. The cells do not tolerate 1–8% NaCl. The cells tolerate lincomycin, nalidixic acid, and potassium tellurite. The major polar lipids are sphingoglycolipid, diphosphatidylglycerol, phosphatidylethanolamine, phosphatidylglycerol, phosphatidyl monomethylethanolamine, phosphatidyl dimethylethanolamine, phosphatidylcholine, and unknown lipids. The major cellular fatty acids are C16:0 and summed feature 8 (C18:1 ω7c/C18:1 ω6c). The genome size is 5.03 Mbp, and the DNA G+C content is 66.16 mol%.
The type strain is H3SJ31-1T (=CGMCC 1.61329T) isolated from a polluted soil sample. The GenBank accession numbers for the 16S rRNA gene sequence and genome sequence of the type strain are OP493226 and JARESE000000000, respectively.
The datasets presented in this study can be found in online repositories. The names of the repository/repositories and accession number(s) can be found in the article/Supplementary material.
Z-SL: Writing—original draft, Formal analysis, Investigation, Project administration, Software. K-HW: Data curation, Formal analysis, Investigation, software. MC: Data curation. M-LY: Data curation. X-KW: Data curation. H-LM: Data curation. Y-HY: Data curation. L-HW: Data curation. D-FL Conceptualization, Funding acquisition, Resources, Supervision, Writing—review & editing. S-JL: Conceptualization, Funding acquisition, Resources, Supervision, Writing—review & editing.
The author(s) declare financial support was received for the research, authorship, and/or publication of this article. This study was funded by the National Natural Science Foundation of China (Grant No. 41991333) and the National Key R&D Program of China (Grant No. 2020YFC1808801).
The authors are indebted to Prof. Aharon Oren (Jerusalem, Israel) for nomenclatural advice. The authors thank Prof. Yuguang Zhou at the Institute of Microbiology, Chinese Academy of Sciences (CAS), for the coordination of deposits of type strains, and Jingnan Liang at the Instrument Center of Institute of Microbiology, CAS for performing TEM. The authors thank Xiutong Li and Rashidin Abdugheni for the instruction on phylogenetic analysis and Qun Han for analyzing and drawing the gene clusters.
The authors declare that the research was conducted in the absence of any commercial or financial relationships that could be construed as a potential conflict of interest.
All claims expressed in this article are solely those of the authors and do not necessarily represent those of their affiliated organizations, or those of the publisher, the editors and the reviewers. Any product that may be evaluated in this article, or claim that may be made by its manufacturer, is not guaranteed or endorsed by the publisher.
The Supplementary Material for this article can be found online at: https://www.frontiersin.org/articles/10.3389/fmicb.2023.1289110/full#supplementary-material
Ackerley, D. F., Gonzalez, C. F., Keyhan, M., Blake, I. I. R, and Matin, A. (2004). Mechanism of chromate reduction by the Escherichia coli protein, NfsA, and the role of different chromate reductases in minimizing oxidative stress during chromate reduction. Environ. Microbiol. 6, 851–860. doi: 10.1111/j.1462-2920.2004.00639.x
Alibert, S., N'gompaza Diarra, J., Hernandez, J., Stutzmann, A., Fouad, M., Boyer, G., et al. (2017). Multidrug efflux pumps and their role in antibiotic and antiseptic resistance: a pharmacodynamic perspective. Expert Opin. Drug Metab. Toxicol. 13, 301–309. doi: 10.1080/17425255.2017.1251581
Bonomo, R. A. (2017). β-Lactamases: a focus on current challenges. Cold Spring Harb. Perspect. Med. 7, a025239. doi: 10.1101/cshperspect.a025239
Brito, E. M., Guyoneaud, R., Goñi-Urriza, M., Ranchou-Peyruse, A., Verbaere, A., Crapez, M. A., et al. (2006). Characterization of hydrocarbonoclastic bacterial communities from mangrove sediments in Guanabara Bay, Brazil. Res. Microbiol. 157, 752–762. doi: 10.1016/j.resmic.2006.03.005
Daniel, R. (2005). The metagenomics of soil. Nat. Rev. Microbiol. 3, 470–478. doi: 10.1038/nrmicro1160
Darling, A. C., Mau, B., Blattner, F. R., and Perna, N. T. (2004). Mauve: multiple alignment of conserved genomic sequence with rearrangements. Genome Res. 14, 1394–1403. doi: 10.1101/gr.2289704
De Maria, S., Rivelli, A. R., Kuffner, M., Sessitsch, A., Wenzel, W. W., Gorfer, M., et al. (2011). Interactions between accumulation of trace elements and macronutrients in Salix caprea after inoculation with rhizosphere microorganisms. Chemosphere 84, 1256–1261. doi: 10.1016/j.chemosphere.2011.05.002
Felsenstein, J. (1985). Confidence limits on phylogenies: an approach using the bootstrap. Evolution. 39, 783–791. doi: 10.2307/2408678
Fitch, W. M. (1971). Toward defining the course of evolution: Minimum change for a specific tree topology. Syst. Biol. 20, 406–416. doi: 10.1093/sysbio/20.4.406
Ghosal, D., Ghosh, S., Dutta, T. K., and Ahn, Y. (2016). Current state of knowledge in microbial degradation of polycyclic aromatic hydrocarbons (PAHs): a review. Front. Microbiol. 7, 1369. doi: 10.3389/fmicb.2016.01369
Gledhill, W. E., and Casida, L. E. (1969). Predominant catalase-negative soil bacteria. III. Agromyces, gen. n., microorganisms intermediary to Actinomyces and Nocardia. Appl. Microbiol. 18, 340–349. doi: 10.1128/am.18.3.340-349.1969
Goris, J., Konstantinidis, K. T., Klappenbach, J. A., Coenye, T., Vandamme, P., and Tiedje, J. M. (2007). DNA-DNA hybridization values and their relationship to whole-genome sequence similarities. Int. J. Syst. Evol. Microbiol. 57, 81–91. doi: 10.1099/ijs.0.64483-0
Gou, Y., Zhao, Q., Yang, S., Wang, H., Qiao, P., Song, Y., et al. (2020). Removal of polycyclic aromatic hydrocarbons (PAHs) and the response of indigenous bacteria in highly contaminated aged soil after persulfate oxidation. Ecotoxicol. Environ. Saf. 190, 110092. doi: 10.1016/j.ecoenv.2019.110092
Gupta, S. K., Lal, D., and Lal, R. (2009). Novosphingobium panipatense sp. nov. and Novosphingobium mathurense sp. nov., from oil-contaminated soil. Int. J. Syst. Evol. Microbiol. 59, 156–161. doi: 10.1099/ijs.0.65743-0
Hamada, M., Shibata, C., Tamura, T., and Suzuki, K. (2014). Agromyces marinus sp. nov., a novel actinobacterium isolated from sea sediment. J. Antibiot. 67, 703–706. doi: 10.1038/ja.2014.60
Han, S. K., Nedashkovskaya, O. I., Mikhailov, V. V., Kim, S. B., and Bae, K. S. (2003). Salinibacterium amurskyense gen. nov., sp. nov., a novel genus of the family Microbacteriaceae from the marine environment. Int. J. Syst. Evol. Microbiol. 53, 2061–2066. doi: 10.1099/ijs.0.02627-0
He, Y., Dong, L., Zhou, S., Jia, Y., Gu, R., Bai, Q., et al. (2018). Chromium resistance characteristics of Cr(VI) resistance genes ChrA and ChrB in Serratia sp. S2. Ecotoxicol. Environ. Saf. 157, 417–423. doi: 10.1016/j.ecoenv.2018.03.079
Huang, Y. H., Liu, Y., Geng, J., Lü, H., Zhao, H. M., Xiang, L., et al. (2022). Maize root-associated niches determine the response variation in bacterial community assembly and function to phthalate pollution. J. Hazard. Mater. 429, 128280. doi: 10.1016/j.jhazmat.2022.128280
Jurado, V., Groth, I., Gonzalez, J. M., Laiz, L., Schuetze, B., and Saiz-Jimenez, C. (2005). Agromyces italicus sp. nov., Agromyces humatus sp. nov. and Agromyces lapidis sp. nov., isolated from Roman catacombs. Int. J. Syst. Evol. Microbiol. 55, 871–875. doi: 10.1099/ijs.0.63414-0
Kaur, S., Kamli, M. R., and Ali, A. (2011). Role of arsenic and its resistance in nature. Can. J. Microbiol. 57, 769–774. doi: 10.1139/w11-062
Kimura, M. (1980). A simple method for estimating evolutionary rates of base substitutions through comparative studies of nucleotide sequences. J. Mol. Evol. 16, 111–120. doi: 10.1007/BF01731581
Kurtz, S., Phillippy, A., Delcher, A. L., Smoot, M., Shumway, M., Antonescu, C., et al. (2004). Versatile and open software for comparing large genomes. Genome Biol. 5, R12. doi: 10.1186/gb-2004-5-2-r12
Lee, I., Ouk Kim, Y., Park, S. C., and Chun, J. (2016). OrthoANI: an improved algorithm and software for calculating average nucleotide identity. J. Hazard Mater. 66, 1100–1103. doi: 10.1099/ijsem.0.000760
Lee, J. C., Kim, S. G., and Whang, K. S. (2015). Sphingobium subterraneum sp. nov., isolated from ground water. J. Hazard Mater. 65, 393–398. doi: 10.1007/s10853-014-8598-0
Lee, J. C., and Whang, K. S. (2020). Agriterribacter humi gen. nov., sp. nov., a novel bacterium of the family Chitinophagaceae isolated from soil of a farming field. J. Hazard Mater. 70, 5123–5130. doi: 10.1099/ijsem.0.004397
Li, J., Lu, S., Jin, D., Yang, J., Lai, X. H., Zhang, G., et al. (2019). Salinibacterium hongtaonis sp. nov., isolated from faeces of Tibetan antelope (Pantholops hodgsonii) on the Qinghai-Tibet Plateau. J. Hazard Mater. 69, 1093–1098. doi: 10.1099/ijsem.0.003277
Lu, C. Y., Dong, L., Li, S., Lian, W. H., Lin, Z. L., Zheng, Z. H., et al. (2023). Salinibacterium sedimenticola sp. nov., isolated from Tidal Flat Sediment. Curr. Microbiol. 80, 142. doi: 10.1007/s00284-023-03243-x
Ma, Z., Liu, J., Dick, R. P., Li, H., Shen, D., Gao, Y., et al. (2018). Rhamnolipid influences biosorption and biodegradation of phenanthrene by phenanthrene-degrading strain Pseudomonas sp. Ph6. Environ. Pollut. 240, 359–367. doi: 10.1016/j.envpol.2018.04.125
Meier-Kolthoff, J. P., Auch, A. F., Klenk, H. P., and Göker, M. (2013). Genome sequence-based species delimitation with confidence intervals and improved distance functions. BMC Bioinform. 14, 60. doi: 10.1186/1471-2105-14-60
Minnikin, D. E., O'donnell, A. G., Goodfellow, M., Alderson, G., Athalye, M., Schaal, A., et al. (1984). An integrated procedure for the extraction of bacterial isoprenoid quinones and polar lipids. J. Microbiol. Methods 2, 233–241. doi: 10.1016/0167-7012(84)90018-6
Na, S. I., Kim, Y. O., Yoon, S. H., Ha, S. M., Baek, I., and Chun, J. (2018). UBCG: Up-to-date bacterial core gene set and pipeline for phylogenomic tree reconstruction. J. Microbiol. 56, 280–285. doi: 10.1007/s12275-018-8014-6
Ohta, H., Hattori, R., Ushiba, Y., Mitsui, H., Ito, M., Watanabe, H., et al. (2004). Sphingomonas oligophenolica sp. nov., a halo- and organo-sensitive oligotrophic bacterium from paddy soil that degrades phenolic acids at low concentrations. Int. J. Syst. Evol. Microbiol. 54, 2185–2190. doi: 10.1099/ijs.0.02959-0
Papale, M., Giannarelli, S., Francesconi, S., Di Marco, G., Mikkonen, A., Conte, A., et al. (2017). Enrichment, isolation and biodegradation potential of psychrotolerant polychlorinated-biphenyl degrading bacteria from the Kongsfjorden (Svalbard Islands, High Arctic Norway). Mar. Pollut. Bull. 114, 849–859. doi: 10.1016/j.marpolbul.2016.11.011
Parab, V., and Phadke, M. (2020). Co-biodegradation studies of naphthalene and phenanthrene using bacterial consortium. J. Environ. Sci. Heal. A Tox. Hazard. Subst. Environ. Eng. 55, 912–924. doi: 10.1080/10934529.2020.1754054
Parks, D. H., Imelfort, M., Skennerton, C. T., Hugenholtz, P., and Tyson, G. W. (2015). CheckM: assessing the quality of microbial genomes recovered from isolates, single cells, and metagenomes. Genome Res. 25, 1043–1055. doi: 10.1101/gr.186072.114
Posada-Baquero, R., Grifoll, M., and Ortega-Calvo, J. J. (2019). Rhamnolipid-enhanced solubilization and biodegradation of PAHs in soils after conventional bioremediation. Sci. Total Environ. 668, 790–796. doi: 10.1016/j.scitotenv.2019.03.056
Revesz, F., Toth, E. M., Kriszt, B., Boka, K., Benedek, T., Sarkany, O., et al. (2018). Sphingobium aquiterrae sp. nov., a toluene, meta- and para-xylene-degrading bacterium isolated from petroleum hydrocarbon-contaminated groundwater. Int. J. Syst. Evol. Microbiol. 68, 2807–2812. doi: 10.1099/ijsem.0.002898
Richter, M., and Rosselló-Móra, R. (2009). Shifting the genomic gold standard for the prokaryotic species definition. Proc. Natl. Acad. Sci. U. S. A. 106, 19126–19131. doi: 10.1073/pnas.0906412106
Sakshi Singh, S. K., and Haritash, A. K. (2022). Bacterial degradation of mixed-PAHs and expression of PAH-catabolic genes. World J. Microbiol. Biotechnol. 39, 47. doi: 10.1007/s11274-022-03489-w
Samsu, Z. A., Jeffry, F. N., and Azizan, W. N. (2020). Isolation and screening of potential biosurfactant-producing bacteria from used engine oil-contaminated soil. Mater. Today Proc. 31, A67–A71. doi: 10.1016/j.matpr.2020.12.438
Sasser, M. (1990). Technical Note 101: Identification of Bacteria by Gas Chromatography of Cellular Fatty Acids. MIDI 20, 1–6. Available online at: https://api.semanticscholar.org/CorpusID:7008606 (accessed March 2023).
Sazykina, M. A., Minkina, T. M., Konstantinova, E. Y., Khmelevtsova, L. E., Azhogina, T. N., Antonenko, E. M., et al. (2022). Pollution impact on microbial communities composition in natural and anthropogenically modified soils of Southern Russia. Microbiol. Res. 254, 126913. doi: 10.1016/j.micres.2021.126913
Selifonov, S. A., Grifoll, M., Eaton, R. W., and Chapman, P. J. (1996). Oxidation of naphthenoaromatic and methyl-substituted aromatic compounds by naphthalene 1,2-dioxygenase. Appl. Environ. Microbiol. 62, 507–514. doi: 10.1128/aem.62.2.507-514.1996
Shokrollahzadeh, S., Azizmohseni, F., Golmohammad, F., Shokouhi, H., and Khademhaghighat, F. (2008). Biodegradation potential and bacterial diversity of a petrochemical wastewater treatment plant in Iran. Bioresour. Technol. 99, 6127–6133. doi: 10.1016/j.biortech.2007.12.034
Singh, P., Kim, Y. J., Hoang, V. A., Farh Mel, A., and Yang, D. C. (2015). Sphingomonas panacis sp. nov., isolated from rhizosphere of rusty ginseng. Anton. Leeuw. Int. J. G. 108, 711–720. doi: 10.1007/s10482-015-0527-y
Soergel, D. A., Dey, N., Knight, R., and Brenner, S. E. (2012). Selection of primers for optimal taxonomic classification of environmental 16S rRNA gene sequences. ISME J. 6, 1440–1444. doi: 10.1038/ismej.2011.208
Takeuchi, M., Hamana, K., and Hiraishi, A. (2001). Proposal of the genus Sphingomonas sensu stricto and three new genera, Sphingobium, Novosphingobium and Sphingopyxis, on the basis of phylogenetic and chemotaxonomic analyses. Int. J. Syst. Evol. Microbiol. 51, 1405–1417. doi: 10.1099/00207713-51-4-1405
Tamura, K., and Nei, M. (1993). Estimation of the number of nucleotide substitutions in the control region of mitochondrial DNA in humans and chimpanzees. Mol. Biol. Evol. 10, 512–526.
Thakur, N., Singh, S. P., and Zhang, C. (2022). Microorganisms under extreme environments and their applications. Curr. Res. Microb. Sci. 3, 100141. doi: 10.1016/j.crmicr.2022.100141
Thompson, J. D., Higgins, D. G., and Gibson, T. J. (1994). CLUSTAL W: improving the sensitivity of progressive multiple sequence alignment through sequence weighting, position-specific gap penalties and weight matrix choice. Nucleic Acids Res. 22, 4673–4680. doi: 10.1093/nar/22.22.4673
Waigi, M. G., Kang, F., Goikavi, C., Ling, W., and Gao, Y. (2015). Phenanthrene biodegradation by sphingomonads and its application in the contaminated soils and sediments: a review. Int. Biodeter. Biodegr. 104, 333–349. doi: 10.1016/j.ibiod.2015.06.008
Wan, X. (2019). Comparative genome analyses reveal the genomic traits and host plant adaptations of Flavobacterium akiainvivens IK-1T. Int. J. Mol. Sci. 20, 4910. doi: 10.3390/ijms20194910
Wang, W., Zhai, Y., Cao, L., Tan, H., and Zhang, R. (2016). Illumina-based analysis of core actinobacteriome in roots, stems, and grains of rice. Microbiol. Res. 190, 12–18. doi: 10.1016/j.micres.2016.05.003
Yabuuchi, E., Yano, I., Oyaizu, H., Hashimoto, Y., Ezaki, T., and Yamamoto, H. (1990). Proposals of Sphingomonas paucimobilis gen. nov. and comb. nov., Sphingomonas parapaucimobilis sp. nov., Sphingomonas yanoikuyae sp. nov., Sphingomonas adhaesiva sp. nov., Sphingomonas capsulata comb. nov., and two genospecies of the genus Sphingomonas. Microbiol. Immunol. 34, 99–119. doi: 10.1111/j.1348-0421.1990.tb00996.x
Yang, Z. N., Liu, Z. S., Wang, K. H., Liang, Z. L., Abdugheni, R., Huang, Y., et al. (2022). Soil microbiomes divergently respond to heavy metals and polycyclic aromatic hydrocarbons in contaminated industrial sites. Environ. Sci. Ecotechnol. 10, 100169. doi: 10.1016/j.ese.2022.100169
Keywords: Microbacteriaceae, Sphingomonadaceae, Agromyces, Salinibacterium, Sphingomonas, Sphingobium, Novosphingobium, polluted soil environment
Citation: Liu Z-S, Wang K-H, Cai M, Yang M-L, Wang X-K, Ma H-L, Yuan Y-H, Wu L-H, Li D-F and Liu S-J (2023) Agromyces chromiiresistens sp. nov., Novosphingobium album sp. nov., Sphingobium arseniciresistens sp. nov., Sphingomonas pollutisoli sp. nov., and Salinibacterium metalliresistens sp. nov.: five new members of Microbacteriaceae and Sphingomonadaceae from polluted soil. Front. Microbiol. 14:1289110. doi: 10.3389/fmicb.2023.1289110
Received: 05 September 2023; Accepted: 24 October 2023;
Published: 28 November 2023.
Edited by:
Spyridon Ntougias, Democritus University of Thrace, GreeceReviewed by:
Heng-Lin Cui, Jiangsu University, ChinaCopyright © 2023 Liu, Wang, Cai, Yang, Wang, Ma, Yuan, Wu, Li and Liu. This is an open-access article distributed under the terms of the Creative Commons Attribution License (CC BY). The use, distribution or reproduction in other forums is permitted, provided the original author(s) and the copyright owner(s) are credited and that the original publication in this journal is cited, in accordance with accepted academic practice. No use, distribution or reproduction is permitted which does not comply with these terms.
*Correspondence: Shuang-Jiang Liu, bGl1c2pAaW0uYWMuY24=; De-Feng Li, bGlkZWZlbmdAaW0uYWMuY24=
†These authors have contributed equally to this work
Disclaimer: All claims expressed in this article are solely those of the authors and do not necessarily represent those of their affiliated organizations, or those of the publisher, the editors and the reviewers. Any product that may be evaluated in this article or claim that may be made by its manufacturer is not guaranteed or endorsed by the publisher.
Research integrity at Frontiers
Learn more about the work of our research integrity team to safeguard the quality of each article we publish.