
95% of researchers rate our articles as excellent or good
Learn more about the work of our research integrity team to safeguard the quality of each article we publish.
Find out more
ORIGINAL RESEARCH article
Front. Microbiol. , 08 January 2024
Sec. Infectious Agents and Disease
Volume 14 - 2023 | https://doi.org/10.3389/fmicb.2023.1276809
 Bertha I. Carvajal-Gamez1,2
 Aída Olguín-Barrera1,3Luis Tinoco-Gracia4
 Guadalupe Gordillo-Perez5
 Karla Dzul-Rosado6Gabriela Aguilar-Tipacamú2
 Mario Hidalgo-Ruiz1†
 Juan Mosqueda1,2*
Introduction: Rickettsia rickettsii is an obligate, intracellular pathogen and the causative agent of Rocky Mountain spotted fever (RMSF). RMSF is an important zoonotic disease due to its high fatal outcome in humans. The difficulty of clinical diagnosis due to the low sensitivity and specificity of current diagnostic methods are a principal setback. We reported the development of a new method for the detection of R. rickettsii in human and tick DNA samples using loop-mediated isothermal amplification (LAMP), as well as the validation of the LAMP test for R. rickettsii in field samples of infected ticks and humans, determining the diagnostic sensitivity and specificity, as well as the reproducibility of the test.
Methods: This technique uses hydroxy naphthol blue (HNB) as an indicator of the formation of magnesium pyrophosphate, a marker for the presence of DNA. Here, we used a putative R. rickettsii gene as a target for three pairs of primers that specifically amplify R. rickettsii DNA by hairpin-based isothermal amplification technique (LAMP).
Results and discussion: The sensitivity of the assay was ~1.6–3 pg, which is 10 times more sensitive than PCR. To determine the diagnostics specificity and sensitivity, 103 human DNA samples and 30 tick DNA samples were evaluated. For the human samples, a sensitivity for HNB of 93%, a specificity of 70% and a k of 0.53 were obtained. For electrophoresis the sensitivity was 97% with a specificity of 58% and a k of 0.42. For tick samples, a sensitivity of 80% was obtained, a specificity of 93% for HNB and for electrophoresis the sensitivity and specificity were 87%. The k for both was 0.73. The degree of concordance between HNB and electrophoresis was 0.82 for humans and for ticks, it was 0.87. The result is obtained in shorter time, compared to a PCR protocol, and is visually interpreted by the color change. Therefore, this method could be a reliable tool for the early diagnosis of rickettsiosis.
Rickettsia rickettsii is responsible for Rocky Mountain spotted fever (RMSF) and the most important vectors are Ixodid ticks, including Rhipicephalus sanguineus (tropical lineage, now classified as R. linnaei), Dermacentor andersoni, D. variabilis, Amblyomma sculptum, A. americanum, and A. patinoi (Pinter et al., 2011; Piranda et al., 2011; Dergousoff et al., 2013; Parola et al., 2013; Levin et al., 2017; Costa et al., 2020; Martínez-Diaz et al., 2021; Šlapeta et al., 2022; Sánchez Pérez et al., 2023). RMSF occurs after the bite of an infected tick, with an incubation period of 7 days. The signs and symptoms vary in severity with elevated body temperature (38–40°C) and a rash that initially appears on the wrists and ankles, gradually spreading over time. RMSF is characterized by proinflammatory and procoagulant changes, the development of systemic vasculitis, and vascular damage affecting various organs, including the brain, pancreas, lungs, liver, skeletal muscles, kidneys, and skin. Such multisystemic injuries lead to increased vascular permeability, edema, hypovolemia, and hypotension (Helmick et al., 1984; Weber and Walker, 1991; Ibarra Stone et al., 2022).
There are manifold complications of rickettsiosis, including pneumonia, myocardial edema, portal triaditis and vasculitis, thrombocytopenia or severe coagulopathies, hypercoagulable state, encephalomyelitis and meningoencephalitis, gangrene or cutaneous necrosis, acute renal failure, central nervous system abnormalities, coma as a neurological sequela, and death (Walker et al., 1980a,b; Randall and Walker, 1984; Roggli et al., 1985; Jackson et al., 1986; Horney and Walker, 1988; Hove and Walker, 1995; Conlon et al., 1996; Sundy et al., 1996; Bergeron et al., 1997; Wei and Baumann, 1999). To prevent these complications, a rapid and specific diagnostic method is required. The diagnosis of rickettsiosis is complex due to the expansive clinical manifestations, often mistaken for symptoms of dengue or chikungunya (Álvarez-López et al., 2021). Furthermore, since symptoms typically manifest within the first 2 weeks post-infection, outcomes can be fatal in the absence of early therapeutic intervention. For this reason, treatment must be administered as early as possible—even if the infection has not yet been confirmed (Kirkland et al., 1995). Hence, there is a need for tests that enable swift and simple interpretation. When coupled with clinical and paraclinical characteristics, these tests allow a better approach to patient care and enhance the prognosis for survival.
Methods for specific diagnosis are based on molecular and serological tests. Methods based on PCR amplification of gene fragments, such as htrA, 16S ribosomal RNA, gltA and ompB, among others (Oteo et al., 2014), have been extensively explored for their diagnostic utility. All of these are highly conserved in species of Rickettsia and have been used to develop diagnostic methods based on semi-quantitative and quantitative PCR and real-time multiplex PCR to detect Rickettsia DNA presence. Some of these techniques are laborious and time-consuming (Roux and Raoult, 1993, 1995; Roux et al., 1996; Eremeeva et al., 2003; Tomita et al., 2008; Nakao et al., 2013; Ueno et al., 2016).
The indirect fluorescent antibody (IFA) test stands as the most commonly used serological diagnostic test for detecting the presence of specific antibodies; however, this technique cannot detect the presence of Rickettsia in an acute state because its respective antibodies appear only 10–14 days after infection (Paddock et al., 2002). Serological techniques exhibited limited specificity as IgM and IgG antibodies cannot distinguish between infections caused by R. rickettsii and those induced by other pathogens that cause spotted fever, such as R. akari and R. conorii (Kaplan and Schonberger, 1986; Sexton and Kaye, 2002).
The hairpin-based isothermal amplification method (LAMP) has proven to be the most efficient, economical, and specific molecular diagnostic method for the diagnosis of murine typhus and scrub typhus (Dittrich et al., 2014; Roy et al., 2021). It uses a constant amplification temperature and six primers that recognize six unique sites in the DNA sequence (Notomi et al., 2000).
To date, there are no reports of a test to detect the specific species of R. rickettsii. This study aims to develop a LAMP test for the detection of R. rickettsii DNA in human and tick samples, as well as to evaluate the sensitivity, specificity, and reproducibility of the test.
R. rickettsii DNA positive control of human blood was obtained by Luis Tinoco-Gracia (Autonomous University of Baja California). DNA from R. typhi (PMID: 25076014), R. japonica, R. helvetica, R. australis, R. conorii, R. felis, R. prowasekii, R. africae, R. parkeri (strain Atlantic Rainforest), and R. slovaca were obtained by Karla Dzul Rosado and Cesar Lugo (Autonomous University of Yucatan), and which were then analyzed and sequenced, under the collaboration of the UTMB. Dr. Jorge Zavala Castro. Marisa Farber (National Agricultural Technology Institute, Argentina) obtained the DNA of Borrelia burgdorferi and Anaplasma phagocytophilum. The DNA of the R. rickettsii reference strain was extracted from a vial of R. rickettsii containing yolk sac antigen (RA2296, R. rickettsii IFA antigen, Sheila Smith strain, Biologics Branch Scientific Resources Program, CDC, Atlanta, GA) using the illustra™ blood genomicPrep Mini Spin Kit (GE Healthcare, Chigago, IL, USA), according to the manufacturer's instructions. All DNA control samples used in this study were previously confirmed by sequencing. The negative control for each assay consists of the addition of nuclease-free water.
The Infectious Diseases Research Unit of the Centro Médico Nacional Siglo XXI in Mexico City (UIMEIP-CMNSXXI) provided 77 DNA samples from patients, while the Instituto de Investigaciones en Ciencias Veterinarias de la Autonomous University of Baja California (IICV-UABC) contributed 26 samples. A total of 30 tick DNA samples were also donated by the same institution, with the ticks being brown dog ticks collected from dogs in RMSF endemic areas. In total, there were 133 human and tick DNA samples. The samples used for diagnostic sensitivity, specificity, and reproducibility were obtained from patients suspected of Rickettsial disease. These blood samples were taken from a population in RMSF-endemic areas in the Northwest and Southeast of the country during the spring-summer period. Negative controls were obtained from humans in non-endemic areas of RMSF and from patients with undifferentiated febrile illness. All samples were previously determined as positive or negative using a previously published PCR protocol for the presence of R. rickettsii DNA (Eremeeva et al., 2003), along with sequencing and clinical disease assessment (Mexican Official STANDARD NOM-032-SSA2-2014, 2015; Tinoco-Gracia et al., 2018).
For this study, two R. rickettsii genome sequences were obtained from GenBank: the Iowa Strain (accession number: CP000766) and the Sheila Smith reference strain (accession number: CP000766). A nucleotide sequence of R. rickettsii coding for a putative gene of unknown function (AF042063.1) was subjected to a BLAST analysis (http://blast.ncbi.nlm.nih.gov/Blast.cgi), and the nucleotide sequences of this gene from different strains of R. rickettsii (Colombia, Brazil, Sheila Smith, Morgan, Iowa, Hauke, Hino, Arizona, Hlp#2) were aligned and compared in MUSCLE program (http://www.ebi.ac.uk/Tools/msa/muscle/) to identify conserved regions.
A set of species-specific primers complementary to the R. rickettsii gene sequences of each isolate was designed according to the recommendations by Notomi et al. (2000). The designed primers were analyzed using BLAST (https://blast.ncbi.nlm.nih.gov/Blast.cgi) and verified for specificity to R. rickettsia. We considered all Rickettsia records reported for human and/or animal hosts. A set of six primers was generated and there is an ongoing patent application for this set (No. MX/a/2022/003615). The alignment includes the following Rickettsia species: R. amblyommatis, R. montanensis, R. rhipicephali, R. massiliae, R. japonica, R. heilongjiangensis, R. africae, R. philipii, R. slovaca, R. parkeri (strain Atlantic Rainforest), R. felis, R. akari, R. peacockii, R. bellii, R. australis, R. peacockii, R. conorii, R. rhipicephali, and R. massiliae.
Cloning was carried out in the pCR™ 4-TOPO® TA cloning maintenance vector (Invitrogen, Waltham, MA, USA) following the manufacturer's instructions. Subsequently, DH5α cells (E. coli TOP 10) were transformed, and the transformed cells were plated in petri dish with LB-ampicillin medium (100 mg/ml), incubated at 37°C for 18 h. As a control, the transformation was carried out without the PCR product. Furthermore, ten bacteria colonies were selected and used for the isolation and purification of the plasmids containing the insert and were prepared for commercial sequencing. The cloning products were sequenced in both directions using each of the primers by the automated Sanger method.
A previously published PCR protocol was used as a comparative assay. Briefly, PCR amplification was carried out using the RR190.547F primer (5′-CCT GCC GAT AAT TAT ACA GGT TTA-3′) and RR190.701R primer (5′-GTT CCG TTA ATG GCA GCA T-3′) (Eremeeva et al., 2003). Then, the protocol consisted of an initial denaturation at 94°C for 1 min, 34 cycles at 94°C for 1 min, followed by an annealing step at 63°C for 45 s and an extension step of 71°C for 45 s. The final extension was carried out at 72°C for 7 min. Each primer was used as a concentration of 10 pmol using MyTaq™ mix (Bioline, London, UK). An amplicon of ~154 bp was obtained, and PCR was performed in a final volume of 25 μL containing a mixture of 30 ng of total R. rickettsii DNA. The PCR amplification products were analyzed by electrophoresis on a 1.5% agarose gel and stained with GelRed® (Biotium, Hayward, CA, USA).
The protocol for LAMP was developed following the method described by Notomi et al. (2000). Briefly, the reaction was performed in a final volume of 25 μL of a mixture containing 30 ng of the DNA sample, 4 μM each of the FIPRrickettsii and BIPRrickettsii primers, 0.2 μM each of the F3Rrickettsii, B3Rrickettsii, LPRrickettsii, and LFRrickettsii primers, 6 mM MgSO4 (New England Biolabs, Hitchin, UK), 0.8 M betaine (Thermo Fisher Scientific, Waltham, MA, USA), 1.4 mM of dNTPs (Invitrogen, Carlsbad, CA, USA), 20 μM of hydroxy naphthol blue (HNB; Sigma-Aldrich, USA), LAMP buffer (20 mM Tris-HCl, pH 8.8), and 8 U of Bst DNA polymerase (New England Biolabs, Hitchin, UK). The temperature of the amplification was evaluated by exposing the reaction to 61, 63, or 65°C for 60 min followed by 80°C for 3 min. The LAMP products were analyzed by electrophoresis on a 1.5% agarose gel and visualized under an ultraviolet (UV) light after staining with GelRed® (Biotium, Hayward, CA, USA). Each LAMP reaction was performed three times.
The LAMP assay for analytical sensitivity determination was evaluated using 10-fold serial dilutions of R. rickettssi DNA. The initial concentration of R. rickettsii DNA was 30 ng. The same DNA sample was also evaluated by PCR, which was used as a control, as described above. The analytical specificity of the LAMP assay for R. rickettsii was evaluated using DNA from different species, such as R. typhi, R. japonica, R. helvetica, R. australis, R. conorii, R. felis, R. prowasekii, R. africae, R. parkeri (strain Atlantic Rainforest), R. slovaca, Ehrlichia canis, Borrelia burgdorferi, and Anaplasma phagocytophilum. The assay was also tested using the DNA samples from human, dog (Canis lupus familiaris), and the brown dog tick from Mexicali, BC, Mexico (Almazán et al., 2023). In each evaluation, the LAMP reaction was performed at 63°C for 60 min and compared with the results of the PCR assay. To evaluate the incubation duration of the test, the LAMP reaction was incubated for different durations: 30, 45, and 60 min at 63°C, then at 80°C for 3 min. The result of each assay was visualized on a 1.5% agarose gel stained with GelRed® (Biotium, Hayward, CA, USA). All assays were performed three times at different times.
To validate the assay, we followed two referenced protocols for diagnostics tests (Banoo, 2010; OIE, 2018). Therefore, the following methodology was performed according to both manuals.
The reproducibility test was performed using two different strains of R. rickettsii DNA: DNA from the R. rickettsii reference strain obtained from yolk sac and DNA from R. rickettsii obtained from a clinical sample previously confirmed by sequencing. In addition, a previously analyzed and sequenced plasmid DNA construct was used in the evaluation. All standardization, optimization, sensitivity, and specificity tests were performed three times.
To assess the suitability of the LAMP technique, 103 human DNA samples and 30 tick DNA samples were evaluated, following the protocol, using positive and negative controls, in a blind study. The result of the test was determined in agarose gel stained with red gel and visualized in the digital imaging system (Bio-Rad Gel Doc Imager, Wayne, PA, USA). Additionally, the results were evaluated visually, by changing the color from purple to blue. To determine the repeatability of the technique, six random samples were taken, previously determined as positive in the LAMP technique. The following day, the same protocol was repeated, using the same lot of reagents and equipment. The obtained results were then compared. In addition, data such as availability of equipment, interpretation capacity, test performance, time necessary for the delivery of results, and the feasibility of the test to be carried out in their laboratories were obtained. The LAMP method was performed three times.
The results obtained were evaluated in a 2 × 2 contingency table to obtain the specificity and sensitivity values of the LAMP method. The sensitivity is calculated as [true positive/(true positive + false negative)] and the specificity as [true negative/(true negative + false positive)]. Both positive and negative predictive values, the degree of concordance using the Kappa index (k) (Landis and Koch, 1977), the likelihood ratios, as well as the precision of the new method were also estimated (Diagnostic Test Calculator http://araw.mede.uic.edu/cgi-bin/testcalc.pl; MEDCALC easy-to-use statistical software https://www.medcalc.org/index.php). The determination of specificity and diagnostic sensitivity was performed three times at various intervals.
The LAMP primers designed for R. rickettsii are shown in Table 1. They were designed based on the unknown gene sequence of R. rickettsia (AF042063.1), which was used for the design of primers in the conserved and specific regions of this sequence in R. rickettsii isolates (Figure 1). Multiple alignments of the unknown gene DNA sequences showed a high degree of conservation between the different R. rickettsii isolates used in this study as well as a high degree of divergence with other species of Rickettsia, except R. phillipi (Figure 1). Comparative analysis of the unknown gene sequences between R. rickettsii and R. phillipi showed an enzymatic digestion site with the PsiI enzyme that distinguishes between the sequences in these two species (Table 1).
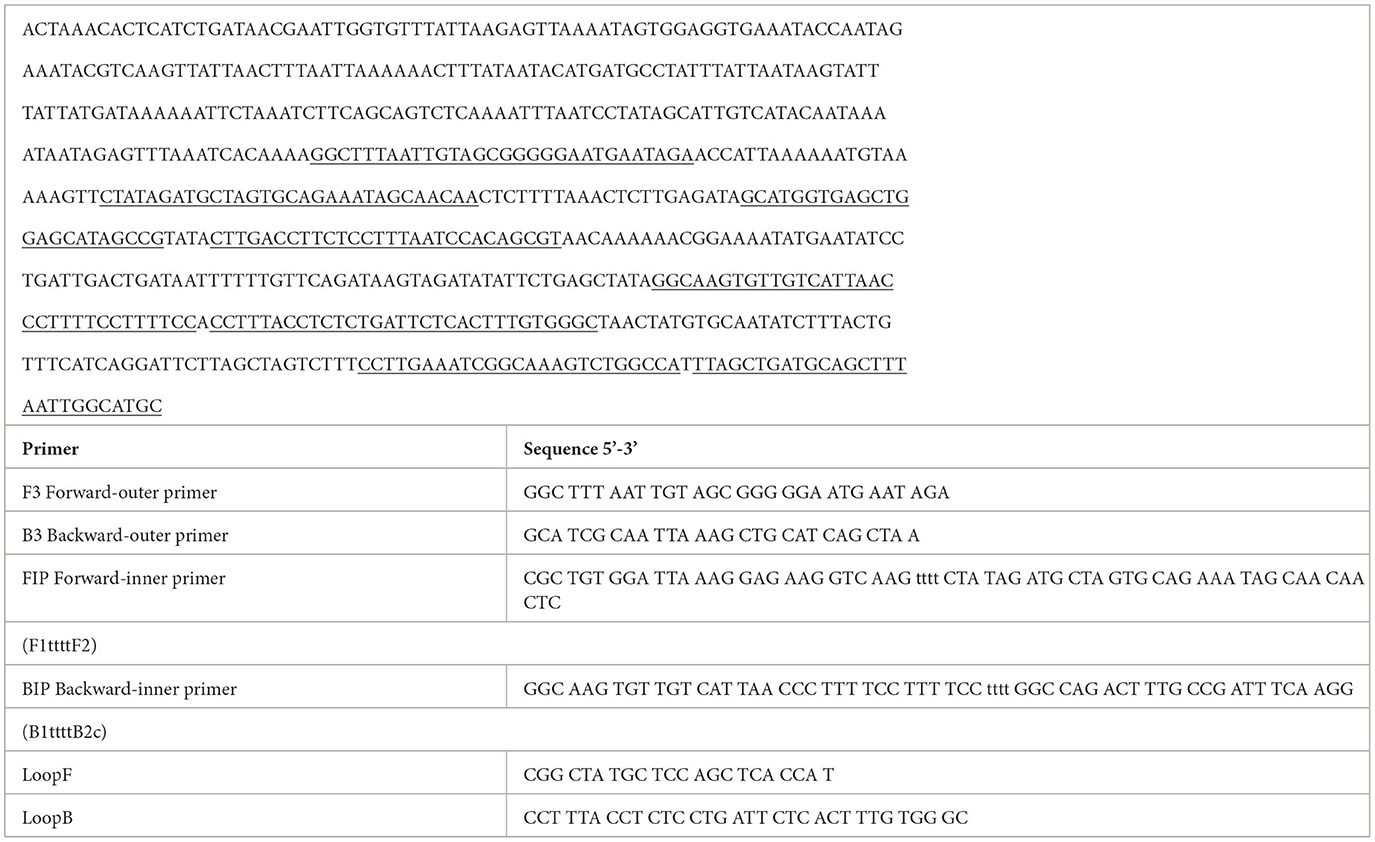
Table 1. >AF042063.1 Rickettsia rickettsii putative protease IV (cjsT) gene, complete cds; and unknown genes.
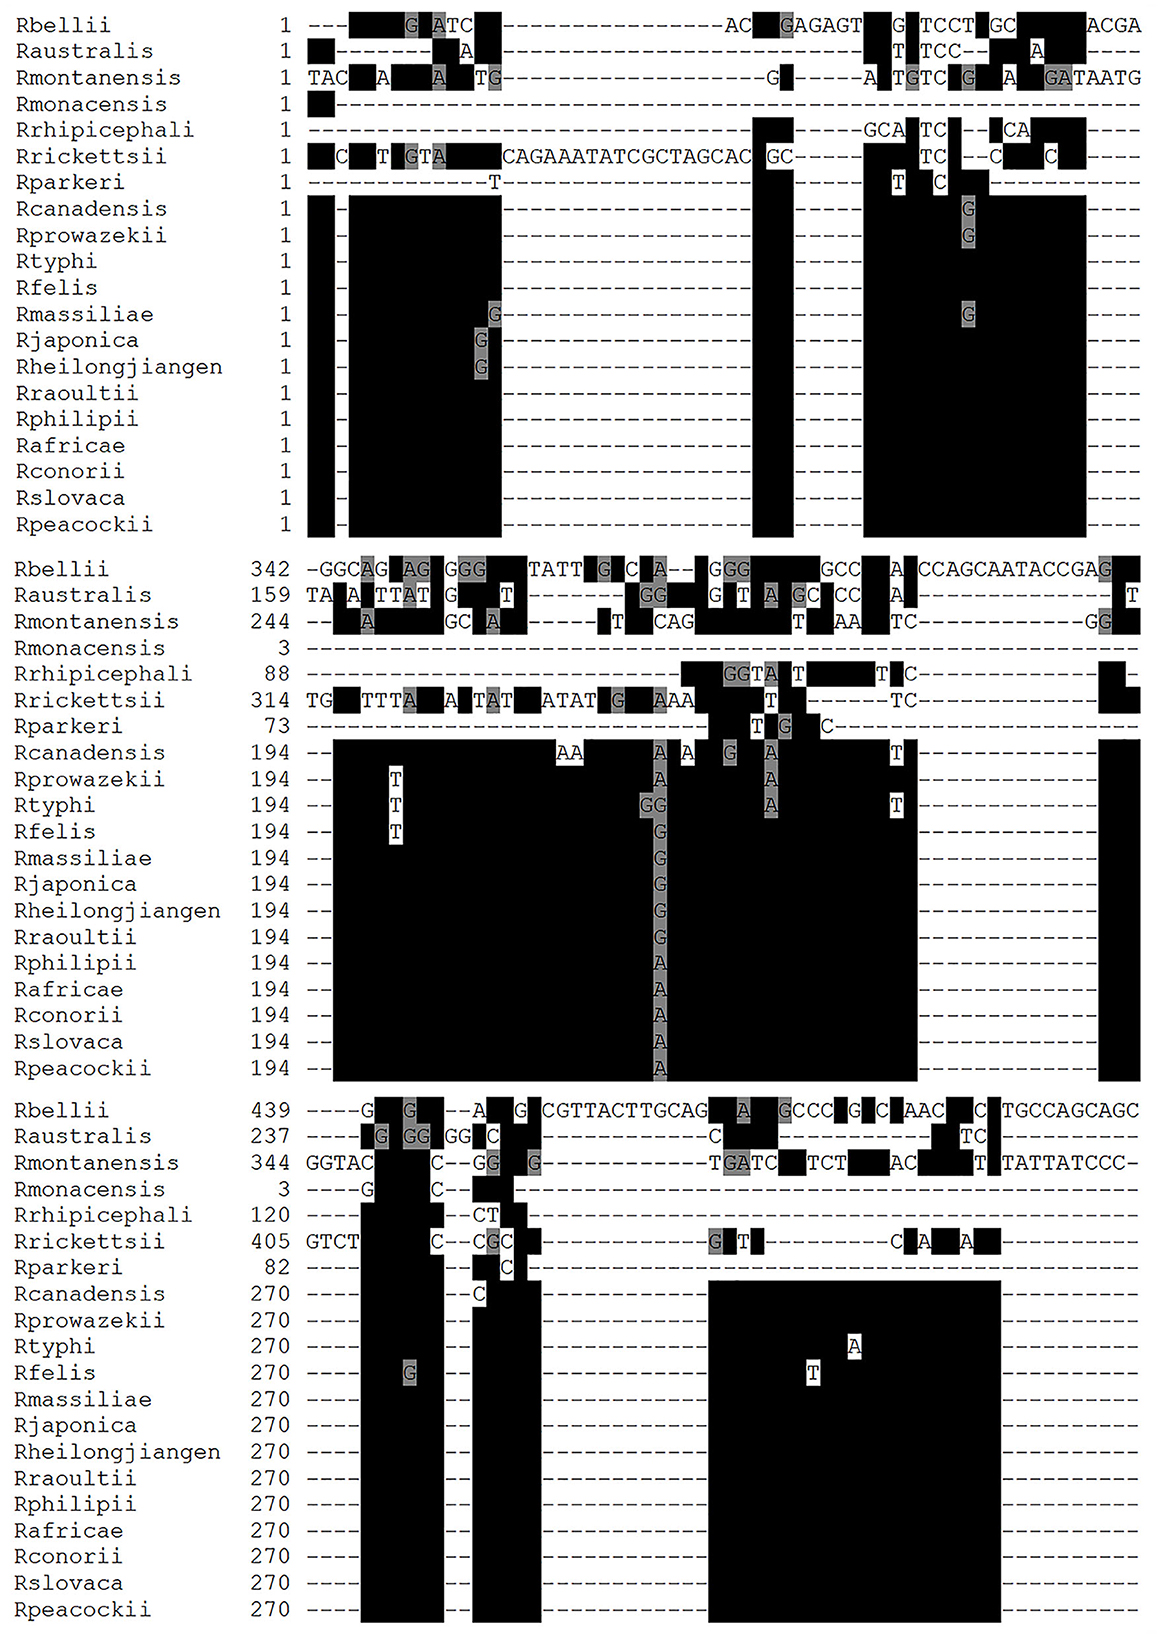
Figure 1. Multiple alignment using the nucleic acid sequences of Rickettsia species. Nucleic acid sequences of unknown genes from Rickettsia rickettsii (R. rickettsii), Rickettsia amblyommii (R. amblyommatis), Rickettsia montamensis (R. montamensis), Rickettsia rhipicephali (R. rhipicephali), Rickettsia massiliae (R. massiliae), Rickettsia japonica (R. japonica), Rickettsia heilongjiangensis (R. heilongjiangensis), Rickettsia africae (R. africae), Rickettsia philipii (R. philipii), Rickettsia slovaca (R. slovaca), Rickettsia parkeri (R. parkeri), Rikettsia felis (R. felis), Rickettsia akari (R. akari), Rickettsia peacockii (R. peacockii), Rickettsia bellil (R. bellil), Rickettsia australis (R. australis), Rickettsia conorii (R. conorii), and Rickettsia rhipicephali (R. rhipicephali). The alignments were generated using the MUSCLE program and edited by the BOXSHADE program. The black box shows homologous sequences indicated with *, and the gray box denotes similar sequences.
The sensitivity of the reaction showed a lower limit of detection for this LAMP assay was 3.0 × 10⁻⁵ or 0.003 ng (Figure 2). When the sensitivity was determined using a clinical positive sample, the lowest limit of detection was 1.6 × 10⁻⁵ or 1.6 pg. The limit of detection by conventional PCR was of 3.0 × 10⁻² or 0.03 pg using the recombinant plasmid as positive control (Figure 2). These results show that the LAMP assay is 1,000 times more sensitive than conventional PCR for the detection of R. rickettsii DNA. The reproducibility of the LAMP assay was evaluated using DNA from clinical samples and analyzed three times.
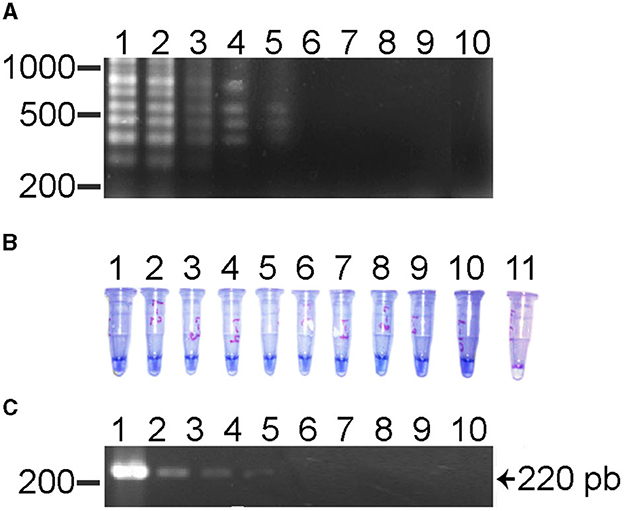
Figure 2. Sensitivity test for the LAMP test and its comparison with the PCR for the detection of R. rickettsii. (A) LAMP assay using serial dilutions (1010) with DNA of a clinical sample. Lane 1, 101 or 30 ng; lane 2, 10−2 or 3 ng; lane 3, 10−3 or 0.3 ng; lane 4, 10−4 or 0.03 ng; lane 5, 10−5 or 0.003 ng; lane 6, 10−6 or 0.0003 ng; lane 7, 10−7 or 0.00003 ng; lane 8, 10−8 or 0.000003; lane 9, 10−9 or 0.0000003 ng; lane 10 is a negative control. (B) HNB LAMP assay using serial dilutions (1010) using DNA of a clinical sample. Lane 1, 101 or 30 ng; lane 2, 10−2 or 3 ng; lane 3, 10−3 or 0.3 ng; lane 4, 10−4 or 0.03 ng; lane 5, 10−5 or 0.003 ng; lane 6, 10−6 or 0.0003 ng; lane 7, 10−7 or 0.00003 ng; lane 8, 10−8 or 0.000003; lane 9, 10−9 or 0.0000003 ng; lane 10 is a negative control. (C) PCR assay's serial dilution (1010) using a clinical sample DNA. Lane 1, 101 or 30 ng; lane 2, 10−2 or 3 ng; lane 3, 10−3 or 0.3 ng; lane 4, 10−4 or 0.03 ng; lane 5, 10−5 or 0.003 ng; lane 6, 10−6 or 0.0003 ng; lane 7, 10−7 or 0.00003 ng; lane 8, 10−8 or 0.000003; lane 9, 10−9 or 0.0000003 ng; lane 10 is a negative control.
The results of experiments to evaluate the specificity of the LAMP test showed that a positive reaction was only observed in the R. rickettsii DNA sample; the DNA samples from other nine species of Rickettsia (Figure 3A) nor the Ehrlichia, Borrelia, Anaplasma species or the human DNA sample did not show amplification (Figure 3B). These results confirmed that the sequences of the primers aligned only with the R. rickettsii template, and that no false positive or non-specific amplifications were observed when other related DNA templates were used, which indicates the high specificity of this test.
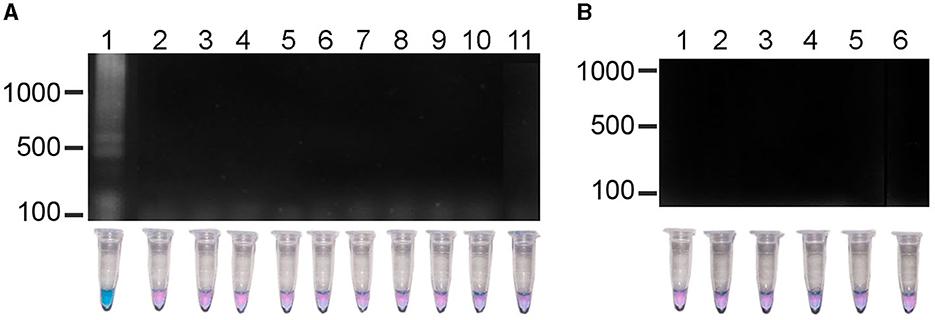
Figure 3. Specificity of the LAMP method in the detection R. rickettsii. (A) Lane 1, R. rickettsii, DNA of clinical sample; lane 2, R. typhi; lane 3, R. japonica; lane 4, R. helvetica; lane 5, R. australis; lane 6, R. conorii; lane 7, R. felis; lane 8, R. prowasekii; lane 9, R. africae; lane 10, R. parkeri; lane 11, R. slovaca. (B) Lane 1, Ehrlichia chaffensiis; lane 2, E. cannis; lane 3, Borrelia burgdorferi; lane 4, Anaplasma phagocytophilum; lane 5; Anaplasma marginale; lane 6, human DNA.
Additionally, the minimum time necessary for DNA amplification was evaluated using the LAMP technique. As seen in Figure 4, in a reaction at 63°C, the minimum time required to observe a positive amplification on electrophoresis was 30 min (Figure 4, lane 2). The characteristic smear of a LAMP assay was observed within the 45 min and 60 min (Figure 4, lanes 3 and 4). When the use of HNB as an indicator of a positive signal was analyzed, the color of the test reaction was observed to change according to the concentration of Mg2+ ions. The color change of HNB in positive samples turned from violet to sky blue, in the 30 min time evaluated and did not change after this time (Figure 4, lanes 2–4), indicating a positive reaction. On the other hand, no change in color was observed in the negative control (Figure 4, lane 1).
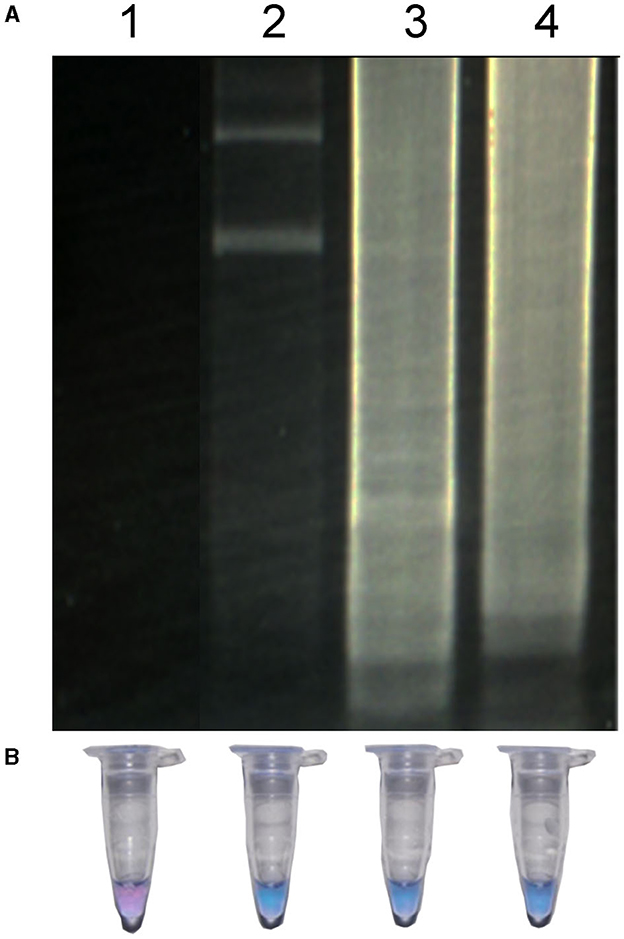
Figure 4. LAMP of R. rickettsia DNA at different times detected by agarose gel (A) and by visual detection (B). Lane 1, negative control; lane 2, LAMP reaction for 30 min; lane 3, LAMP reaction for 45 min; LAMP reaction for 60 min.
The results showed that in human clinical samples for LAMP-HNB, 28 samples were positive and 51 were negatives with an accuracy of 77% (95% CI: 67.3–84.5%) and k = 0.53 (95% CI: 0.35–0.70%); with 22 false positives and 2 false negatives (Table 2). For LAMP visualized by electrophoresis, we observed an accuracy of 69% (95% CI: 59–77.7%) and k = 0.42 (95% CI: 0.26–0.58%), with 29 positive samples, 42 negative samples, 31 false positive samples and one false negative. On the other hand, in tick DNA samples evaluated using the LAMP-HNB test, as shown in Table 2, 12 samples were positive, 14 were negative, one false positive and three false negative. Regarding LAMP analyzed by electrophoresis, there were 13 positive and 13 negative samples, two false positives and two false negatives. The accuracy value was 86.7% (95% CI: 69.3–96.2%) for both, the HNB and the electrophoresis methods. The k was 0.73 (95% CI: 0.38–1%) for both methods as well.
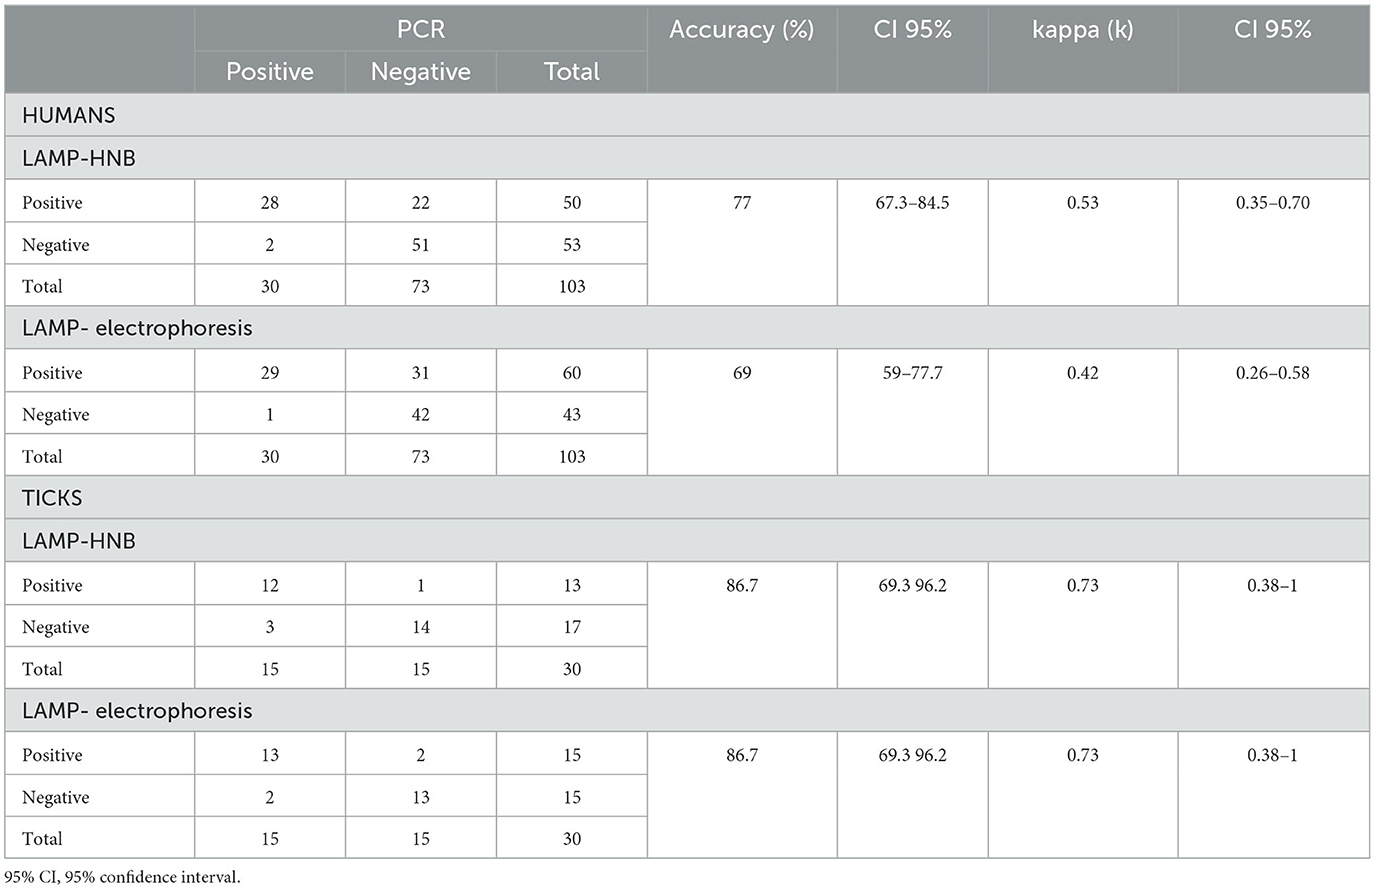
Table 2. Results using the LAMP and PCR methods in human and tick samples and their level of agreement.
Additionally, the concordance between colorimetry and electrophoresis was estimated as visualization methods of the LAMP test results for both human and tick samples (Table 3). For human clinical samples, out of 50 positive samples determined by electrophoresis, 50 were positive using HNB, while out of 53 negative samples determined by electrophoresis, 43 were negative using HNB, which obtained a k value of 0.82 (95% CI: 0.63–1.0%). For tick DNA samples, out of 13 positive samples determined by electrophoresis, 13 were positive when HNB was used, while out of 17 negative samples determined by electrophoresis, 15 were negative using HNB, which gave a k value of 0.87 (95% CI: 0.51–1.0%) (Table 3). This results, indicate that there is a very good agreement between both visualization methods (Landis and Koch, 1977).
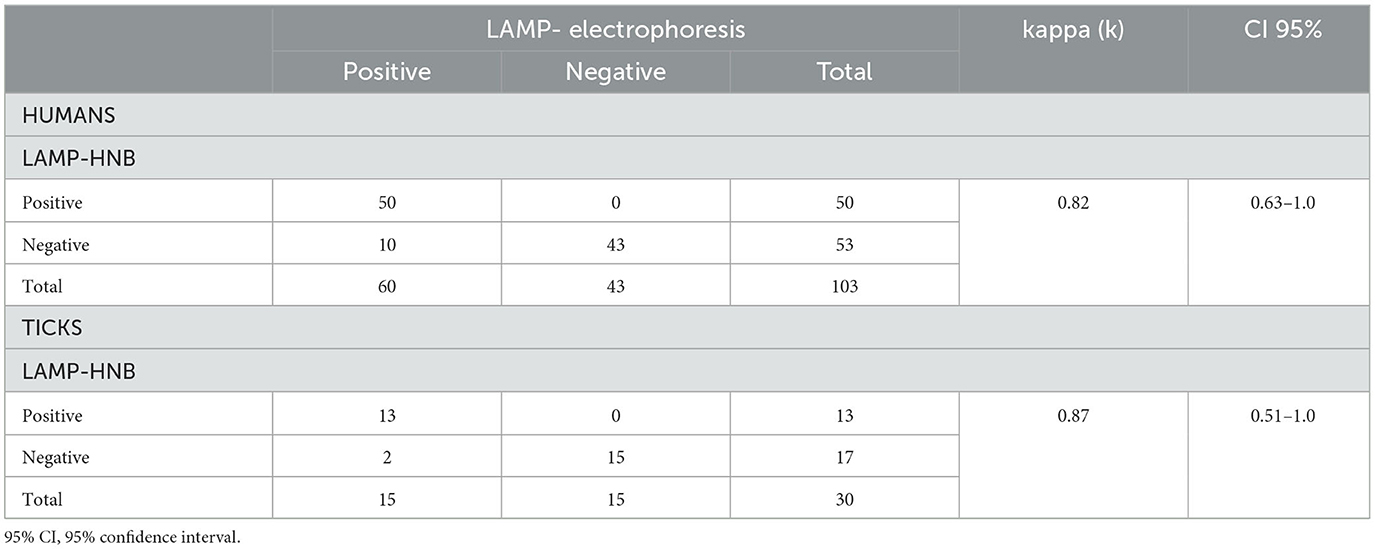
Table 3. Results using the LAMP-HNB and LAMP-ELECTROPHORESIS methods in human and tick samples and their level of agreement.
The diagnostics performance of the LAMP method when compared with the reference PCR method when human samples were used showed a sensitivity of 93% (95% CI: 77.9–99.2%) and a specificity of 70% (95% CI: 58.62–80.03%), in the human DNA samples when using the LAMP-HNB technique (Table 4). When the LAMP method was visualized by electrophoresis, the sensitivity obtained was 97% (95% CI: 82.7–99.9%) and the specificity was 58% (95% CI: 45.4–69%) (Table 4).
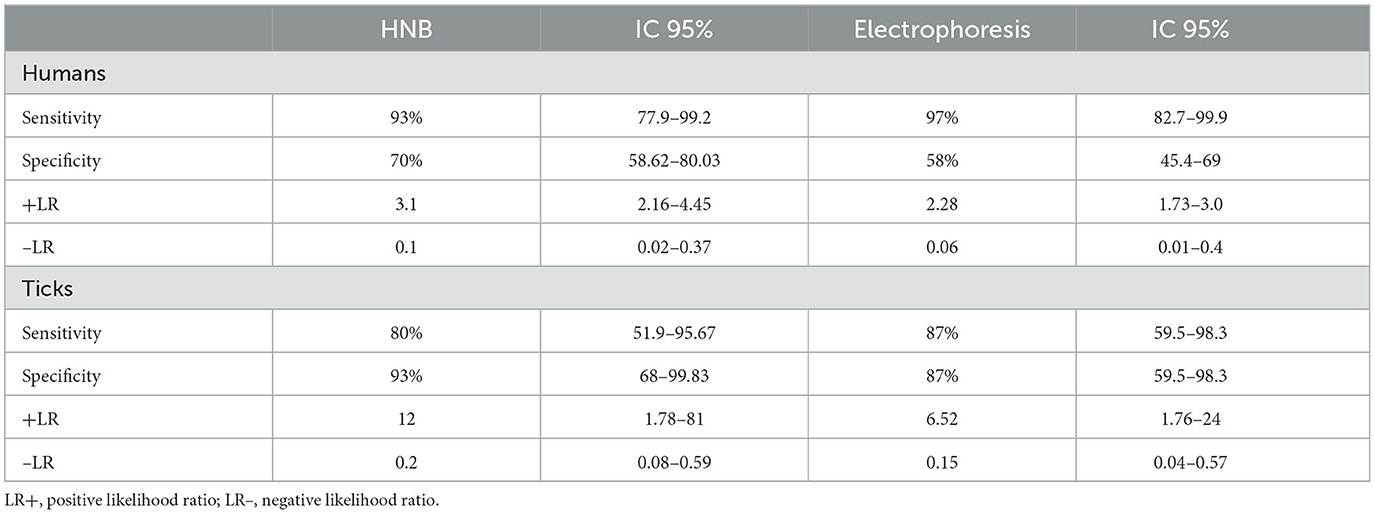
Table 4. Diagnostics performance of the LAMP-HNB and LAMP-ELECTROPHORESIS methods when compared with the reference PCR method in human and tick DNA samples.
The positive likelihood ratio (+LR) obtained in LAMP-HNB was 3.1 (95% CI: 2.16–4.45) (Table 4). The negative likelihood ratio (–LR) was 0.1 (CI 95%: 0.02–0.37). For the LAMP method visualized by electrophoresis, the +RV was 2.28 (95% CI: 1.73–3.0), while the -RV was 0.06 (95% CI: 0.01–0.4). Therefore, according to Aznar-Oroval et al. (2013), the RV + of both visualization methods is considered low and the – RV is excellent.
On the other hand, the diagnostics performance of the LAMP method when compared with the reference PCR method when tick samples were used showed a sensitivity of 80% (95% CI: 51.9–96.67%) and a specificity of 93% (95% CI: 68–99.83%) using the LAMP-HNB technique. In the LAMP method visualized by electrophoresis, the sensitivity determined was 87% (95% CI: 59.5–98.3%) and a specificity of 87% (95% CI: 59.5–98.3%) (Table 4).
Additionally, the likelihood ratios obtained in LAMP-HNB, it was 12 (95% CI: 1.78–81) for LR + and LR– it was 0.2 (CI 95%: 0.08–0.59); in LAMP visualized by electrophoresis, LR + was 6.52 (95% CI: 1.76–24) and 0.2 (95% CI: 0.0–0.59) for LR–. Therefore, the LR + in LAMP-HNB is considered excellent (>10), and for the LAMP visualized by electrophoresis, it is considered good (5–10). The LR- of both is considered good (0.1–0.2) (Table 4). According to the results obtained, both methods could confirm or rule out suspected infection with the pathogen, with high confidence (Aznar-Oroval et al., 2013).
The positive and negative post-test probabilities, which is the probability that a patient is sick or not after applying the diagnostic test (van Stralen et al., 2009), were evaluated using the diagnostic test calculator (http://araw.mede.uic.edu/cgi-bin/testcalc.pl). As shown in Table 5, the result showed that in the LAMP-HNB technique, the positive post-test probability is 56% (95% CI: 46–64%), while the negative post-test probability is 4% (95% CI: 1–13%). These results indicate that 1 in 1.8 with a positive diagnosis are actually infected and 1 in 1 with a negative diagnosis are uninfected. For LAMP visualized by electrophoresis, the positive post-test probability is 48% (95% CI: 42–55%), while the negative post-test probability is 2% (95% CI: 0–14%) (Table 5). These results mean that 1 in 2.1 individuals with a positive diagnosis are infected and 1 in 1 individuals with a negative diagnosis are uninfected (Douglas, 1991; Schwartz, 2006).
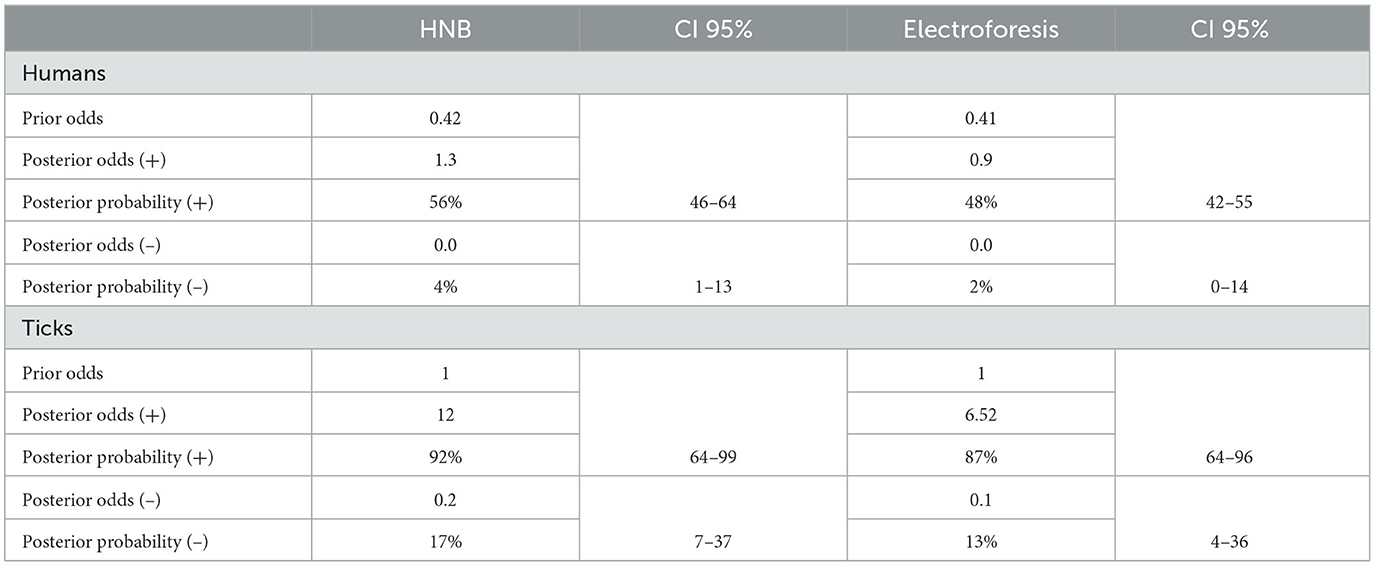
Table 5. Pre-test and post-test probability analysis using LAMP.
Additionally, the results obtained using tick samples for LAMP-HNB showed that the positive post-test probability was 92% (95% CI: 64–99%), and the negative post-test probability is 17% (95% CI: 7–37%) (Table 5). These results indicate that 1 in 1.1 ticks with a positive infection are infected and 1 in 1.2 ticks with a negative diagnosis are uninfected. On the other hand, for LAMP visualized by electrophoresis, the positive post-test probability is 87% (95% CI: 64–96%), while the negative post-test probability is 13% (95% CI: 4–36%). This results mean that 1 in 1.2 ticks with a positive diagnosis are actually infected, while 1 in 1.2 ticks with a negative diagnosis are uninfected (Douglas, 1991; Schwartz, 2006).
The sequence primers and the methodology were submited for patent as “SYNTHETIC OLIGONUCLEOTIDES SPECIFIC FOR THE DETECTION OF GENETIC MATERIAL OF RICKETTSIA RICKETTSII AND ITS DETECTION METHOD”, file number: MX/a/2022/003615. Date of submission: 20/04/2022.
Globally, hundreds of RMSF cases are reported annually. This highly lethal tick-borne infectious disease is distributed throughout the Americas (Álvarez-López et al., 2021).1 However, as a result of delayed diagnosis or misdiagnosis, a substantial number of cases remain undetected, leading to significant morbidity and mortality. Therefore, diagnosis is essential for rapid and accurate detection of the pathogen (Yang and Rothman, 2004). Recent outbreaks of rickettsiosis underscore the critical need for the development of reliable and specific diagnostic methods, particularly those based on early and affordable detection, which ultimately help decrease mortality rates (Álvarez-Hernández et al., 2017; Jay and Armstrong, 2020). Diagnosis is critical for RMSF, as its symptoms are easily misattributed to other arthropod-borne diseases, such as dengue, Zika, and malaria, which require entirely different treatments.
Unfortunately, conventional methods for identifying R. rickettsii in hospitals or laboratories are associated with prolonged turnaround times and expensive tests. One of the major challenges in developing a good diagnostic method is that it must reduce the duration between the administration of the test and the availability of its results while being affordable and high in sensitivity to detect the pathogen, even in patients who have received antibiotic treatment.
The development of a novel diagnostic test should offer advantages compared to existing options, offering advantages such as reduced processing time, ease of access, and cost-effectiveness, and minimal invasiveness and risk (Trevethan, 2017). In this study, we have developed a simple, rapid (< 1 h), and cost-effective diagnostic approach. Considering the progression of the RMSF disease, a swift diagnosis can help the initiation of treatment, effectively managing the disease and thereby reducing mortality (Banoo, 2010).
The analytical sensitivity and specificity of LAMP assay for the detection of RMSF demonstrate that clinical samples can be analyzed without sophisticated equipment, as only an easy-to-use water bath is required. Therefore, this LAMP assay is a potentially valuable tool for the rapid detection of RMSF.
Generally, molecular detection methods such as PCR or qPCR require the use of specific primers for the Rickettsia genus; however, at the species levels, it is necessary to amplify and sequence different genes such as gltA, ompA, and/or ompB (Parola et al., 2005). Nevertheless, these genes are not divergent enough to distinguish between all rickettsial species (Roux and Raoult, 1993, 1995; Roux et al., 1996, 1997). Furthermore, the sensitivity was determined using 10-fold serial dilutions of plasmid DNA containing a partial sequence of an unknown gene. The sensitivity was found to be very high in the LAMP method (>10−5) compared to the PCR method. This could be due to the use of two specially designed loop primers. It has been shown, for other diseases, that the LAMP method exhibits a higher sensitivity when compared to conventional PCR, yet it is similar to real-time PCR (Nakao et al., 2013).
We evaluated and compared all the Rickettsia genomes in the available databases to obtain a specific sequence for the identification of R. rickettsii that was present in all available isolates. Many studies have shown variations in the pathogenic biotypes of R. rickettsii isolates and quantified their correlation with the clinical manifestations of RMSF (Karpathy et al., 2007; Eremeeva and Dasch, 2009). Specific primers were designed for sequences specific to R. rickettsii, with their specificity verified through bioinformatic analysis. Further in vitro verification was conducted using DNA samples from 18 Rickettsia species and other members of the Rickettsia genus, such as A. phagocitophylum and E. chaffensis, as well as other pathogens transmitted by ticks, such as B. burgdorferi.
Molecular detection methods can be expensive and demand specialized equipment and conditions, posing challenges for outdated or traditional hospital laboratories, especially in “fringe” or remote areas. The LAMP reaction can be visualized by detecting the DNA products in an agarose gel. However, this may not be necessary because a positive LAMP reaction causes the solution to become cloudy due to the formation of a magnesium pyrophosphate byproduct, and HNM is a colorimetric indicator that changes according to the concentration of Mg2+ ions depending on the pH of the solution (Goto et al., 2009). Some parameters (e.g., the turbidity of the solution) are highly correlated with the amount of DNA synthesized, and their measurement requires a real-time turbidimeter, which is prohibitively expensive. This cost factor not only reduces the versatility of LAMP but also significantly limits its potential widespread use of this procedure, especially in developing countries or “marginal” areas (Mori et al., 2001, 2004).
LAMP can be considered as an alternative to PCR-based methods for the early detection of R. ricketssii in scenarios where expensive or specialized equipment, such as thermocycler or real-time PCR, is not available; rather, it only requires the master mix, the DNA sample, and a heating block or water bath to maintain a constant temperature.
The results obtained using human clinical samples indicated a moderate agreement in precision and kappa index between HNB and electrophoresis, according to the evaluation criteria established by Landis and Koch (1977). Conversely, the results obtained using DNA from tick samples showed that the level of agreement was good for HNB and electrophoresis.
Additionally, the concordance between colorimetry and electrophoresis was estimated as visualization methods of the LAMP test results for both human and tick samples. These results indicate that there is a very good agreement between both visualization methods (Landis and Koch, 1977).
It should be noted that the discrepancy in the degree of concordance between the human and tick clinical samples may be due to the technique used. Specifically, the technique used for the human clinical samples was endpoint PCR, whereas for the tick samples, it was nested PCR, known for its higher sensitivity and specificity compared to endpoint PCR (Loeffelholz and Deng, 2006), for which there is a better degree of agreement with our LAMP method.
We observed that the results from HNB or electrophoresis did not align with the expected estimates (sensitivity 98%, specificity 95%, with a confidence of 95% and error of 5%). In the case of sensitivity, the difference is small, but the specificity is much lower than estimated. However, upon reassessment to achieve the expected values, it was determined that the number of samples should be increased for both indicators (OIE, 2018). The likelihood ratios, indicating the increased likelihood of obtaining a specific result (positive or negative), reveal that the LAMP method, when compared with the reference PCR method for human samples, exhibits a low RV+ for both visualization methods, while the RV– is excellent (Aznar-Oroval et al., 2013). In addition, when assessing the diagnostics performance of the LAMP method against the reference PCR method in tick samples, the LR+ in LAMP-HNB is considered excellent, while for the LAMP visualized by electrophoresis, it is considered good. The LR– of both methods is considered good. According to the results obtained, both methods could confirm and rule out suspected infection with the pathogen, with high confidence (Aznar-Oroval et al., 2013).
On the other hand, when assessing the positive and negative posttest probabilities, which is the probability that a patient is sick or not after applying the diagnostic test (van Stralen et al., 2009), the result indicated that the positive and negative posttest probabilities in the LAMP-HNB technique indicate that 1 in 1.8 with a positive diagnosis are infected and 1 in 1 with a negative diagnosis are uninfected. For LAMP visualized by electrophoresis, these results mean that 1 in 2.1 individuals with a positive diagnosis are infected and 1 in 1 individual with a negative diagnosis are uninfected (Douglas, 1991; Schwartz, 2006). Furthermore, the results obtained using tick samples for LAMP-HNB indicate that 1 in 1.1 ticks with a positive infection are infected and 1 in 1.2 ticks with a negative diagnosis are uninfected. On the other hand, for LAMP visualized by electrophoresis, these results mean that 1 in 1.2 ticks with a positive diagnosis are infected, while 1 in 1.2 ticks with a negative diagnosis are uninfected (Douglas, 1991; Schwartz, 2006). Therefore, when evaluating a diagnostic test, it is essential to understand and interpret its intrinsic properties (sensitivity and specificity). Recognizing that the predictive values and the degrees of probability are better indicators in practice, they play a crucial role in determining the usefulness of the method for diagnosis and aiding in decision-making (Trevethan, 2017).
In selecting a new diagnostic technique, it should not only possess intrinsic characteristics but also offer additional advantages compared to previous techniques, supporting its application. These advantages may include obtaining results in less time, a simpler application, a reduced cost, increased accessibility, minimal invasiveness and risk, user acceptance and, above all, the capability for technology transfer (Trevethan, 2017). Furthermore, the course of the disease should be taken into consideration, including whether it is severe, asymptomatic, or contagious. Therefore, a rapid diagnosis can be crucial in initiating timely treatment, especially when the course of the disease requires it, and it can be treated effectively, reducing the risk of it (Banoo, 2010). The LAMP test for R. rickettsii evaluated in this study offers comparative advantages with respect to the reference standards used. These advantages are the low cost of the test, prompt results, as well as the fact that its interpretation can be done using colorimetric visualization (HNB), or electrophoresis, since they present a high degree of agreement. LAMP is easier to perform compared to PCR, and above all, it does not require specialized equipment.
Currently, the application of LAMP for the molecular detection of Rickettsia spp., scrub typhus and murine typhus, has been reported (Dittrich et al., 2014; Hanaoka et al., 2017; Roy et al., 2021). According to the criteria of the World Health Organization (WHO, 2021), the new LAMP technique for R. rickettsii meets many of the requirements of a molecular detection method, including low cost, simplicity, speed, robustness, and easy availability of instruments and equipment.
The raw data supporting the conclusions of this article will be made available by the authors, without undue reservation.
The studies involving humans were approved by Bioethics Committee, Natural Sciences College, Autonomous University of Queretaro. The studies were conducted in accordance with the local legislation and institutional requirements. The human samples used in this study were acquired from gifted from another research group. Written informed consent for participation was not required from the participants or the participants' legal guardians/next of kin in accordance with the national legislation and institutional requirements. The animal study was approved by Bioethics Committee, Natural Sciences College, Autonmous University of Queretaro. The study was conducted in accordance with the local legislation and institutional requirements.
BC-G: Formal analysis, Investigation, Methodology, Writing – original draft, Writing – review & editing. AO-B: Investigation, Validation, Writing – original draft, Writing – review & editing. LT-G: Resources, Writing – review & editing, Data curation, Supervision. GG-P: Investigation, Methodology, Resources, Supervision, Writing – review & editing. KD-R: Resources, Writing – review & editing, Validation. GA-T: Resources, Writing – review & editing, Data curation. MH-R: Data curation, Writing – review & editing, Investigation. JM: Writing – review & editing, Conceptualization, Funding acquisition, Resources, Supervision.
The author(s) declare financial support was received for the research, authorship, and/or publication of this article. This work was supported by grants from CONACYT-Problemas Nacionales (PN2017-7256) to JM, FOFIUAQ-2018 (1299, Program: 20501419082502) to BC-G and CMN SXXI FIS/IMSS/MD17/1688 to GG-P.
The authors declare that the research was conducted in the absence of any commercial or financial relationships that could be construed as a potential conflict of interest.
All claims expressed in this article are solely those of the authors and do not necessarily represent those of their affiliated organizations, or those of the publisher, the editors and the reviewers. Any product that may be evaluated in this article, or claim that may be made by its manufacturer, is not guaranteed or endorsed by the publisher.
1. ^Centers for Disease Control and Prevention. Rocky Mountain Spotted Fever, Epidemiology and Statistics. Available online at: https://www.cdc.gov/rmsf/stats/index.html (accessed May 18, 2023).
Almazán, C., Reyes de Luna, G., Tinoco-Gracia, L., González-Álvarez, V. H., Zajac, Z., Kulisz, J., et al. (2023). Morphological and molecular identification of the brown dog tick in Mexico. Vet. Parasitol. Reg. Stud. Rep. 44, 100908. doi: 10.1016/j.vprsr.2023.100908
Álvarez-Hernández, G., Roldán, J. F. G., Milan, N. S. H., Lash, R. R., Behravesh, C. B., and Paddock, C. D. (2017). Rocky Mountain spotted fever in Mexico: past, present, and future. Lancet Infect. Dis. 17, e189–e196. doi: 10.1016/S1473-3099(17)30173-1
Álvarez-López, D. I., Ochoa-Mora, E, Nichols Heitman, K, Binder, A. M., Álvarez-Hernández, G., and Armstrong, P. A. (2021). Epidemiology and clinical features of rocky mountain spotted fever from enhanced surveillance, Sonora, Mexico: 2015-2018. Am. J. Trop. Med. Hyg. 104, 190–197. doi: 10.4269/ajtmh.20-0854
Aznar-Oroval, E., Mancheno, A., García-Lozano, T., and Sánchez-Yepes, M. (2013). Likelihood ratio and Fagan's nomogram: 2 basic tools for the rational use of clinical laboratory tests. Rev. Calid. Asist. 390–393. doi: 10.1016/j.cali.2013.04.002
Banoo, S., Bell, D., Bossuyt, P., Herring, A., Mabey, D., Poole, F., et al. (2010). Evaluation of diagnostic tests for infectious diseases: general principles. Nat. Rev. Microbiol. 8(12 Suppl), S17–S29.
Bergeron, J. W., Braddom, R. L., and Kaelin, D. L. (1997). Persisting impairment following Rocky Mountain Spotted Fever: a case report. Arch. Phys. Med. Rehabil. 78, 1277–1280. doi: 10.1016/S0003-9993(97)90345-2
Conlon, P. J., Procop, G. W., Fowler, V., Eloubeidi, M. A., Smith, S. R., and Sexton, D. J. (1996). Predictors of prognosis and risk of acute renal failure in patients with Rocky Mountain spotted fever. Am. J. Med. 101, 621–626. doi: 10.1016/S0002-9343(96)00332-4
Costa, F. B., Gerardi, M., Binder, L. C., Benatti, H. R., Serpa, M. C. A., Lopes, B., et al. (2020). Rickettsia rickettsii (Rickettsiales: Rickettsiaceae) Infecting Amblyomma sculptum (Acari: Ixodidae) Ticks and Capybaras in a Brazilian Spotted Fever-Endemic Area of Brazil. J. Med. Entomol. 57, 308–311. doi: 10.1093/jme/tjz141
Dergousoff, S. J., Galloway, T. D., Lindsay, L. R., Curry, P. S., and Chilton, N. B. (2013). Range expansion of Dermacentor variabilis and Dermacentor andersoni (Acari:Ixodidae) near their northern distributional limits. J. Med. Entomol. 50, 510–520. doi: 10.1603/ME12193
Dittrich, S., Castonguay-Vanier, J., Moore, C. E., Thongyoo, N., Newton, P. N., and Paris, D. H. (2014). Loop-mediated isothermal amplification for Rickettsia typhi (the causal agent of murine typhus): problems with diagnosis at the limit of detection. J. Clin. Microbiol. 52, 832–838. doi: 10.1128/JCM.02786-13
Eremeeva, M., and Dasch, G. A. (2009). Closing the gaps between genotype and phenotype in Rickettsia rickettsii. Ann. N. Y. Acad. Sci. 1166, 12–26. doi: 10.1111/j.1749-6632.2009.04526.x
Eremeeva, M., Dasch, G. A., and Silverman, D. J. (2003). Evaluation of a PCR assay for quantitation of Rickettsia rickettsii and closely related spotted fever group Rickettsiae. J. Clin. Microbiol. 41, 5466–5572. doi: 10.1128/JCM.41.12.5466-5472.2003
Goto, M., Honda, E., Ogura, A., Nomoto, A., and Hanaki, K. I. (2009). Colorimetric detection of loop mediated isothermal amplification reaction by using hydroxy naphthol blue. Short Tech. Rep. 46, 167–172. doi: 10.2144/000113072
Hanaoka, N., Matsutani, M., Satoh, M., Ogawa, M., Shirai, M., and Ando, S. (2017). Development of a novel loop-mediated isothermal amplification (LAMP) assay for the detection of Rickettsia spp. Jpn. J. Infect. Dis. 70, 119–123. doi: 10.7883/yoken.JJID.2015.579
Helmick, C. G., Bemard, K. W., and D'Angelo, L. J. (1984). Rocky Mountain spotted fever: clinical, laboratory, and epidemiological features of 262 cases. J. Infect. Dis. 150, 480–488. doi: 10.1093/infdis/150.4.480
Horney, L. F., and Walker, D. H. (1988). Meningoencephalitis as a major manifestation of Rocky Mountain spotted fever. South. Med. J. 81, 915–918. doi: 10.1097/00007611-198807000-00028
Hove, M. G., and Walker, D. H. (1995). Persistence of rickettsiiae in the partially viable gangrenous margins of amputated extremities 5–7 weeks after onset of Rocky Mountain spotted fever. Arch. Pathol. Lab. Med. 119, 429–431.
Ibarra Stone, K. A., Solis, J. G., Blanco-Lemus, E., Malagón-Rangel, J., and Gordillo-Perez, G. (2022). Spotted fever: an undercover cause of hemophagocytic lymphohistiocytosis in the immediate postpartum. Case Rep. Infect. Dis. 2022, 3348393. doi: 10.1155/2022/3348393
Jackson, M. D., Kirkman, C., Bradford, W. D., and Walker, D. H. (1986). Rocky mountain spotted fever: hepatic lesions in childhood cases. Pediatr. Pathol. 5, 379–388. doi: 10.3109/15513818609068864
Jay, R., and Armstrong, P. A. (2020). Clinical characteristics of Rocky Mountain spotted fever in the United States: a literature review. J. Vector Borne Dis. 57, 114–120. doi: 10.4103/0972-9062.310863
Kaplan, J. E., and Schonberger, L. B. (1986). The sensitivity of various serologic tests in the diagnosis of Rocky Mountain spotted fever. Am. J. Trop. Med. Hyg. 35, 840–844. doi: 10.4269/ajtmh.1986.35.840
Karpathy, S. E., Dasch, G. A., and Eremeeva, M. E. (2007). Molecular typing of isolates of Rickettsia rickettsii by use of DNA sequencing of variable intergenic regions. J. Clin. Microbiol. 45, 2545–2553. doi: 10.1128/JCM.00367-07
Kirkland, K. B., Wilkinson, W. E., and Sexton, D. J. (1995). Therapeutic delay and mortality in cases of Rocky Mountain spotted fever. Clin. Infect. Dis. 20, 1118–1121. doi: 10.1093/clinids/20.5.1118
Landis, J., and Koch, G. (1977). The measurement of observer agreement for categorical data. Biometrics 159–174. doi: 10.2307/2529310
Levin, M. L., Zemtsova, G. E., Killmaster, L. F., Snellgrove, A., and Schumacher, L. B. M. (2017). Vector competence of Amblyomma americanum (Acari: Ixodidae) for Rickettsia rickettsii. Ticks Tick Borne Dis. 8, 615–622. doi: 10.1016/j.ttbdis.2017.04.006
Loeffelholz, M., and Deng, H. (2006). “PCR and its variations,” Advanced Techniques in Diagnostic Microbiology, eds Y.-W. En Tang, and C. Stratton (Boston, MA: Springer), 166–183.
Martínez-Diaz, H. C., Forero-Becerra, E., Hidalgo, M., and Labruna, M. B. (2021). Experimental infection and vector competence of Amblyomma patinoi, a member of the Amblyomma cajennense species complex, for the human pathogen Rickettsia rickettsii. Ticks Tick Borne Dis. 12, 101751. doi: 10.1016/j.ttbdis.2021.101751
Mexican Official STANDARD NOM-032-SSA2-2014 (2015). For Epidemiological Surveillance, Promotion, Prevention, and Control of Diseases Transmitted by Vectors. Available online at: https://www.dof.gob.mx/nota_detalle.php?codigo=5389045&fecha=16/04/2015#gsc.tab=0 (accessed March 10, 2023).
Mori, Y., Kitao, M., Tomita, N., and Notomi, T. (2004). Real-time turbidimetry of LAMP reaction for quantifying template DNA. J. Biochem. Biophys. Methods 59, 145–157. doi: 10.1016/j.jbbm.2003.12.005
Mori, Y., Nagamine, K., Tomita, N., and Notomi, T. (2001). Detection of loop-mediated isothermal amplification reaction by turbidity derived from magnesium pyrophosphate formation. Biochem. Biophys. Res. Commun. 289, 150–154. doi: 10.1006/bbrc.2001.5921
Nakao, R., Qiu, Y., Igarashi, M., Magona, J. W., Zhou, L., Ito, K., et al. (2013). High prevalence of spotted fever group rickettsiae in Amblyomma variegatum from Uganda and their identification using sizes of intergenic spacers. Ticks Tick Borne Dis. 4, 506–512. doi: 10.1016/j.ttbdis.2013.07.001
Notomi, T., Okayama, H., Masubuchi, H., Yonekawa, T., Watanabe, K., Amino, N., et al. (2000). Loop-mediated isothermal amplification of DNA. Nucleic Acids Res. 28, e63. doi: 10.1093/nar/28.12.e63
OIE (2018). “Chapter 1.1.6. Validation of diagnostic tests,” in OIE, Manual of Diagnostic Tests and Vaccines for Terrestrial Animals, eds A. Colling and I. Gardner (Paris), 196–237.
Oteo, J. A., Nava, S., Sousa, R. d., Mattar, S., Venzal, J. M., Abarca, K., et al. (2014). Guías Latinoamericanas de la RIICER para el diagnóstico de las rickettsiosis transmitidas por garrapatas [Latinamerican guidelines of RIICER for diagnosis of tick-borne rickettsioses]. Revista chilena de infectologia : organo oficial de la Sociedad Chilena de Infectologia 31, 54–65. doi: 10.4067/S0716-10182014000100009
Paddock, C. D., Holman, R. C., and Krebs, J. W. (2002). Assessing the magnitude of fatal Rocky Mountain spotted fever in the United States: comparison of two national data sources. Am. J. Trop. Med. Hyg. 67, 349–354. doi: 10.4269/ajtmh.2002.67.349
Parola, P., Paddock, C. D., and Raoult, D. (2005). Tick-borne Rickettsioses around the world: emerging diseases challenging old concepts. Clin. Microbiol. Rev. 18, 719–756. doi: 10.1128/CMR.18.4.719-756.2005
Parola, P., Paddock, C. D., Socolovschi, C., Labruna, M. B., Mediannikov, O., Kernif, T., et al. (2013). Update on tick-borne rickettsioses around the world: a geographic approach. Clin. Microbiol. Rev. 26, 657–702. doi: 10.1128/CMR.00032-13
Pinter, A., Franca, A. C., Souza, C. E., Sabbo, C., Nascimento, E. M. M., Santos, F. C. P., et al. (2011). Febre maculosa brasileira. BEPA Supl. 8, 19–24. doi: 10.57148/bepa.2021.v.18.37185
Piranda, E. M., Faccini, J. L., Pinter, A., Pacheco, R. C., Cançado, P. H., and Labruna, M. B. (2011). Experimental infection of Rhipicephalus sanguineus ticks with the bacterium Rickettsia rickettsii, using experimentally infected dogs. Vector Borne Zoonot. Dis. 11, 29–36. doi: 10.1089/vbz.2009.0250
Randall, M. B., and Walker, D. H. (1984). Rocky Mountain spotted fever. Gastrointestinal and pancreatic lesions and rickettsiial infection. Arch. Pathol. Lab. Med. 108, 963–967.
Roggli, V. L., Keener, S., Bradford, W. D., Pratt, P. C., and Walker, D. H. (1985). Pulmonary pathology of Rocky Mountain spotted fever (RMSF) in children. Pediatr. Pathol. 4, 47–57. doi: 10.3109/15513818509025902
Roux, V., Fournier, P. E., and Raoult, D. (1996). Differentiation of spotted fever group rickettsiae by sequencing and analysis of restriction fragment length polymorphism of PCR-amplified DNA of the gene encoding the protein rOmpA. J. Clin. Microbiol. 34, 2058–2065. doi: 10.1128/jcm.34.9.2058-2065.1996
Roux, V., and Raoult, D. (1993). Genotypic identification and phylogenetic analysis of the spotted fever group rickettsiae by pulsed-field gel electrophoresis. J. Bacteriol. 175, 4895–4904. doi: 10.1128/jb.175.15.4895-4904.1993
Roux, V., and Raoult, D. (1995). Phylogenetic analysis of the genus Rickettsia by 16S rDNA sequencing. Res. Microbiol. 146, 385–396. doi: 10.1016/0923-2508(96)80284-1
Roux, V., Rydkina, E., Eremeeva, M., and Raoult, D. (1997). Citrate synthase gene comparison, a new tool for phylogenetic analysis, and its application for the rickettsiae. Int. J. Syst. Bacteriol. 47, 252–261. doi: 10.1099/00207713-47-2-252
Roy, S., Yadav, S., Garg, S., Deshmukh, P. R., and Narang, R. (2021). Evaluation of nested PCR and loop mediated isothermal amplification assay (LAMP) targeting 47 kDa gene of Orientia tsutsugamushi for diagnosis of scrub typhus. Indian J. Med. Microbiol. 39, 475–478. doi: 10.1016/j.ijmmb.2021.06.011
Sánchez Pérez, M., Feria Arroyo, T. P., Venegas Barrera, C. S., Sosa-Gutiérrez, C., Torres, J., Brown, K. A., et al. (2023). Predicting the impact of climate change on the distribution of Rhipicephalus sanguineus in the Americas. Sustainability 15, 4557. doi: 10.3390/su15054557
Schwartz, A. (2006). Diagnostic Test Calculator. Obtenido de. Available online at: http://araw.mede.uic.edu/cgi-bin/testcalc.pl (accessed November 23, 2022).
Sexton, D. J., and Kaye, K. S. (2002). Rocky Mountain spotted fever. Med. Clin. North Am. 86, 351–360. doi: 10.1016/S0025-7125(03)00091-9
Šlapeta, J., Halliday, B., Chandra, S., Alanazi, A. D., and Abdel-Shafy, S. (2022). Rhipicephalus linnaei (Audouin, 1826) recognised as the “tropical lineage” of the brown dog tick Rhipicephalus sanguineus sensu lato: Neotype designation, redescription, and establishment of morphological and molecular reference. Ticks Tick Borne Dis. 13, 102024. doi: 10.1016/j.ttbdis.2022.102024
Sundy, J. S., Allen, N. B., and Sexton, D. J. (1996). Rocky Mountain spotted fever presenting with acute monarticular arthritis. Arthritis Rheum. 39, 175–176. doi: 10.1002/art.1780390126
Tinoco-Gracia, L., Lomel,í, M. R., Hori-Oshima, S., Stephenson, N., and Foley, J. (2018). Molecular confirmation of rocky mountain spotted fever epidemic agent in Mexicali, Mexico. Emerg. Infect. Dis. 24, 1723–1725. doi: 10.3201/eid2409.171523
Tomita, N., Mori, Y., Kanda, H., and Notomi, T. (2008). Loop-mediated isothermal amplification (LAMP) of gene sequences and simple visual detection of products. Nat. Protoc. 3, 877–882. doi: 10.1038/nprot.2008.57
Trevethan, R. (2017). Sensitivity, specificity, and predictive values: foundations, pliabilities, and pitfalls in research and practice. Front. Public Health 5, 307. doi: 10.3389/fpubh.2017.00307
Ueno, T. E., Costa, F. B., Moraes-Filho, J., Agostinho, W. C., Fernandes, W. R., and Labruna, M. B. (2016). Experimental infection of horses with Rickettsia rickettsii. Parasit. Vectors. 9, 499. doi: 10.1186/s13071-016-1784-y
van Stralen, K. J., Stel, V. S., Reitsma, J. B., Dekker, F. W., Zoccali, C., and Jager, K. J. (2009). Diagnostic methods I: sensitivity, specificity, and other measures of accuracy. Kidney Int. 75, 1257–1263. doi: 10.1038/ki.2009.92
Walker, D. H., Crawford, C. G., and Cain, B. G. (1980a). Rickettsiial infection of the pulmonary microcirculation: the basis for interstitial pneumonitis in Rocky Mountain spotted fever. Hum. Pathol. 11, 263–272. doi: 10.1016/S0046-8177(80)80008-6
Walker, D. H., Paletta, C. E., and Cain, B. G. (1980b). Pathogenesis of myocarditis in Rocky Mountain spotted fever. Arch. Pathol. Lab. Med. 104, 171–174.
Weber, D. J., and Walker, D. H. (1991). Rocky Mountain spotted fever. Infect. Dis. Clin. North Am. 5, 19–35. doi: 10.1016/S0891-5520(20)30386-X
Wei, T. Y., and Baumann, R. J. (1999). Acute disseminated encephalomyelitis after Rocky Mountain spotted fever. Pediatr. Neurol. 21, 503–505. doi: 10.1016/S0887-8994(99)00028-4
WHO (2021). Selection of Essential in vitro Diagnostics at Country Level: Using the WHO Model List of Essential in vitro Diagnostics to Develop and Update a National List of Essential in vitro Diagnostics. World Health Organization. Available online at: https://iris.who.int/handle/10665/343385 (accessed March 12, 2023).
Keywords: Rocky Mountain spotted fever, diagnostics, tick-borne pathogens, isothermal amplification, Rickettsia
Citation: Carvajal-Gamez BI, Olguín-Barrera A, Tinoco-Gracia L, Gordillo-Perez G, Dzul-Rosado K, Aguilar-Tipacamú G, Hidalgo-Ruiz M and Mosqueda J (2024) Development and validation of a novel detection method for Rickettsia rickettsii using a loop-mediated isothermal amplification assay. Front. Microbiol. 14:1276809. doi: 10.3389/fmicb.2023.1276809
Received: 13 August 2023; Accepted: 17 November 2023;
Published: 08 January 2024.
Edited by:
Hosny El-Adawy, Friedrich Loeffler Institut, GermanyReviewed by:
Roberto Nardini, Istituto Zooprofilattico Sperimentale del Lazio e della Toscana “M. Aleandri”, ItalyCopyright © 2024 Carvajal-Gamez, Olguín-Barrera, Tinoco-Gracia, Gordillo-Perez, Dzul-Rosado, Aguilar-Tipacamú, Hidalgo-Ruiz and Mosqueda. This is an open-access article distributed under the terms of the Creative Commons Attribution License (CC BY). The use, distribution or reproduction in other forums is permitted, provided the original author(s) and the copyright owner(s) are credited and that the original publication in this journal is cited, in accordance with accepted academic practice. No use, distribution or reproduction is permitted which does not comply with these terms.
*Correspondence: Juan Mosqueda, am9lbC5tb3NxdWVkYUB1YXEubXg=
†Present address: Mario Hidalgo-Ruiz, Faculty of Veterinary Medicine, Autonomous University of Chiapas, Tuxtla Gutierrez, Chiapas, Mexico
Disclaimer: All claims expressed in this article are solely those of the authors and do not necessarily represent those of their affiliated organizations, or those of the publisher, the editors and the reviewers. Any product that may be evaluated in this article or claim that may be made by its manufacturer is not guaranteed or endorsed by the publisher.
Research integrity at Frontiers
Learn more about the work of our research integrity team to safeguard the quality of each article we publish.