- 1Key Laboratory of Ecological Adaptive Evolution and Conservation on Animals-Plants in Southwest Mountain Ecosystem of Yunnan Province Higher Institutes College, School of Life Sciences, Yunnan Normal University, Kunming, China
- 2Engineering Research Center of Sustainable Development and Utilization of Biomass Energy Ministry of Education, Kunming, China
- 3Key Laboratory of Yunnan Province for Biomass Energy and Environment Biotechnology, Kunming, China
Intestinal microorganisms assist the host in digesting complex and difficultly decomposed foods; expand the host’s dietary ecological niche. In order to investigate the effect of high-fiber food on intestinal microorganisms of Eothenomys miletus at different altitudes, exploring the regional differences of intestinal microorganisms and their roles in body mass regulation, we collected E. miletus from Dali (DL) and Xianggelila (XGLL), which were divided into control group, high-fiber group fed with high-fiber diet for 7 days, and refeeding group fed with standard diet for 14 days after high-fiber diet. Using 16S rRNA gene sequencing technology combined with physiological methods, we analyzed the gut microbial diversity, abundance, community structure and related physiological indicators of each group, and explored the effects of high-fiber foods and regions on the diversity, structure of gut microorganisms and physiological indicators. The results showed that high-fiber food affected the food intake and metabolic rate of E. miletus, which also showed regional differences. The intestinal microorganisms of E. miletus obtained energy through the enrichment of fiber degrading bacteria under the condition of high-fiber food, while producing short-chain fatty acids, which participated in processes such as energy metabolism or immune regulation. Moreover, it also affected the colonization of intestinal microorganisms. High-fiber food promoted the enrichment of probiotics in the intestinal microbiota of E. miletus, but pathogenic bacteria also appeared. Therefore, the changes in the composition and diversity of gut microbiota in E. miletus provided important guarantees for their adaptation to high fiber food environments in winter.
1. Introduction
Gut microorganisms, which are numerous and diverse, are the main symbiotic taxa of mammals, and they not only obtain nutrients from their hosts, but also have a profound impact on individual’s development, nutrient acquisition, physiological functions, immune regulation and other important activities (Dillon et al., 2005; Ezenwa et al., 2012; Sender et al., 2016). During the long-term evolutionary process, stable mutual adaptation and collaboration relationships have been formed between animals and their gut microbiota, and co-evolution has been achieved (Zhang et al., 2016). The animal gut microbiota possesses millions of evolutionarily distinct gene families, some of which can assist the host in obtaining indigestible food and expanding the hosts’ metabolic capacity (Xiao et al., 2015; Moeller and Sanders, 2020). In herbivores, the complex polysaccharides contained in plants could not be digested by animal enzymes alone, but microorganisms in the gut can ferment these compounds, Lactobacillus, for example, Ruminococcus, Eubacterium, and Fusobacterium, amongst others, can ferment different carbohydrates to produce short-chain fatty acids (SCFAs) and other metabolites that were readily available to the host (Salyers et al., 1977). SCFAs (such as acetate and butyrate) provide much of the energy required to maintain high turnover rates of colonocytes and intestinal epithelial cells in the intestine, with oxidation of butyrate alone able to provide 70% of the energy required by colonocytes in rat (Roediger, 1982; Moeller and Sanders, 2020). Moreover, gut microbiota also enhanced the digestion of plant secondary metabolites by herbivorous animals. For example, Neotoma lepida feed on juniper and leguminous shrubs rich in toxic creosote, and experiments have demonstrated that gut microorganisms such as Enterococcus, Clostridium, and Lactobacillus increased the tolerance and digestibility of creosote secondary metabolites in forest rats (Kohl and Dearing, 2016). It was found that when Neotoma lepida was fed a diet containing creosote, microorganisms with genes associated with aromatic compound metabolism were selected for in the gut microbial community, and there was an increase in the abundance of enzymes associated with the metabolism of aromatic compounds, for instance, aryl-alcohol dehydrogenase, which helps the host to degrade toxic components of plant secondary metabolites like aromatic compounds (Kohl et al., 2014). Intestinal microorganisms help the host digest complex and difficultly decomposed food, expand the host’s dietary ecological niche, affected its ability to compete for scarce resources, and enhance its adaptation to the environment (Gilbert et al., 2015; Alberdi et al., 2016).
Acquisition of energy from food and its energy distribution is an important factor in the survival, abundance or distribution in animals (Veloso and Bozinovic, 1993). However, wild small mammals were likely to experience a decline in food quality during their life cycle, such as immature seeds, winter or early spring when vegetations were not abundant, forcing them to feed on high-fiber foods, but the efficiency of obtaining energy from high-fiber foods was relatively low (Bozinovic, 1995). The host’s gut microbiota increased the proportion and diversity of cellulose degrading microorganisms by altering their diversity and composition, promoting the host’s utilization of high-fiber foods, and thus maintaining the host’s energy balance (Varel and Dehority, 1989; Ni and Tokuda, 2013; Lindsay et al., 2020). For example, pigs on a high-fiber diet for a short period of time had an altered intestinal microbiota, in particular an increasing in the abundance of dominant fiber-degrading bacteria, which digested more fiber to provide energy, and an increasing in the proportion of fiber in the diet lead to the fecal higher abundance of cellulose- and starch-fermenting bacteria in Rhinopithecus roxellanae (Liu et al., 2013; Pu et al., 2020). Meanwhile, the increasing of fiber content in food contributes to the intestinal health of animals, such as the production of volatile fatty acids and other metabolites, promoting the production of probiotics such as Bacteroides, and maintaining the micro balance of gut microbiota (Russell and Duthie, 2011; Geirnaert et al., 2012; Scott et al., 2013). Researches results also indicating that excessive dietary fiber lead to an increasing in the abundance of pathogenic bacteria (Pu et al., 2023). At present, there were various studies on the impact of high-fiber foods on gut microbiota, and there was no consensus on the changes in host physiology and gut microbiota under high-fiber foods.
Hengduan Mountains are located in southwestern China, in the southeastern part of the Qinghai-Tibetan Plateau, which is characterized by decreasing temperatures and increasing precipitation with increasing altitude, with distinct dry and wet seasons, small annual temperature differences and large daily temperature differences (Gong et al., 2001; Wang et al., 2017). Eothenomys miletus is a native species of Hengduan Mountains (Lou et al., 2000). E. miletus mainly feed on plants rich in high-fiber, such as Poaceae, and the food diversity of E. miletus at higher altitude was higher (Yan and Zhu, 2023). Previous studies have shown that temperature, photoperiod and food were important environmental factors affecting the energy metabolism in E. miletus, and there were significant differences in their body mass when facing different food treatments (Zhu et al., 2010, 2011; Mu et al., 2015). E. miletus in different regions adapts to different environments by regulating body mass, liver, digestive tract, other body composition and related hormone expressions (Han et al., 2021). Moreover, our studies have confirmed that there were differences in the structure and diversity of the intestinal bacterial community of E. miletus in different regions, which was a positive response to changes in food and environment (Yan et al., 2022). The present study used 16S rRNA gene sequencing technology, combined with relevant physiological indicators, to investigate the differences in the effects of high-fiber food on gut microorganisms and body mass regulation of E. miletus at different altitudes (Dali, DL and Xianggelila, XGLL) in winter, and ultimately to elucidate the relationship between gut microorganisms and its body mass regulation. We hypothesized that high fiber foods will affect the diversity and composition of gut microbiota, with regional differences of regulation for gut microbiota in E. miletus.
2. Materials and methods
2.1. Collection of experimental animals
Samples were collected in DL and XGLL in winter of 2022. E. miletus were all healthy adult individuals with non-reproductive periods. The geographical location, climate characteristics, and number of the sampling points were detailed in Table 1.
2.2. Treatment of experimental animals
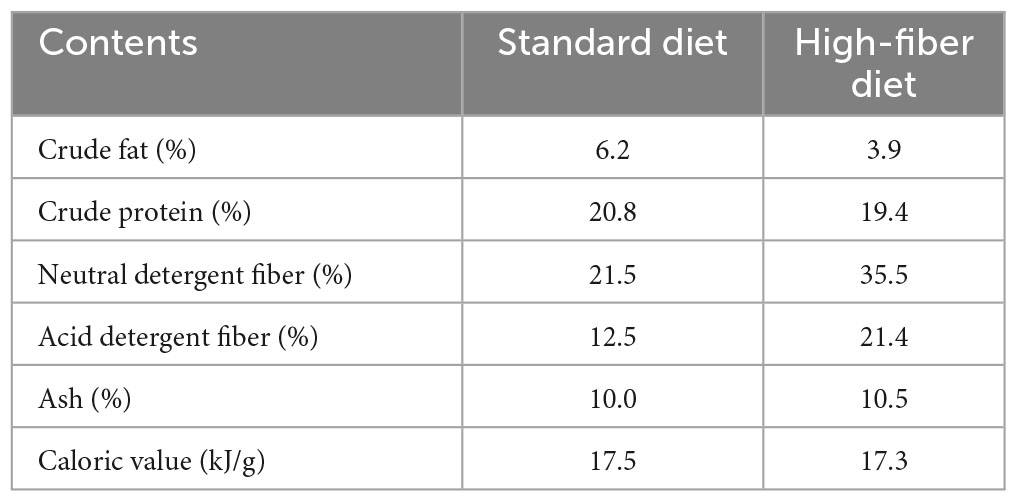
After disinfection and flea killing, the captured E. miletus from the two regions were taken back to the animal breeding room of Yunnan Normal University, and were housed singly in a mouse box (260 mm × 160 mm × 150 mm). After 4 days of laboratory adaptation, a two-factor (region × high-fiber food) experimental design was used, and E. miletus were divided into 0-day control group, 7-day high-fiber group, and 14-day refeeding group after the high-fiber diet followed by refeeding with standard diet. That is, Dali control group (DLC, n = 7), Dali high-fiber group (DLHF, n = 7), Dali refeeding group (DLRe, n = 7), Xianggelila control group (XGC, n = 7), Xianggelila high-fiber group (XGHF, n = 7), Xianggelila refeeding group (XGRe, n = 6). Room temperature was controlled at 25 ± 1°C and the photoperiod was 12L:12D (Light: Dark). Animals were fed standard rat chow and high-fiber chow (produced by Kunming Medical University), and the food composition is shown in Table 2. Food and water were provided ad libitum. The experiment lasted for 21 days, with body mass, food intake, and resting metabolic rate (RMR) measured on day 0, 7, and 21. Body mass was measured on an LT502 electronic balance (accurate to 0.01 g), food intake was measured by the food balance method and RMR was measured by a portable respirometer, as described by Zhu et al. (2014) and Gong et al. (2022). After the determination of relevant indicators, pentobarbital sodium (50 mg/kg) was used for anesthesia and execution, and serum and rectal feces were taken.
2.3. Determination of physiological indicators
Blood was taken at the end of each group’s experiment by execution, and the blood was rested in a refrigerator at 4°C for 1 h, centrifuged at 4°C (4000 r/min, 30 min), and the serum was aspirated in a 2 mL centrifuge tube, stored in a refrigerator (−80°C). Enzyme-linked immunosorbent assay (ELISA) was used to determine leptin, glucose (Glu), triglyceride (Tg), total cholesterol (Tc), short-chain fatty acids (SCFAs), lipopolysaccharide binding protein (LBP), fasting inducible adipocyte factor (FIAF) and tumor necrosis factor-α (TNF-α). The test kits were leptin Assay Kit (JM-11498M1), Glu Assay Kit (S0104F-1), Tg Assay Kit (S0104F-1) Tg Assay Kit (S0140O-1), Tc Assay Kit (S05042-1), SCFAs Assay Kit (JM-11498M1), LBP Assay Kit (JM-12488M1), FIAF Assay Kit (JM-12613M1), TNF-α Assay Kit (JM-02415M1).
Animals were carefully separated from the liver and interscapular brown adipose tissue (BAT) after execution, the connective tissue and white adipose tissue (WAT) were removed, weighed (accurate to 0.01 g) and placed in 5 mL and 2 mL centrifuge tubes, respectively, placed in liquid nitrogen, then stored in a refrigerator (−80°C). The activity of uncoupling protein 1 (UCP1) was determined by ELISA Assay Kit (JM-12185M1).
2.4. Determination of body composition
Heart, lungs, spleen and kidneys were carefully separated and the attached connective tissue and fat were removed. Blood was blotted from the surface of the organs with filter paper and weighed (accurate to 0.01 g). Digestive tract was removed and the stomach, small intestine, large intestine and cecum were isolated separately, the mesentery and connective tissue and fat of each organ were carefully removed and weighed.
2.5. Determination of gut microbiota
2.5.1. DNA extraction
Take 0.1 g of rectal feces and total DNA enriched on the filter membrane was extracted using a centrifugal column-type soil genome extraction kit (DNeasy PowerSoil Kit, Germany).
2.5.2. High throughput sequencing
The concentration of the purified PCR product was determined using a Nanodrop 2000 spectrophotometer, with a nucleic acid concentration higher than 10 ng/uL and purity (A260/A180) greater than 1.8 as valid samples. The purified DNA samples were mixed in equal molarity and sequenced using the Illumina Miseq platform (Illumina, San Diego, CA, USA).
2.6. Bioinformatics analysis
The 2 × 250 bp double end sequences were obtained by sequencing on the Illumina Miseq platform (Illumina, San Diego, CA, USA) and these raw data were processed and analyzed using the QIIME platform (version 1.8). The double-end sequences were first spliced using Flash software (version 1.2.111) and then matched to a unique barcode label for each sample. Low quality sequences (sequence length less than 300 or base mass fraction less than 30) were removed during the splicing process. Chimeras were removed from the sequences using Use arch 7.0 software, and all sequences were subsequently clustered into operational taxonomic units (OTUs) with 97% similarity by the Uclust algorithm. The sequence with the longest sequence length was selected as the representative sequence and the Ribosomal Database Project database was used to annotate the sequence classification information. Finally, the sequences of all samples were normalized using the “Daisy chopper” script code, with a standard of 5437 sequences per sample.
2.7. Data analysis
2.7.1. Microbial community composition
A percentage stacked bar chart was created using origin 2018 to describe the bacterial community.
2.7.2. α and β diversity
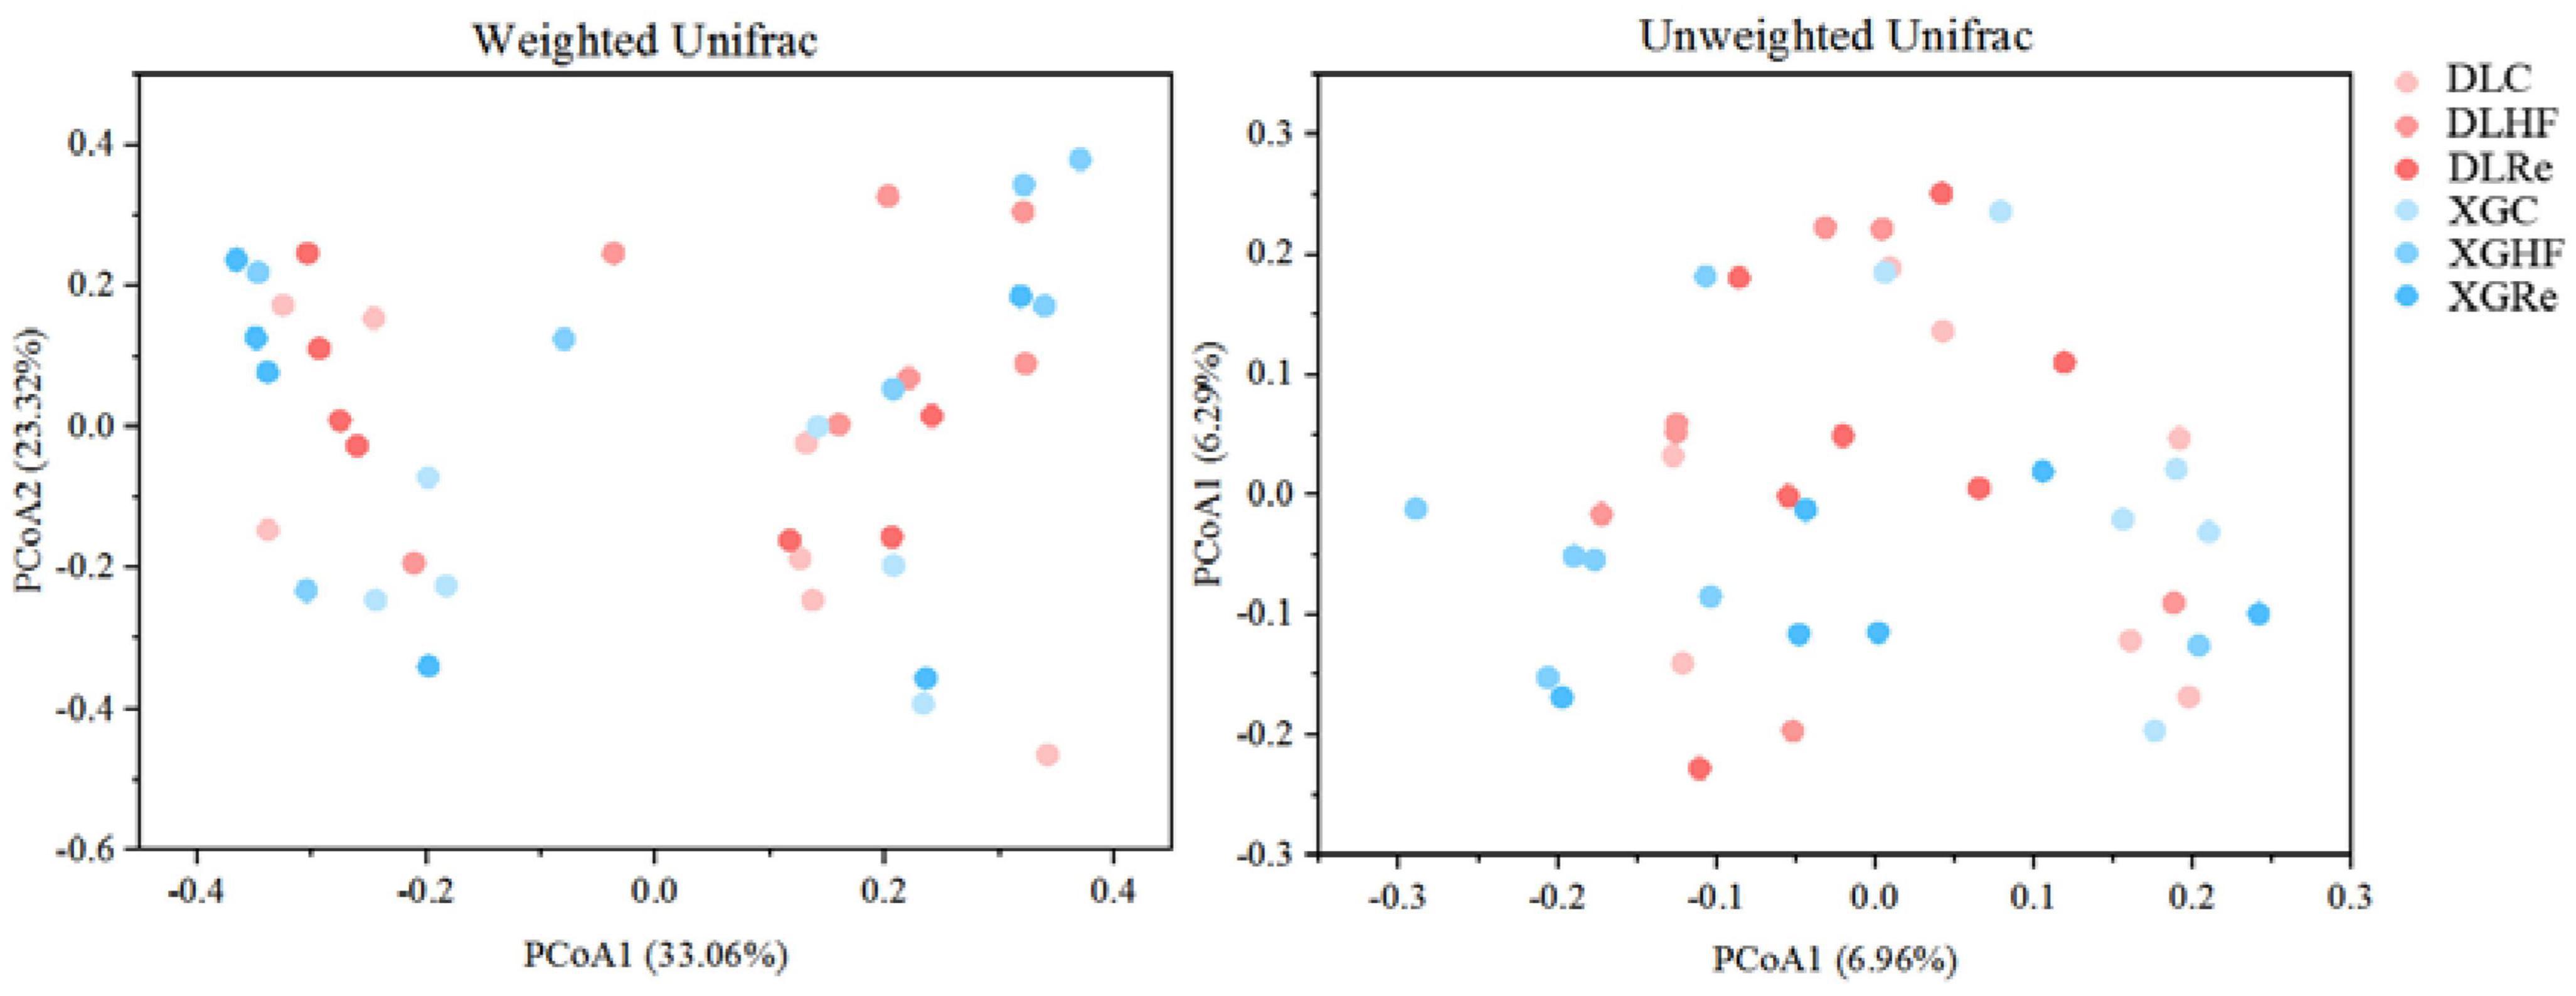
α diversity was estimated by 2 diversity indicators: chao1 and shannon diversity and described by creating box plots using Origin 2018, and Kruskal-Wallis H-test was used in SPSS 21 to analysis if differences in diversity between the two groups. The reason we chose the non-parametric test here was that these two indicators did not conform to the homogeneity of variance. β diversity: community structure was described using QIIME and Origin 2018. Based on unweighted and weighted UniFrac distance matrices, PERMANOVA (Permutational multivariate analysis of variance) was used to calculate the difference among the groups. The unweighted UniFrac distance depends on phylogenetic relationships and OTU species abundance, while species absence/presence and phylogenetic relationships are considered by the weighted UniFrac distance. Then principal co-ordinates analysis (PCoA) was used to visualize the β diversity of all samples.
2.7.3. Venn diagram
Common and unique parameters between groups were analyzed via Venn diagrams implemented online in Venn 2.1.1
2.7.4. Enrichment analysis
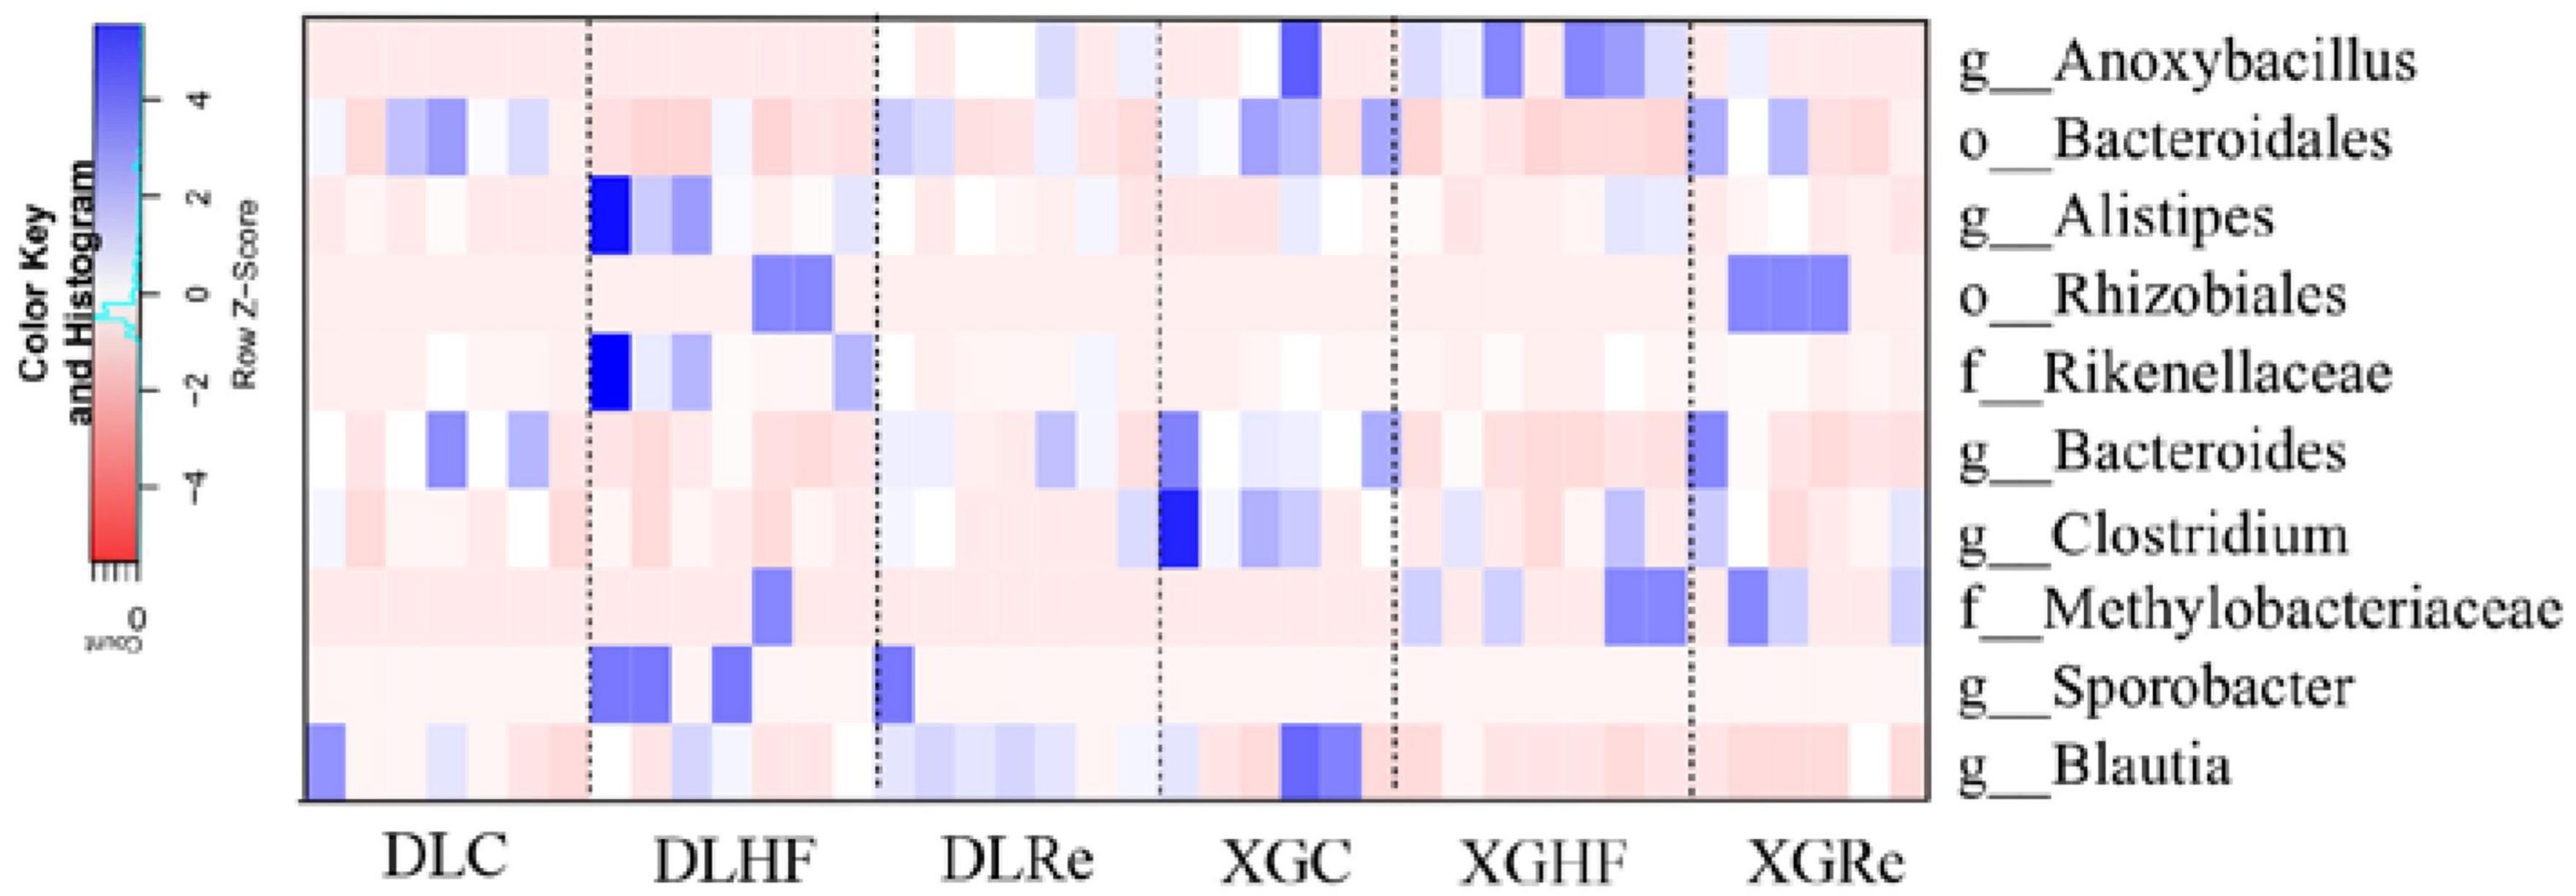
We used one-way of variance analysis to compare the distribution differences of microbial abundance among groups, and the variable was different treatment group. The genera of microorganisms with significant differences in distribution between groups were screened out, and the heatmap was drawn by R packages “vegan,” “permute,” and “gplots” for visualization. The prefixes “o” and “f” represented the order and family level of unidentified genera, respectively.
2.7.5. Heat map of the correlation between environmental physicochemical properties and dominant microorganisms in the feces of E. miletus in different regions
Pearson analysis using SPSS 21 and R3.6.2 were used to obtain the correlation heat map.
2.7.6. RDA analysis
Redundancy analysis (RDA) was used to assess the correlation between dominant genera (top 9) and physicochemical factors using Canoco 5.0.
2.7.7. Network analysis
Use R3.6.2 and Gephiv.0.9.2 software to further analyze these results to generate network analysis (P < 0.05, | r | > 0.4). R was used to calculate the correlation between these microorganisms, and the network analysis diagram was drawn based on the correlation matrix. With the help of Gephi, we further calculated the topological characteristics (namely modularity) of the network.
2.7.8. Physiological indicators analysis
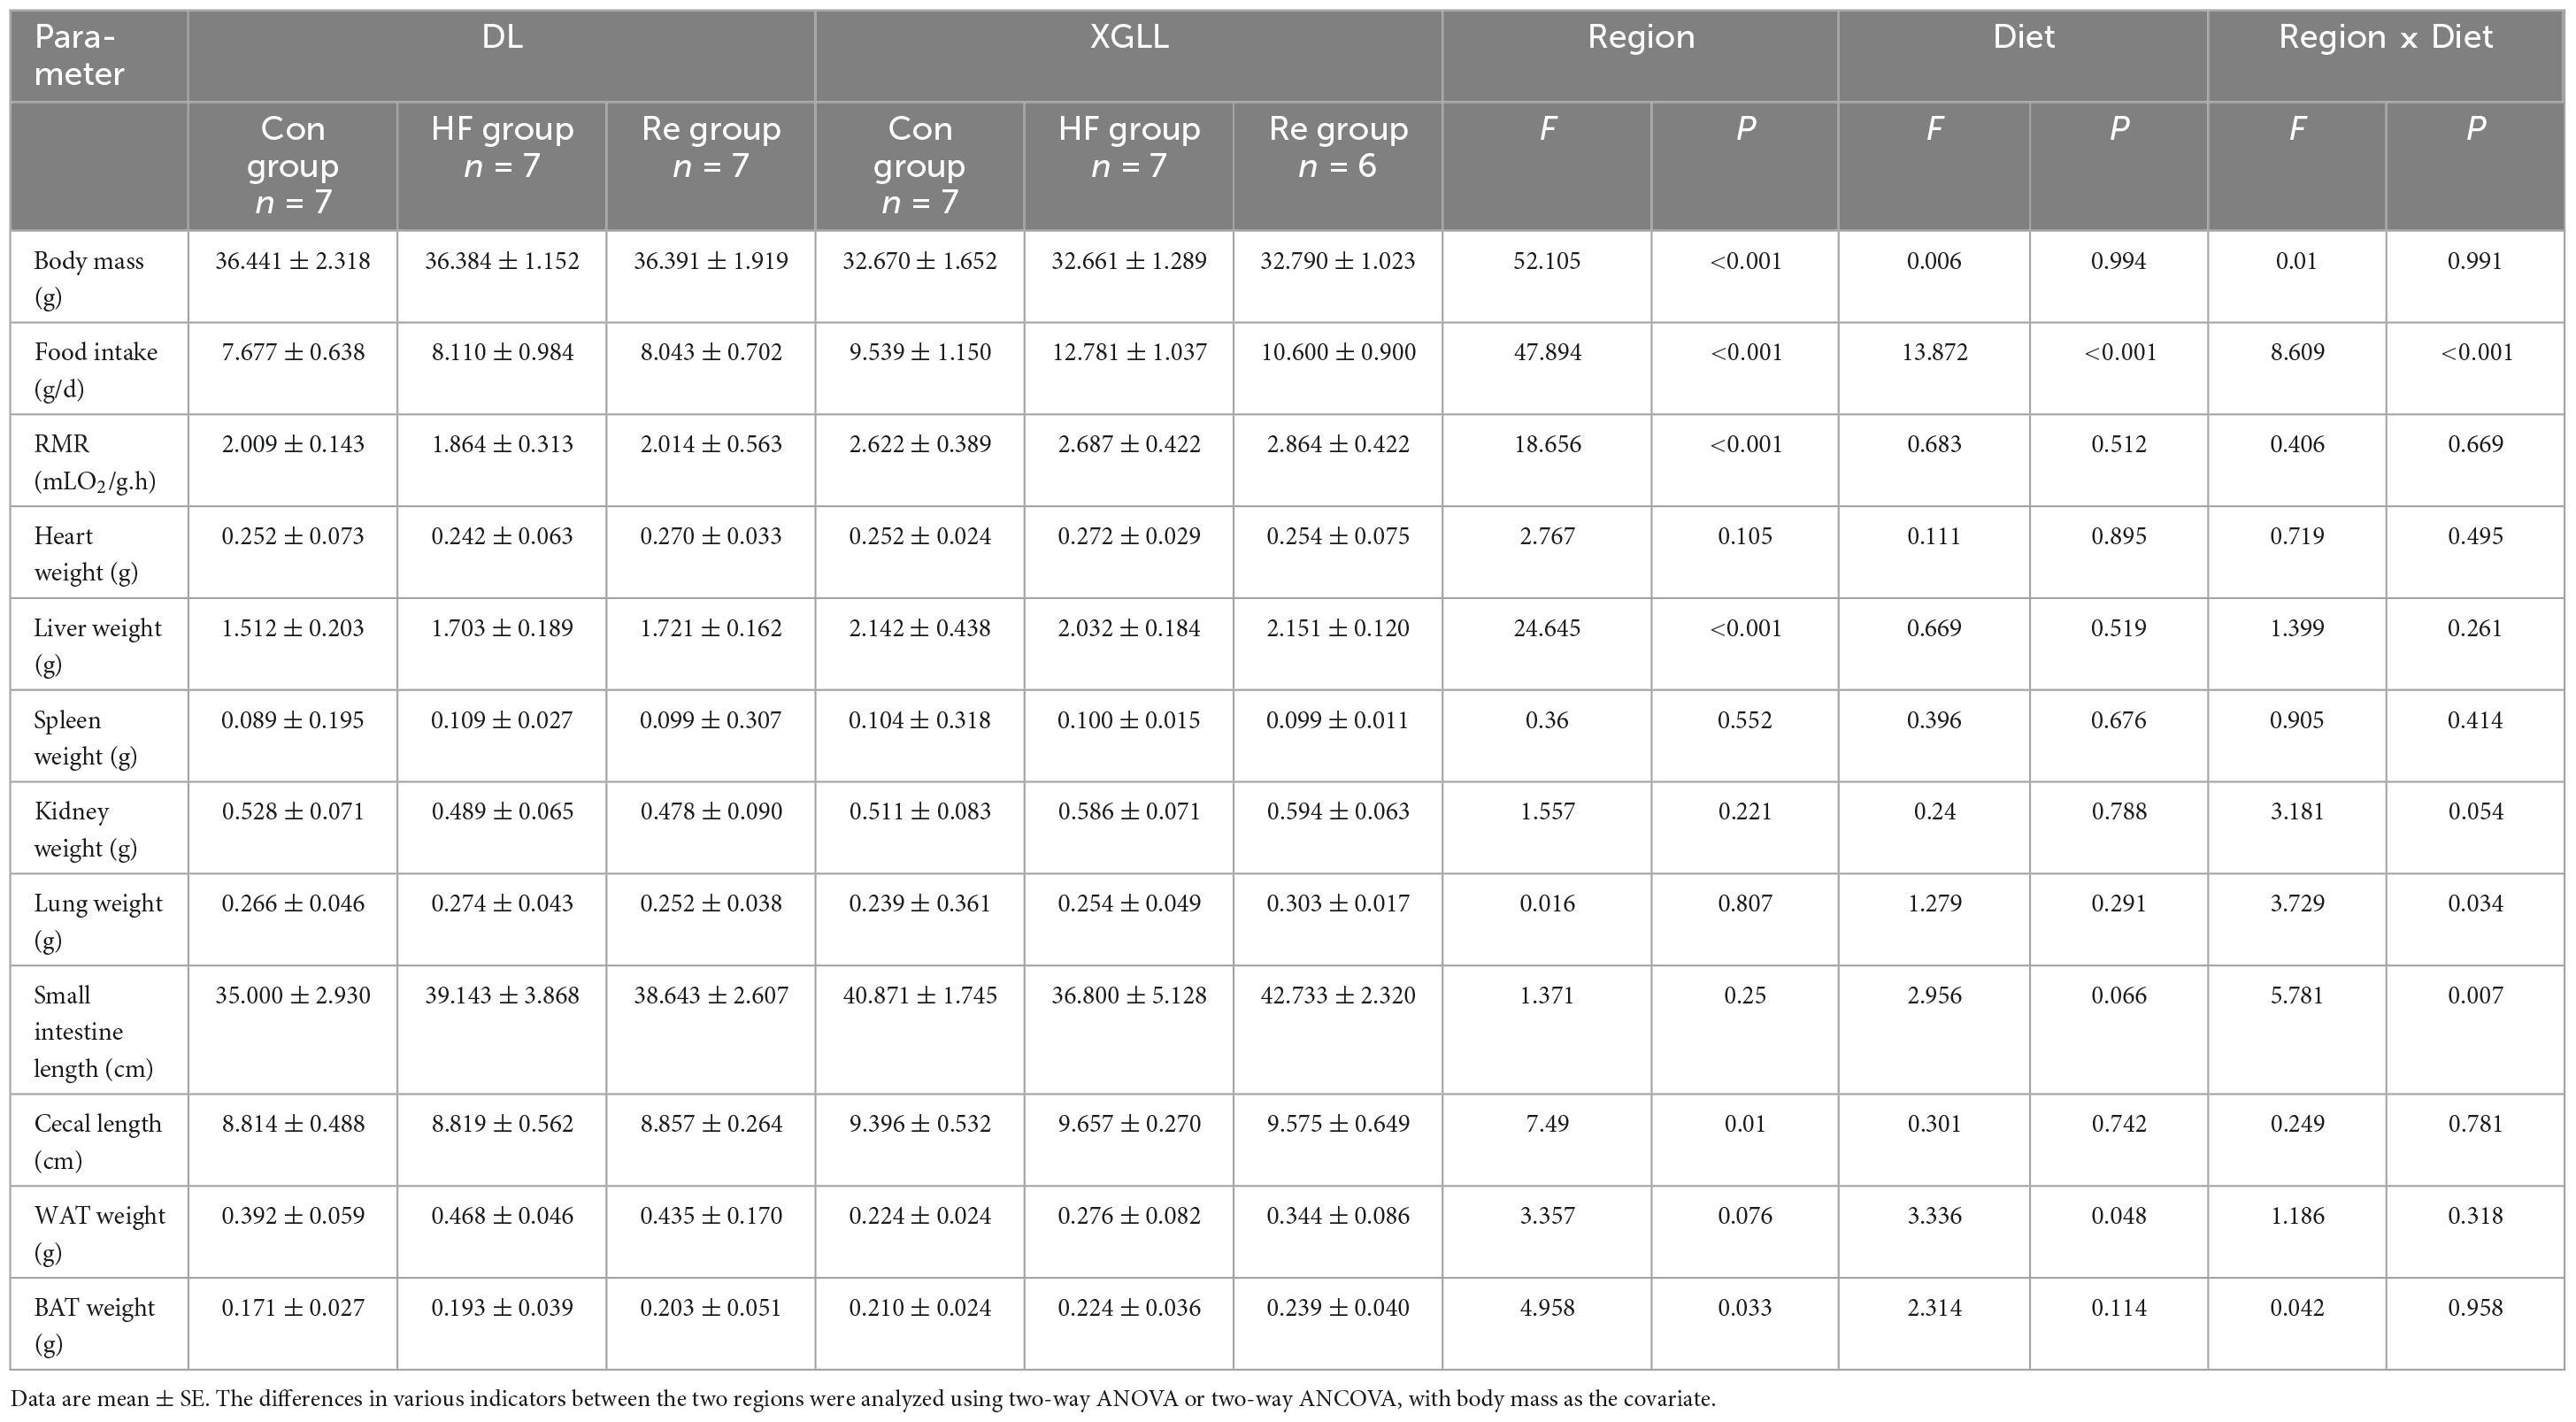
The data was analyzed using SPSS 26.0 software, and the differences in various indicators between the two regions were analyzed using two-way ANOVA or two-way ANCOVA (Region × Diet), with body mass as the covariate. The results are expressed as mean ± SE, with P < 0.05 indicating significant differences.
3. Results
The current study collected 41 samples to extract DNA and amplify PCR products. After removing low-quality sequences, chimeras, monomers, and chloroplasts, each sample was standardized to 3147 sequences.
3.1. Microbial community composition
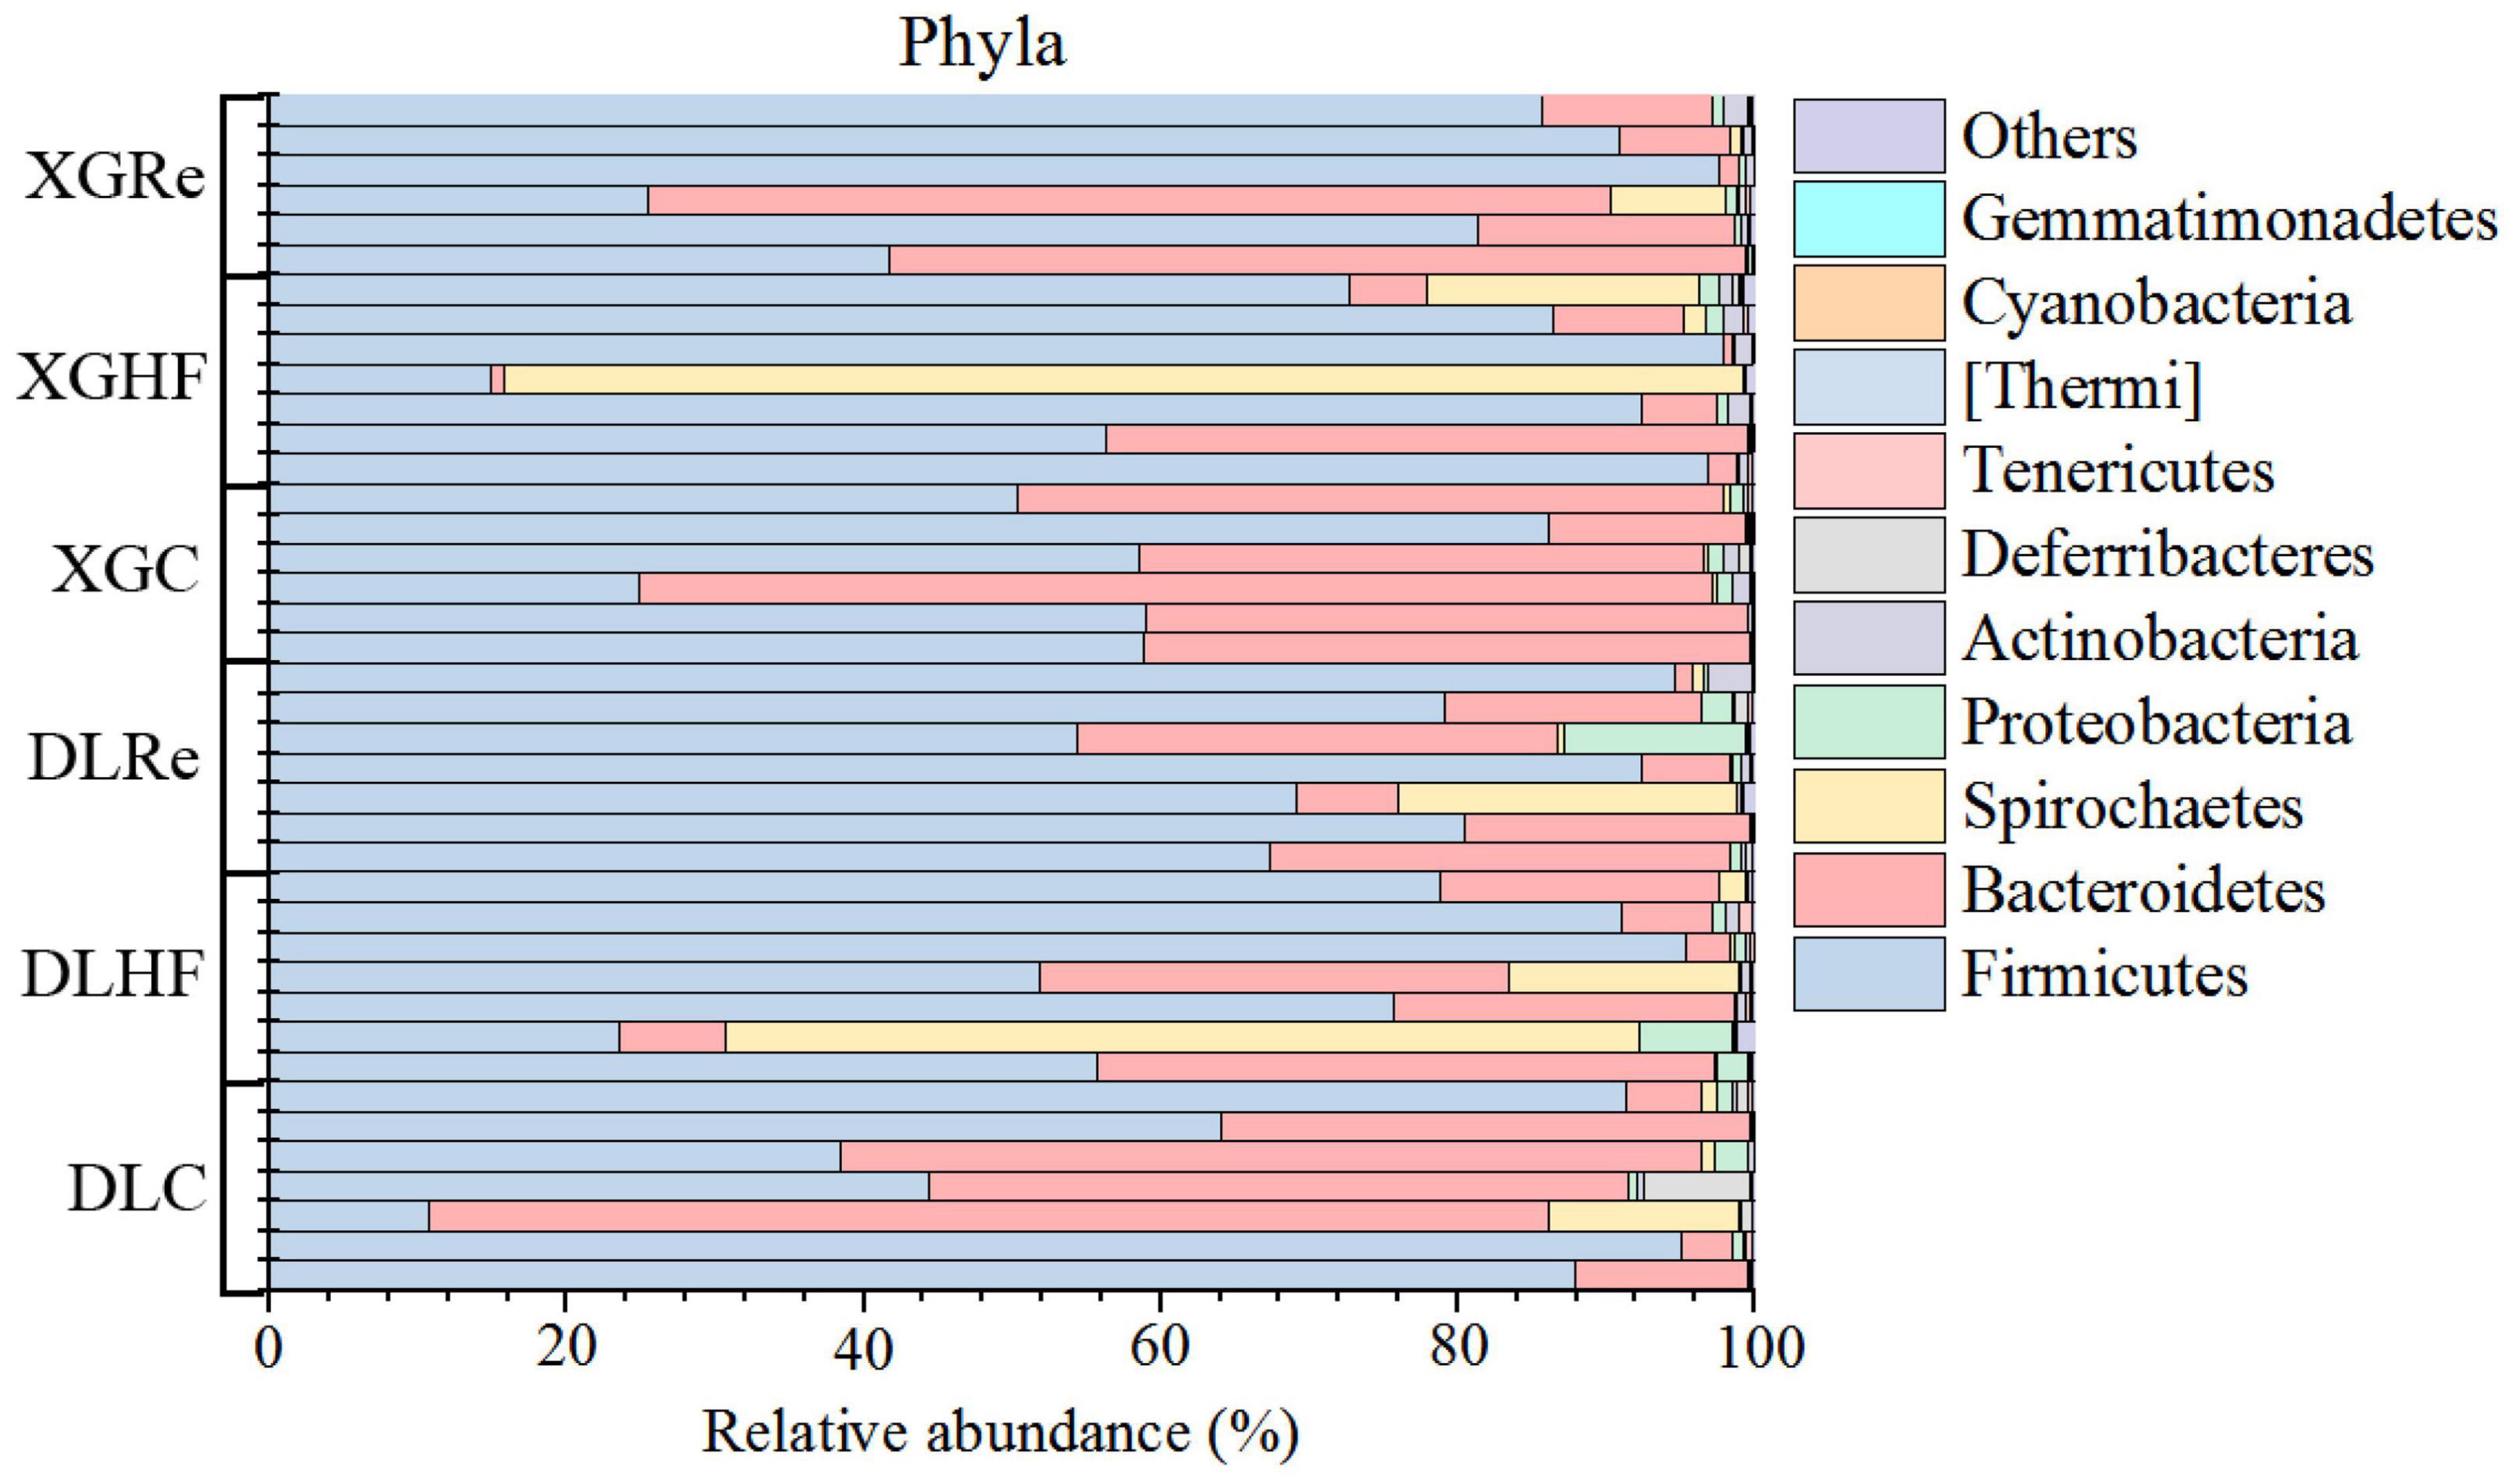
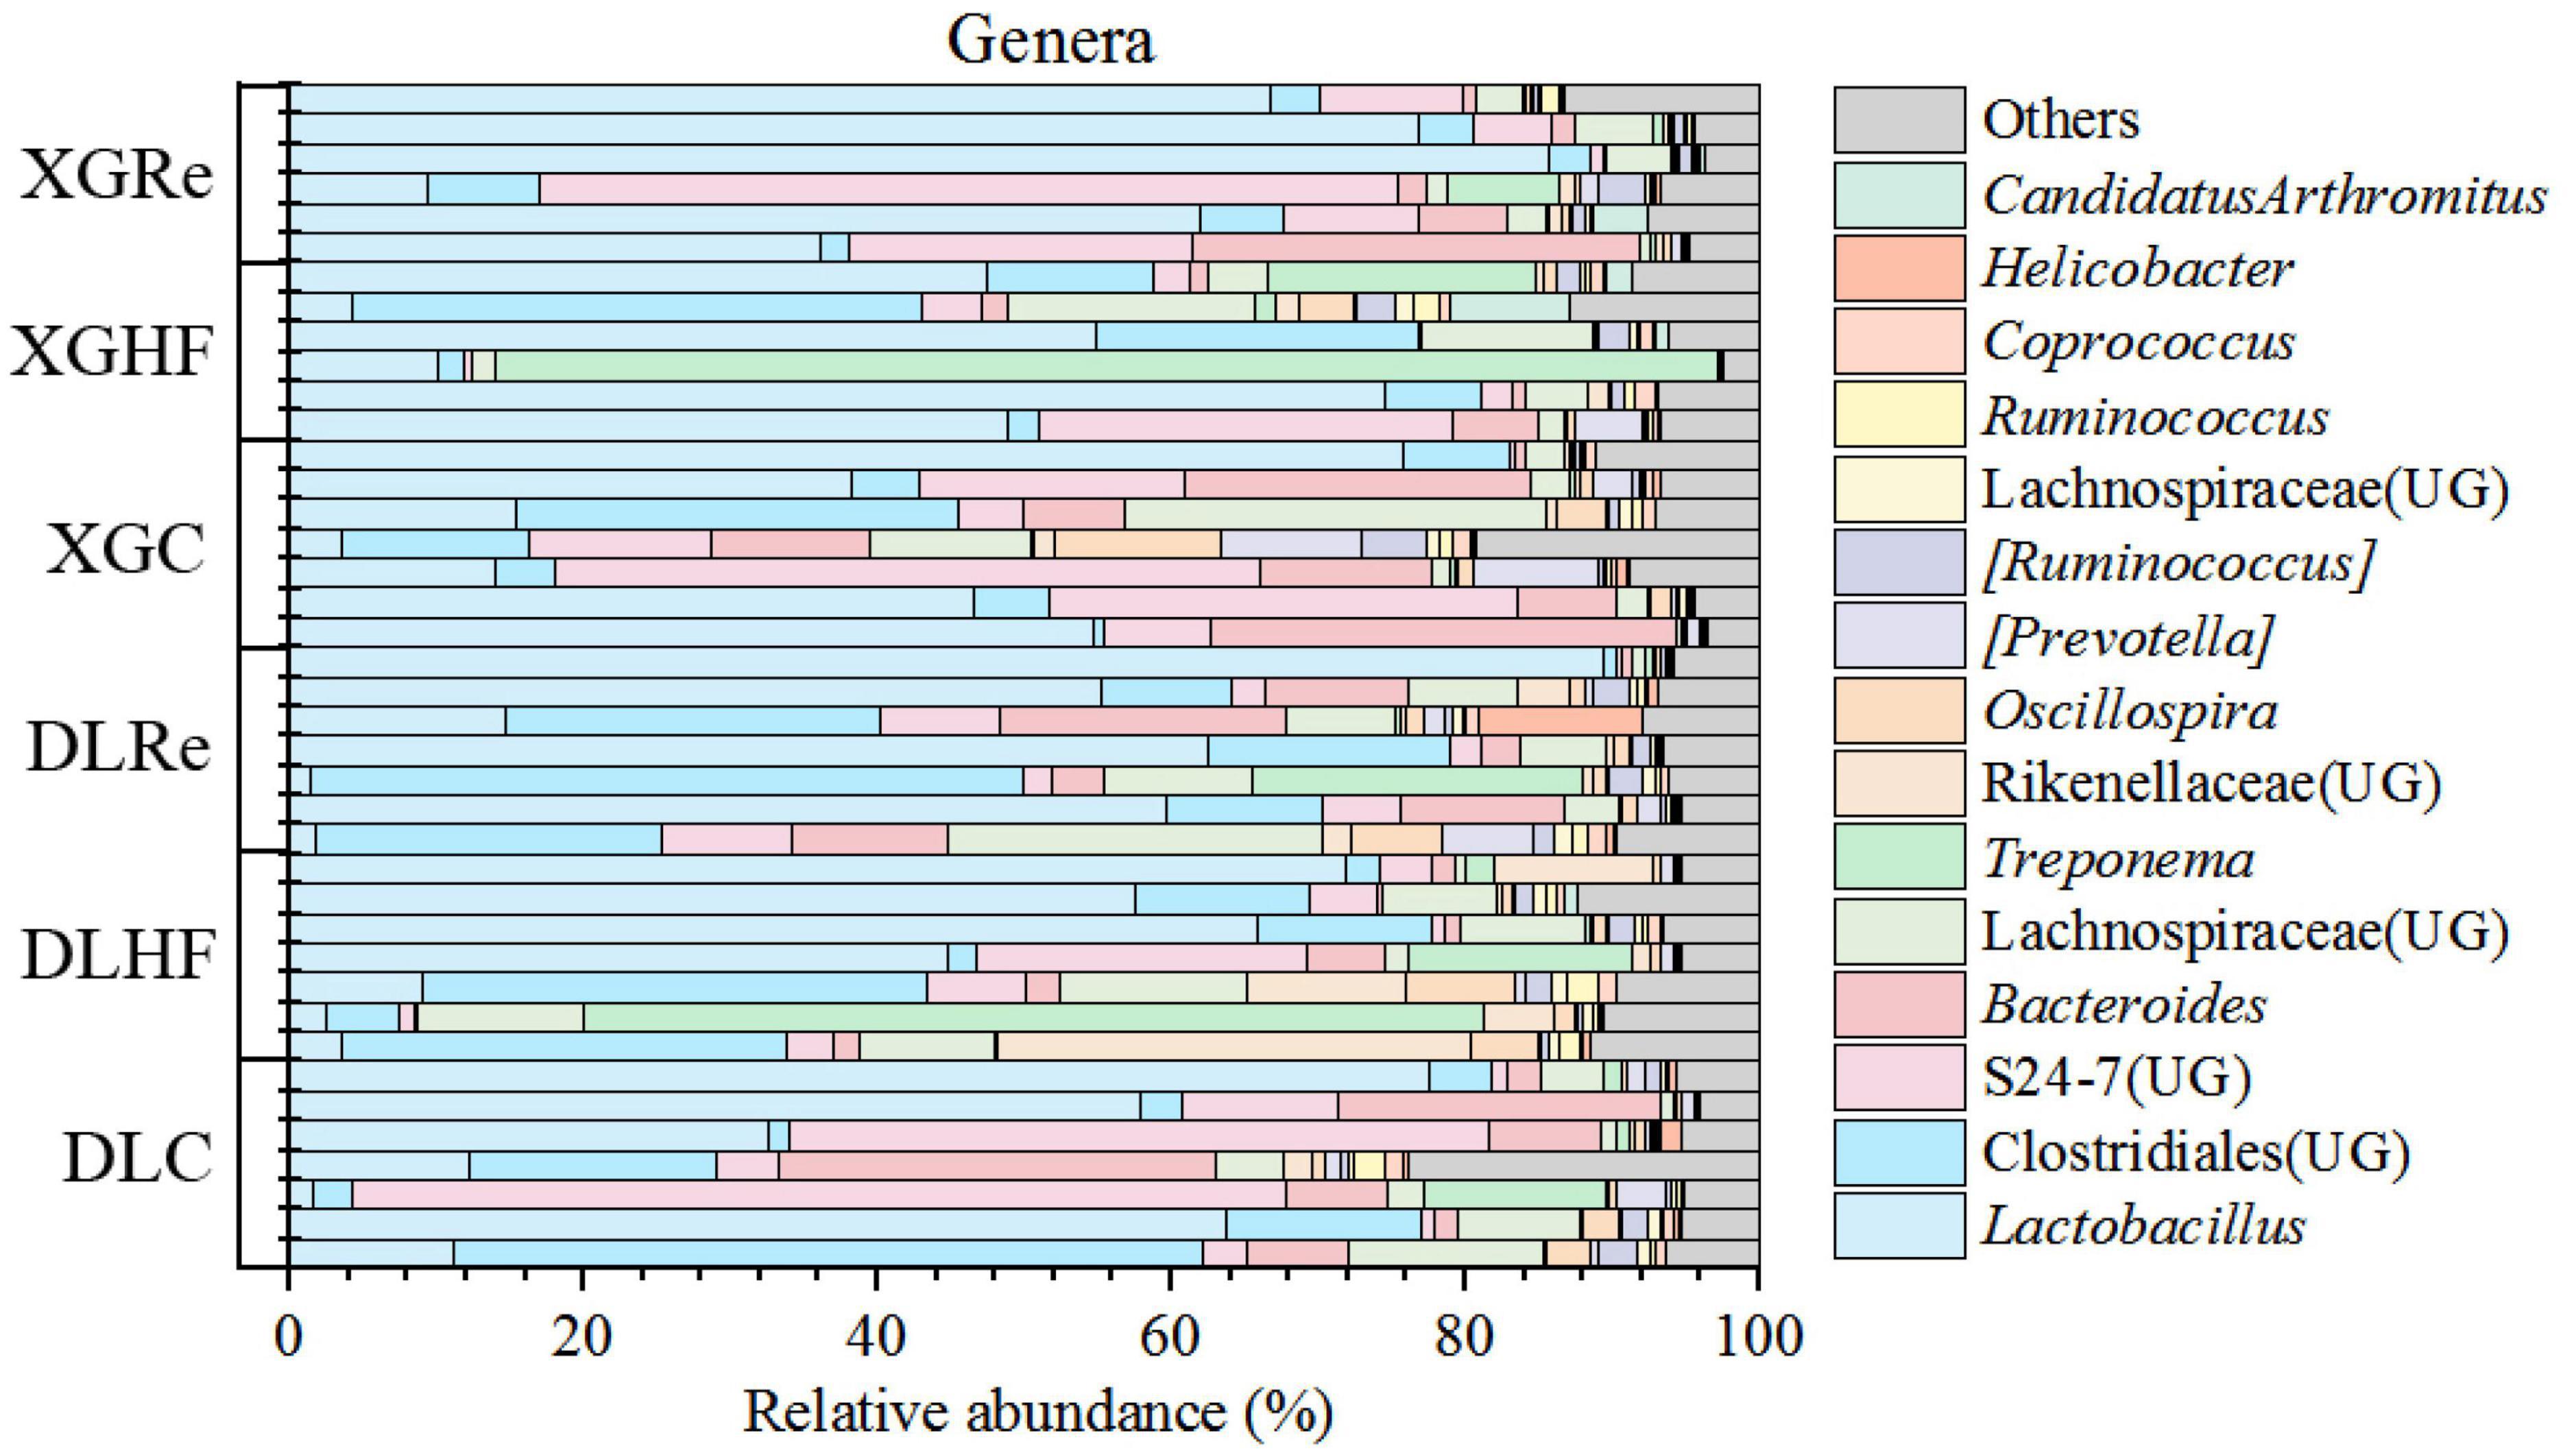
The dominant phyla of fecal microorganisms of E. miletus in two regions were Firmicutes, Bacteroidetes and Spirochaetes, and the average relative abundance in all groups were 67.99, 24.00, and 5.78%, respectively (Figure 1). The dominant genera of fecal microorganisms were Lactobacillus, Clostridiales (UG) and S24-7 (UG), and the average relative abundance in all groups were 40.51, 12.44, and 11.72%, respectively (Figure 2).
3.2. α and β diversity analysis
The correlation between the physiological indicators in DL and the dominant genera of E. miletus feces (the top ten relative abundance of all samples) was shown in Figure 9A.
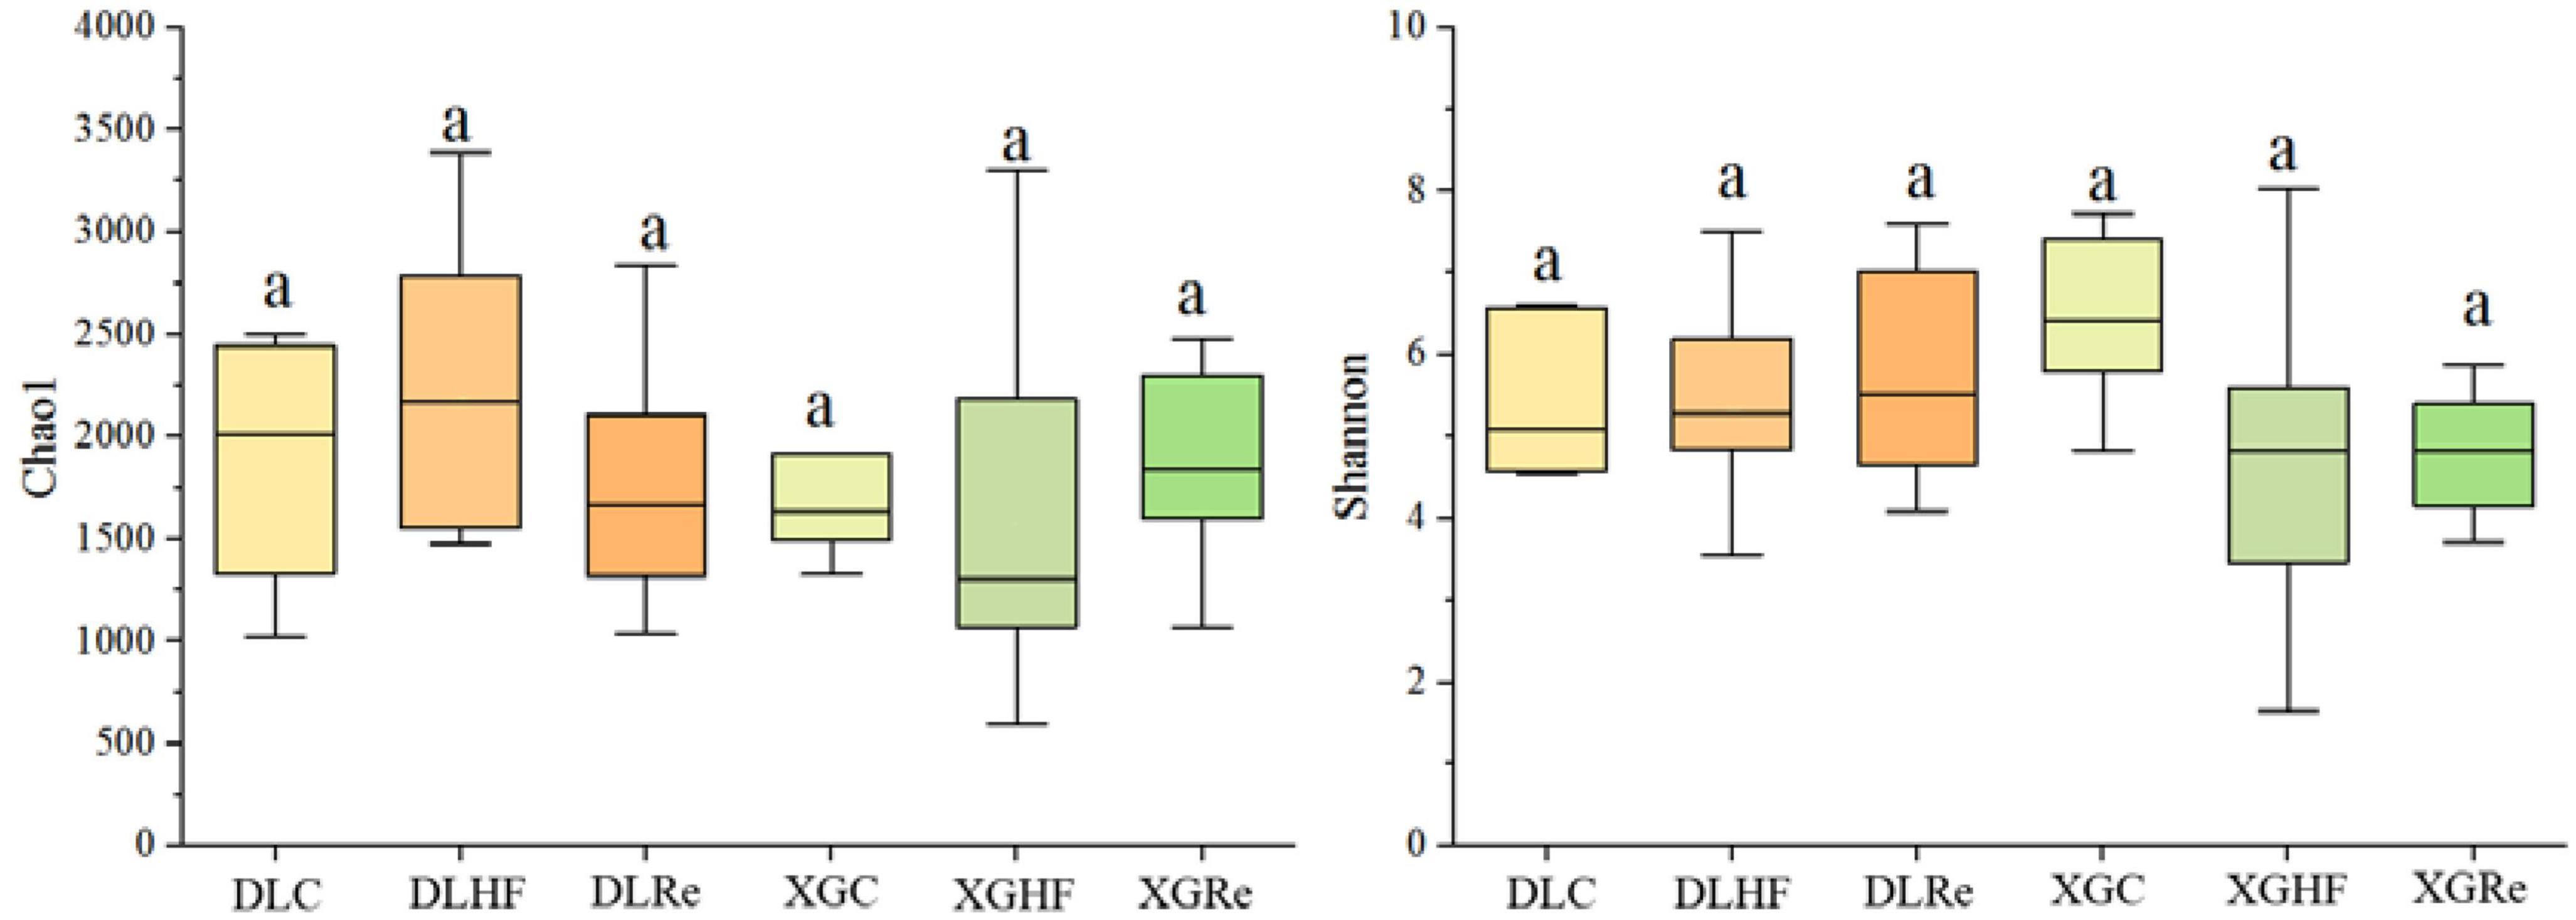
Chao1 and Shannon diversity of fecal microorganisms in E. miletus was shown in Figure 3. According to the results of PERMANOVAs, there was an overall difference in the beta-diversity (based on unweighted matrix) between groups, which was mainly contributed by the significant differences (P < 0.05) between XGC and XGHF groups, as well as between XGRe and DLRe groups (Figure 4 and Table 3).

Table 3. Permutational multivariate analysis of variance (PERMANOVA) test of fecal microorganisms of Eothenomys miletus.
3.3. Distribution of common and unique microorganisms
There were 70 genera of fecal microorganisms of E. miletus in DL. Among them, there were 24 genera unique to the DLC group, 34 genera unique to the DLHF group, and 19 genera unique to the DLRe group (Figure 5A). There were 76 genera of fecal microorganisms of E. miletus in XGLL. There were 30 genera unique to the XGC group, 34 genera unique to the XGHF group, and 15 genera unique to the XGRe group (Figure 5B). There were 71 genera of fecal microorganisms of E. miletus in different regions and periods. Among them, there were 52 genera unique to the DLC group, 62 genera unique to the DLHF group, and 45 genera unique to the DLRe group, 65 genera in the XGC group, 68 genera in the XGHF group, and 50 genera in the XGRe group (Figure 5C).

Figure 5. Venn diagram of fecal microorganisms of Eothenomys miletus. (A) Comparison among different groups in DL. (B) Comparison among different groups in XGLL. (C) Comparison among different groups between DL and XGLL.
3.4. Analysis of microbial enrichment differences
The relative abundance of microorganisms in the feces of E. miletus in DL and XGLL were different (Figure 6). In DL, Bacteroidales, Bacteroides, and Blautia were enriched in the DLC group (P < 0.05). Compared to the DLC and DLRe groups, Alistipes, Sporobacter, and Rikenellaceae were enriched in the DLHF group (P < 0.05), while Blautia was significantly enriched in DLRe group (P < 0.05). The distribution of enriched microorganisms in XGLL was significantly different from that in DL. Compared to the XGHF and XGRe groups, Bacteroides and Clostridium genera were significantly enriched in XGC group (P < 0.05), Anoxybacillus and Methylobacteriaceae were significantly enriched in XGHF group (P < 0.05), and Bacteroidales, Rhizobiales, and Methylobacteriaceae were significantly enriched in XGRe group (P < 0.05) (Figure 6).
3.5. Effects of high fiber foods on physiological indicators
Body mass of E. miletus was significantly affected by the region (F = 52.105, P < 0.001), which in XGLL was significantly lower than that of DL. Food intake were significant influenced by region and diet (Region: F = 47.894, P < 0.001; Diet: F = 8.609, P < 0.001; Region × Diet: F = 8.609, P < 0.001). Food intake in DL was lower than that in XGLL, and the food intake in the XGHF group was higher than that in the XGC group and XGRe group. The effect of region on the RMR was significant (F = 18.656, P < 0.001). RMR of the XGC and XGHF group were higher than that of the DLC and DLHF group. Liver mass of E. miletus in the XG group was significantly higher than that in the DL group (F = 24.645, P < 0.001). The lung mass and small intestine length of E. miletus were significantly affected by the interaction of region and diet (Lung weight: Region × Diet: F = 3.729, P = 0.034; Small intestine length: Region × Diet: F = 5.781, P = 0.007). Small intestine length of the DLC group was lower than that of other groups, which was the longest in the XGHF group. Region had a significant effect on the cecum length (F = 7.49, P = 0.01), and the XG group was higher than the DL group. WAT mass of E. miletus was significantly affected by diet (F = 3.336, P = 0.048). In the control group, WAT weight of the DLC group was higher than that of the XGC group, and the WAT weight of the XGRe group was higher than that of the control group. Region also had a significant effect on the BAT weight of E. miletus (F = 4.958, P = 0.033). BAT weight of the XGC group was higher than that of the DLC group (Figure 7). The influence of region and diet on other indexes of E. miletus were not significant (Table 4).
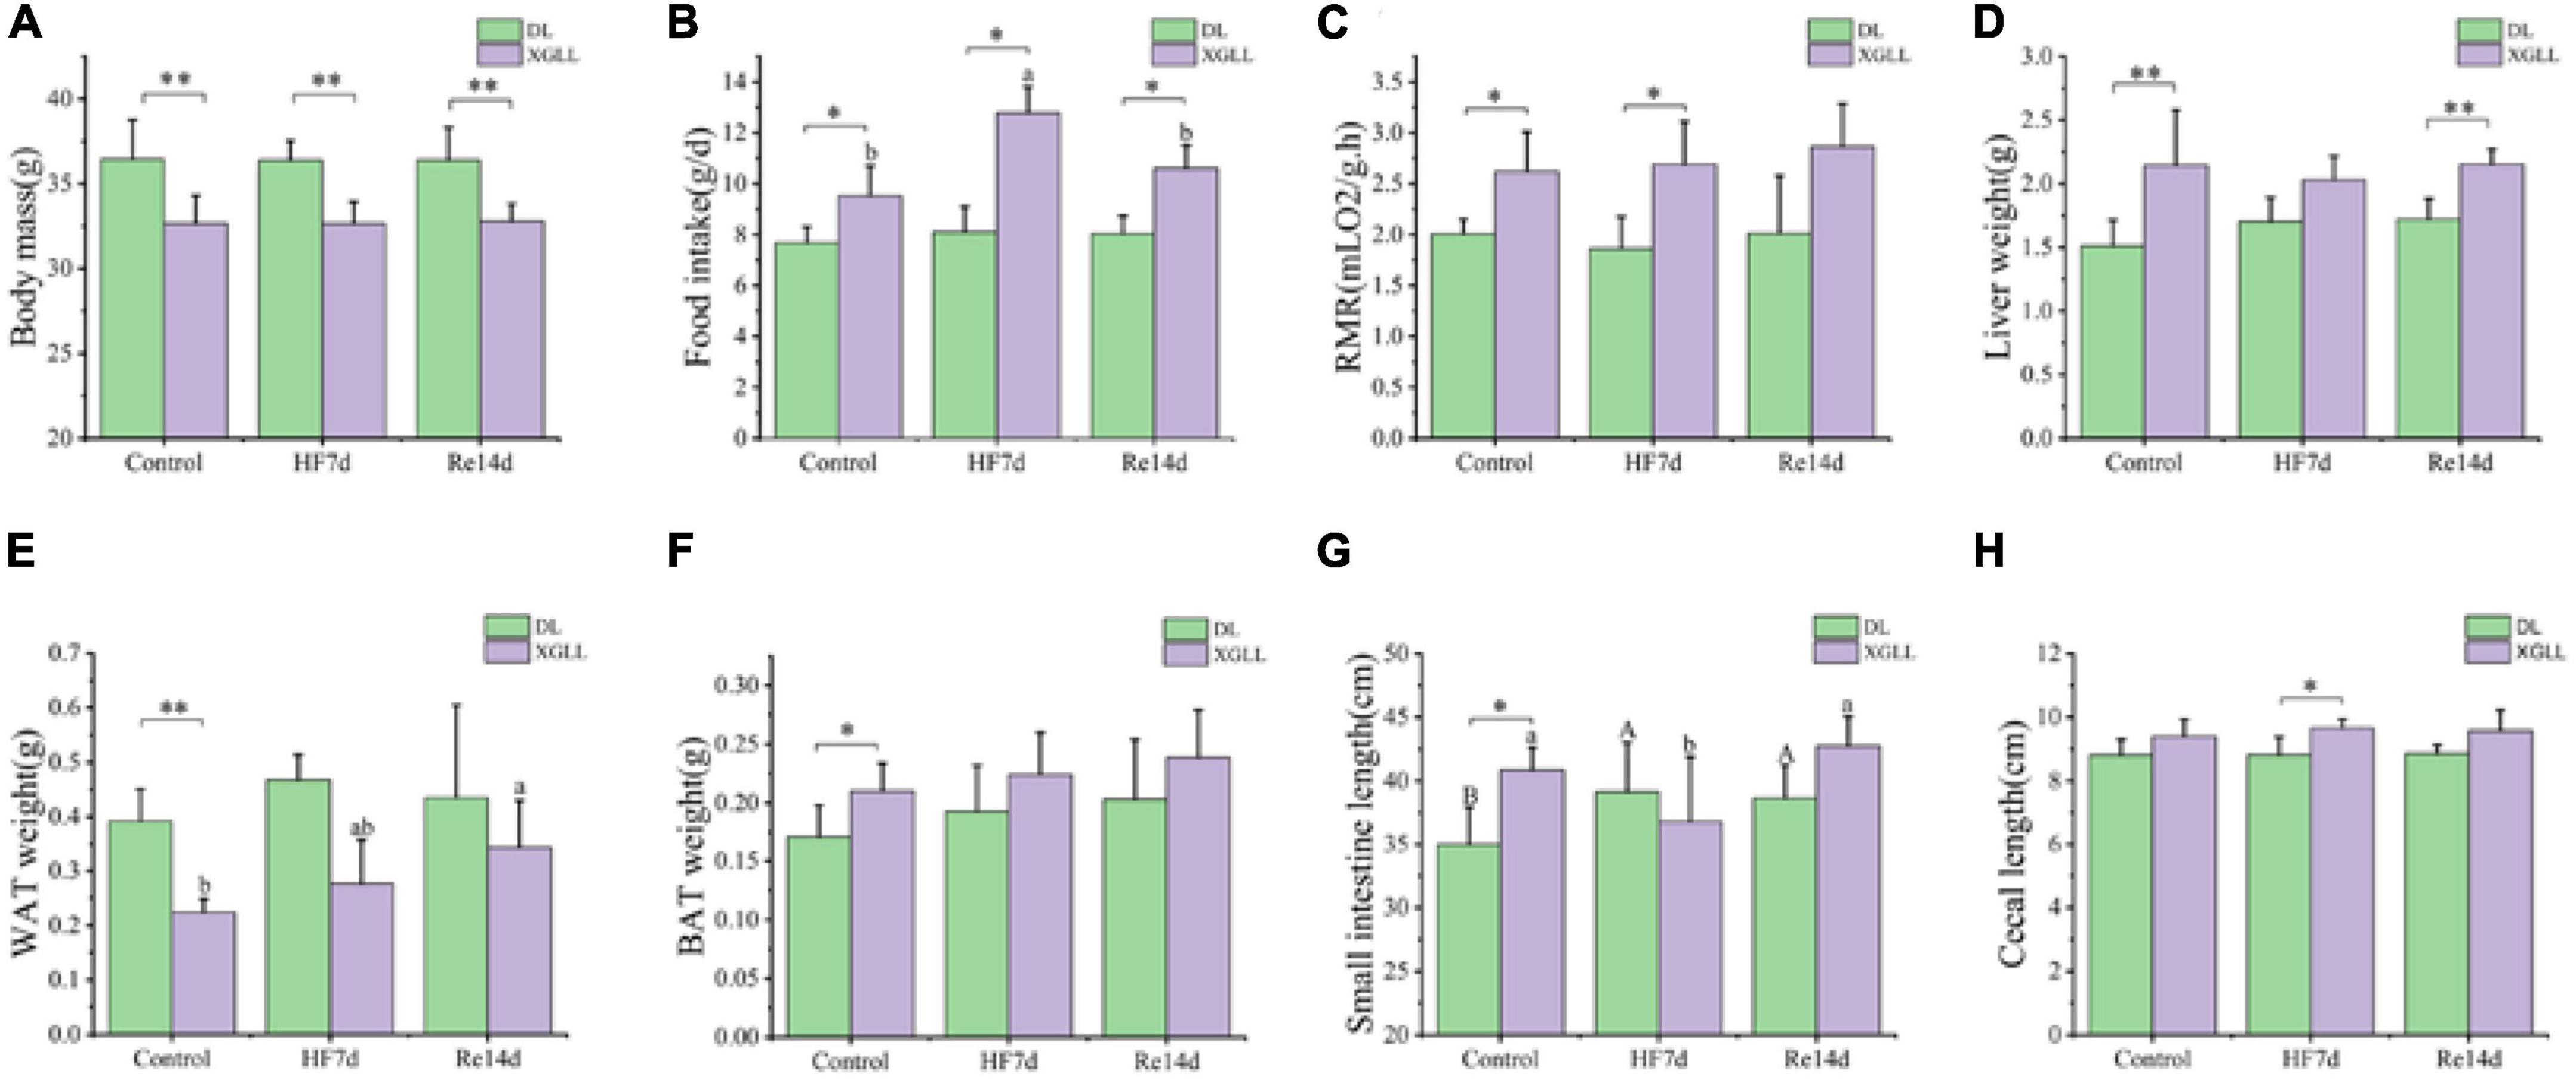
Figure 7. Effects of region and high-fiber food on morphological indicators of Eothenomys miletus. (A): Body mass, (B): food intake, (C) RMR, (D): liver weight, (E): small intestine length, (F): cecum length, (G): WAT weight, (H): BAT weight. Data are mean ± SE. Different letters denote significant differences among treatments in the same region, capital letters refer to the DL region, and lowercase letters refer to the XGLL region. *P < 0.05, **P < 0.01, DL vs. XGLL on the same day.
Leptin and UCP1 of E. miletus were significantly affected by region (Leptin: F = 49.832, P < 0.001; UCP1: F = 7.756, P = 0.009). Leptin in DL was higher than that of XGLL, and UCP1 in XGLL was higher than that of DL. The influence of the region on the SCFAs was significant (F = 4.996, P = 0.032). The SCFAs of the DLC and XGC group were significantly different, and the difference in DL was higher than that in XGLL. Diet had a significant effect on LBP in E. miletus [F(3.633), P = 0.037]. LBP in DLRe group was higher than that in DLHF group (Figure 8). The influence of region and diet on other indexes of E. miletus were not significant (Table 5).
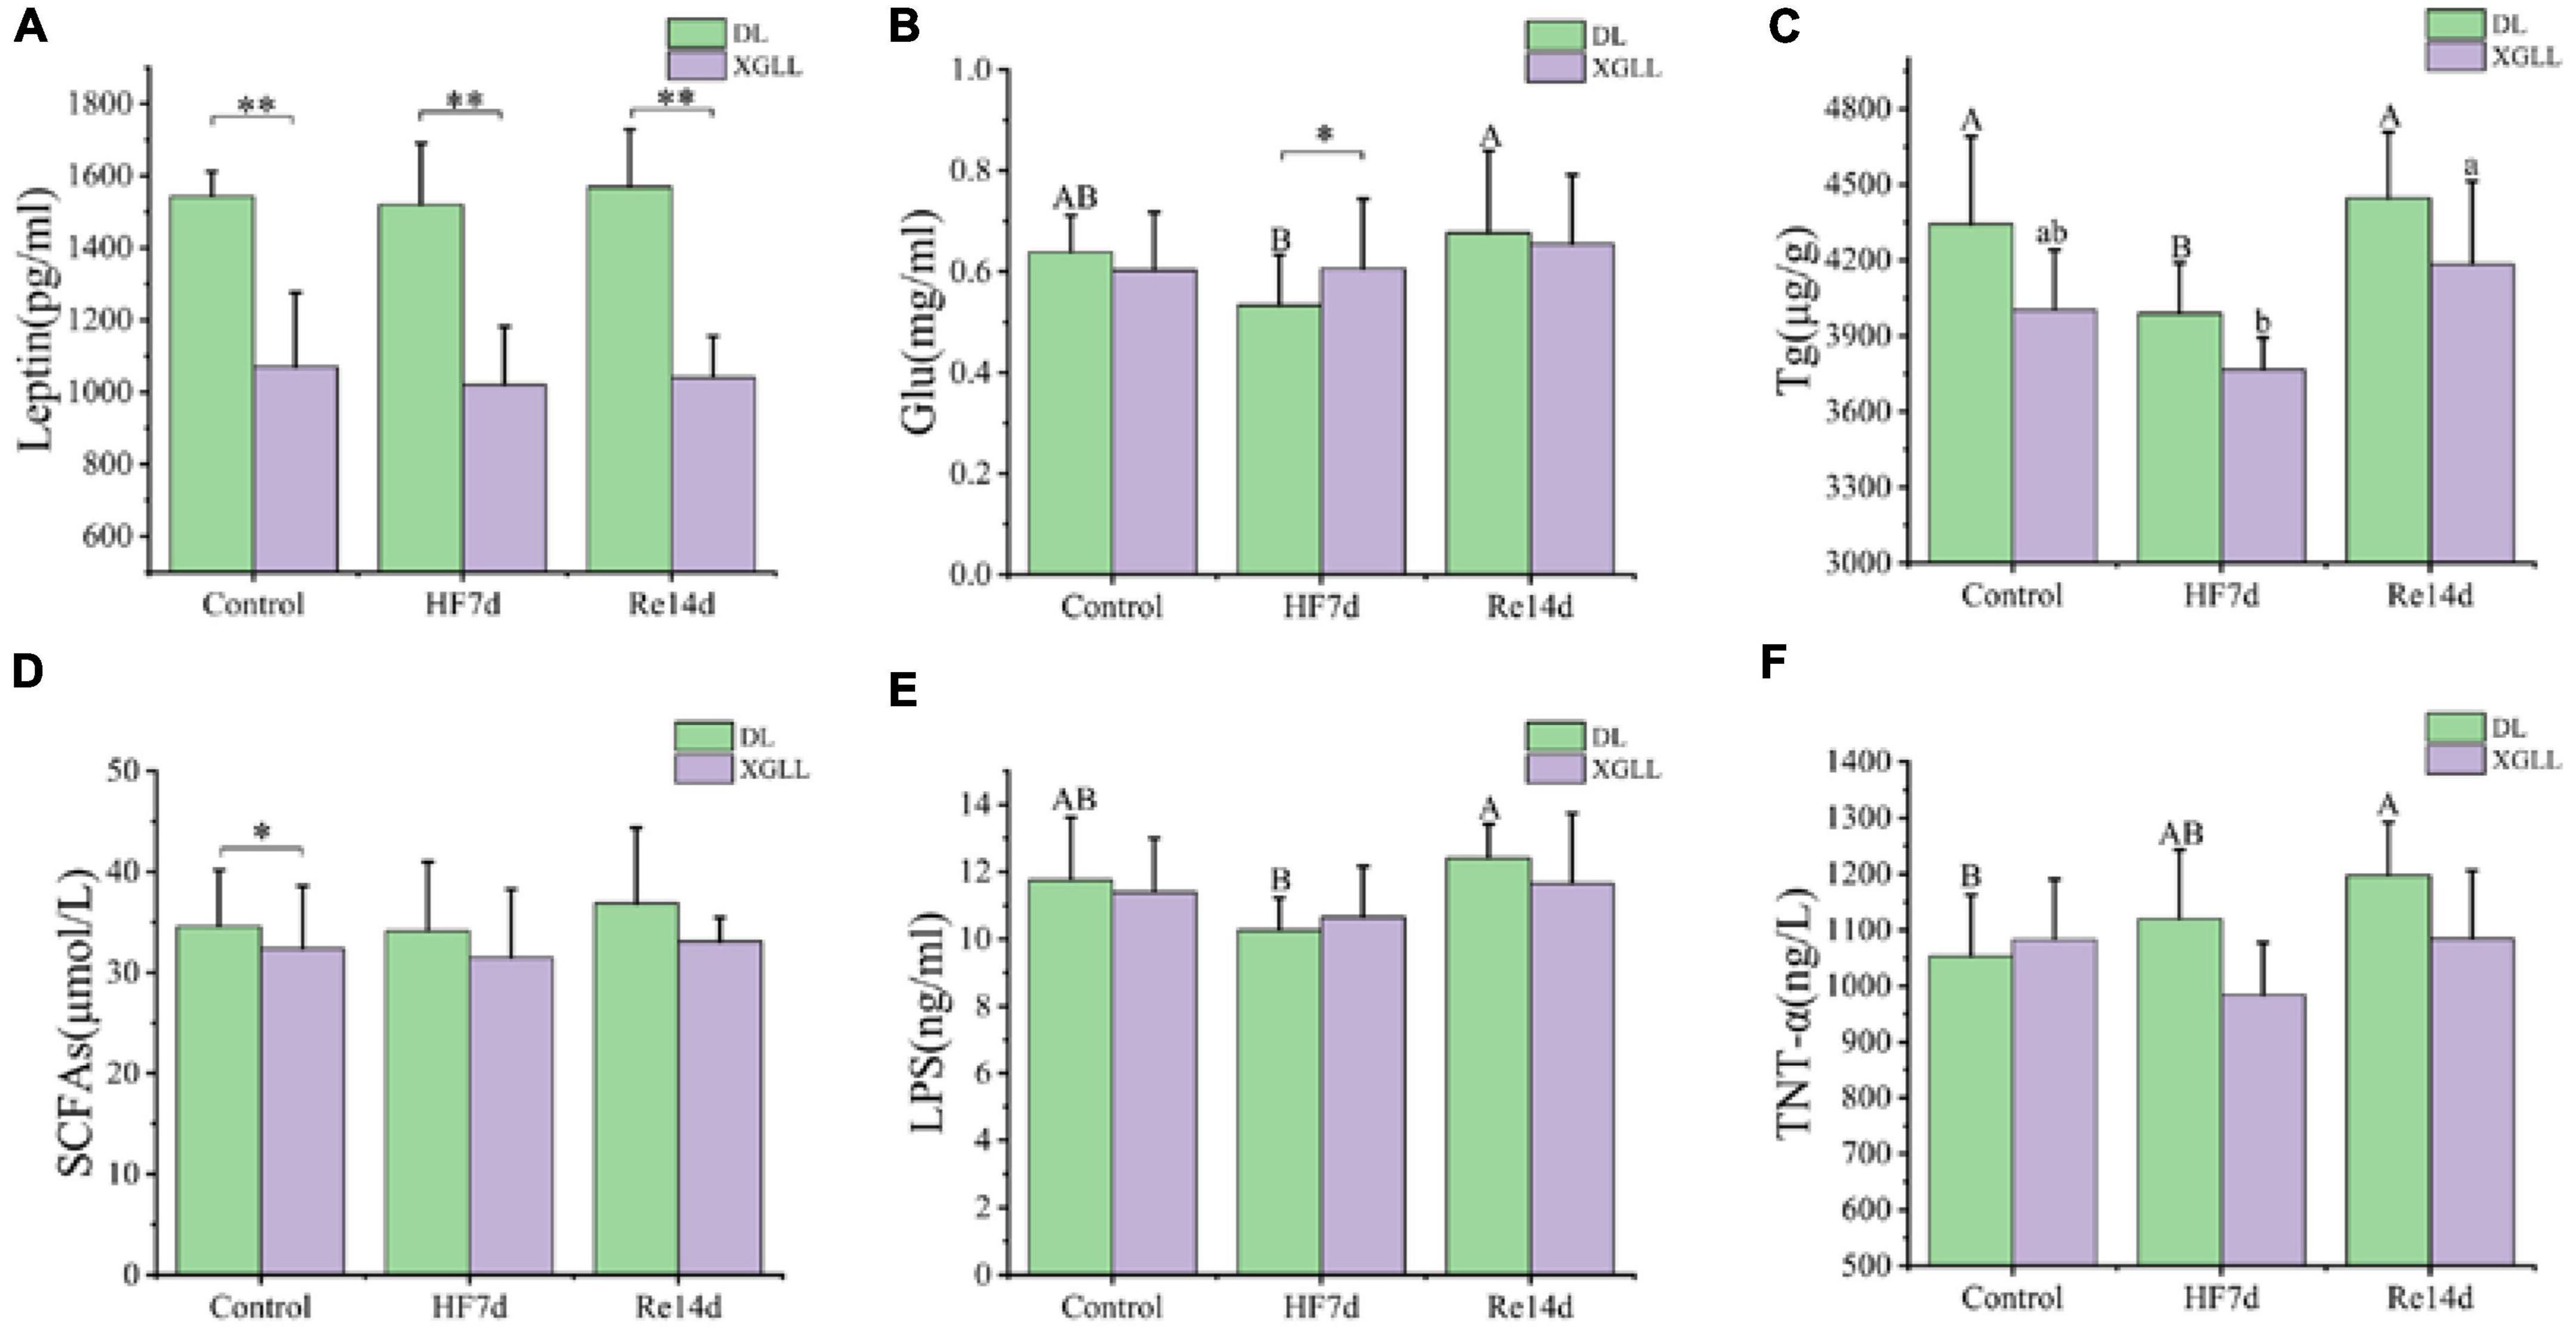
Figure 8. Effects of region and high-fiber food on physiological indices of Eothenomys miletus. (A): Leptin, (B): Glu, (C): Tg, (D): SCFAs, (E): LBP, (F): TNT-α. Data are mean ± SE. Different letters denote significant differences among treatments in the same region, capital letters refer to the DL region, and lowercase letters refer to the XGLL region. *P < 0.05, **P < 0.01, DL vs. XGLL on the same day.
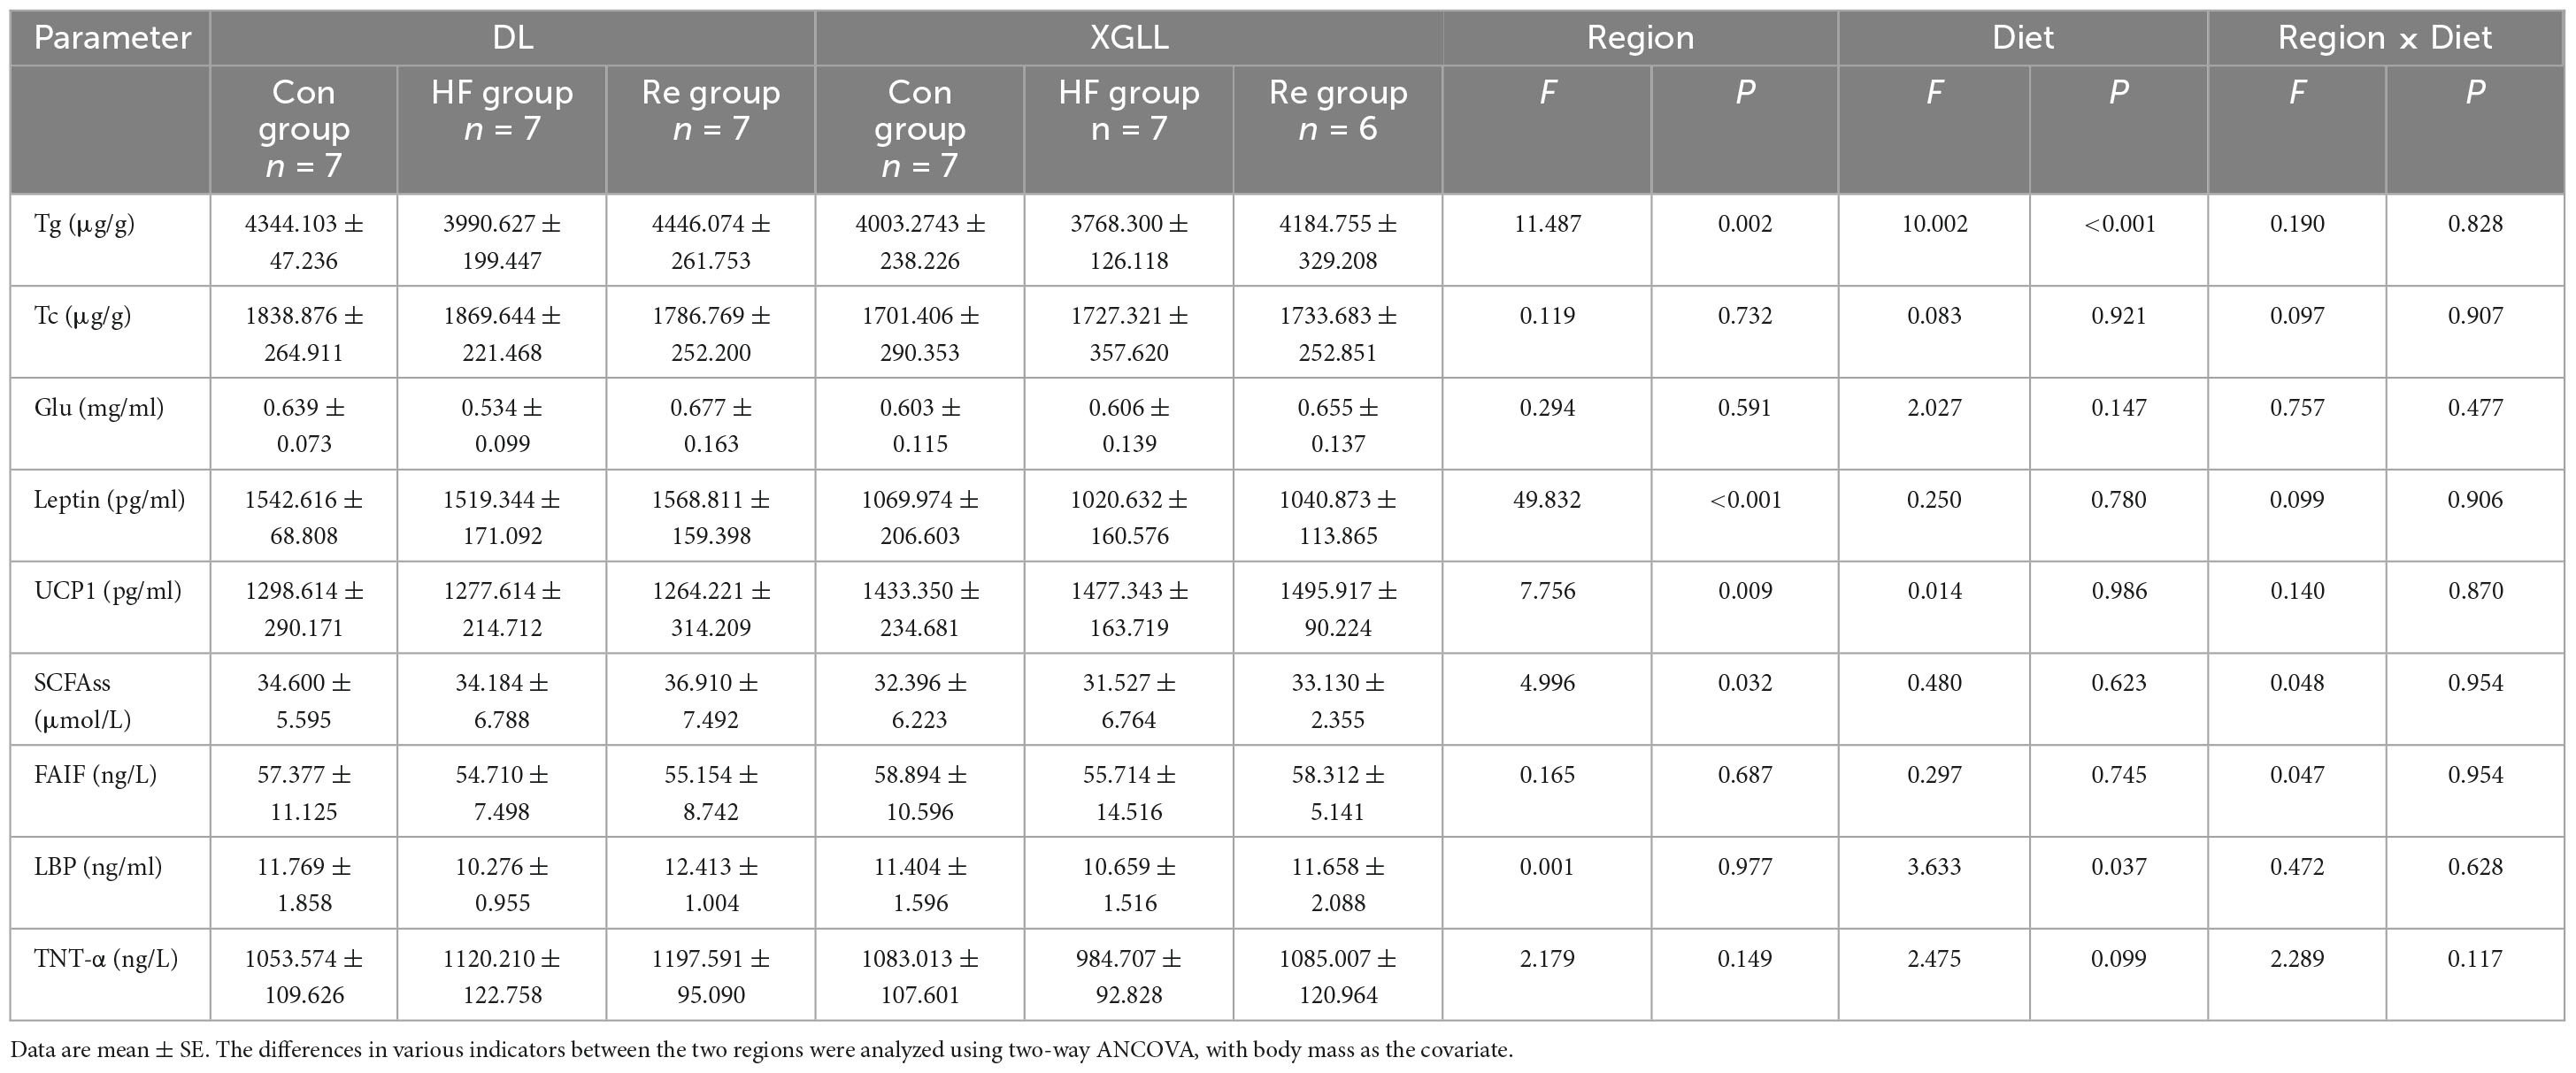
Table 5. Effects of region and high-fiber food on serum physiological indicators in Eothenomys miletus.
3.6. Relationship between physiological indicators and microorganisms in E. miletus
The correlation between the physiological indicators in DL and the dominant genera of E. miletus feces (the top ten relative abundance of all samples) was shown in Figure 9A. From the graph, it can be seen that liver weight is significantly negatively correlated with the relative abundance of Bacteroides (P < 0.01), and positively correlated with the relative abundance of Lachnospiraceae (UG) (P < 0.05); the relative abundance of Lactobacillus was positively correlated with spleen weight (P < 0.01) and negatively correlated with kidney weight (P < 0.05). Moreover, there was a significant negative correlation between WAT weight and relative abundance of Ruminococcus (P < 0.05).
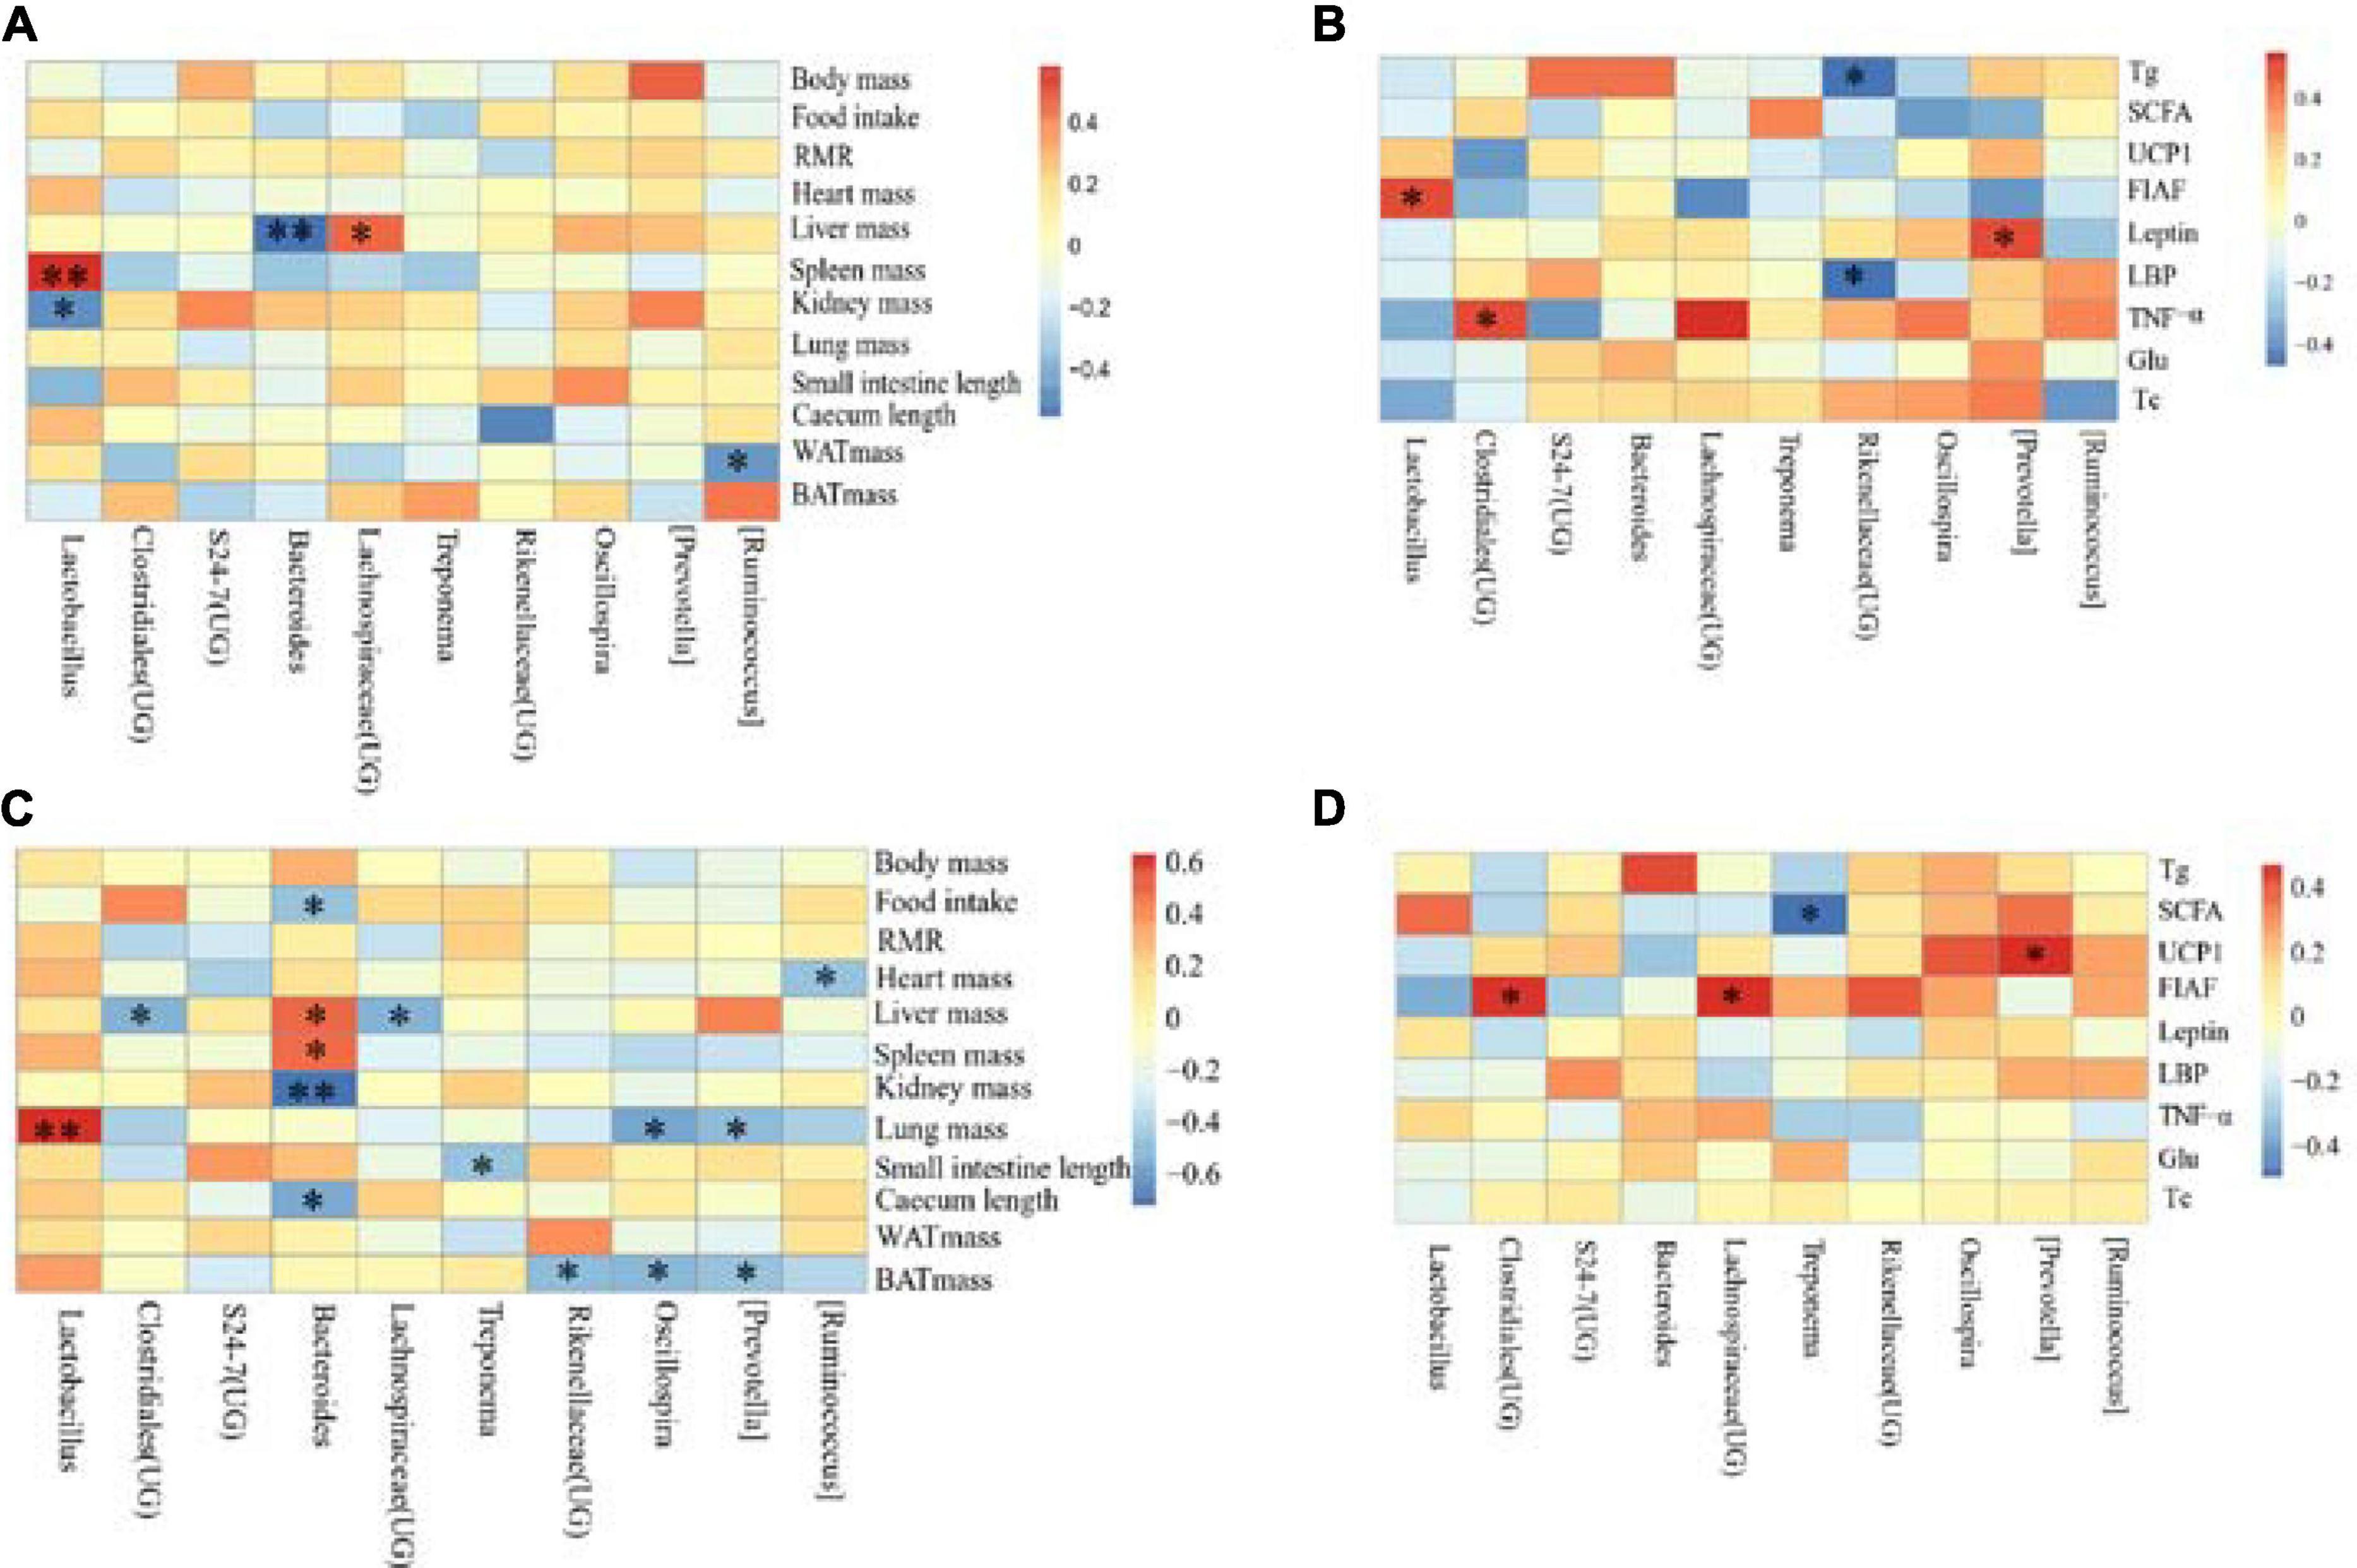
Figure 9. Correlation heat map between physiological indicators and dominant microorganisms of Eothenomys miletus. *P < 0.05, **P < 0.01, Pearson correlation analysis were used by SPSS 21. (A): Physiological indicators in DL, (B): serum physiological indicators in DL, (C): physiological indicators in XGLL, (D): serum physiological indicators in XGLL.
The correlation between the detection indicators in DL and the dominant genera of E. miletus feces (the top ten relative abundance of all samples) was shown in Figure 9B. From the graph, it can be seen that there is a significant negative correlation between Tg and LBP and the relative abundance of Rikenellaceae (UG) (P < 0.05); There is a positive correlation between the relative abundance of leptin and Prevotella (P < 0.05); FIAF is positively correlated with the relative abundance of Lactobacillus (P < 0.05); There was a significant positive correlation between the relative abundance of TNF- α and Clostridiales (UG) (P < 0.05).
The correlation between the physiological indicators in XGLL and the dominant genera of E. miletus feces (the top ten relative abundance of all samples) was shown in Figure 9C. From the graph, it can be seen that there is a significant negative correlation (P < 0.05) between the relative abundance of BAT mass and Prevotella, Oscillospira, and Rikenellaceae (UG); The relative abundance of Bacteroides was negatively correlated with food intake, kidney weight, and cecal length (P < 0.05), while spleen weight was positively correlated (P < 0.05); The liver weight is positively correlated with the relative abundance of Bacteroides, but negatively correlated with the relative abundance of Clostridiales (UG) and Lachnospiraceae (UG) (P < 0.05); The length of the small intestine is negatively correlated with the relative abundance of Treponema (P < 0.05); The relative abundance of Ruminococcus was significantly negatively correlated with heart weight (P < 0.05); The lung weight was significantly positively correlated with the relative abundance of Lactobacillus (P < 0.01), but negatively correlated with the relative abundance of Prevotella and Oscillospira (P < 0.05).
The correlation between the detection indicators in XGLL and the dominant genera of E. miletus feces (the top ten relative abundance of all samples) was shown in Figure 9D. From the graph, it can be seen that the relative abundance of Lachnospiraceae (UG) and Clostridiales (UG) is significantly positively correlated with FIAF (P < 0.05); UCP1 was significantly positively correlated with the relative abundance of Prevotella (P < 0.05); There was a significant negative correlation between the relative abundance of SCFAs and Treponema (P < 0.05).
The correlation between the physiological indicators in different regions and the dominant OTU in the feces of E. miletus is shown in Figure 10. The physiological indicators that have a major impact on the microbial community were TNF-α, Tg, UCP1, SCFAs, and leptin. The RDA results showed that the explanatory power of these physiological indicators on microorganisms with main axes were 5.88 and 3.88%, respectively.
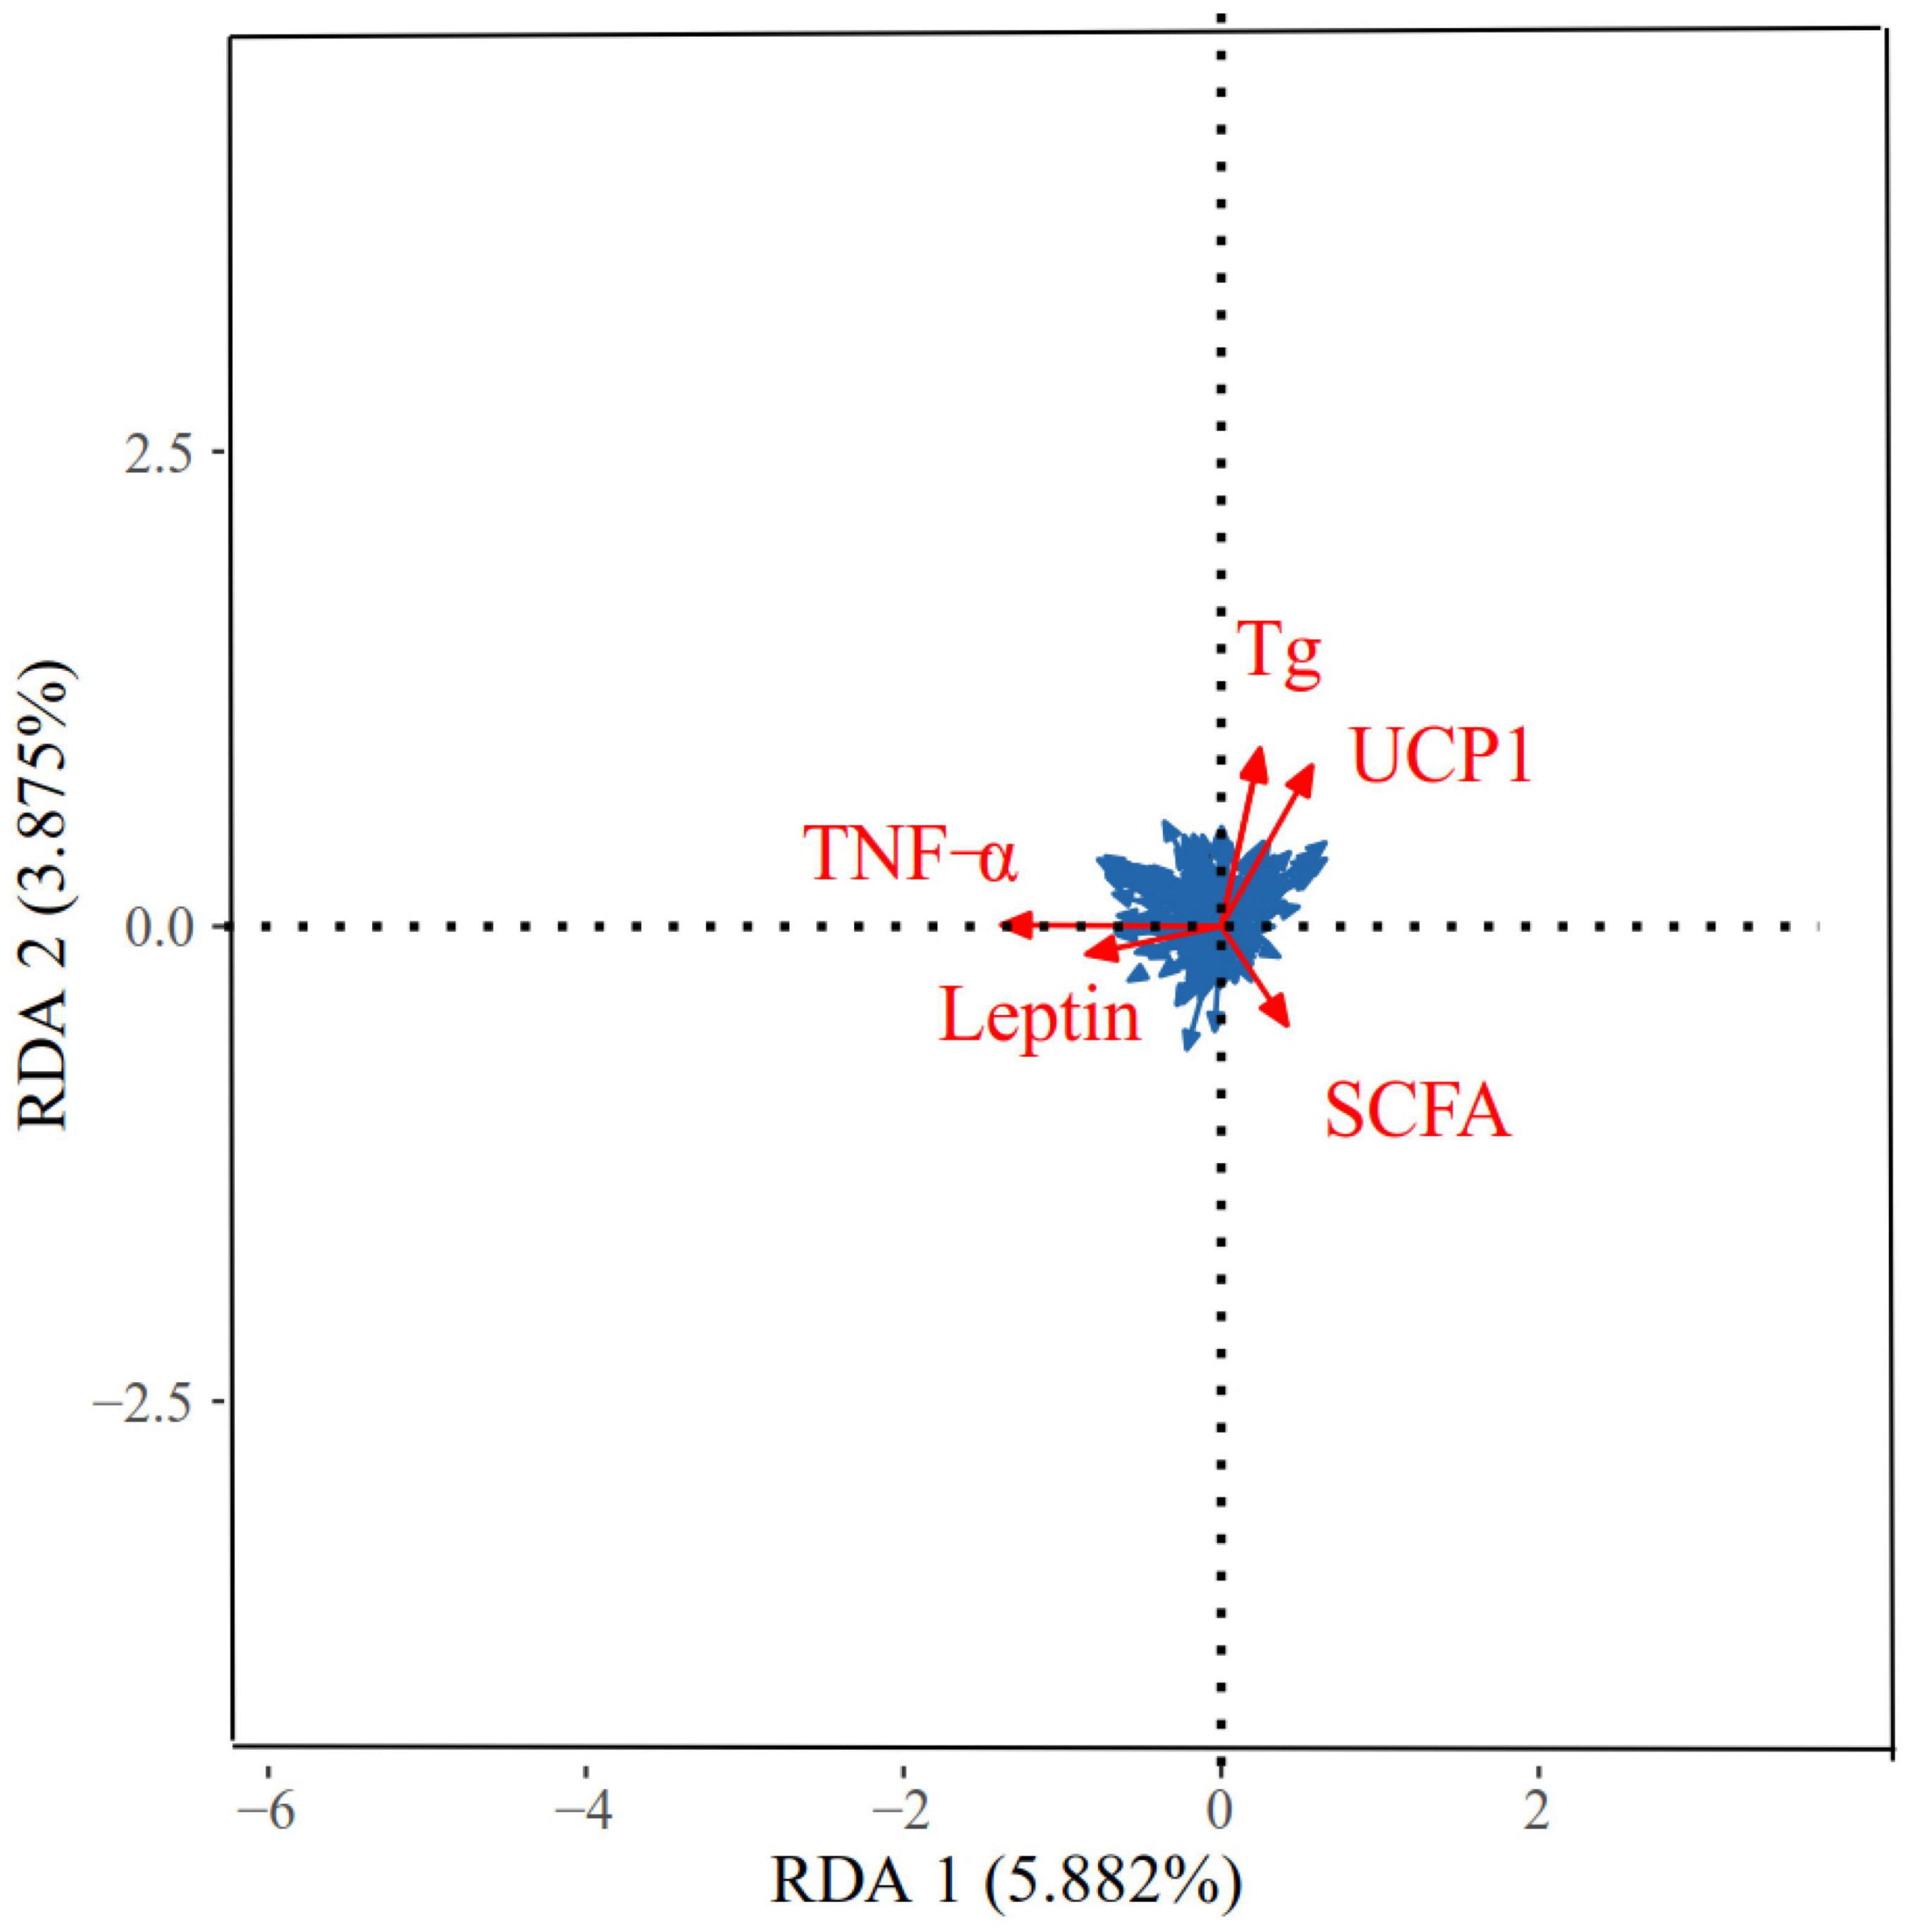
Figure 10. Redundancy analyses (RDA) of the correlation between physiological indicators and dominant microbial communities in Eothenomys miletus. RDA was used to assess the correlation between dominant genera (top 9) and physicochemical factors using Canoco 5.0.
3.7. Co-occurrence network of fecal microorganisms of E. miletus in different regions
The dominant OTUs correlation network of E. miletus feces in different regions was shown in Figure 11. The network analysis included the top 200 OTUs with relative abundance, and based on Gephi 0.9.2, a network with 200 nodes and 1149 edges was constructed, including 1139 positive edges and 10 negative edges. It means that the microorganisms in the advantage OTU co-occurrence network were mainly cooperative.
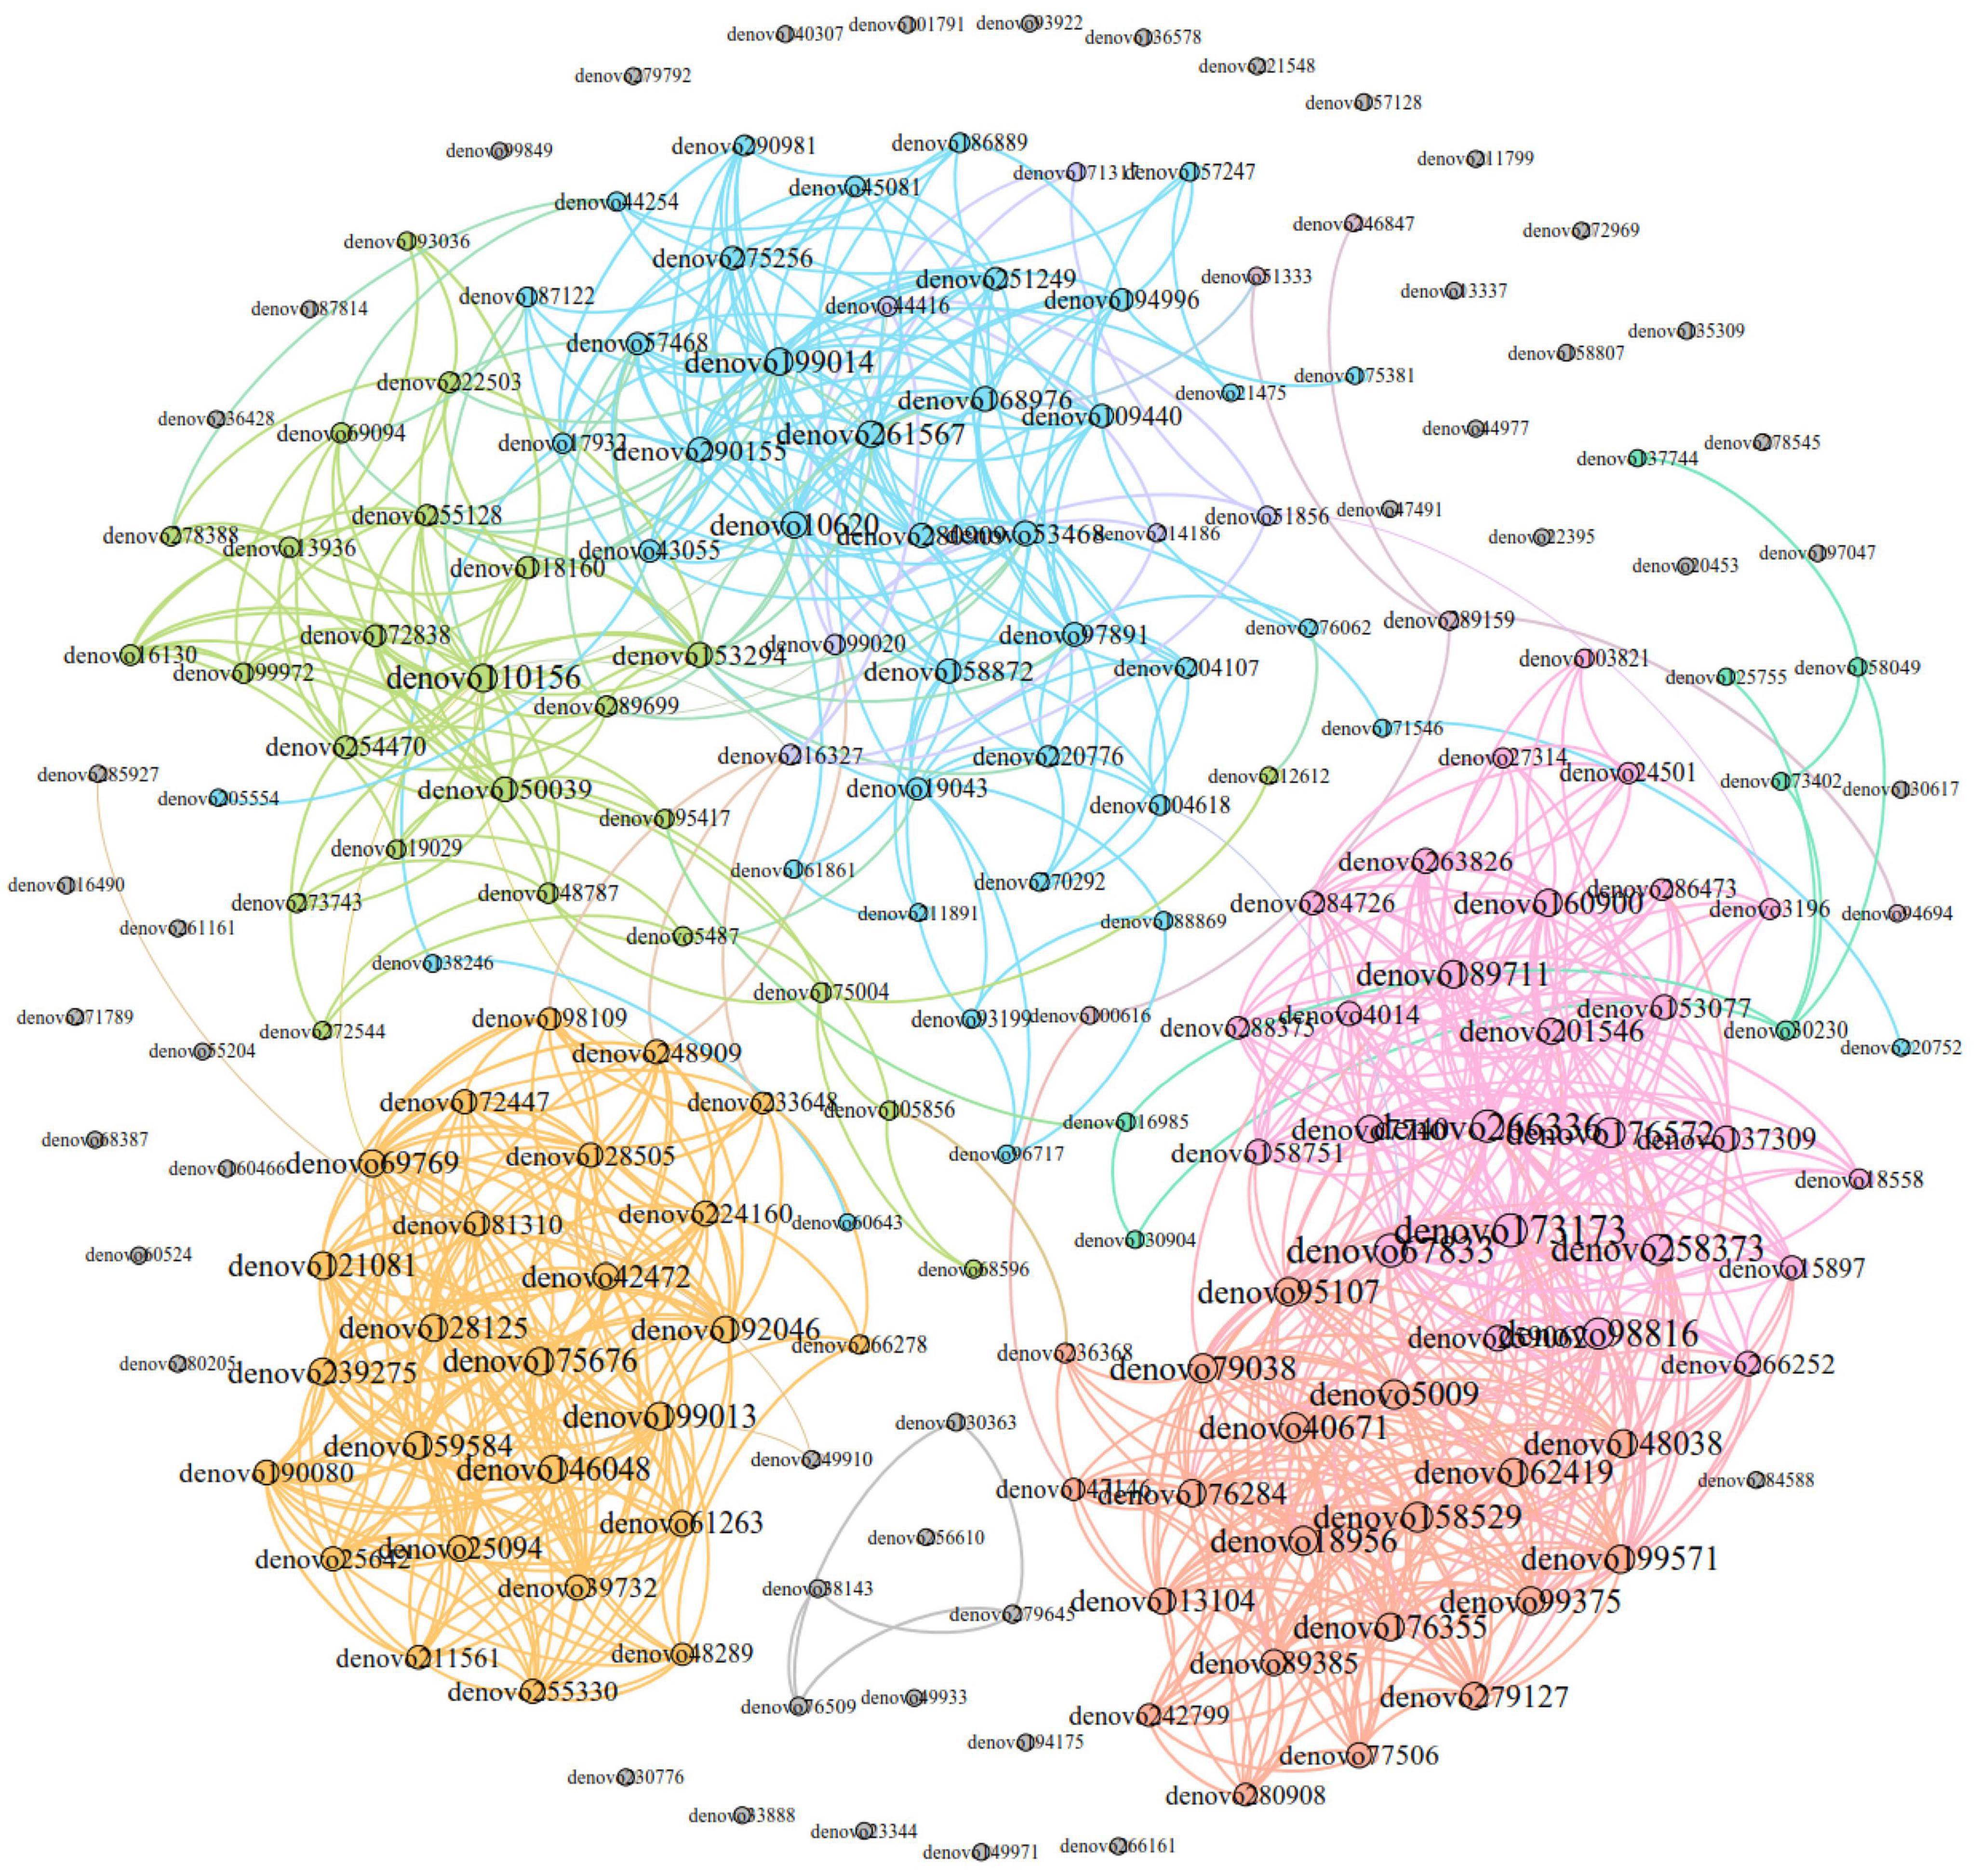
Figure 11. Dominant OTU co-occurrence network of Eothenomys miletus between two regions. Nodes were colored according to their modular characteristics, and the same color represented a close correlation within the module. The colors of the edges were consistent with their corresponding node. The size of a node was positively correlated with the degree, and the larger it was, the more connections it had in the network.
4. Discussion
4.1. Intestinal microorganisms of E. miletus
Animal species are abundant and their feeding habits are complex, and these complex ecological characteristics also shape the different gut microbiota characteristics. Previous researches results have shown that gut microbiota in E. miletus were highly adapted to their herbivorous habits (Yan and Zhu, 2023). In the present study, the main dominant organisms in the gut microflora of E. miletus at the facultative level were Firmicutes, Bacteroidetes and Spirochaetes, and a high ratio of F/B is essential for the digestion of cellulose and hemi fibre in phytophagous animals, and also in the gut microflora of small mammals, such as Ochotona curzoniae, Meriones unguiculatus, where the ratio of F/B were also high (Ley et al., 2006; Steelman et al., 2012; Li et al., 2016; Khakisahneh et al., 2020). The HF group possessed higher F/B ratios compared to previous experiments and the control group in this experiment, and Spirochaetes were found to be associated with Xylan and Carboxymethyl cellulose fermentation (Flint et al., 2008). The dominant organisms in E. miletus gut microbiota at the genus level were the same as in previous studies, Lactobacillus, Clostridiales (UG) and S24-7 (UG), but with different proportions. Lactobacillus had the highest percentage of 40.51% in this experiment and S24-7 (UG) had the highest percentage of 29.32% in the previous experiment. It has been shown that Lactobacillus, Clostridiales (UG) and S24-7 (UG) were associated with the digestive degradation of cellulose, and Lactobacillus also assists the host in releasing phytochemicals with potent antioxidant and anti-inflammatory activities from ingested fiber, and from the results of the present experiments, it is hypothesized that Lactobacillus may possess a higher level of fitness for high-fiber foods (Van Dyke and McCarthy, 2002; Russell and Duthie, 2011; Geirnaert et al., 2012; Ormerod et al., 2016; Serena et al., 2018). The results of the present experiment indicated that the high proportion of F/B and the enrichment of cellulose degrading bacteria in the intestinal microbiota of E. miletus enhanced their adaptability to high-fiber foods.
4.2. Effects of high-fiber food on intestinal microorganisms and physiological indicators of E. miletus
Body mass directly reflects the energy balance in mammals (Zhu et al., 2010). In the present study, high fiber food had no significant effect on body mass of E. miletus, but it had a significant effect on food intake, which was higher in the HF group than in the other groups. For high-fiber food, which was difficult to digest to obtain nutrients, E. miletus may regulate their body weight homeostasis by increasing the amount of food intake so as to obtain more energy. Compensating for decreased digestibility by increasing food intake is a common strategy in small mammals, such as the herbivorous Dicrostonyx groenlandicus and Meriones unguiculatus, and has also been adopted by E. miletus for high-fiber foods (Nagy and Negus, 1993; Zhao and Wang, 2007). Following a high-fiber diet, small intestine grew in length, and the mass of the digestive tract (except the stomach) also increased, E. miletus showed similar responding to high-fiber foods (Kass et al., 1980).
Host food resources are the main factor affecting gut microbiota diversity, and a high-fiber diet can increase gut microbiota diversity (Hu et al., 2018). According to the results of PERMANOVA, it was found that the differences in β-diversity between XGC group and XGHF group, and between XGRe and DLRe groups were significant, indicating that there were structural differences in the gut microorganisms. Venn diagram results showed that HF group contained the most species of gut microbiota, followed by the control group, and the Re group had the smallest number. The high-fiber food might increase the β-diversity of intestinal microorganisms in E. miletus.
The gut microbiota can assist the host in digesting difficultly decomposed food, providing nutrients that were originally unavailable, and allowing the host to flexibly respond to constantly changing environments (Salyers et al., 1977; Lindsay et al., 2020). In the present study, through the enrichment of intestinal microorganisms in each group of E. miletus, it was found that Bacteroidales and Bacteroides were enriched among DLC, XGC and XGRe groups. Studies have shown that Bacteroides could supplement eukaryotic genome by degrading enzymes targeting resistant dietary polymers, and it is believed that Bacteroidota had the higher fiber degradation potential compared with other phyla (Martínez et al., 2010; El Kaoutari et al., 2013). In addition to typical cellulose degrading bacteria, some probiotics capable of digesting cellulose were enriched in the intestinal microorganisms of E. miletus. Between the DLC group and the DLRe group, Blautia was enriched, which can prevent pathogen colonization by producing bacteriocin, and exhibited anti-inflammatory properties and maintained glucose homeostasis by up-regulating the production of regulatory T cells and SCFAs (Liu et al., 2021). Alistipes, Sporobacter and Rikenellaceae enriched in the DLHF group were all probiotic bacteria, and studies have shown that Alistipes, Rikenellaceae, and Sporobacter all produced acetic acid and were involved in the uptake and metabolism of SCFAs, and Rikenellaceae could degraded aromatic compounds and produced SCFAs, SCFAs play an important role in appetite regulation, energy metabolism, inflammation and disease as end products of fermentation of dietary fiber and resistant starch, moreover, Rikenellaceae were considered to be a key bacterium for the control of intestinal infections or inflammation in the treatment of non-infectious colitis (Morrison and Preston, 2016; Parker et al., 2020; Qiu et al., 2022; Nishihara et al., 2023). Anoxybacillus was enriched in the XGHF group, and research suggested that it was beneficial for the proliferation of probiotics such as fecal bacteria and Lactobacillus rosenbergii (Liu et al., 2011). Current research suggested that high-fiber foods as prebiotics can promote the growth of specific members of the resident gut microbiota, stimulated the production of SCFAs, lower pH, and maintain intestinal homeostasis (Scott et al., 2013). However, it is worth noting that Methylobacteriaceae, which was enriched in the XGHF and XGRe group, was an opportunistic pathogen that poses a threat to human health and has been found to be able to enter the silkworm gut through food (Consiglieri et al., 2020; Li et al., 2020). In our study, the abundance of dominant fiber degrading bacteria increased after the high-fiber diet in E. miletus, thus digesting more fiber to provide energy for them. At the same time, it promoted the proliferation of probiotics, participated in the regulation of immunity and energy metabolism of E. miletus through SCFAs and other metabolites, and maintained the energy balance and health of E. miletus.
Through redundancy analysis, it was found that SCFAs, leptin, UCP1, and Tg may have a major impact on the microbial community. Studies have found that SCFAs not only play an important role in maintaining energy balance and increasing energy regulation such as insulin, but also promote intestinal barrier function and intestinal immune homeostasis through various mechanisms, thereby regulating the affinity of fibers in the intestine through immune regulation and increasing the proportion of beneficial bacteria in the gut microbiota (Chawla and Patil, 2010). Propionate and butyrate can participate in the body’s energy metabolism, increase energy consumption, and down regulate TNT-α gene expression and release of inflammatory factors to maintain intestinal homeostasis (Mattace Raso et al., 2013). In the current experiment, there was a significant negative correlation between the WAT weight and the relative abundance of Ruminococcus, and between Tg and the relative abundance of Rikenellaceae (UG) in DL; There was a significant negative correlation between BAT mass and the relative abundance of Prevotella, Rikenellaceae (UG) and Oscillospira in XGLL. Research showed that Ruminococcus, Rikenellaceae and Prevotella were all fiber degrading bacteria, which can degrade structural carbohydrates and starch, and can produce SCFAs such as acetate and propionate (Bi et al., 2018; Qiu et al., 2022). In this experiment, under the condition of high-fiber food, it is speculated that the metabolites of E. miletus after their intestinal microorganisms digested cellulose may participate in the regulation of energy metabolism of E. miletus by inhibiting the production of BAT and WAT. Moreover, the relative abundance of LBP was significantly negatively correlated with the relative abundance of Rikenellaceae and positively correlated with the relative abundance of Lactobacillus in DL, while the relative abundance of Lachnospiraceae (UG) and Clostridiales (UG) were significantly positively correlated with the relative abundance of Lactobacillus in XGLL. Research has shown that Lachnospiraceae utilizes lactic acid and acetic acid to produce butyric acid; Lactobacillus can improve intestinal integrity, reduce systemic LBP level, regulate lipid metabolism, and regulate the composition of gut microbiota and SCFAs (Lim et al., 2016; Mollica et al., 2017). In our experiment, it showed that E. miletus can regulate body immunity by inhibiting LBP by specific flora and promoting the production of LBP inhibitory factor FIAF, so as to maintain body health.
Liver is one of the thermogenic organs of small mammals (Zhu et al., 2011). In the present study, after high-fiber diet acclimation, the liver weight of DL increased, while that of XGLL decreased, and increased after refeeding. Analyses of gut microorganisms on related indicators revealed that liver weight of DL was significantly negatively correlated with the relative abundance of Bacteroides and positively correlated with the relative abundance of Lachnospiraceae (UG), while liver weight of XGLL was positively correlated with the relative abundance of Bacteroides, and negatively correlated with the relative abundance of Clostridiales (UG) and Lachnospiraceae (UG). Prevotella relative abundance is positively correlated with leptin and UCP1 (Pfannenberg et al., 2010), suggested that under high-fiber food conditions, Bacteroides, Lachnospiraceae (UG) may assist in thermogenesis in the liver of E. miletus through metabolites, and Prevotella metabolites may be involved in the regulation of thermogenesis by modulating the contents of leptin and UCP1, and thus enhancing its adaptation to the high-fiber food environment.
Specific flora had a preference for certain specific food components in different environments, and the metabolites of the flora would participate in the regulation of the intestinal microenvironment and host homeostasis, and the intestinal microenvironment will be more conducive to the reproduction and growth of the relevant flora in large quantities and colonization, so as to maintain the balance of the host homeostasis (Moeller and Sanders, 2020). In the present study, under the condition of high-fiber food, different bacterial groups participated in food digestion or energy metabolism etc., of E. miletus. The co-occurrence network results showed that intestinal microorganisms were dominated by cooperation, and positive cooperation played an important role in adaptation to high-fiber food (Abbas et al., 2020).
4.3. Regional differences in body mass regulation under high-fiber food
Under the condition of high-fiber diet, body mass, food intake, RMR, liver weight, cecum length, BAT weight, leptin, UCP1 and SCFAs of E. miletus were significantly different between DL group and XGLL group. The elevation of XGLL was higher than that of DL, and the winter temperature and food stress were greater in XGLL. The higher metabolism in XGLL may related to heavier liver and BAT mass, and higher UCP1 content was its adaptation to low temperature environment and longer cecum is an adaptation to the high-fiber food, which was similar to our previous results (Scott et al., 2013). However, it is worth noting that the DL E. miletus decreased its RMR while increased its intake of high-fiber food, whereas the XGLL E. miletus adopted higher food intake and RMR. It is assumed that the DL E. miletus was not able to digest the high-fiber food fast enough to obtain energy, and instead, it adopted a lower metabolism to maintain its energy balance.
The results of this experiment showed that the composition of intestinal microorganisms in the XGLL group was more than that in the DL group. After the high-fiber diet, the difference between the two regions was reduced, and there was structural difference in intestinal microorganisms in the refeeding groups. It showed that the food diversity of the XGLL was higher than that of Dali, and the high-fiber food increased the diversity of intestinal microorganisms, indicating that food resources were poorer and the food contains higher levels of indigestible cellulose in the winter of XGLL, and that gut microorganisms assist the XGLL E. miletus in facing the stress of winter food resources by altering their structure and diversity (Varel and Dehority, 1989). The intestinal microorganisms in DL and XGLL were also different in control groups. In addition to the dominant bacteria for cellulose degradation, more probiotics appeared in DL after the high-fiber diet, while pathogenic bacteria appeared in XGLL. Therefore, for the herbivorous E. miletus, high-fiber food may also enrich pathogenic bacteria in addition to reducing the digestibility and increasing the stress for E. miletus in winter.
In conclusion, the present study for the first time explored the effects of high-fiber food on the intestinal microorganisms of E. miletus at different altitudes. It was found that high-fiber food affected the diversity and enrichment of intestinal microorganisms, and there were similarities and differences in the effects of high-fiber food on E. miletus at different altitudes. Under the condition of high-fiber food, the intestinal microorganisms assist E. miletus to obtain energy from indigestible cellulose through the enrichment of fiber degrading bacteria, produced SCFAs, participated in energy metabolism, immune regulation, etc., in different forms, and also affected the colonization of intestinal microorganisms, so as to maintain the stability of the flora. High-fiber food also promoted the enrichment of probiotics in the intestinal microbiota of E. miletus, but pathogenic bacteria also appeared. A diverse and responsive microbial community may be a key strategy for living in extreme climates (Tsuji et al., 2013). Therefore, the plasticity of the composition of the gut microbiota in combination with the large metabolic reservoir of microorganisms of E. miletus provided an important adaptation to a high-altitude environment with low winter temperatures and scarce food resources. Moreover, we found that there had relationships between the physiological processes and the changes of relative intestinal bacteria; however, further follow-up research is still needed on these relationships.
Data availability statement
The datasets presented in this study can be found in online repositories. The names of the repository/repositories and accession number(s) can be found below: EBI—PRJEB61600.
Ethics statement
All animal procedures were within the rules of Animals Care and Use Committee of School of Life Sciences, Yunnan Normal University. This study was approved by the committee (13-0901-011). The study was conducted in accordance with the local legislation and institutional requirements.
Author contributions
WeZ: Investigation, Methodology, and Writing—original draft. TJ: Investigation, Methodology, and Writing—original draft. HZ: Methodology, Resources, and Writing—original draft. WaZ: Software, Writing—original draft, and Writing—review and editing.
Funding
This work was financially supported by the National Natural Science Foundation of China (32160254), the Yunnan Ten Thousand Talents Plan Young and Elite Talents Project (YNWR-QNRC-2019-047), and the Yunnan Provincial Middle-Young Academic and Technical Leader Candidate (2019HB013).
Acknowledgments
We wish to thank Pro. Burkart Engesser at Historisches Museum Basel, Switzerland for correcting the English usage in the draft. We thank you for the three reviewers and the editor of the journal for their valuable comments.
Conflict of interest
The authors declare that the research was conducted in the absence of any commercial or financial relationships that could be construed as a potential conflict of interest.
The reviewer LZ declared a past co-authorship with the authors TJ, HZ, and WaZ to the handling editor.
Publisher’s note
All claims expressed in this article are solely those of the authors and do not necessarily represent those of their affiliated organizations, or those of the publisher, the editors and the reviewers. Any product that may be evaluated in this article, or claim that may be made by its manufacturer, is not guaranteed or endorsed by the publisher.
Footnotes
References
Abbas, W., Howard, J. T., Paz, H. A., Hales, K. E., Wells, J. E., Kuehn, L. A., et al. (2020). Influence of host genetics in shaping the rumen bacterial community in beef cattle. Sci. Rep. 10:15101. doi: 10.1038/s41598-020-72011-9
Alberdi, A., Aizpurua, O., Bohmann, K., Zepeda-Mendoza, M. L., and Gilbert, M. T. P. (2016). Do vertebrate gut metagenomes confer rapid ecological adaptation? Trends Ecol. Evol. 31, 689–699. doi: 10.1016/j.tree.2016.06.008
Bi, Y., Zeng, S., Zhang, R., Diao, Q., and Tu, Y. (2018). Effects of dietary energy levels on rumen bacterial community composition in Holstein heifers under the same forage to concentrate ratio condition. BMC Microbiol. 18:69. doi: 10.1186/s12866-018-1213-9
Bozinovic, F. (1995). Nutritional energetics and digestive responses of an herbivorous rodent (Octodon degus) to different levels of dietary fiber. J. Mammal. 76, 627–637. doi: 10.1016/j.cvex.2009.01.003
Chawla, R., and Patil, G. R. (2010). Soluble dietary fiber. Compr. Rev. Food Sci. Food Safety 9, 178–196.
Consiglieri, E., Xu, Q. Z., Zhao, K. H., Gärtner, W., and Losi, A. (2020). The first molecular characterization of blue- and red-light photoreceptors from Methylobacterium radiotolerans. Phys. Chem. Chem. Phys. 22, 12434–12446. doi: 10.1039/d0cp02014a
Dillon, R. J., Vennard, C. T., Buckling, A., and Charnley, A. K. (2005). Diversity of locust gut bacteria protects against pathogen invasion. Ecol. Lett. 8, 1291–1298.
El Kaoutari, A., Armougom, F., Gordon, J. I., Raoult, D., and Henrissat, B. (2013). The abundance and variety of carbohydrate-active enzymes in the human gut microbiota. Nat. Rev. Microbiol. 11, 497–504. doi: 10.1038/nrmicro3050
Ezenwa, V. O., Gerardo, N. M., Inouye, D. W., Medina, M., and Xavier, J. B. (2012). Animal behavior and the microbiome. Science 338, 198–199. doi: 10.1126/science.1227412
Flint, H. J., Bayer, E. A., Rincon, M. T., Lamed, R., and White, B. A. (2008). Polysaccharide utilization by gut bacteria: Potential for new insights from genomic analysis. Nat. Rev. Microbiol. 6, 121–131. doi: 10.1038/nrmicro1817
Geirnaert, A., Debruyne, B., Eeckhaut, V., Van Immerseel, F., Booni, N., and Van de Wiele, T. (2012). In vitro evaluation of the upper gastrointestinal passage of a novel butyrate producing isolate to counterbalance dysbiosis in inflammatory bowel disease. Commun. Agric. Appl. Biol. Sci. 77, 45–49.
Gilbert, S. F., Bosch, T. C., and Ledón-Rettig, C. (2015). Eco-Evo-Devo: Developmental symbiosis and developmental plasticity as evolutionary agents. Nat. Rev. Genet. 16, 611–622. doi: 10.1038/nrg3982
Gong, X. N., Jia, T., Zhang, D., and Zhu, W. L. (2022). Faster response to high-fat diet in body mass regulation from lower altitude population in Eothenomys miletus from Hengduan Mountain regions. Pakist. J. Zool. 54, 167–174. doi: 10.17582/journal.pjz/20200211050216
Gong, Z. D., Wu, H. Y., Duan, X. D., Feng, X. G., Zhang, Y. Z., and Liu, Q. (2001). The species diversity and distribution trends of small mammals in Hengduan Mountains, Yunnan. Biodivers. Sci. 9, 73–79. doi: 10.3321/j.issn:1005-0094.2001.01.011
Han, C. Y., Jia, T., Yang, J., Wang, Z. K., and Zhu, W. L. (2021). Body mass regulation by Eothenomys miletus at different areas of the Hengduan Mountains in winter. Chinese J. Wildlife 42, 86–91. doi: 10.19711/j.cnki.issn2310-1490.2021.01.011
Hu, X. L., Liu, G., Li, Y. M., Wei, Y. T., Lin, S. B., Liu, S. Q., et al. (2018). High-throughput analysis reveals seasonal variation of the gut microbiota composition within forest musk deer (Moschus berezovskii). Front. Microbiol. 9:1674. doi: 10.3389/fmicb.2018.01674
Kass, M. L., Soest, P. J., Pond, W. G., Lewis, B. A., and Mcdowell, R. E. (1980). Utilization of dietary fiber from alfalfa by growing swine. I. Apparent digestibility of diet components in specific segments of the gastrointestinal tract. J. Anim. Sci. 50, 175–191.
Khakisahneh, S., Zhang, X. Y., Nouri, Z., and Wang, D. H. (2020). Gut microbiota and host thermoregulation in response to ambient temperature fluctuations. mSystems 5, e514–e520. doi: 10.1128/mSystems.00514-20
Kohl, K. D., and Dearing, M. D. (2016). The wood rat gut microbiota as an experimental system for understanding microbial metabolism of dietary toxins. Front. Microbiol. 7:1165. doi: 10.3389/fmicb.2016.01165
Kohl, K. D., Weiss, R. B., Cox, J., Dale, C., and Dearing, M. D. (2014). Gut microbes of mammalian herbivores facilitate intake of plant toxins. Ecol. Lett. 17, 1238–1246. doi: 10.1111/ele.12329
Ley, R. E., Peterson, D. A., and Gordon, J. I. (2006). Ecological and evolutionary forces shaping microbial diversity in the human intestine. Cell 124, 837–848.
Li, F. C., Li, M. X., Mao, T. T., Wang, H., Chen, J., Lu, Z. T., et al. (2020). Effects of phoxim exposure on gut microbial composition in the silkworm, Bombyx mori. Ecotoxicol. Environ. Safety 189:110011. doi: 10.1016/j.ecoenv.2019.110011
Li, H., Qu, J., Li, T., Li, J., Lin, Q., and Li, X. (2016). Pika population density is associated with the composition and diversity of gut microbiota. Front. Microbiol. 7:758. doi: 10.3389/fmicb.2016.00758
Lim, S. M., Jeong, J. J., Woo, K. H., Han, M. J., and Kim, D. H. (2016). Lactobacillus sakei OK67 ameliorates high-fat diet-induced blood glucose intolerance and obesity in mice by inhibiting gut microbiota lipopolysaccharide production and inducing colon tight junction protein expression. Nutr. Res. 36, 337–348. doi: 10.1016/j.nutres.2015.12.001
Lindsay, E. C., Metcalfe, N. B., and Llewellyn, M. S. (2020). The potential role of the gut microbiota in shaping host energetics and metabolic rate. J. Anim. Ecol. 89, 2415–2426. doi: 10.1111/1365-2656.13327
Liu, J., Lei, Y., Wang, F., Yi, Y., Liu, Y., and Wang, G. (2011). Immunostimulatory activities of specific bacterial secondary metabolite of Anoxybacillus flavithermus strain SX-4 on carp, Cyprinus carpio. J. Appl. Microbiol. 110, 1056–1064. doi: 10.1111/j.1365-2672.2011.04963.x
Liu, X., Mao, B., Gu, J., Wu, J., Cui, S., Wang, G., et al. (2021). Blautia-a new functional genus with potential probiotic properties? Gut Microbes 13, 1–21. doi: 10.1080/19490976.2021.1875796
Liu, X., Stanford, C. B., Yang, J., Yao, H., and Li, Y. (2013). Foods eaten by the Sichuan snub-nosed monkey (Rhinopithecus roxellana) in Shennongjia National Nature Reserve, China, in relation to nutritional chemistry. Am. J. Primatol. 75, 860–871. doi: 10.1002/ajp.22149
Martínez, I., Kim, J., Duffy, P. R., Schlegel, V. L., and Walter, J. (2010). Resistant starches types 2 and 4 have differential effects on the composition of the fecal microbiota in human subjects. PLoS One 5:e15046. doi: 10.1371/journal.pone.0015046
Mattace Raso, G., Simeoli, R., Russo, R., Iacono, A., Santoro, A., Paciello, O., et al. (2013). Effects of sodium butyrate and its synthetic amide derivative on liver inflammation and glucose tolerance in an animal model of steatosis induced by high fat diet. PLoS One 8:e68626. doi: 10.1371/journal.pone.0068626
Moeller, A. H., and Sanders, J. G. (2020). Roles of the gut microbiota in the adaptive evolution of mammalian species. Philos. Trans. R. Soc. London Ser. B Biol. Sci. 375:20190597. doi: 10.1098/rstb.2019.0597
Mollica, M. P., Raso, M. G., Cavaliere, G., Trinchese, G., De Filippo, C., Aceto, S., et al. (2017). Butyrate regulates liver mitochondrial function, efficiency, and dynamics in insulin-resistant obese mice. Diabetes 66, 1405–1418. doi: 10.2337/db16-0924
Morrison, D. J., and Preston, T. (2016). Formation of short chain fatty acids by the gut microbiota and their impact on human metabolism. Gut Microbes 7, 189–200. doi: 10.1080/19490976.2015.1134082
Mu, Y., Ma, Z. Q., Zhu, W. L., Zhang, D., and Wang, Z. K. (2015). Study of body mass, thermogenesis and relative fatness in Eothenomy miletus from yunnan Province. J. Yunnan Normal Univ. 35, 58–63. doi: 10.1080/11250003.2014.902511
Nagy, T. R., and Negus, N. C. (1993). Energy acquisition and allocation in male collared lemmings (Dicrostonyx groenlandicus): Effects of photoperiod, temperature, and diet quality. J. Mammal. 74:990. doi: 10.2307/1382438
Ni, J., and Tokuda, G. (2013). Lignocellulose-degrading enzymes from termites and their symbiotic microbiota. Biotechnol. Adv. 31, 838–850. doi: 10.1016/j.biotechadv.2013.04.005
Nishihara, K., van Niekerk, J., Innes, D., He, Z., Cánovas, A., and Guan, L. L. (2023). Transcriptome profiling revealed that key rumen epithelium functions change in relation to short-chain fatty acids and rumen epithelium-attached microbiota during the weaning transition. Genomics 115:110664. doi: 10.1016/j.ygeno.2023.110664
Ormerod, K. L., Wood, D. L., Lachner, N., Gellatly, S. L., Daly, J. N., Parsons, J. D., et al. (2016). Genomic characterization of the uncultured Bacteroidales family S24-7 inhabiting the guts of homeothermic animals. Microbiome 4:36. doi: 10.1186/s40168-016-0181-2
Parker, B. J., Wearsch, P. A., Veloo, A. C. M., and Rodriguez-Palacios, A. (2020). The genus Alistipes: Gut bacteria with emerging implications to inflammation, cancer, and mental health. Front. Immunol. 11:906. doi: 10.3389/fimmu.2020.00906
Pfannenberg, C., Werner, M. K., Ripkens, S., Stef, I., Deckert, A., Schmadl, M., et al. (2010). Impact of age on the relationships of brown adipose tissue with sex and adiposity in humans. Diabetes 59, 1789–1793. doi: 10.2337/db10-0004
Pu, G., Hou, L. M., Du, T. R., Zhou, W. D., Liu, C. X., Niu, P. P., et al. (2023). Increased proportion of fiber-degrading microbes and enhanced cecum development jointly promote host to digest appropriate high-fiber diets. mSystems 8:e0093722. doi: 10.1128/msystems.00937-22
Pu, G., Li, P. H., Du, T. R., Niu, Q., Fan, L. J., Wang, H., et al. (2020). Adding appropriate fiber in diet increases diversity and metabolic capacity of distal gut microbiota without altering fiber digestibility and growth rate of finishing pig. Front. Microbiol. 11:533. doi: 10.3389/fmicb.2020.00533
Qiu, X. J., Qin, X. L., Chen, L. M., Chen, Z. M., Hao, R. K., Zhang, S. Y., et al. (2022). Serum biochemical parameters, rumen fermentation, and rumen bacterial communities are partly driven by the breed and sex of cattle when fed high-grain Diet. Microorganisms 10:323. doi: 10.3390/microorganisms10020323
Roediger, W. E. (1982). Utilization of nutrients by isolated epithelial cells of the rat colon. Gastroenterology 83, 424–429.
Russell, W., and Duthie, G. (2011). Plant secondary metabolites and gut health: The case for phenolic acids. Proc. Nutr. Soc. 70, 389–396. doi: 10.1017/S0029665111000152
Salyers, A. A., West, S. E., Vercellotti, J. R., and Wilkins, T. D. (1977). Fermentation of mucins and plant polysaccharides by anaerobic bacteria from the human colon. Appl. Environ. Microbiol. 34, 529–533. doi: 10.1128/aem.34.5.529-533.1977
Scott, K. P., Gratz, S. W., Sheridan, P. O., Flint, H. J., and Duncan, S. H. (2013). The influence of diet on the gut microbiota. Pharmacol. Res. 69, 52–60. doi: 10.1016/j.phrs.2012.10.020
Sender, R., Fuchs, S., and Milo, R. (2016). Revised estimates for the number of human and bacteria cells in the body. PLoS Biol. 14:e1002533. doi: 10.1371/journal.pbio.1002533
Serena, C., Ceperuelo-Mallafré, V., Keiran, N., Queipo-Ortuño, M. I., Bernal, R., Gomez-Huelgas, R., et al. (2018). Elevated circulating levels of succinate in human obesity are linked to specific gut microbiota. ISME J. 12, 1642–1657. doi: 10.1038/s41396-018-0068-2
Steelman, S. M., Chowdhary, B. P., Dowd, S., Suchodolski, J., and Janeèka, J. E. (2012). Pyrosequencing of 16S rRNA genes in fecal samples reveals high diversity of hindgut microflora in horses and potential links to chronic laminitis. BMC Vet. Res. 8:231. doi: 10.1186/1746-6148-8-231
Tsuji, Y., Hanya, G., and Grueter, C. C. (2013). Feeding strategies of primates in temperate and alpine forests: Comparison of Asian macaques and colobines. Primates 54, 201–215. doi: 10.1007/s10329-013-0359-1
Van Dyke, M. I., and McCarthy, A. J. (2002). Molecular biological detection and characterization of Clostridium populations in municipal landfill sites. Appl. Environ. Microbiol. 68, 2049–2053. doi: 10.1128/AEM.68.4.2049-2053.2002
Varel, V. H., and Dehority, B. A. (1989). Ruminal cellulolytic bacteria and protozoa from bison, cattle-bison hybrids, and cattle fed three alfalfa-corn diets. Appl. Environ. Microbiol. 55, 148–153. doi: 10.1128/aem.55.1.148-153.1989
Veloso, C., and Bozinovic, F. (1993). Dietary and digestive constraints on basal energy metabolism in a small herbivorous rodent. Ecology 74, 2003–2010. doi: 10.2307/1940843
Wang, Q., Zhang, T. B., Yi, G. H., Chen, T. Y., Bie, X. J., and He, Y. X. (2017). Tempo-spatial variations and driving factors analysis of net primary productivity in the Hengduan mountain area from 2004 to 2014. Acta Ecol. Sin. 37, 3084–3095.
Xiao, L., Feng, Q., Liang, S. S., Sonne, S. B., Xia, Z. K., Qiu, X. M., et al. (2015). A catalog of the mouse gut metagenome. Nat. Biotechnol. 33, 1103–1108. doi: 10.1038/nbt.3353
Yan, B. W., and Zhu, W. L. (2023). Research on feeding habits and stomach fungi in Eothenomys miletus from Hengduan mountain regions. Life Res. 6:11. doi: 10.17520/biods.2001011
Yan, B. W., Jia, T., Wang, Z. K., and Zhu, W. L. (2022). Comparative research of intestinal microbiota diversity and body mass regulation in Eothenomys miletus from different areas of Hengduan mountain regions. Front. Microbiol. 13:1026841. doi: 10.3389/fmicb.2022.1026841
Zhang, Z. G., Xu, D. M., Wang, L., Hao, J. J., Wang, J. F., Zhou, X., et al. (2016). Convergent evolution of rumen microbiomes in high-altitude mammals. Curr. Biol. 26, 1873–1879. doi: 10.1016/j.cub.2016.05.012
Zhao, Z. J., and Wang, D. H. (2007). Effects of diet quality on energy budgets and thermogenesis in Brandt’s voles. Comp. Biochem. Physiol. 148A, 168–177.
Zhu, W. L., Cai, J. H., Lian, X., and Wang, Z. K. (2011). Effects of photoperiod on energy intake, thermogenesis and body mass in Eothenomys miletus in Hengduan Mountain region. J. Thermal Biol. 36, 380–385. doi: 10.1016/j.jtherbio.2011.06.014
Zhu, W. L., Jia, T., Lian, X., and Wang, Z. K. (2010). Effects of cold acclimation on body mass, serum leptin level, energy metabolism and thermognesis in Eothenomys miletus in Hengduan Mountains region. J. Thermal Biol. 35, 41–46. doi: 10.1016/j.jtherbio.2009.10.006
Keywords: Eothenomys miletus, intestinal microbiota, high-fiber foods, body mass regulation, adaptation
Citation: Zhang W, Jia T, Zhang H and Zhu W (2023) Effects of high-fiber food on gut microbiology and energy metabolism in Eothenomys miletus at different altitudes. Front. Microbiol. 14:1264109. doi: 10.3389/fmicb.2023.1264109
Received: 21 July 2023; Accepted: 21 August 2023;
Published: 31 August 2023.
Edited by:
Wei Zhu, Chinese Academy of Sciences (CAS), ChinaReviewed by:
Huan Li, Lanzhou University, ChinaLin Zhang, Hubei University of Chinese Medicine, China
Deli Xu, Qufu Normal University, China
Copyright © 2023 Zhang, Jia, Zhang and Zhu. This is an open-access article distributed under the terms of the Creative Commons Attribution License (CC BY). The use, distribution or reproduction in other forums is permitted, provided the original author(s) and the copyright owner(s) are credited and that the original publication in this journal is cited, in accordance with accepted academic practice. No use, distribution or reproduction is permitted which does not comply with these terms.
*Correspondence: Wanlong Zhu, endsXzgzMDdAMTYzLmNvbQ==
†These authors have contributed equally to this work and share first authorship
 Wei Zhang
 Ting Jia
 Hao Zhang
 Wanlong Zhu
