 Ainiwaer Ailizire
 Xiaojing Wang2†
 Yan Ma
 Xin Yan
 Shiqi Li
 Wenqi Du
94% of researchers rate our articles as excellent or good
Learn more about the work of our research integrity team to safeguard the quality of each article we publish.
Find out more
ORIGINAL RESEARCH article
Front. Microbiol. , 28 September 2023
Sec. Microorganisms in Vertebrate Digestive Systems
Volume 14 - 2023 | https://doi.org/10.3389/fmicb.2023.1244519
Objective: To investigate the relationship between gut microbiota and the fecal metabolites of hypoxic environments in mice.
Methods: High-fat diet-induced obese mice (n = 20) and normal diet-fed mice (n = 20) were randomly divided into four groups: high altitude obese group (HOB), high altitude normal weight group (HN), low altitude obese group LOB (LOB), and low altitude normal weight group (LN). Fecal samples from each group were 16S rRNA gene sequenced, and five samples from each of the four groups above were selected for non-targeted fecal metabolomics analysis using liquid chromatography-mass spectrometry. The relationship between gut microbiota and fecal metabolites was analyzed using SIMCA 14.1, MetaboAnalyst 5.0 and R 4.1.11.
Results: (A) Body weight was significantly lower in the hypoxic obesity group than in the normoxic obesity group. (B) Differences in α-diversity and β-diversity were found in the fecal gut microbiota of mice of different body weights and altitude, and the diversity of gut microbiota was higher in the normal group than in the obese group; the results of the comparison between the two groups showed that Faecalibaculum, Romboutsia, Lactobacillus, and A2 were associated with obesity; Romboutsia was associated with hypoxia. (C) The metabolic profiles of fecal metabolites differed between groups: gut microbiota were associated with nucleotide and amino acid metabolism in the same body groups, while gut microbiota were associated with lipid and amino acid metabolism in the same oxygen concentration groups.
Conclusion: (a) Gut microbiota diversity was reduced in obese groups. Romboutsia was the dominant microbiota in the hypoxia group. (b) Gut microbiota were associated with nucleotide and amino acid metabolism in the same body weight groups, while they were associated with lipid and amino acid metabolism in the same altitude groups.
Recently, obesity has become a major public health issue of worldwide concern (Nam et al., 2015). Obesity is associated with several metabolic diseases, such as type 2 diabetes, cardiovascular diseases, metabolic syndrome, and nonalcoholic fatty liver disease, which threaten both physical and mental health (Xie et al., 2010; Ding et al., 2015; Pérez-Pérez et al., 2017). The etiology and mechanisms of obesity are extremely complex, involving interactions between genetic and environmental factors. Among the nongenetic factors associated with obesity, intestinal flora composition has been recognized as a regulator of obesity, and a correlation between changes in the intestinal flora composition and body weight has been observed in a number of studies conducted in animal models of obesity (Ley et al., 2006; Jumpertz et al., 2011).
The dynamic balance of the gut microbiota is one of the most important indicators for maintaining human health, and it has been proposed that the composition and metabolic functions of the gut microbiota may influence the development of obesity (Torres-Fuentes et al., 2017; Abenavoli et al., 2019; Aron-Wisnewsky et al., 2020). The gut microbiota has been recognized as an important factor in the development of metabolic diseases such as obesity, and is considered an endocrine organ involved in the maintenance of energy homeostasis and host immunity (Gomes et al., 2018). The hypoxic environment is associated with changes in the host gut microbiota and the production of many metabolites that affect normal physiological levels in the host (Pral Laís et al., 2021). A study of gut microbial changes in mice exposed to different concentrations of oxygen found that the diversity of the gut flora was altered in mice exposed to hypoxia and that the metabolism of the mice was altered (Zhang et al., 2018). Zhang et al. (2018) used mice as an animal model to analyze the fecal microbiota of mice fed for 30 days at different altitudes with different oxygen levels, and studied the influence of high altitude and low oxygen environments on the gut microbiota, the composition and flora of the gut microbiota of mice fed at different altitudes β Significant differences in diversity occurred. In a study of dynamic changes in the gut microbiota of rats exposed to hypoxia (50 KPa, 380 mmHg), metagenomic sequencing was performed on faces from SD rats entering the hypoxic chamber (8 time points) and exiting the hypoxic chamber (6 time points) at 14 time points. The results showed α- diversity changes within the first 5 days of entering or leaving the hypoxic chamber, while β-diversity analysis showed that the structure of the gut microbiota was clearly separated at 14 time points. After entering the hyperbaric oxygen chamber, the relative abundance of bacteria decreased. The most abundant gut microbiota at the genus level was Prevotella (Han et al., 2022). Therefore, we believe that there is a strong correlation between individual location and differences in gut microbiota.
Metabolomics, as an emerging research tool and method in the post genomic era, is one of the most used phenotypic research methods and has become an indispensable research tool in science (Nicholson et al., 1999; Schoeman et al., 2016). It reflects changes at the most terminal level of various biochemical processes in the human body, such as various vital activities and disturbances of metabolic homeostasis caused by disease and drug stimulation, and is also influenced by factors such as the living environment and lifestyle, such as differences in dietary habits, air quality, and frequency and intensity of physical activity (Wishart et al., 2007, 2018). Fecal metabolites may reflect the status of the gut microbiota and the relationship between the symbiotic flora and the host. The combination of fecal metabolomics and 16S rRNA gene sequencing can help explain the close relationship between the gut microbiota and the host (Zhou et al., 2020). Researchers found a comprehensive landscape of gut microbiota and metabolite profiles in patients with SCI, providing evidence that their interaction plays a role in the pathogenesis of SCI, and findings suggest that uridine, hypoxanthine, PC(18:2/0:0) and kojic acid may be important therapeutic targets for the treatment of this condition (Kong et al., 2023). In a study of the effects of semaglutide on skeletal muscle and its metabolomics, it was found to significantly reduce body weight and intramuscular fat accumulation in obese mice, possibly by altering the metabolism of muscle lipids and organic acids (Ren et al., 2022). In this study, Akkermansia abundance was found to be positively correlated with levels of secondary bile acids, and secondary bile acids restore and rebuild a healthy microbiome as a means to intervene in aging (Bárcena et al., 2019). Untargeted metabolomics and 16S rRNA gene sequencing revealed that Lachnoclostridium, Fusobacterium, Coprococcus_2, and Tyzzerela are correlated with arachidonic acid, taurocholic acid, and DHEA sulfate, which can be used as characteristic metabolites for obese patients (Zhou et al., 2020). Metabolic association analysis of gut microbiota could be used to find therapeutic targets for various diseases.
So, in this study, we used a high-fat diet to construct an obese mouse model through hypoxia intervention, combined with 16S rRNA gene sequencing technology and a non-targeted targeted metabolomics approach to reveal the effect of hypoxia on flora and metabolic changes, and further reveal its mechanism on the occurrence of obesity.
Animal care and experimental treatments were approved by the Medical Science Research Ethics Committee of Qinghai University (No. 2021-06, approved 21 June 2021).
A total of 64 male C57BL/6 mice, aged 5 weeks and weighing 16–17 g, were purchased from Hunan Slake Jingda Experimental Animal Co., Ltd. Mice were raised in an environment with a temperature of 18–23°C, and provided with sufficient food and water. After 1 week of adaptive feeding, the animals were randomly divided into a normal control group (NC, n = 24) and high-fat diet group (HFD, n = 40). HFD groups were fed a high-fat diet, while the NC group were fed with a normal diet. The feed source came from D12492, Beijing Keao Xieli Feed Co., Ltd. The feed inclued Casein, L-cystine, Corn Starch, Maltodextrin 10, Sucrose, Celluse, Soybean Oil, Lard, Mineral Mix S10026*, Dicalcium phosphate, Calcium Carbonate, Potassium Citrate (1 H2O), Vitamin Mix, V10001, Choline Bitartrate, and FD&C Blue Dye # 1. The NC group was fed a standard diet (3.18 kcal/g, 4.0 g% fat, 67.3% carbohydrate, 19.1% protein). The HFD was fed a high-fat diet (5.24 kcal/g, 34.9% fat, 26.3% carbohydrate, 26.2% protein). After 8 weeks (13 weeks of age), the mice were fasted for 12 h and weighed, and the weight of the HFD group exceeded the average weight of the NC group by 10% as the criterion for judging the successful modeling of obese mice. After successful modeling, 20 male C57BL/6J obese mice and 20 normal feed mice were randomly divided into four groups: high altitude obese group (HOB), high altitude normal weight group (HN), low altitude obese group LOB (LOB), and low altitude normal weight group (LN). HOB and LOB groups were placed in a low-pressure oxygen chamber (simulated altitude of 5,000 m, atmospheric pressure of 425 mmHg, oxygen partial pressure of 72.5 mmHg, and oxygen concentration of 13.83%), LOB and LN groups were kept in a laboratory environment (altitude of 2,261 m, mean atmospheric pressure of 574 mmHg, oxygen partial pressure of 120.1 mmHg, and oxygen concentration of 17.5%) for 4 weeks. Body weight and food consumption were measured weekly; fecal gut microbiota and fecal metabolomics analysis were measured after 30 days.
Sterile plastic cassettes were used to collect fresh stool samples (5 g) from each group. The fecal samples were quickly placed in an ice box, transported to the laboratory with 2 h, and then stored at −80 in a refrigerator for further processing and testing.
Total genomic DNA was extracted from the samples using the acetyltrimethylammonium bromide (CTAB) method (Attitalla, 2011). DNA concentration and purity were analyzed using 1% agarose gels. According to the concentration, the DNA samples were diluted to 1 ng/μl using sterile water. An equal volume of 1× loading buffer (containing SYBR green) was mixed with the PCR products, and electrophoresis was performed on a 2% agarose gel to visualize the PCR products. PCR products were mixed in equidensity ratios. Then, the PCR products were purified with a Qiagen Gel Extraction Kit (Qiagen, Germany). The DNA purity and concentration were analyzed by measuring the optical density (OD) at wavelengths of 260 and 280 nm with a NanoPhotometer R spectrophotometer (Implen, Munich, Germany) and then calculating the OD260:OD280 ratio. The DNA concentrations were measured with the Qubit R dsDNA Assay Kit in a Qubit R 2.0 Fluorometer (Life Technologies, Camarillo, CA, United States) (Du et al., 2022).
Based on many previous studies (Nagayama et al., 2020; Yu et al., 2020; Song et al., 2021), we selected the V3–V4 region to study the microbiome through second-generation sequencing. 16S rRNA gene sequencing was performed by Novogene Bioinformatics Technology Co., Ltd., China. DNA samples were diluted to a concentration of 1 ng/μl in sterile water and then PCR amplified with the 515F/806R primer set (515F: 5′GTGCCAGCMGCCGCGGTAA-3′, 806R: 5′-XXXXXXGG ACTACHVGGGTATCTAAT-3′). Sequencing libraries were generated using the TruSeq R DNA PCR-Free Sample Preparation Kit (Illumina, USA) following the manufacturer's recommendations, and index codes were added. Library quality was assessed with a Qubit@ 2.0 Fluorometer (Thermo Scientific) and Agilent Bioanalyzer 2100 system. Finally, the library was sequenced on the Illumina NovaSeq platform, and 250-bp paired-end reads were generated.
Paired-end reads were assigned to samples based on their unique barcodes and were truncated by removing the barcode and primer sequences. Paired-end reads were merged using FLASH (V1.2.7) (Magoč and Salzberg, 2011), which is a very fast and accurate analysis tool that was designed to merge paired-end reads when at least some of the reads overlapped with the read generated at the opposite end of the same DNA fragment. The splicing sequences are called raw tags. Quality filtering of raw tags was performed under specific filtering conditions to obtain high-quality cleantags (Bokulich et al., 2013) according to the QIIME (V1.9.1) (Caporaso et al., 2010) quality control process. The tags were compared with those in the reference database (Silva138 database) using the UCHIME (Attitalla, 2011) algorithm to detect chimeric sequences, and the chimeric sequences were removed (Haas et al., 2011). Then, effective tags were finally obtained.
The Kruskal–Wallis test was used to investigate significant differences in operational taxonomic units (OTUs) and the abundance-based coverage estimator (ACE), Chao 1, Simpson's, and Shannon's indexes among the four groups. To correct for type I errors, we applied the Bonferroni method for multiple comparisons between two groups. Differences in microbial community abundances between the obesity group and the control group were analyzed using the Wilcoxon rank sum test, and the significance of these differences was assessed using the false discovery rate (FDR). Principal coordinate analysis (PCoA) was performed using the WGCNA package, stat packages, and ggplot2 package in R software (v 2.15.3) to compare the similarity of community structures. Multiresponse permutation procedures (MRPPs) (O'Reilly and Mielke, 1980) were used to analyze differences in the microbial community structure between groups.
The supernatant of the stool sample was taken after grinding and centrifugation. The QC samples were prepared by mixing the supernatants of all samples in equal quantities. UHPLC-MS/MS analyses were performed using a Vanquish UHPLC system (ThermoFisher, Germany) coupled with an Orbitrap Q Exactive TM HF mass spectrometer (Thermo Fisher, Germany). Samples were injected onto a Hypesil Goldcolumn (100 × 2.1 mm, 1.9 μm) using a17 min linear gradient at a flow rate of 0.2 mL/min. The eluents for the positive polarity mode were eluent A (0.1% FA in Water) and eluent B (Methanol). The eluents for the negative polarity mode were eluent A (5 mM ammonium acetate, pH9.0) and eluent B (Methanol). The solvent gradient was set as follows: 2% B, 1.5 min; 2–85% B, 3 min; 85–100% B, 10 min; 100–2% B, 10.1 min; 2% B, 12 min. Q Exactive TM HF mass spectrometer was operated in positive/negative polarity mode with spray voltage of 3.5 kV, capillary temperature of 320°C, sheath gas flow rate of 35 psi and aux gas flow rate of 10 L/min, S-lens RF level of 60, and Aux gas heater temperature of 350°C.
The raw data files generated by UHPLC-MS/MS were processed using the Compound Discoverer 3.1 (CD3.1, ThermoFisher) to perform peak alignment, peak picking, and quantitation for each metabolite, and these metabolites were annotated using the KEGG database, HMDB database, and LIPIDMaps database. Positive and negative data were combined to obtain a combined data set, which was imported into the SIMCA-P+14.0 software. Principal component analysis (PCA) was first used to observe the overall distribution of each sample and the stability of the whole analysis process. Then, OPLS-DA were used to distinguish the overall differences of metabolic profiles between groups and screen differential metabolites between groups. The differentially expressed metabolites should meet the importance of the first principal component variable in the OPLS-DA model at projection VIP > 1 and P < 0.05. Volcano plot (FC > 1.2 or FC < 0.833), P used Benjamin and Hochberg to check (FDR). Metabolic pathway analysis was performed using MetaboAnalyst 5.0 (https://www.metaboanalyst.ca/) software and for mapping. The data were subjected to multivariate (PCA) and orthogonal OPLS-DA and univariate [fold change (FC) and T-tests] analysis. Mean metabolite concentrations in each group were used to calculate FC values, Final identification of differential metabolites by VIP, FC and P.
Quantitative data with normal distribution between the two groups were expressed by mean±standard deviation and analyzed by student t test. The quantitation sequencing data with non-normal distribution were expressed by median ± quartile range (QR) and analyzed by Wilcoxon rank sum test. Association analysis of gut microbiota and metabolites was carried out using spearman correlation. The SPSS 22.0 version was used for statistical analysis. P < 0.05 was considered as statistically significant different.
The results showed that there was no significant difference in body weight between the two groups at baseline (P > 0.05) after 8 weeks of feeding, and the body weight gain value of the high-fat diet group was higher than that of the normal control group in the same feeding environment. When the weight of the two groups was compared at the same time, there was a significant statistical difference in the weight of the two groups at each time point (P < 0.05) (Table 1).
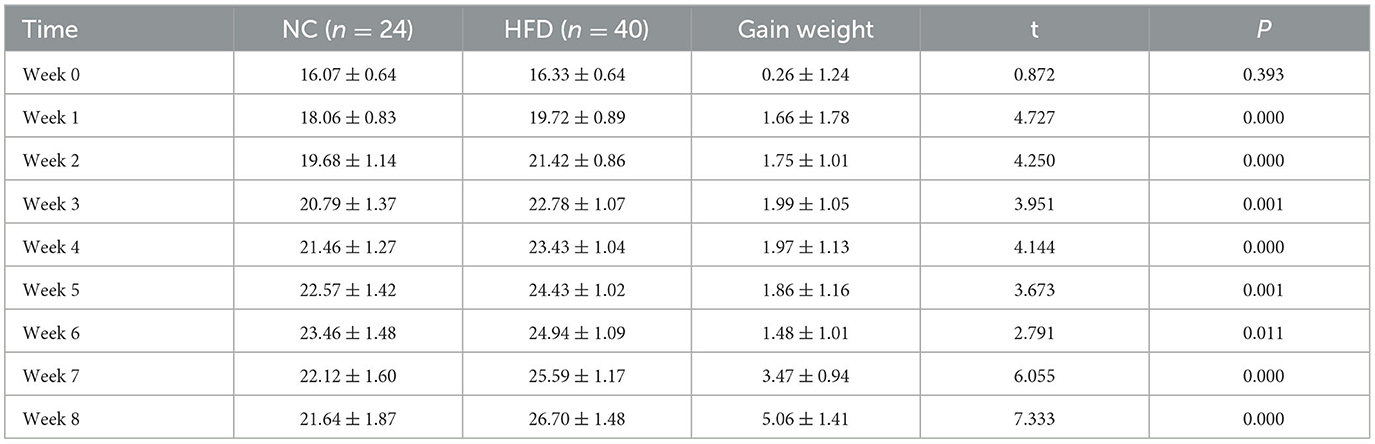
Table 1. Changes in body weight of obese mice (g) ( ± s).
Twenty mice were randomly selected from the two groups with a high-fat diet (LOB and HOB), as were 20 mice from the normal diet groups. the weight change of mice after 4 weeks was shown in Table 2; the results showed that at the same altitude, there were statistical differences in body weight between the two groups between the normoxic group (2,261 m) and the hypoxic group (5,000 m) (P < 0.05). The comparison between the obese groups at different altitudes showed that the weight gain of the HOB was lower than that of the LOB, and the difference between the two groups was statistically significant (P < 0.05).
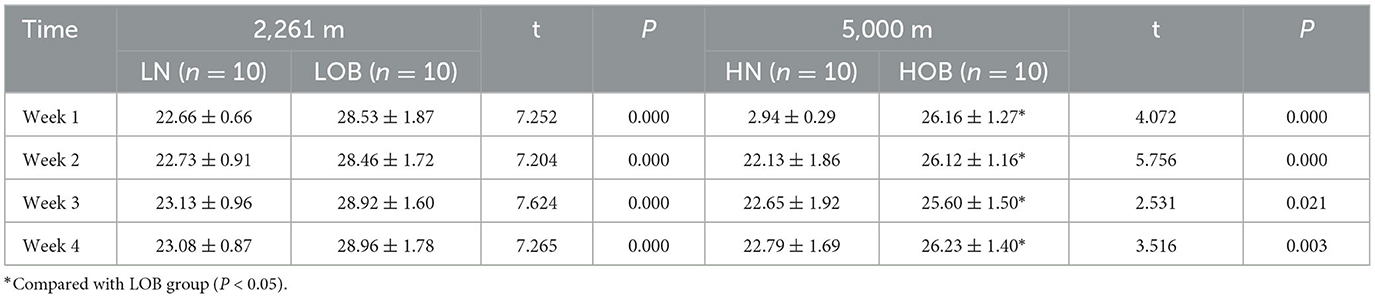
Table 2. Body weight changes of low hypoxia mice in four groups(g) ( ± s).
Mice heights were not different between altitudes and body weights (P > 0.05), and mice weights were statistically different between groups at the same altitude (P < 0.05). The body weight of the normoxic group was higher than that of the hypoxic group (Table 3).
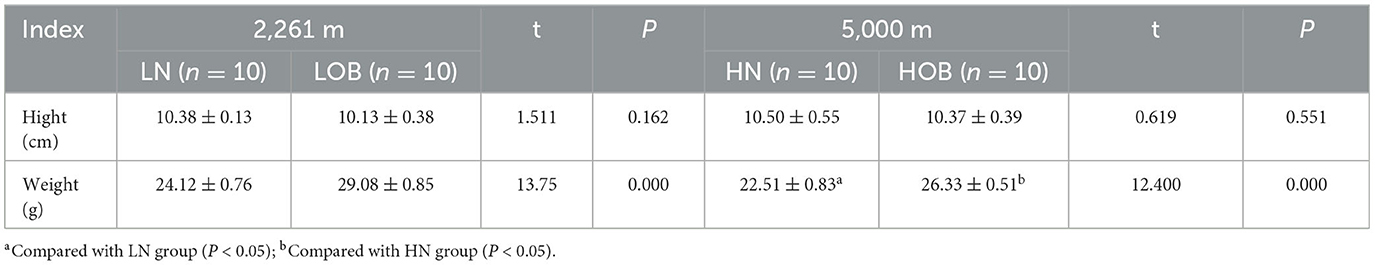
Table 3. Basic characteristics of mice ( ± s).
α-diversity analysis by Shannon, Simpson, Choa1, and ACE index showed that there were differences in α-diversity between the groups (P < 0.05). Further intergroup comparisons showed that in the same oxygen groups, Shannon, Simpson, Chao1, and ACE indices were significantly different in the HOB and HN groups (P < 0.05). Simpson index was significantly different in the LOB and LN groups (P < 0.05), suggesting that gut microbiota diversity was lower in the obese group than in the control group. In the same body weight groups, Chao1 and ACE indices were significantly different in HOB and LOB groups (P < 0.05, Table 4), suggesting that gut microbiota diversity was lower in the hypoxic obese group compared to the control group. All these results suggested that hypoxia and obesity affect the diversity of the gut microbiota. PcoA was used to analyze the β-diversity of fecal samples among the four groups, and the results showed that the gut microbiota composition of normal weight mice was similar; the gut microbiota composition of obese mice was significantly different at different oxygen levels (P < 0.05, Figure 1). Using MRPPs based on Bray-Curtis distance, there was a small difference between samples within each group and a large difference between groups (P < 0.05, Table 5).
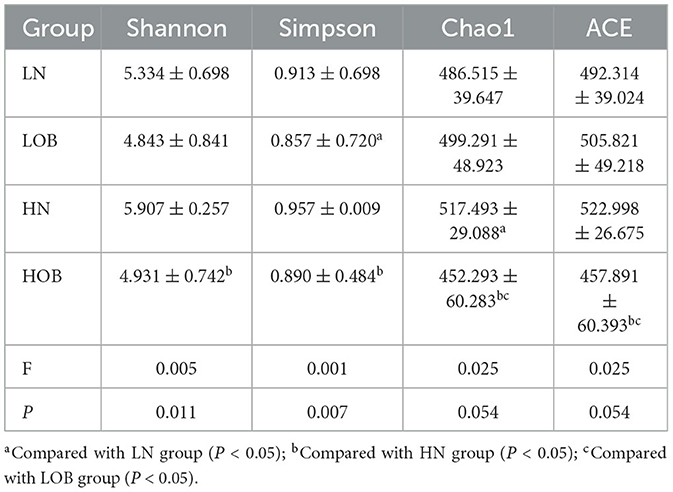
Table 4. Alpha-diversity analysis of faces in mice.
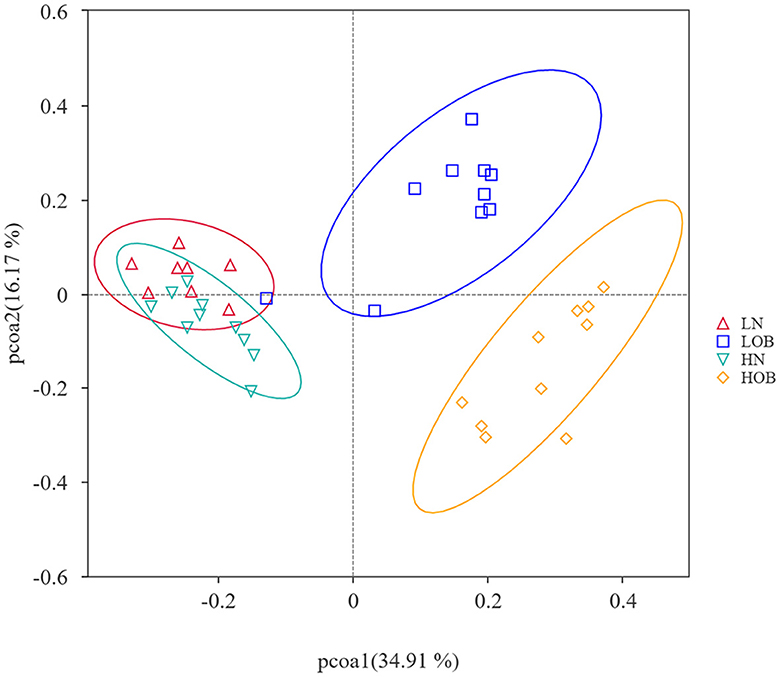
Figure 1. Beta diversity analysis based on UniFrac analysis. Orange dots represents the hyposia obese mice (HOB) group. Green dots represents the hyposia normal weight mice (HN) group. Blue dots represents the normoxic obese mice (LOB) group. Red dots represents the normoxic weight children (LN) group. Circles in orange, green, blue, and red represent different periodontal bacterial community clusters, respectively.
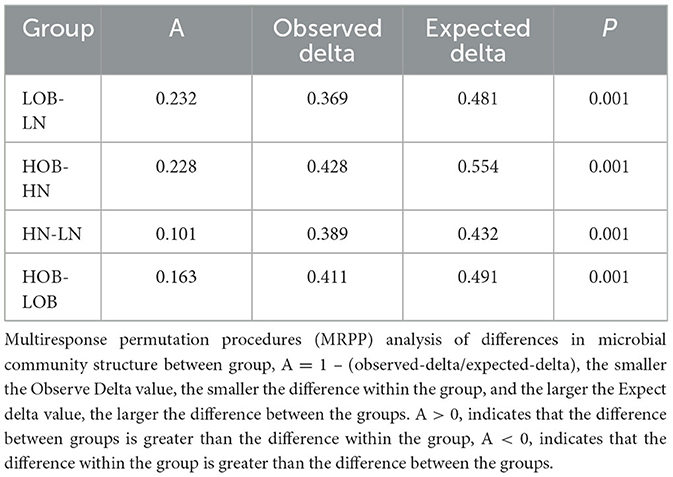
Table 5. MRPP analysis of differences in microbial community structure between groups.
Overall, 25 phylum, 38 classes, 92 orders, 139 families, 230 genera, and 117 species were detected in the bacterial microbiome communities of the four group samples. Composition at the phylum level: In the obese group, Firmicutes, Bacteroidota, and Desulfobacterota dominated, and their proportions were HOB group (67.96%, 15.85%, 12.68%) and LOB group (72.38%, 17.09%, 6.34%). Firmicutes/Bacteroidota in the HOB group was higher than in the LOB group. Normal body groups were dominated by Firmicutes and Bacteroidota, and their proportions were HN (47.61%, 45.14%) and LN (51.52%, 42.70%) (Figure 2A). At the genus level, the LN group was dominated by Muribaculacea (35.02%), Faecalibaculum (6.13%), and Dubosiell (22.90%), while the LOB group was dominated by Muribaculaceae (10.26%), Faecalibaculum (28.17%), and Lactobacillus (16.44%). The HN group was dominated by Muribaculaceae (34.82%) and Dubosiella (9.04%) and the HOB group by Romboutsia (21.01%) and Faecalibaculum (14.07%). Among them, the hypoxic obesity group was significantly dominated by Romboutsia (Figure 2B).
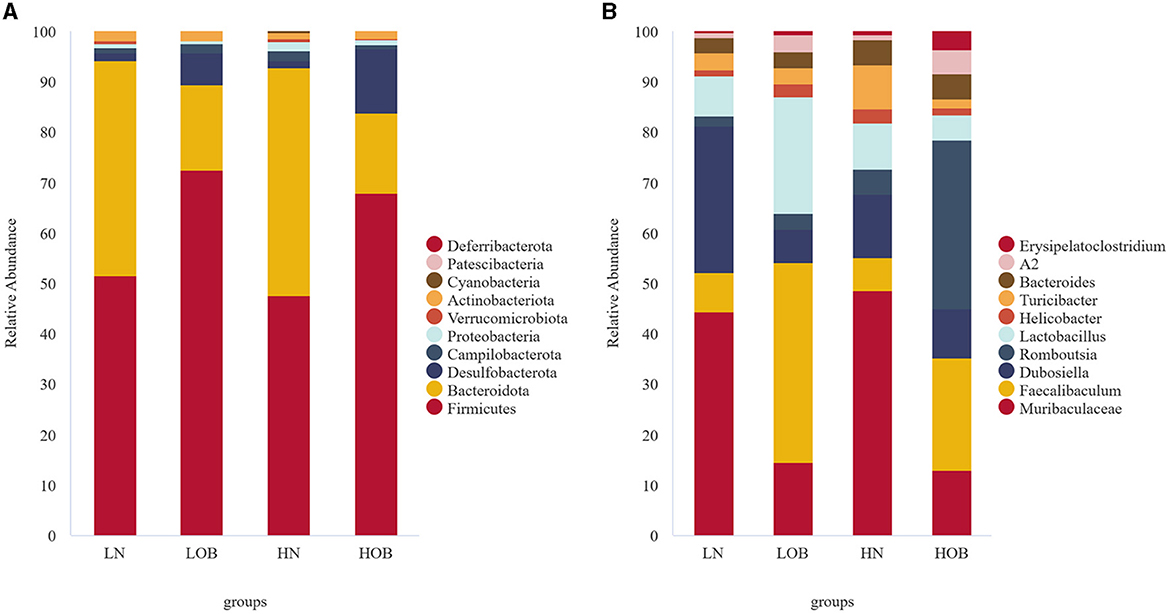
Figure 2. In phylum and genus level gut microbiota composition. (A) The phylum level. (B) The genus level.
The Metastat method was used to analyze the differences in microbiota abundance composition of the top 10 microbiota at the genus level between the groups. For the same body weight groups, the HN vs. LN groups demonstrated that Dubosiella, Romboutsia, and Turicibacter were significantly different (P<0.05), and the abundance of Romboutsia and Turicibacter was higher in the HN group. In the HOB vs. LOB group, Faecalibaculum, Romboutsia, Lactobacillus, Turicibacter, and Erysipelatoclostridium were significantly different (P<0.05), the abundance of Romboutsia was higher in the HOB group, and Romboutsia was significantly dominant in the hypoxia group. At the same oxygen level, in the LOB and LN groups, Muribaculaceae, Faecalibaculum, Dubosiella, Lactobacillus, and A2 showed significant differences (P<0.05), and Faecalibaculum and Lactobacillus had higher abundance in LOB. In the HOB and HN groups, Muribaculaceae, Faecalibaculum, Romboutsia, Lactobacillus, Turicibacter, and A2 showed differences (P<0.05), and Faecalibaculum and Romboutsia were more abundant in HOB (Table 6), suggesting that Faecalibaculum, Lactobacillus, and A2 were predominant in the obese groups, while Romboutsia and Turicibacter were predominant in hypoxia groups.
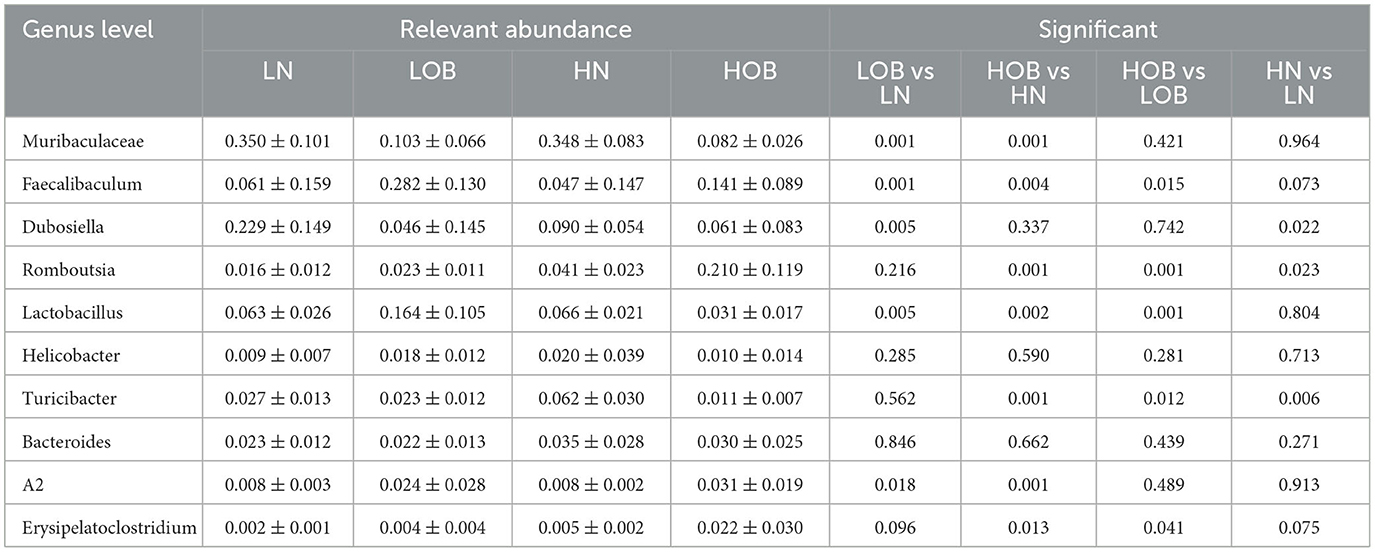
Table 6. Top 10 genus level gut microbiota difference.
The PCA and clustering heatmap illustrate the differences between the sample distributions. The PCA map shows that the metabolites are clustered within groups and separated between groups (Figure 3A), and the clustering heatmap can roughly indicate that metabolites of the same body weight have similar expression patterns (Figure 3B).
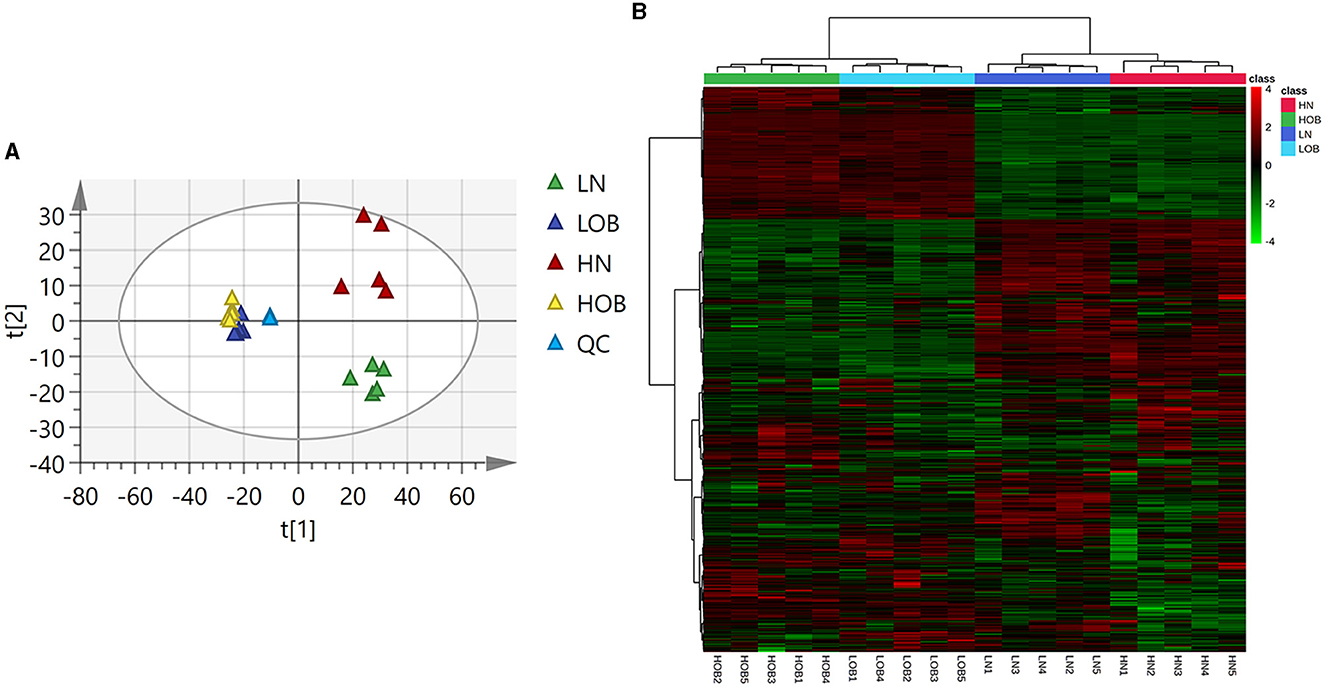
Figure 3. Metabolic profiles of four groups of fecal metabolites (A) PCA map. The distance of each coordinate point represents the degree of aggregation and dispersion between samples. (B) Clustering heatmap. (A) Heatmap provides intuitive visualization of a data table. Each colored cell on the map corresponds to a concentration value in your data table, with samples in rows and features/compounds in columns.
OPLS-DA model validation (Figure 4) revealed significant differences between the distribution of samples, suggesting a significant difference of fecal metabolites between the two groups, The model parameters are shown in Table 7, suggesting that the model was reliable. For the same body weight groups, i n HOB vs. LOB, a total of 736 different metabolites (P < 0.05, VIP > 1) were detected (Figure 5A), while 64 differential metabolites were successfully annotated, the majority of which were dominated by lipid compounds. KEGG pathway enrichment analysis of a total of 64 differential metabolites revealed that 60 differential metabolites were involved in pathway enrichment, involving a total of 26 metabolic pathways, of which seven pathways were significantly enriched (P < 0.05), namely arginine biosynthesis (P = 0.000), alanine, aspartate and glutamate metabolism (P = 0.001), pyrimidine metabolism (P = 0.004), D-Glutamine and D-glutamate metabolism (P = 0.004), purine metabolism (P = 0.005), steroid hormone biosynthesis (P = 0.010), and arginine and proline metabolism (P = 0.030) (Figure 6A). The enriched differential metabolites are shown in Table 8. In HN vs LN, a total of 737 differential metabolites were detected (P < 0.05, VIP > 1) (Figure 5B); 209 differential metabolites were successfully annotated. KEGG enrichment pathway analysis of a total of 209 differential metabolites revealed that 61 differential metabolites were involved in pathway enrichment, involving a total of 26 metabolic pathways, of which seven pathways were significantly enriched (P < 0.05), involving a total of 34 metabolic pathways, of which four pathways were significantly enriched (P < 0.05), namely histinide metabolism (P = 0.000), arginine metabolism (P = 0.002), primine metabolism (P = 0.023), and purine metabolism (P = 0.034) (Figure 6B); the enriched differential metabolites are shown in Table 9.
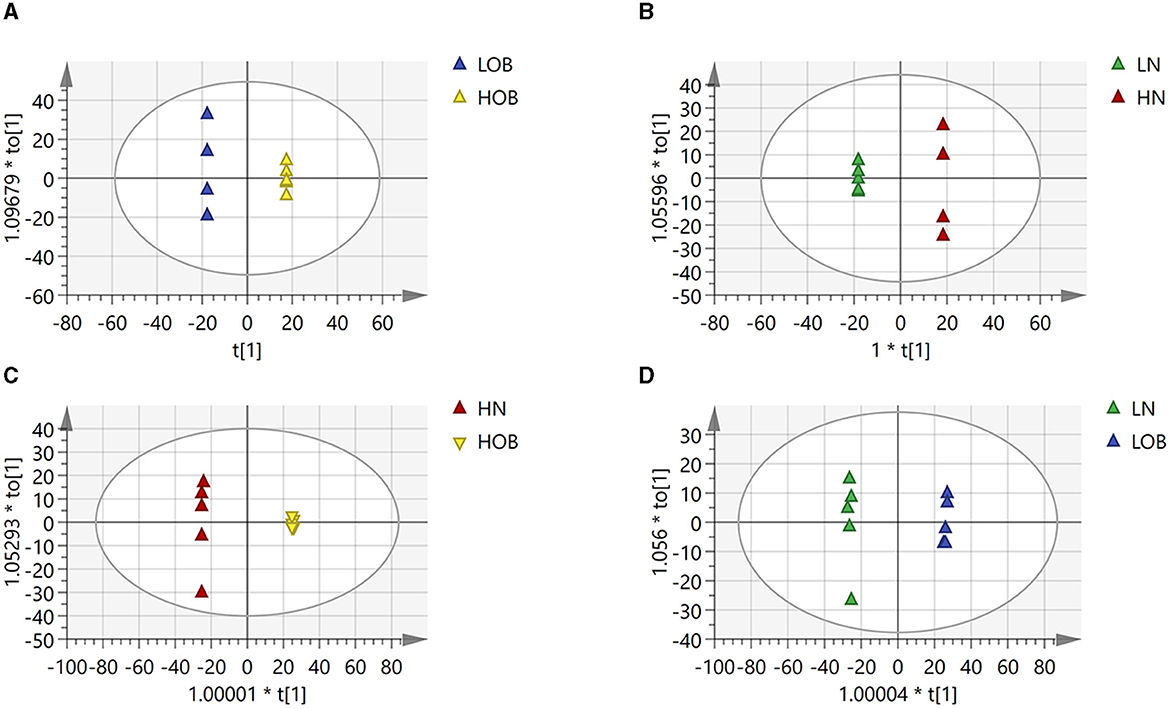
Figure 4. Differences in fecal metabolites between the groups (OPLADA map). (A) HOB vs. LOB group. (B) HN vs. LN group. (C) HOB vs. HN group. (D) LOB vs. LN group. The first prediction of X-axis is mainly the decomposition degree, and the first orthogonality of y-axis is the decomposition degree.
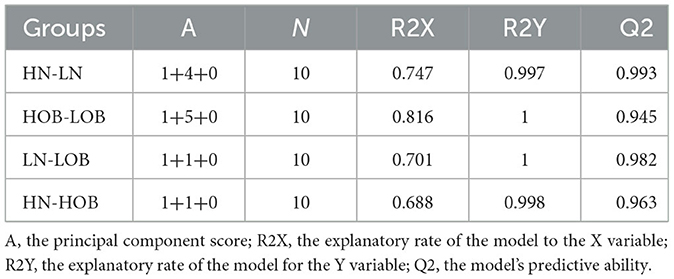
Table 7. OPLS-DA model parameters.
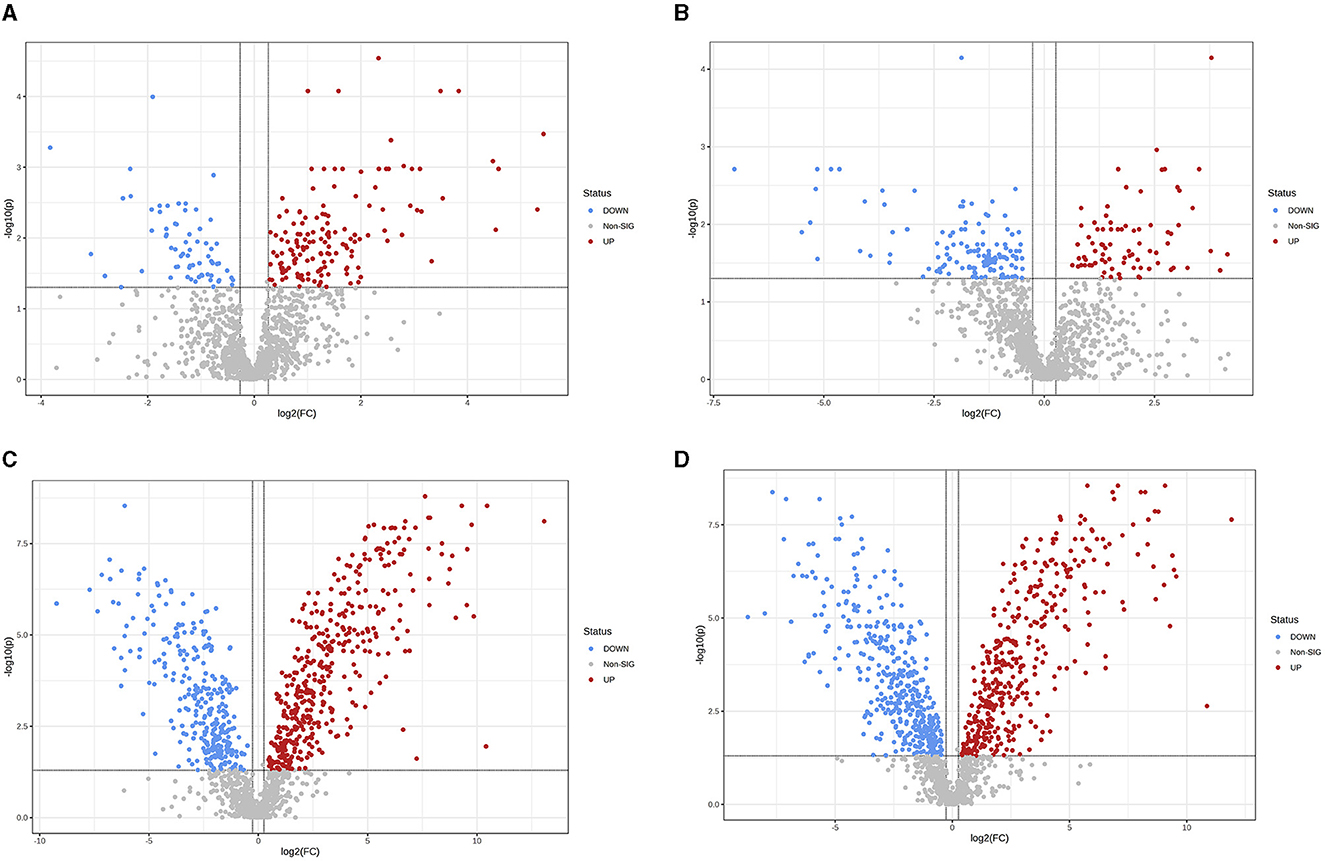
Figure 5. Differences in fecal metabolites between the groups (Volcano plot). (A) HOB vs. LOB. (B) HN vs. LN. (C) HOB vs. HN. (D) LOB vs. LN. Volcano plot combines results from Fold Change (FC) analysis and T-tests into one single graph, which intuitively select significant features based on either biological significance, statistical significance. Red dots indicate up-regulated metabolites, blue dots are vice versa.
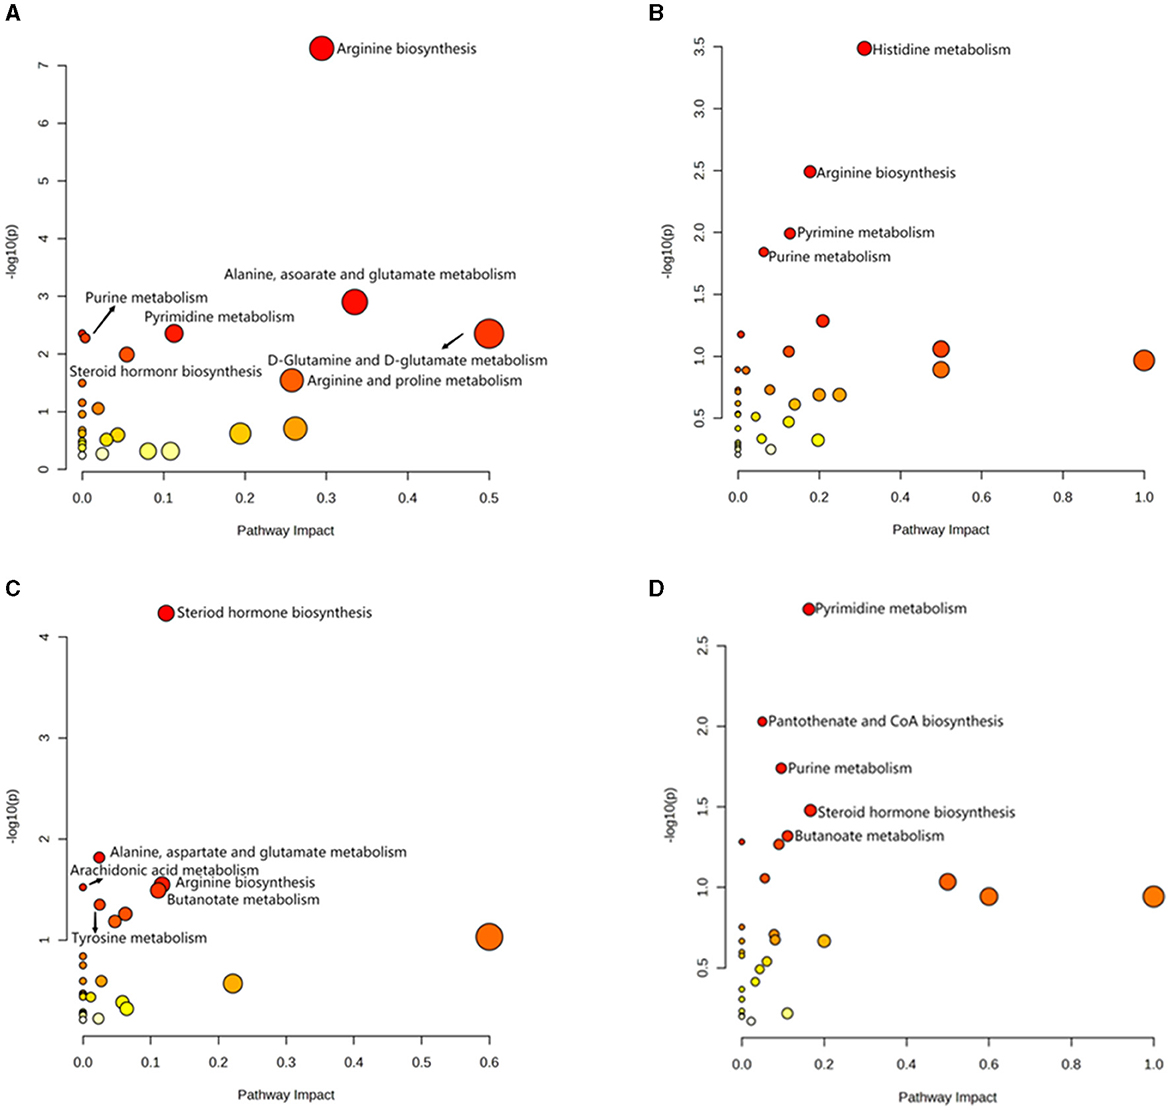
Figure 6. Analysis of KEGG pathway related to differential metabolites. (A) HOB vs. LOB. (B) HN vs. LN. (C) HOB vs. HN. (D) LOB vs. LN.
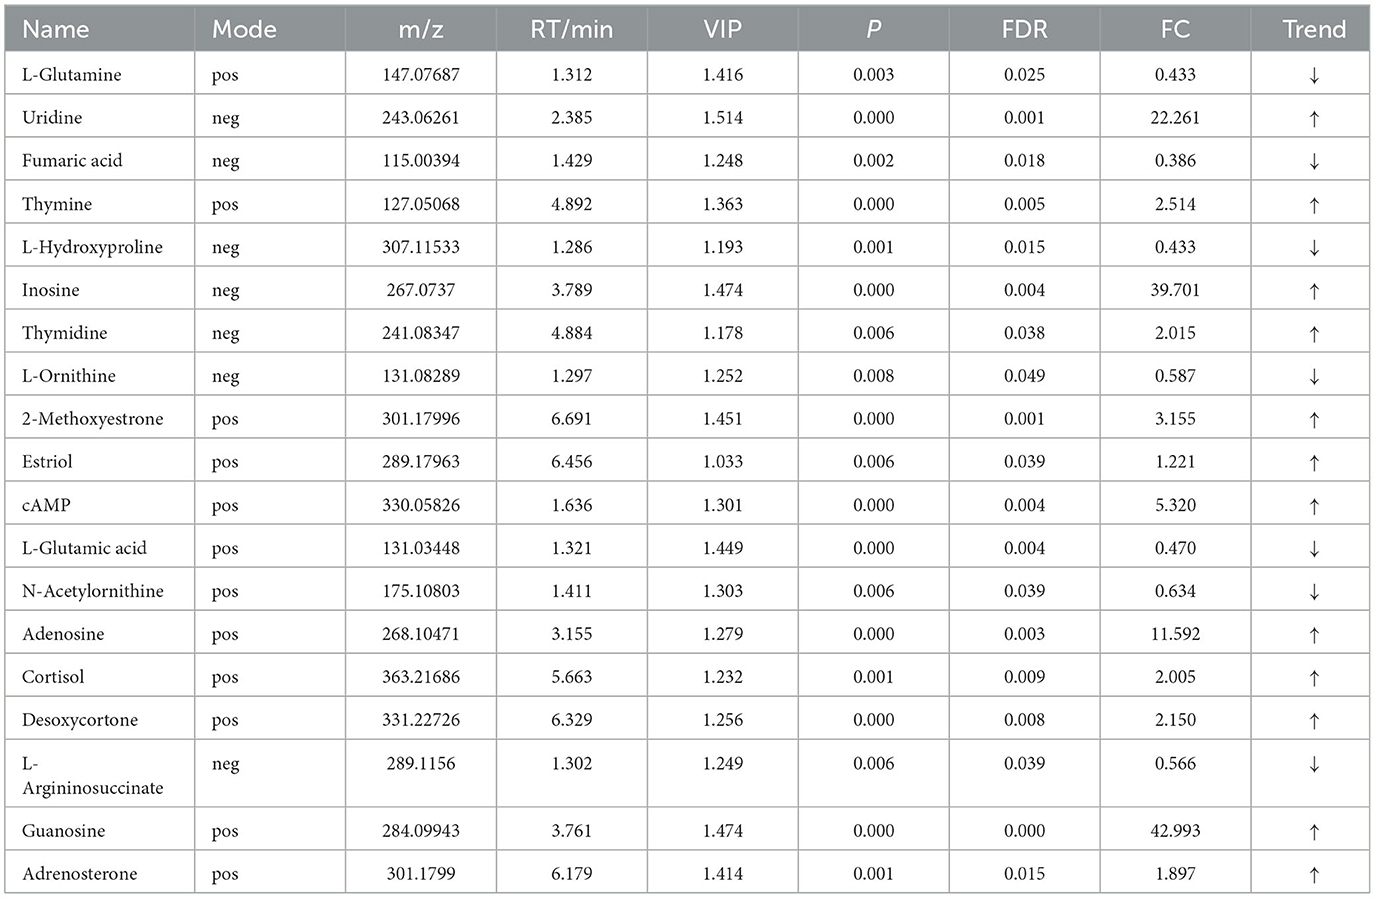
Table 8. Relative abundance of significant differential metabolites involved in KEGG pathway analysis (HOB vs. LOB).
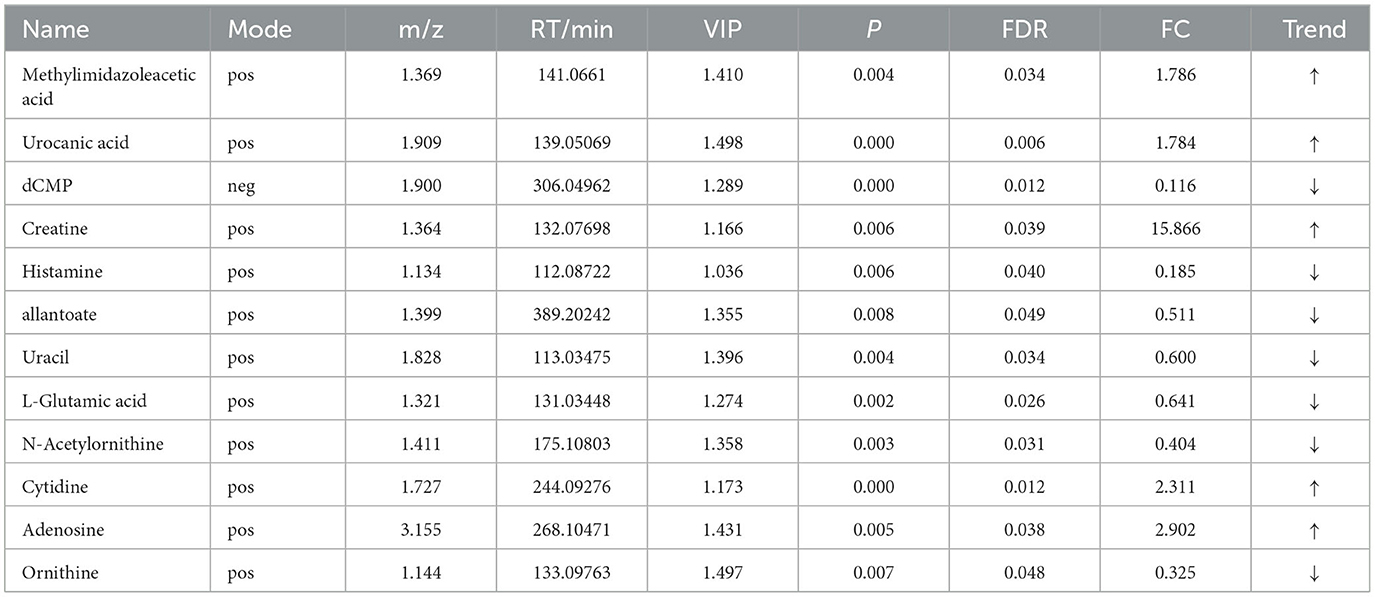
Table 9. Relative abundance of significant differential metabolites involved in KEGG pathway analysis (HN vs. LN).
For the same hypoxia level groups, in HOB vs. HN, a total of 705 differential metabolites (P < 0.05, VIP > 1) were detected (Figure 5C), while 121 differential metabolites were successfully annotated. The KEGG enrichment pathway analysis of a total of 121 differential metabolites revealed that 78 differential metabolites were involved in pathway enrichment, involving a total of 26 metabolic pathways, of which six pathways were significantly enriched (P < 0.05), namely steroid hoemone biosynthesis (P = 0.000), alainine, aspartate and glutamate metabolism (P = 0.015), arginine biosynthesis (P = 0.029), arachidonic acid metabolism (P = 0.030), butanoate metabolism (P = 0.032), and tyrosine metabolism (P = 0.044) (Figure 6C), the enriched differential metabolites are listed in Table 10. In LOB vs. LN, a total of 785 differential metabolites (P < 0.05, VIP > 1) were detected (Figure 5D); 143 differential metabolites were successfully annotated. The KEGG enrichment pathway analysis of a total of 143 differential metabolites revealed that 74 differential metabolites were involved in pathway enrichment, involving a total of 19 metabolic pathways, of which five pathways were significantly enriched (P < 0.05): pyrimidine metabolism (P = 0.002), pantothenate and CoA biosynthesis (P = 0.009), purine metabolism (P = 0.018), steroid hormone biosynthesis (P = 0.033), butanoate metabolism (P = 0.048), and tyrosine metabolism (P = 0.044) (Figure 6D). The enriched differential metabolites are shown in Table 11. These results suggest that hypoxia mainly affects nucleotide and amino acid metabolism, whereas obesity affects lipid and amino acid metabolism.
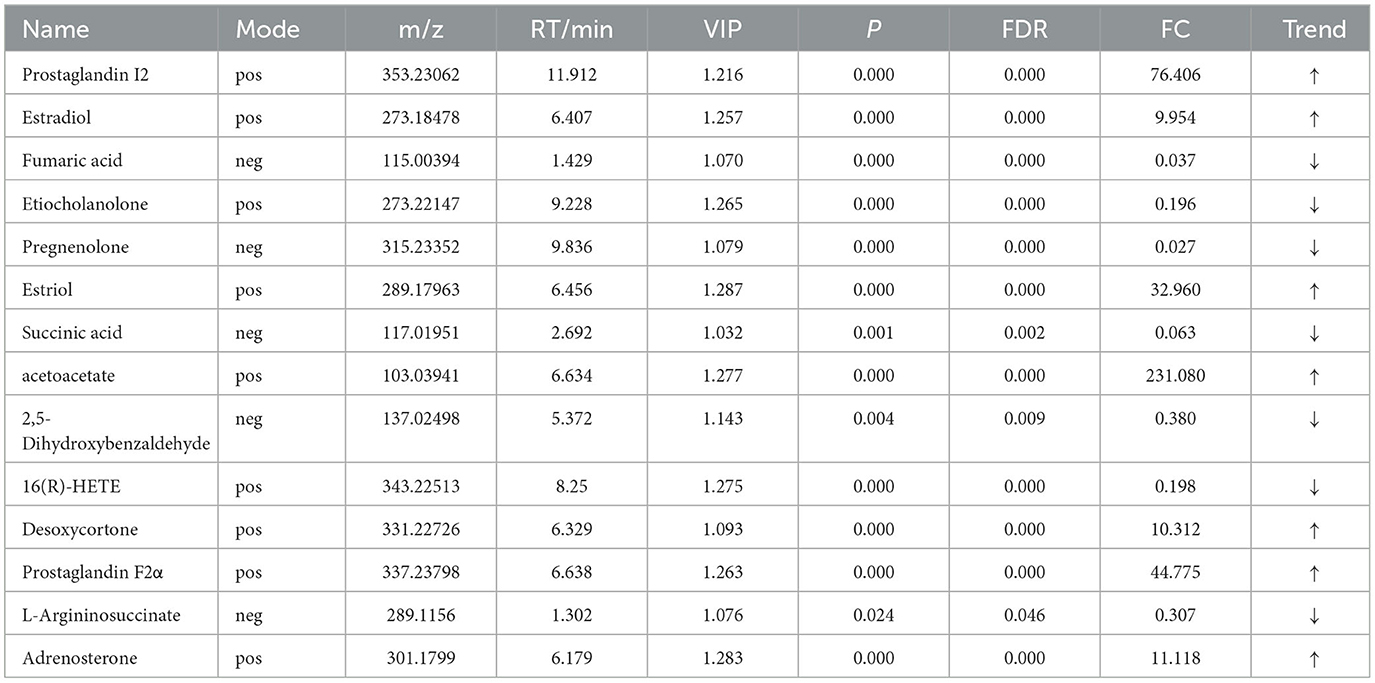
Table 10. Relative abundance of significant differential metabolites involved in KEGG pathway analysis (HOB VS HN).
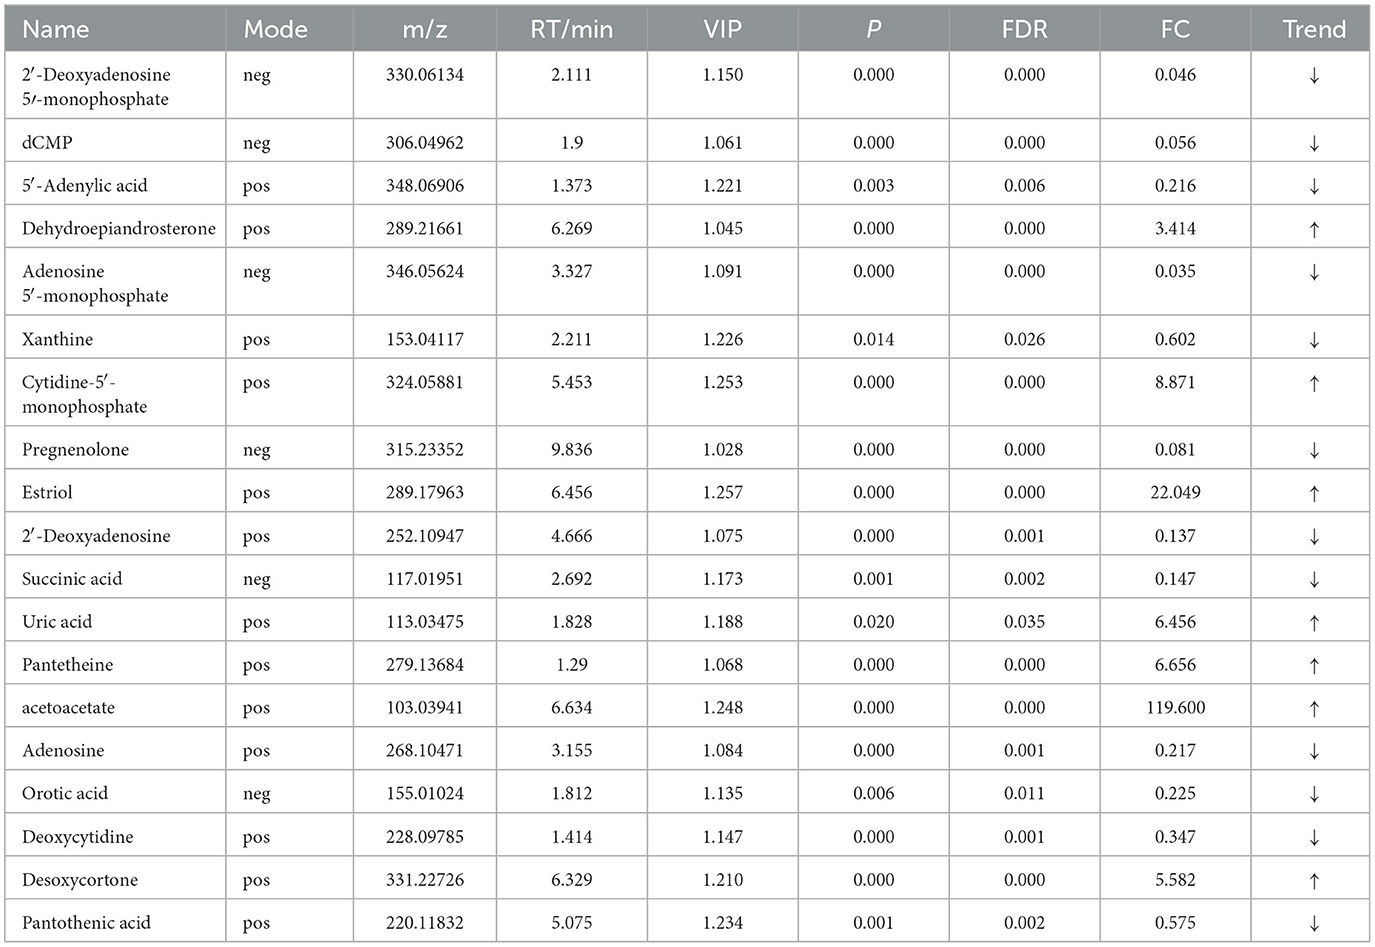
Table 11. Relative abundance of significant differential metabolites involved in KEGG pathway analysis (LOB vs. LN).
Spearman's correlation was used to investigate the relationship between gut microbiota and metabolites. The relationship between the most differentially expressed metabolites and the top 10 genera was analyzed in mice (Figure 7). In the same body weight groups, in HOB vs. LOB, we found that the abundance of Romboutsia was positively correlated with the fecal lipid compounds adrenosterone, desoxycortone, 2-methoxyestrone, and cortisol (P < 0.05), and with that of fecal nucleotide compounds guanosine, cAMP, adenosine, uridine, and inosin (P < 0.05), but negatively correlated with organic acids L-glutamine, fumaric acid, L-hydroxyproline, L-ornithine, L-glutamic acid, N-acetylornithine, and L-argininosuccinate (P < 0.05). Lactobaculum was positively correlated with the organic acids L-glutamine, fumaric acid, L-hydroxyproline, L-ornithine, L-glutamic acid, N-acetylornithine, and L-argininosuccinate (P < 0.05), but there was a negative correlation with nucleotides guanosine, thymidine, adenosine, uridine, and inosine (P < 0.05). This is the opposite of Romboutsia in relation to metabolites (Figure 7A). In HN vs. LN, Turicibacter was positively correlated with the nucleotide compounds adenosine, urocanic acid, and cytidine (P < 0.05) and Romboutsia was negatively correlated with the organic acid compounds allantoate and ornithine (P < 0.05). These results suggested that the microbial Romboutsia characterized by hypoxia showed a negative correlation with organic acid compounds and a positive correlation with nucleotide and lipid compounds (P < 0.05) (Figure 7B).
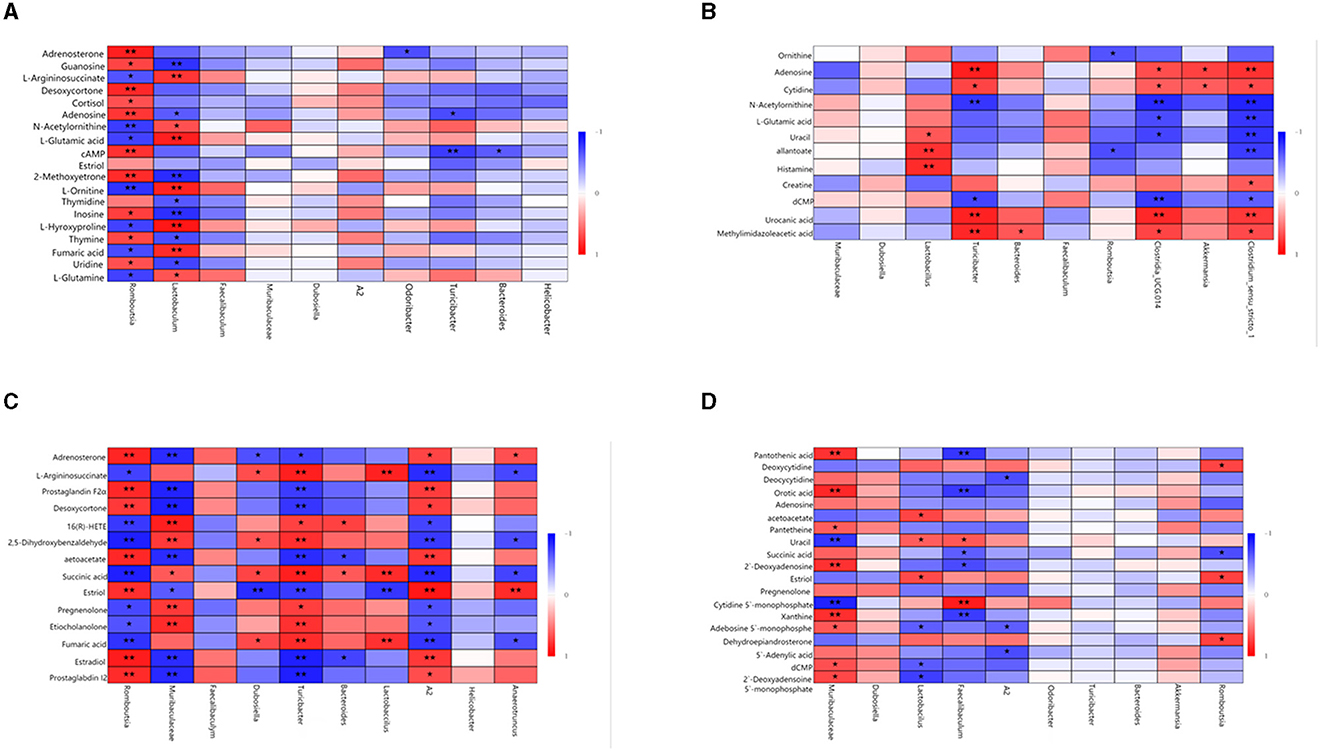
Figure 7. Correlation analysis of gut microbiota and fecal metabolites. (A) HOB vs. LOB. (B) HN vs. LN. (C) HOB vs. HN. (D) LOB vs. LN. The red line represents a significant positive correlation, while the blue line represents a significant negative correlation, *P < 0.05; **P < 0.01.
In the same oxygen level groups, in HOB vs. HN, Romboutsia was positively correlated with the fecal lipid compounds prostaglandin I2, estradiol, estriol, desoxycortone, prostaglandin F2α, and adrenosteron (P < 0.05), but negatively correlated with the organic acid L-argininosuccinate, succinic acid, and fumaric acid (P < 0.05). Muribaculaceae was negatively correlated with the fecal lipid compound prostaglandin I2, estradiol, estriol, desoxycortone, prostaglandin F2α, and adrenosteron (P < 0.05), but positively correlated with the organic acid succinic acid. Lactobacillus was positively correlated with fumaric acid, succinic acid, and L-argininosuccinat (P < 0.05). A2 was positively correlated with prostaglandin I2, estradiol, estriol, desoxycortone, prostaglandin F2α, and adrenosteron (P < 0.05), but negatively correlated with fumaric acid, succinic acid, and L-argininosuccinat (P < 0.05) (Figure 7C). In LOB vs. LN, Muribaculaceae was positively correlated with nucleotides 2′-deoxyadenosine 5′-monophosphate, dCMP, adenosine 5′-monophosphate, xanthine, and 2′-deoxyadenosin (P < 0.05); Lactobacillus was negatively correlated with 2′-deoxyadenosine 5′-monophosphate, dCMP, and adenosine 5′-monophosphat (P < 0.05). Faecalibaculum was negatively correlated with orotic acid, succinic acid, and pantothenic acid (P < 0.05), but positively correlated with uracil and cytidine-5′-monophosphat (P < 0.05). It was positively correlated with the fecal lipid compound estriol (P < 0.05) and with correlated with acetoacetat (P < 0.05). A2 was negatively correlated with 5′-adenylic acid, adenosine 5′-monophosphate, and deoxycytidin (P < 0.05) (Figure 7D). These results suggested that gut microbiota in the hypoxic group were positively correlated with lipid and nucleotide compounds and negatively correlated with organic acid compounds.
In this study, we compared the gut microbiota and feal metabolites of obese and normal weight mice with different oxygen levels using 16S rRNA sequencing and metabolomics. We found that (1) the diversity of the hypoxic and obese gut microbiota was reduced compared to the control groups. (2) Hypoxia and obesity lead to disturbances in gut metabolism. (3) Gut microbiota and fecal metabolism are closely related. Identifying the characteristic bacteria and metabolites of obesity in different environments will help us to target interventions for obesity.
Studies have shown that low-grade inflammation is a hallmark of obesity, characterized by changes in the composition of the gut microbiota and its metabolites, which are transferred from the gut across the disrupted intestinal barrier and affect various metabolic organs, such as the liver and adipose tissue, thereby promoting metabolic inflammation (Tilg et al., 2020). Available evidence on the correlation between metabolomics and obesity metabolite profiles suggests that it is mainly related to amino acid and lipid metabolites (Payab et al., 2022). In this study, we found that in the hypoxic obesity group (HOB vs. HN), changes were mainly caused in Romboutsia, Muribaculaceae, Lactobacillus and A2, and in the metabolism of amino acids and lipid compounds. Among them, Romboutsia showed a positive correlation with lipid compounds Prostaglandin I2 (FC = 76.406), Estriol (FC = 32.960), Prostaglandin F2α (FC = 44.775), Adrenosterone (FC = 11.118), and Desoxycortone (FC=10.312). Studies have shown that Romboutsia, Erysipelatoclostridium, and Enterobacteriaceae are positively associated with obesity and intestinal inflammation (Nagayama et al., 2020; Yu et al., 2020; Song et al., 2021), and suggested that the Romboutsia-driven microbiome, characterized by low bacterial diversity and high primary bile acids, is associated with fat-driven obesity (Therdtatha et al., 2021). Thus, we hypothesized that hypoxic obesity is associated with Romboutsia-driven ecological dysregulation of the gut microbiome. Among these metabolic compounds, Prostaglandin I2 and Prostaglandin F2α, as bioactive lipid mediators, are associated with inflammation (Idborg and Pawelzik, 2022), and 8-iso-PGF2α are associated with obesity (Furukawa et al., 2004), and both compounds are involved in the metabolism of arachidonic acid, which can be metabolized to leukotriene A4 (LTA4) and lipoxin (LXs), and further generate other types of leukotriene (LT)(Guriec et al., 2014). LT can activate leukocytes and promote inflammation (Bertin et al., 2014). Studies have shown that steroid hormones are associated with metabolic diseases in women (e.g., obesity and gestational diabetes), whereas estradiol increases energy expenditure by increasing thermogenesis and lipolysis of BAT (Vigil et al., 2022). The metabolism of these lipid compounds may also be associated with hypoxic factors. One study has suggested that hypoxia is also an important trigger for fatty acid oxidation (Hikita et al., 2007). Amino acids are not only essential nutrients and energy sources but are also involved in many biochemical processes such as purine biosynthesis and uric acid production. The main organ involved in amino acid metabolism is the liver, which plays an important role in maintaining amino acid homeostasis. Abnormal amino acid metabolism results in dysregulation of fatty acid, protein, and urea synthesis, energy metabolism, protein hydrolysis, and cell signaling (Newsholme et al., 2003). Previous studies found that compounds such as alanine, glutamate, proline, succinate, tyrosine, and BCAA were found to be higher in obese participants (Butte et al., 2015), however, our study found a downregulation trend in hypoxic obese mice. Many organic acids are involved in the TCA cycle and their metabolism is disturbed in obese mice, affecting energy metabolism, but the exact mechanism is not clear. In the LOB vs. LN group, a higher abundance of Faecalibaculum, Lactobacillus, and A2 was found in the normoxic group. Lactobacillus, which is particularly abundant in obese mice, can regulate body weight by hydrolyzing indigestible polysaccharides into easily absorbed monosaccharides, thereby activating lipoprotein lipase, and it regulates DNA methylation levels at the host miR-378a promoter by increasing acetate and butyrate in SCFAs, thereby preventing the development of obesity and glucose intolerance (Du et al., 2021). Faecaalibaculum is mainly present in obese individuals and can maintain intestinal homeostasis by producing butyrate, inhibiting NF-KB, and upregulating PPAR-γ to suppress the onset of inflammation (Gomes et al., 2018). In this study, we found that Faecalibaculum showed a positive correlation with lipid and nucleotide compounds. In a high-fat diet-induced gut microbiota sequencing of obese mice, Colidextribacter and Faecalibacterium were found to be indicators of obesity and their abundance was positively correlated with obesity. Therefore, we speculate that the occurrence of obesity in the normoxic group may be related to the disruption of the gut microbiota induced by Faecalibacterium (Yu et al., 2022). Pyrimidine and purine nucleotide metabolism disorders predominate, suggesting that under conditions of cellular damage (inflammation, hypoxia, acute injury), ATP is rapidly released from cells into the extracellular compartment, causing a rapid increase in extracellular levels of ATP, ADP, or AMP, and adenosine produced by hydrolysis (Fredholm, 2007). Some studies have found that obesity increases the breakdown of adenine nucleotides in adipose tissue (Tsushima et al., 2013), and xanthine is one of the representative metabolites. Xanthine is a common host-microbe metabolite found in human tissues, body fluids, and intestinal flora, and can be converted to uric acid in mice. Both xanthine and hypoxanthine are precursors of oxidized purines and uric acid, are oxidized by xanthine oxidoreductase in purine catabolism, and play an important role in ATP generation (Nishino and Okamoto, 2015). Studies have shown that uric acid is the final oxidation product of purine nucleotide catabolism in humans, that serum uric acid levels are based on the balance between the absorption, production, and excretion of purines and purine nucleotides, and that obesity is often associated with hyperuricemia (Tsushima et al., 2013). Elevated serum uric acid is strongly associated with visceral fat accumulation and several metabolic diseases (Tamba et al., 2008; Kim et al., 2012). In this study, uric acid levels showed an upregulation trend in the obese groups (FC=6.456), which is consistent with the above conclusions.
In the same body weight groups (HOB vs. LOB, HN vs. LN), the main dominant bacterium was Romboutsia, which was mainly associated with the metabolism of nucleotide and amino acid compounds. The analysis of the effect of altitude on Sanhe heifers' gut microbiota and metabolism found that Romboutsia was associated with the metabolism of purine pyrimidines and amino acids (Zhang et al., 2023). Another study found that some potential probiotics, including Christensenellaceae_R-7_group, Ruminococcus_1, Romboutsia, Alloprevotella, E. coprostanoligenes, and Clostridium, were enriched in the rumen of high-altitude yaks. Shifts in the rumen microbiomes were caused by a high-altitude environment characterized by cold temperatures, hypoxia, and the production of high-fiber herbage. Moreover, rumen microbial diversity and herbage fermenting ability of yaks increased with elevation; therefore, high-altitude yaks should be considered to have microbiota adaptation to partially meet the higher energy requirements needed for survival in the harsh cold and hypoxic environment (Fan et al., 2020). In an in vivo study, it was found that Romboutsia was significantly associated with bile acids, triglycerides, amino acids and derivatives, and organic acids and derivatives in the standard diet groups, whereas triglycerides and free fatty acids were significantly associated in the high-fat diet groups (Yin et al., 2023). A large body of research suggests that hypoxic environments can alter lipid metabolism in mice and humans (Famulla et al., 2012; Siques et al., 2020; Morin et al., 2021). It may be that the hypoxic environment at high altitude promotes fat mobilization.
This study only analyzed changes in metabolites in mouse feces, and so cannot fully elucidate systemic metabolic changes in mice. At the same time, during the hypoxic intervention, the effect of oxygen concentration on mice at different time points cannot be displayed dynamically without dividing the time periods. Due to the small sample size, the construction of models for predicting the onset of obesity by metabolites is limited. Therefore, based on this study, further sample expansion and targeted metabolomics research with multiple time points and tissues can be carried out in subsequent studies, providing new ideas for the potential molecular mechanisms of preventing or treating obesity in high-altitude areas.
In conclusion, 16S rRNA gene sequencing and untargeted metabolomics revealed characteristic changes in fecal metabolites and gut microbiota in obese and hypoxic groups of mice. In the same body weight groups, we found that the dominant flora was associated with the metabolism of nucleotide and amino acid compounds. In the same oxygen concentration groups, we found that the dominant bacteria were associated with lipids and amino acids.
The datasets presented in this study can be found in online repositories. The names of the repository/repositories and accession number(s) are: NCBI SRA (accession: PRJNA1007439).
The animal study was approved by the Medical Science Research Ethics Committee of Qinghai University (No. 2021-06, approved 21 June 2021). The study was conducted in accordance with the local legislation and institutional requirements.
AA and WD conceived and supervised the study. WD, AA, XY, YM, and ZW collected and processed samples. XW provided financial support. AA, XY, and SL analyzed data and drafted the manuscript. All authors contributed to the article and approved the submitted version.
This work was supported by the Youth Research Foundation of Qinghai University (Grant No. 2021-QYY-2), the National Science Foundation of China (Grant No. 32260222), and the National Science Foundation of Qinghai (Grant No. 2020-ZJ-768).
The authors declare that the research was conducted in the absence of any commercial or financial relationships that could be construed as a potential conflict of interest.
All claims expressed in this article are solely those of the authors and do not necessarily represent those of their affiliated organizations, or those of the publisher, the editors and the reviewers. Any product that may be evaluated in this article, or claim that may be made by its manufacturer, is not guaranteed or endorsed by the publisher.
Abenavoli, L., Scarpellini, E., Colica, C., Boccuto, L., Salehi, B., Sharifi-Rad, J., et al. (2019). Gut microbiota and obesity: a role for probiotics. Nutrients 11, 2690. doi: 10.3390/nu11112690
Aron-Wisnewsky, J., Warmbrunn, M. V., Nieuwdorp, M., and Clément, K. (2020). Metabolism and metabolic disorders and the microbiome: the intestinal microbiota associated with obesity, lipid metabolism, and metabolic health-pathophysiology and therapeutic strategies. Gastroenterology 160, 573–599. doi: 10.1053/j.gastro.2020.10.057
Attitalla, I. H. (2011). Modified CTAB method for high quality genomic DNA extraction from medicinal plants. Pak. J. Biol. Sci. 14, 998–999. doi: 10.3923/pjbs.2011.998.999
Bárcena, C., Valdés-Mas, R., Mayoral, P., Garabaya, C., Durand, S., Rodríguez, F., et al. (2019). Healthspan and lifespan extension by fecal microbiota transplantation into progeroid mice. Nat. Med. 25, 1234–1242. doi: 10.1038/s41591-019-0504-5
Bertin, J., Jalaguier, P., Barat, C., Roy, M. A., and Tremblay, M. J. (2014). Exposure of human astrocytes to leukotriene C4 promotes a CX3CL1/fractalkine-mediated transmigration of HIV-1-infected CD4+ T cells across an in vitro blood-brain barrier model. Virology. 454–455, 128–138. doi: 10.1016/j.virol.2014.02.007
Bokulich, N. A., Subramanian, S., Faith, J. J., Gevers, D., Gordon, J. I., Knight, R., et al. (2013). Quality-filtering vastly improves diversity estimates from Illumina amplicon sequencing. Nat. Methods. 10, 57–59. doi: 10.1038/nmeth.2276
Butte, N. F., Liu, Y., Zakeri, I. F., Mohney, R. P., Mehta, N., Voruganti, V. S., et al. (2015). Global metabolomic profiling targeting childhood obesity in the Hispanic population. Am. J. Clin. Nutr. 102, 256–267. doi: 10.3945/ajcn.115.111872
Caporaso, J. G., Kuczynski, J., Stombaugh, J., Bittinger, K., Bushman, F. D., Costello, E. K., et al. (2010). QIIME allows analysis of high-throughput community sequencing data. Nat. Methods 7, 335–336. doi: 10.1038/nmeth.f.303
Ding, C., Guo, J., and Su, Z. (2015). The status of research into resistance to diet-induced obesity. Horm. Metab. Res. 47, 404–410. doi: 10.1055/s-0034-1395584
Du, J., Zhang, P., Luo, J., Shen, L., Zhang, S., Gu, H., et al. (2021). Dietary betaine prevents obesity through gut microbiota-drived microRNA-378a family. Gut Microbes. 13, 1–19. doi: 10.1080/19490976.2020.1862612
Du, W., Liu, L., Ma, Y., Zhu, Q., Jia, R., Han, Y., et al. (2022). Analysis of the gut microbiome in obese native Tibetan children living at different altitudes: a case-control study. Front. Public Health 10, 963202. doi: 10.3389/fpubh.2022.963202
Famulla, S., Schlich, R., Sell, H., and Eckel, J. (2012). Differentiation of human adipocytes at physiological oxygen levels results in increased adiponectin secretion and isoproterenol-stimulated lipolysis. Adipocyte 1, 132–181. doi: 10.4161/adip.19962
Fan, Q., Wanapat, M., Yan, T., and Hou, F. (2020). Altitude influences microbial diversity and herbage fermentation in the rumen of yaks. BMC Microbiol. 20, 370. doi: 10.1186/s12866-020-02054-5
Fredholm, B. B. (2007). Adenosine, an endogenous distress signal, modulates tissue damage and repair. Cell Death Differ. 14, 1315–1323. doi: 10.1038/sj.cdd.4402132
Furukawa, S., Fujita, T., Shimabukuro, M., Iwaki, M., Yamada, Y., Nakajima, Y., et al. (2004). Increased oxidative stress in obesity and its impact on metabolic syndrome. J. Clin. Invest. 114, 1752–1761. doi: 10.1172/JCI21625
Gomes, A. C., Hoffmann, C., and Mota, J. F. (2018). The human gut microbiota: Metabolism and perspective in obesity. Gut Microbes. 9, 308–325. doi: 10.1080/19490976.2018.1465157
Guriec, N., Le Jossic-Corcos, C., Simon, B., Ianotto, J. C., Tempescul, A., et al. (2014). The arachidonic acid-LTB4-BLT2 pathway enhances human B-CLL aggressiveness. Biochim Biophys. Acta. 1842, 2096–2105. doi: 10.1016/j.bbadis.2014.07.016
Haas, B. J., Gevers, D., Earl, A. M., Feldgarden, M., Ward, D., Giannoukos, G., et al. (2011). Chimeric 16S rRNA sequence formation and detection in Sanger and 454-pyrosequenced PCR amplicons. Genome Res. 21:494–504. doi: 10.1101/gr.112730.110
Han, Y., Xu, J., Yan, Y., and Zhao, X. (2022). Dynamics of the gut microbiota in rats after hypobaric hypoxia exposure. PeerJ. 10, e14090. doi: 10.7717/peerj.14090
Hikita, M., Ohno, I., Mori, Y., Ichida, K., Yokose, T., Hosoya, T., et al. (2007). Relationship between hyperuricemia and body fat distribution. Intern. Med. 46, 1353–1358. doi: 10.2169/internalmedicine.46.0045
Idborg, H., and Pawelzik, S. C. (2022). Prostanoid metabolites as biomarkers in human disease. Metabolites 12, 721. doi: 10.3390/metabo12080721
Jumpertz, R., Le, D. S., Turnbaugh, P. J., Trinidad, C., Bogardus, C., Gordon, J. I., et al. (2011). Energy-balance studies reveal associations between gut microbes, caloric load, and nutrient absorption in humans. Am. J. Clin. Nutr. 94, 58–65. doi: 10.3945/ajcn.110.010132
Kim, T. H., Lee, S. S., Yoo, J. H., Kim, S. R., Yoo, S. J., Song, H. C., et al. (2012). The relationship between the regional abdominal adipose tissue distribution and the serum uric acid levels in people with type 2 diabetes mellitus. Diabetol. Metab. Syndr. 4, 3. doi: 10.1186/1758-5996-4-3
Kong, G., Zhang, W., Zhang, S., Chen, J., He, K., Zhang, C., et al. (2023). The gut microbiota and metabolite profiles are altered in patients with spinal cord injury. Mol. Brain. 16, 26. doi: 10.1186/s13041-023-01014-0
Ley, R. E., Turnbaugh, P. J., Klein, S., and Gordon, J. I. (2006). Microbial ecology: human gut microbes associated with obesity. Nature 444, 1022–1023. doi: 10.1038/4441022a
Magoč, T., and Salzberg, S. L. (2011). FLASH fast length adjustment of short reads to improve genome assemblies. Bioinformatics 27, 2957–2963. doi: 10.1093/bioinformatics/btr507
Morin, R., Goulet, N., Mauger, J. F., and Imbeault, P. (2021). Physiological Responses to Hypoxia on Triglyceride Levels. Front. Physiol. 12, 730935. doi: 10.3389/fphys.2021.730935
Nagayama, M., Yano, T., Atarashi, K., Tanoue, T., Sekiya, M., Kobayashi, Y., et al. (2020). TH1 cell-inducing Escherichia coli strain identified from the small intestinal mucosa of patients with Crohn's disease. Gut Microbes. 12, 1788898. doi: 10.1080/19490976.2020.1788898
Nam, M., Choi, M.-.S, Jung, S., Jung, Y., Choi, J-, Y., et al. (2015). Lipidomic profiling of liver tissue from obesity-prone and obesity-resistant mice fed a high fat diet. Sci. Rep. 5, 16984. doi: 10.1038/srep16984
Newsholme, P., Procopio, J., Lima, M. M. R., Pithon-Curi, T. C., and Curi, R. (2003). Glutamine and glutamate–their central role in cell metabolism and function. Cell Biochem. Funct. 21, 1–9. doi: 10.1002/cbf.1003
Nicholson, J. K., Lindon, J. C., and Holmes, E. (1999). “Metabonomics”: understanding the metabolic responses of living systems to pathophysiological stimuli via multivariate statistical analysis of biological NMR spectroscopic data. Xenobiotica. 29, 1181–1189. doi: 10.1080/004982599238047
Nishino, T., and Okamoto, K. (2015). Mechanistic insights into xanthine oxidoreductase from development studies of candidate drugs to treat hyperuricemia and gout. J. Biol. Inorg. Chem. 20, 195–207. doi: 10.1007/s00775-014-1210-x
O'Reilly, F. J., and Mielke, W. M. (1980). Asymptotic normality of MRPP statistics from invariance principles of u-statistics. Commun. Statt. 9, 629–637. doi: 10.1080/03610928008827907
Payab, M., Tayanloo-Beik, A., Falahzadeh, K., Mousavi, M., Salehi, S., Djalalinia, S., et al. (2022). Metabolomics prospect of obesity and metabolic syndrome; a systematic review. J. Diabetes Metab. Disord. 21, 889–917. doi: 10.1007/s40200-021-00917-w
Pérez-Pérez, A., Vilariño-García, T., Fernández-Riejos, P., Martín-González, J., Segura-Egea, J. J., Sánchez-Margalet, V., et al. (2017). Role of leptin as a link between metabolism and the immune system. Cytokine Growth Factor Rev. 35, 71–84. doi: 10.1016/j.cytogfr.2017.03.001
Pral Laís, P., achi José, L, Corrêa, R. O., Colonna, M., and Vinolo, M. A. R. (2021). Hypoxia HIF-1 as key regulators of gut microbiota and host interactions. Trends Immunol. 42, 604–621. doi: 10.1016/j.it.2021.05.004
Ren, Q., Chen, S., Chen, X., Niu, S., Yue, L., Pan, X., et al. (2022). An effective glucagon-like peptide-1 receptor agonists, semaglutide, improves sarcopenic obesity in obese mice by modulating skeletal muscle metabolism. Drug Des. Devel. Ther. 16, 3723–3735. doi: 10.2147/DDDT.S381546
Schoeman, J. C., Hou, J., Harms, A. C., Vreeken, R. J., Berger, R., Hankemeier, T., et al. (2016). Metabolic characterization of the natural progression of chronic hepatitis B. Genome Med. 8, 64. doi: 10.1186/s13073-016-0318-8
Siques, P., Brito, J., Ordenes, S., and Pena, E. (2020). Involvement of overweight and lipid metabolism in the development of pulmonary hypertension under conditions of chronic intermittent hypoxia. Pulm. Circ. 10, 42–49. doi: 10.1177/2045894020930626
Song, Y., Shen, H., Liu, T., Pan, B., De Alwis, S., Zhang, W., et al. (2021). Effects of three different mannans on obesity and gut microbiota in high-fat diet-fed C57BL/6J mice. Food Funct. 12, 4606–4620. doi: 10.1039/D0FO03331F
Tamba, S., Nishizawa, H., Funahashi, T., Okauchi, Y., Ogawa, T., Noguchi, M., et al. (2008). Relationship between the serum uric acid level, visceral fat accumulation and serum adiponectin concentration in Japanese men. Intern. Med. 47, 1175–1180. doi: 10.2169/internalmedicine.47.0603
Therdtatha, P., Song, Y., Tanaka, M., Mariyatun, M., Almunifah, M., Manurung, N. E. P., et al. (2021). Gut microbiome of indonesian adults associated with obesity and type 2 diabetes: a cross-sectional study in an Asian City, Yogyakarta. Microorganisms 9, 897. doi: 10.3390/microorganisms9050897
Tilg, H., Zmora, N., Adolph, T. E., and Elinav, E. (2020). The intestinal microbiota fuelling metabolic inflammation. Nat. Rev. Immunol. 20, 40–54. doi: 10.1038/s41577-019-0198-4
Torres-Fuentes, C., Schellekens, H., Dinan, T. G., and Cryan, J. F. (2017). The microbiota-gut-brain axis in obesity. Lancet Gastroenterol. Hepatol. 2, 747–756. doi: 10.1016/S2468-1253(17)30147-4
Tsushima, Y., Nishizawa, H., Tochino, Y., Nakatsuji, H., Sekimoto, R., Nagao, H., et al. (2013). Uric acid secretion from adipose tissue and its increase in obesity. J. Biol. Chem. 288, 27138–27149. doi: 10.1074/jbc.M113.485094
Vigil, P., Meléndez, J., Petkovic, G., and Del Río, J. P. (2022). The importance of estradiol for body weight regulation in women. Front. Endocrinol (Lausanne). 13, 951186. doi: 10.3389/fendo.2022.951186
Wishart, D. S., Feunang, Y. D., Marcu, A., Guo, A. C., Liang, K., Vázquez-Fresno, R., et al. (2018). HMDB 4.0: the human metabolome database for 2018. Nucleic Acids Res. 46, D608–D617. doi: 10.1093/nar/gkx1089
Wishart, D. S., Tzur, D., Knox, C., Eisner, R., Guo, A. C., Young, N., et al. (2007). HMDB: the human metabolome database. Nucleic Acids Res. 35, D521–526. doi: 10.1093/nar/gkl923
Xie, W.-D., Wang, H., Zhang, J.-F., Kung, H.-F., Zhao, Y.-N., and Zhang, Y. (2010). Proteomic profile of visceral adipose tissues between low-fat diet-fed obesity-resistant and obesity-prone C57BL/6 mice. Mol. Med. Rep. 3, 1047–1052. doi: 10.3892/mmr.2010.354
Yin, H., Huang, J., Guo, X., Xia, J., and Hu, M. (2023). Romboutsia lituseburensis JCM1404 supplementation ameliorated endothelial function via gut microbiota modulation and lipid metabolisms alterations in obese rats. Microbiol. Lett. 370, fnad016. doi: 10.1093/femsle/fnad016
Yu, L., Wang, L., Yi, H., and Wu, X. (2020). Beneficial effects of LRP6-CRISPR on prevention of alcohol-related liver injury surpassed fecal microbiota transplant in a rat model. Gut Microbes. 11, 1015–1029. doi: 10.1080/19490976.2020.1736457
Yu, Z., Yu, X.-F., Kerem, G., and Ren, P.-G. (2022). Perturbation on gut microbiota impedes the onset of obesity in high fat diet-induced mice. Front. Endocrinol. (Lausanne). 13, 795371. doi: 10.3389/fendo.2022.795371
Zhang, W., Jiao, L., Liu, R., Zhang, Y., Ji, Q., Zhang, H., et al. (2018). The effect of exposure to high altitude and low oxygen on intestinal microbial communities in mice. PLoS ONE. 13, e0203701. doi: 10.1371/journal.pone.0203701
Zhang, X., Wang, W., Cao, Z., Yang, H., and Wang, Y. (2023). Effects of altitude on the gut microbiome and metabolomics of Sanhe heifers. Front. Microbiol. 14, 1076011. doi: 10.3389/fmicb.2023.1076011
Keywords: hypoxia, mice, gut microbiota, metabolomics, correlative analyses
Citation: Ailizire A, Wang X, Ma Y, Yan X, Li S, Wu Z and Du W (2023) How hypoxia affects microbiota metabolism in mice. Front. Microbiol. 14:1244519. doi: 10.3389/fmicb.2023.1244519
Received: 24 June 2023; Accepted: 25 August 2023;
Published: 28 September 2023.
Edited by:
Jing Li, China Pharmaceutical University, ChinaReviewed by:
Paniz Jasbi, Arizona State University, United StatesCopyright © 2023 Ailizire, Wang, Ma, Yan, Li, Wu and Du. This is an open-access article distributed under the terms of the Creative Commons Attribution License (CC BY). The use, distribution or reproduction in other forums is permitted, provided the original author(s) and the copyright owner(s) are credited and that the original publication in this journal is cited, in accordance with accepted academic practice. No use, distribution or reproduction is permitted which does not comply with these terms.
*Correspondence: Wenqi Du, NTQyNDcwNjVAcXEuY29t
†These authors share first authorship
Disclaimer: All claims expressed in this article are solely those of the authors and do not necessarily represent those of their affiliated organizations, or those of the publisher, the editors and the reviewers. Any product that may be evaluated in this article or claim that may be made by its manufacturer is not guaranteed or endorsed by the publisher.
Research integrity at Frontiers
Learn more about the work of our research integrity team to safeguard the quality of each article we publish.