 Feixiang Wang
 Huandong Yang2†
 Yan Wu
 Lihong Peng
95% of researchers rate our articles as excellent or good
Learn more about the work of our research integrity team to safeguard the quality of each article we publish.
Find out more
ORIGINAL RESEARCH article
Front. Microbiol. , 21 June 2023
Sec. Systems Microbiology
Volume 14 - 2023 | https://doi.org/10.3389/fmicb.2023.1207209
Introduction: Identification of complex associations between diseases and microbes is important to understand the pathogenesis of diseases and design therapeutic strategies. Biomedical experiment-based Microbe-Disease Association (MDA) detection methods are expensive, time-consuming, and laborious.
Methods: Here, we developed a computational method called SAELGMDA for potential MDA prediction. First, microbe similarity and disease similarity are computed by integrating their functional similarity and Gaussian interaction profile kernel similarity. Second, one microbe-disease pair is presented as a feature vector by combining the microbe and disease similarity matrices. Next, the obtained feature vectors are mapped to a low-dimensional space based on a Sparse AutoEncoder. Finally, unknown microbe-disease pairs are classified based on Light Gradient boosting machine.
Results: The proposed SAELGMDA method was compared with four state-of-the-art MDA methods (MNNMDA, GATMDA, NTSHMDA, and LRLSHMDA) under five-fold cross validations on diseases, microbes, and microbe-disease pairs on the HMDAD and Disbiome databases. The results show that SAELGMDA computed the best accuracy, Matthews correlation coefficient, AUC, and AUPR under the majority of conditions, outperforming the other four MDA prediction models. In particular, SAELGMDA obtained the best AUCs of 0.8358 and 0.9301 under cross validation on diseases, 0.9838 and 0.9293 under cross validation on microbes, and 0.9857 and 0.9358 under cross validation on microbe-disease pairs on the HMDAD and Disbiome databases. Colorectal cancer, inflammatory bowel disease, and lung cancer are diseases that severely threat human health. We used the proposed SAELGMDA method to find possible microbes for the three diseases. The results demonstrate that there are potential associations between Clostridium coccoides and colorectal cancer and one between Sphingomonadaceae and inflammatory bowel disease. In addition, Veillonella may associate with autism. The inferred MDAs need further validation.
Conclusion: We anticipate that the proposed SAELGMDA method contributes to the identification of new MDAs.
Human microbes are a class of organisms with simple structure and small size (Wu et al., 2018; Cheng et al., 2020). They widely distribute in various organs of the human body including the gut, gastrointestinal tract, lung, oral cavity, and skin (Lynch and Pedersen, 2016). Its abnormality may cause diseases, such as cancers, inflammatory bowel disease (El Mouzan et al., 2018), and asthma (Demirci et al., 2019). Therefore, it is important to uncover potential associations between microbes and diseases. Identification of Microbe-Disease Associations (MDAs) helps capture the complex pathogenesis of various diseases and provides novel insights into its drug design. For example, a few methods have been developed to capture potential drugs against COVID-19 (Peng et al., 2022a; Shen L. et al., 2022; Tian et al., 2022). Traditional experimental methods are expensive, time-consuming, and laborious (Chen et al., 2019). Thus, much attention has been devoted to computational methods for new MDA prediction.
Many computational models have been designed to find potential MDAs based on known MDAs and biological features of diseases and microbes. These methods mainly contain network-based methods and machine learning-based methods. Network-based MDA prediction methods include the KATZ measurement (Zhang et al., 2017; Li et al., 2019), random walk with network topology structure (NTSHMDA) (Luo and Long, 2018), and bi-random walk (Zou et al., 2017; Luo and Long, 2018; Yan et al., 2019). Network-based methods effectively found a few new MDAs; however, they depend on known MDAs for similarity calculation and fail to screen possible microbes (or diseases) for a new disease (or microbes) that has no association prediction.
Machine learning-based MDA prediction methods contain Laplacian regularized least squares (LRLSHMDA) (Wang et al., 2017), binary matrix completion (Shi et al., 2018), graph regularized non-negative matrix factorization (He et al., 2018), logistic matrix factorization with neighborhood regularization combining positive-unlabeled learning (Peng et al., 2020), inductive matrix completion and graph attention networks (GATMDA) (Long et al., 2021), and low-rank matrix completion combining the nuclear norm minimization (MNNMDA) (Liu H. et al., 2023). Machine learning algorithms better improved MDA prediction.
In particular, deep learning has been increasingly applied to the area of bioinformatics, such as cardiotoxicity identification related to hERG channel blockers (Wang T. et al., 2023), protein model quality assessment (Guo et al., 2022; Liu J. et al., 2023), metabolite-disease association discovery (Sun et al., 2022), lncRNA-protein interaction prediction (Lihong et al., 2021), lncRNA-miRNA association inference (Chen et al., 2021; Wang et al., 2022), lncRNA-disease association identification (Liang et al., 2022; Zhang et al., 2023), single-cell data analysis (Hu et al., 2023; Xu et al., 2023), drug-target interaction detection (Zhang et al., 2022; Li et al., 2023), and intercellular communication analyses (Peng et al., 2022b). Similarly, deep learning has been widely applied to accurate MDA prediction. These methods include deep matrix factorization combining Bayesian personalized ranking (Liu et al., 2020), multi-component graph attention network (Liu et al., 2021), graph convolutional network (Hua et al., 2022), metapath aggregated graph neural network (Chen and Lei, 2022), dual network contrastive learning model (Cheng et al., 2022), weighted meta-graph-based model (Long and Luo, 2019), knowledge graph neural network (Jiang et al., 2022), and relation graph convolutional network (Wang Y. et al., 2023).
Deep learning efficiently implements accurate MDA identification. In this manuscript, we developed a computational MDA prediction method called SAELGMDA by combining a sparse autoencoder for feature extraction and Light Gradient Boosting Machine (LightGBM) for MDA classification.
To construct a human MDA network, we investigated a human MDA database called HMDAD provided by Ma et al. (2017) (http://www.cuilab.cn/hmdad). The database contains 483 experimentally confirmed MDAs between 39 diseases and 292 microbes. We finally achieved 450 MDAs after filtering repetitive MDAs. In addition, Janssens et al. (2018) have collected a new MDA database named Disbiome. The database contains 5,573 experimentally confirmed human MDAs between 1,098 microbes and 240 diseases. Finally, we obtained 4,351 MDAs between 1,052 microbes and 218 diseases after filtering repetitive MDAs.
Consequently, an element Xij in an MDA matrix is represented as Eq. (1):
where nd and nm indicate the number of diseases and microbes, respectively. An MDA is taken as a positive sample if Xij = 1, otherwise, it is taken as an unlabeled sample.
In this manuscript, we proposed an MDA prediction method called SAELGMDA by combining sparse autoencoder and LightGBM. First, disease similarity and microbe similarity are computed by integrating functional similarity and Gaussian Interaction Profile Kernel (GIPK) similarity. Second, one microbe–disease pair is represented as one d-dimensional vector. Third, the obtained features for microbe–disease pairs are mapped into a low-dimensional space via a sparse autoencoder. Finally, the low-dimensional features are fed to LightGBM for MDA classification. The pipeline of SAELGBM is illustrated in Figure 1.
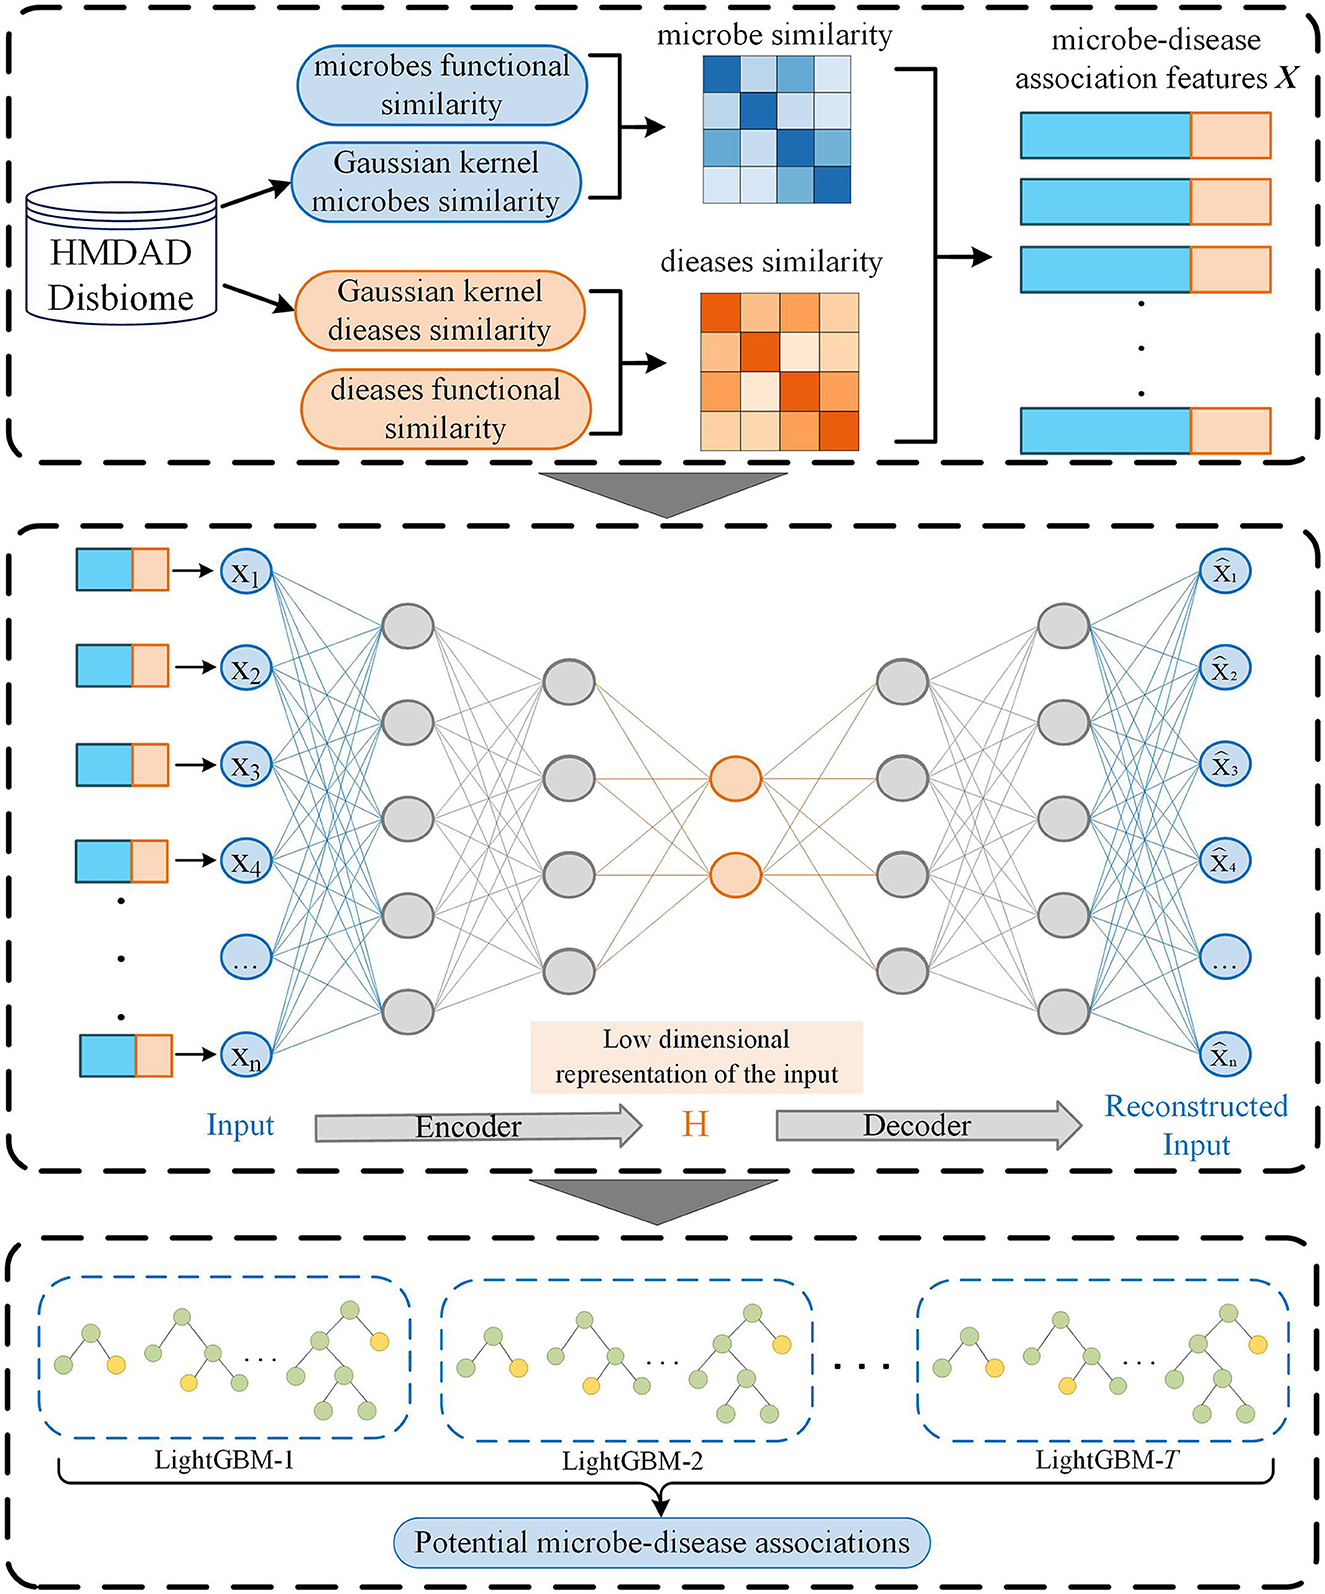
Figure 1. The flowchart of SAELGMDA.
We considered that similar diseases are more likely to associate with similar genes (Xu and Li, 2006; Wei and Liu, 2020) and computed disease functional similarity via disease-related genes. For two diseases di and dj and corresponding associated gene sets Gi = {gi1, gi2, …, gia} and Gj = {gj1, gj2, …, gjb}, the functional association between gene gk and gene set G = {g1, g2, …, gl} is first defined by Eq. (2):
where FS(gk, gt) indicates the functional similarity between gk and gt by Eq. (3):
where LLS′ denotes the normalized score of LLS by Eq. (4):
where LLS represents association log-likelihood score used to evaluate the functional linkage probability between two genes provided by HumanNet (Hwang et al., 2019; Long et al., 2021), LLSmax and LLSmin denote its maximum and minimum values, respectively.
Finally, the functional similarity between di and dj is computed by Eq. (5):
Microbe functional similarity matrix Mf is computed based on the method proposed by Kamneva (2017).
Based on the assumption that functionally similar diseases usually associate or disassociate with similar microbes, and disease Gaussian Interaction Profile Kernel (GIPK) similarity (Van Laarhoven et al., 2011) is computed via experimentally validated MDA network. In particular, the GIPK similarity of two diseases di and dj is computed by Eq. (6):
where
and IP(di) denotes associations between disease di and each microbe, that is, the ith row of X. γd denotes the normalized kernel bandwidth with original bandwidth of 1, and nd denotes the number of diseases.
Similarly, we computed the GIPK similarity matrix MG of microbes.
We may fail to compute the functional similarity for all diseases because not all diseases have related to genes. Thus, we combined disease GIPK similarity and functional similarity by Eq. (8):
Similarly, the integrated microbe similarity SM is computed.
For each microbe–disease pair (mi, dj), feature vectors of mi and dj are obtained based on similarity matrices SD and SM, respectively. Particularly, the feature vector of di is denoted as the similarity between di and all diseases. The feature vector of mj is denoted as the similarity between mj and all microbes. Thus, one microbe–disease pair is depicted as an (nd+nm)-dimensional feature vector after concatenation operation, where nd and nm indicate the number of diseases and microbes, respectively. In summary, there are n(n = nd×nm) samples (microbe–disease pairs), and each sample xi can be represented using a d(d = nd+nm)-dimensional vector. For xi, its label yi = 1. If its corresponding microbe–disease pair is associated, otherwise yi = 0. Consequently, an MDA matrix X with n samples is represented by Eq. (9):
The obtained features for microbe–disease pairs are highly dimensional and severely affect the classification accuracy of models. Deep learning demonstrates stronger feature learning ability than traditional dimensional reduction approaches. Thus, we designed a sparse autoencoder to reduce the feature dimensionality of each sample.
Sparse autoencoder (Andrew, 2011) is an unsupervised neural network model. It minimizes the reconstruction error and enforces sparsity constraints on all hidden nodes to obtain a more robust and meaningful representation of features and further improves the prediction performance of classification models (Makhzani and Frey, 2013). First, a high-dimensional feature vector for the microbe–disease pair is fed to an encoder by Eq. (10):
where X represents the input n samples with d-dimensional vector, H denotes the low-dimensional features after encoding, W, b, and f(·) represent the weight, bias, and encoding function of the encoder, respectively.
Next, a decoder restores the low-dimensional representation H to the same appearance as the input feature representation by Eq. (11):
where W′, b′, and g(·) represent the weight, bias, and decoding function of the decoder, respectively, and denotes the learned feature representation.
To minimize the reconstruction error, we build a cost function by Eq. (12):
where λ and β denote the sparsity regularization parameter and the coefficients for L2 regularization, respectively.
The first term MSE is mean square error. The term is used to measure the discrepancy between the input features X and the reconstructed features on training data by Eq. (13):
The second term Ωsparsity is the Kullback–Leibler divergence. The term is used to control sparsity based on the sparsity proportion ρ by Eq. (14):
where sl and denote the number of neurons in the lth hidden layer and the average activity of the tth neuron, respectively, denotes the relative entropy between Bernoulli random variables with mean ρ and mean . is computed by Eq. (15):
The third term is L2 regularization term Ωweights. The term is used to control the weights and avoid overfitting by Eq. (16):
where nl, sl, and denote the number of layers, the number of units in the lth layer, and the weight, respectively.
Each microbe–disease pair is represented as a low-dimensional vector after dimensional reduction based on a sparse autoencoder. LightGBM (Ke et al., 2017) is an optimized version of Gradient Boosting Decision Tree (GBDT) (Ye et al., 2009). It obtains better performance in the area of bioinformatics. Next, the constructed low-dimensional vector is used as the input of LightGBM (Ke et al., 2017), to classify each microbe–disease pair. For an MDA dataset , LightGBM intends to learn an approximation to a certain function f(x) by minimizing the expectation of the loss function L(y, f(x)) by Eq. (17):
LightGBM integrates T decision trees to approximate the final model . The decision trees with J leaf nodes are expressed as wq(x), where wq(x) denotes the weights of all samples on leaf nodes and q(x) denotes the decision rules. Hence, The loss function of LightGBM is defined by Eq. (18):
The constant term in model (18) is removed for simplicity, and model (18) is transformed as Eq. (19):
where gi and hi denote the first-order and second-order derivatives of the loss function, respectively.
For a sample set, Ij related to leaf j, model (19) could be transformed as follows:
Given a tree structure q(x), the optimal leaf weight of each leaf node and the maximum value of a scoring function Γk that evaluate the quality of q(x) are defined by Eqs. (21) and (22):
Consequently, the objective function is represented as Eq. (23):
where IL and IR denote the example sets on the left and right sides, respectively.
Similar to RNMFMDA provided by Peng et al. (2020), the experiments were performed under three 5-fold cross validations (CVs) 20 times. For an MDA matrix Xn, the three CVs were as follows:
• five-fold CV 1 (CV1): CV on diseases, i.e., in each round, 80% of nd diseases in X was taken as training set and the remaining 20% was test set.
• five-fold CV 2 (CV2): CV on microbes, i.e., in each round, 80% of nm microbes in X was taken as training set and the remaining 20% was test set.
• five-fold Cv 3 (CV3): CV on microbe–disease pairs, i.e., in each round, 80% of entries (microbe–disease pairs) in X were used as training set and the remaining 20% was test set.
In the sparse autoencoder, the neural network comprised an encoder and a decoder. The network structure was trained in Keras based on the TensorFlow backend. The structure comprised one input layer, three hidden layers, and an output layer. The number of each layer was 331, 256, 128, 96, and 64, respectively. The layers in the encoder and decoder were symmetric around the bottleneck. Tanh and ReLU were used as the activation functions in the output layer and the other layers, respectively. The optimization method used the Adam algorithm (Kingma and Ba, 2014). The batch size was set to 32 because a smaller batch size can make the model converge faster. The parameters λ, β, and ρ were set to 0.1, 0.0005, and 0.05, respectively. The final encoding size of the autoencoder is set to 64, that is, the features of MDAs were reduced to 64 dimensions.
For LightGBM, the parameters “num_leaves,” “learning_rate,” and “max_depth” denote the number of leaves in a tree, the speed of iteration, and the maximum depth of the tree, respectively. They were set to 31, 0.1, and –1, respectively. “Feature_fraction” and “bagging_fraction” are two hyperparameters in the optimization process. The former denotes the fraction of features at each iteration and was set to 0.9. The latter denotes the fraction of data and applies to boost the training and reduce overfitting. It was set to 0.9. “min_data” denotes the minimum number of records in a leaf and is also used to reduce overfitting. The parameters in the other four comparison methods were set to the defaults in corresponding publications. One microbe–disease pair is taken as a positive MDA when its association probability is greater than 50%, otherwise, it is taken as a negative MDA.
Four evaluation metrics were used to measure the performance of MDA prediction methods: accuracy, Matthews correlation coefficient (MCC) (Chicco and Jurman, 2020), area under the ROC curve (AUC), and area under the Precision-Recall curve (AUPR). Higher values for the four evaluation metrics represent better performance.
To evaluate the performance of SAELGMDA, we compared it with four state-of-the-art MDA identification algorithms (MNNMDA, GATMDA, NTSHMDA, and LRLSHMDA) under three CVs on the HMDAD and Disbiome datasets, that is, CV1, CV2, and CV3.
Table 1 shows accuracies, MCCs, AUCs, and AUPRs of SAELGMDA and the other four methods under CV1. The best performance in each column is described in Tables 1–6. As shown in Table 1, SAELGMDA computed the best MCC, AUC, and AUPR on the HMDAD database and the best accuracy, MCC, AUC, and AUPR on the Disbiome database, significantly outperforming the other four MDA prediction methods under CV1. Although accuracy was slightly less than MNNMDA and GATMDA on HMDAD, the difference was very tiny. Moreover, SAELGMDA outperformed the other methods, especially AUC and AUPR on the whole. In addition, although SAELGMDA outperformed the other four methods, all methods computed lower MCC and AUPR under CV1, which may be caused by fewer diseases. Figure 2 shows the ROC and PR curves of the five methods on the two databases under CV1.
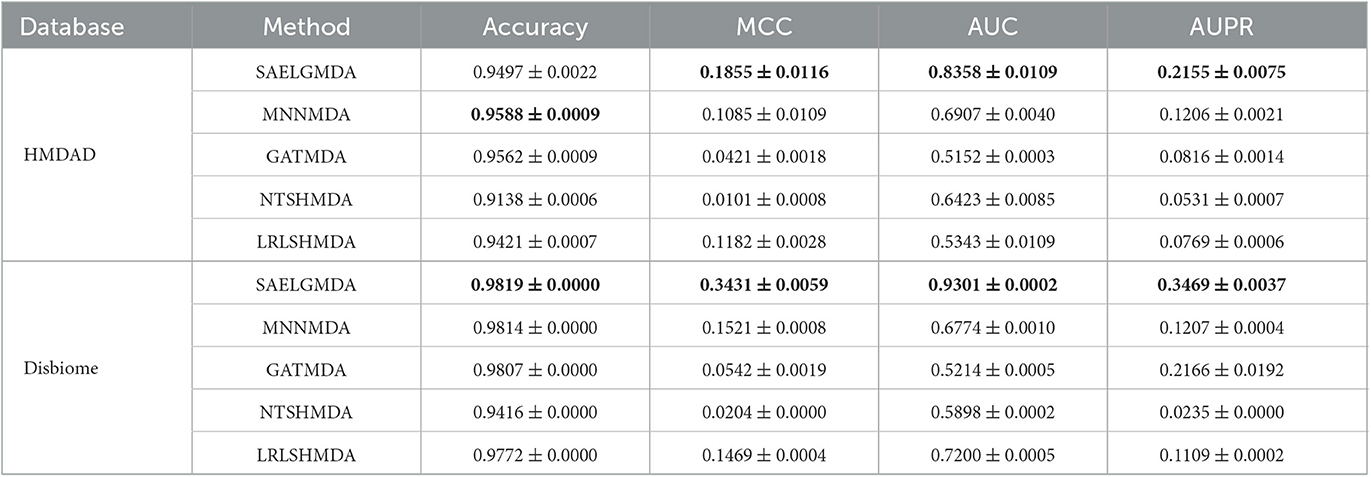
Table 1. The performance of five MDA identification methods under CV1.
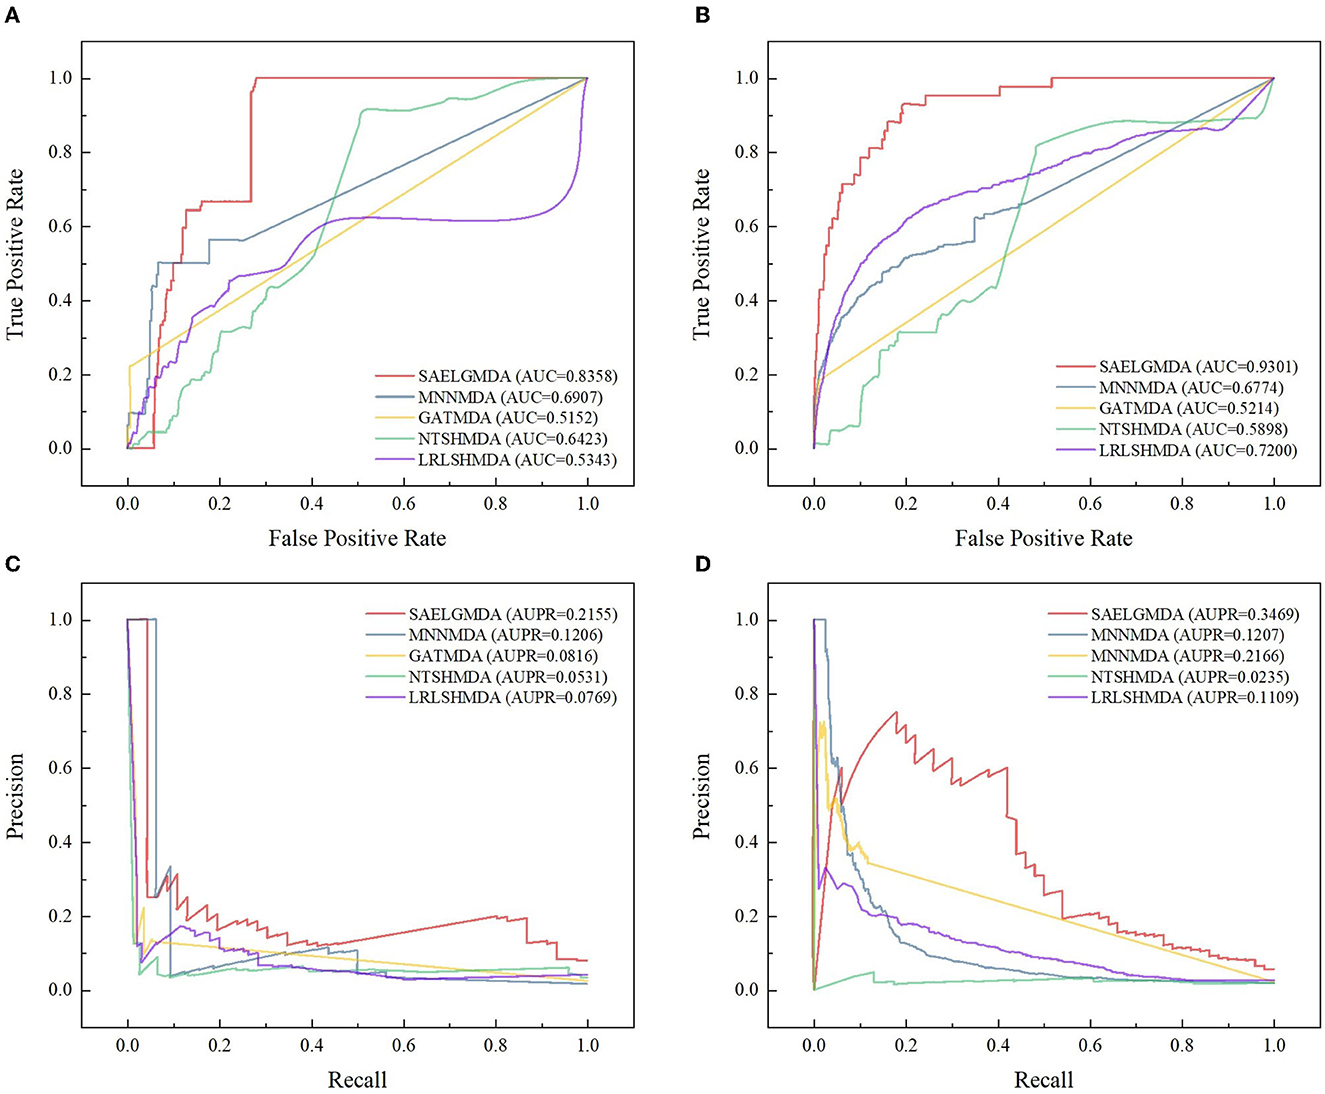
Figure 2. The ROC and the PR curves of five different methods under CV1 on the two databases. (A, B) Denote the ROC curves on the HMDAD and Disbiome databases, respectively. (C, D) Denote the PR curves on the HMDAD and Disbiome databases, respectively.
Table 2 demonstrates the prediction performance of SAELGMDA and the other four methods under CV2. The best performance in each column is described in boldface. As shown in Table 2, we observed that SAELGMDA computed the best accuracies, MCCs, and AUCs on the two databases under CV2. In particular, SAELGMDA obtained better MCC and AUPR on the HMDAD database than ones on the Disbiome database, which may be caused by different data structures. In addition, all five MDA prediction methods computed lower MCC and AUPR on the Disbiome database. Figure 3 shows the ROC and PR curves of the five methods under CV2.
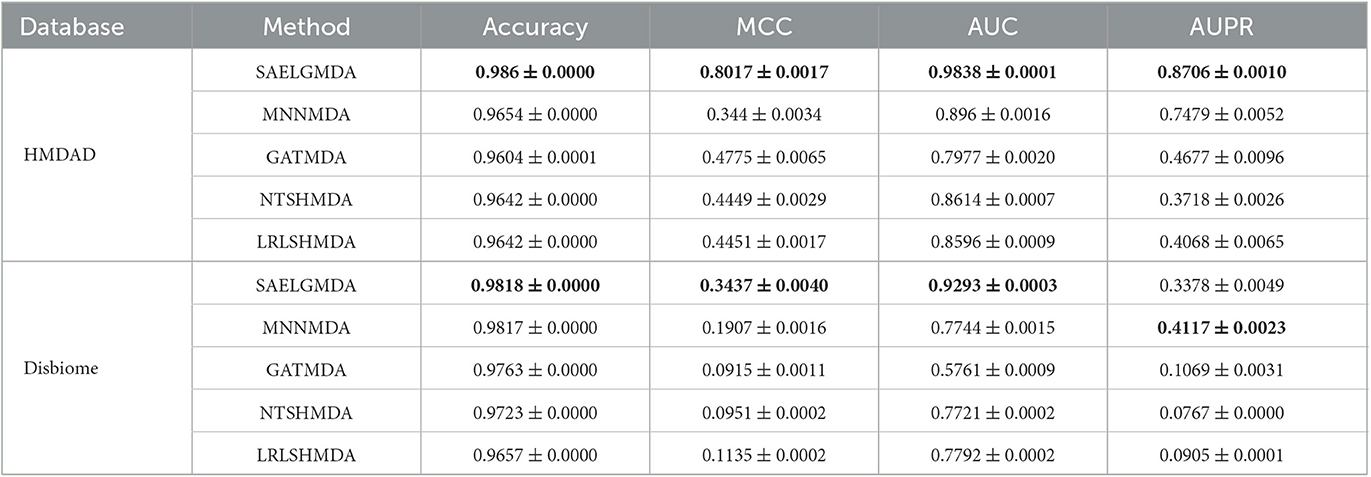
Table 2. The performance of five MDA identification methods under CV2.
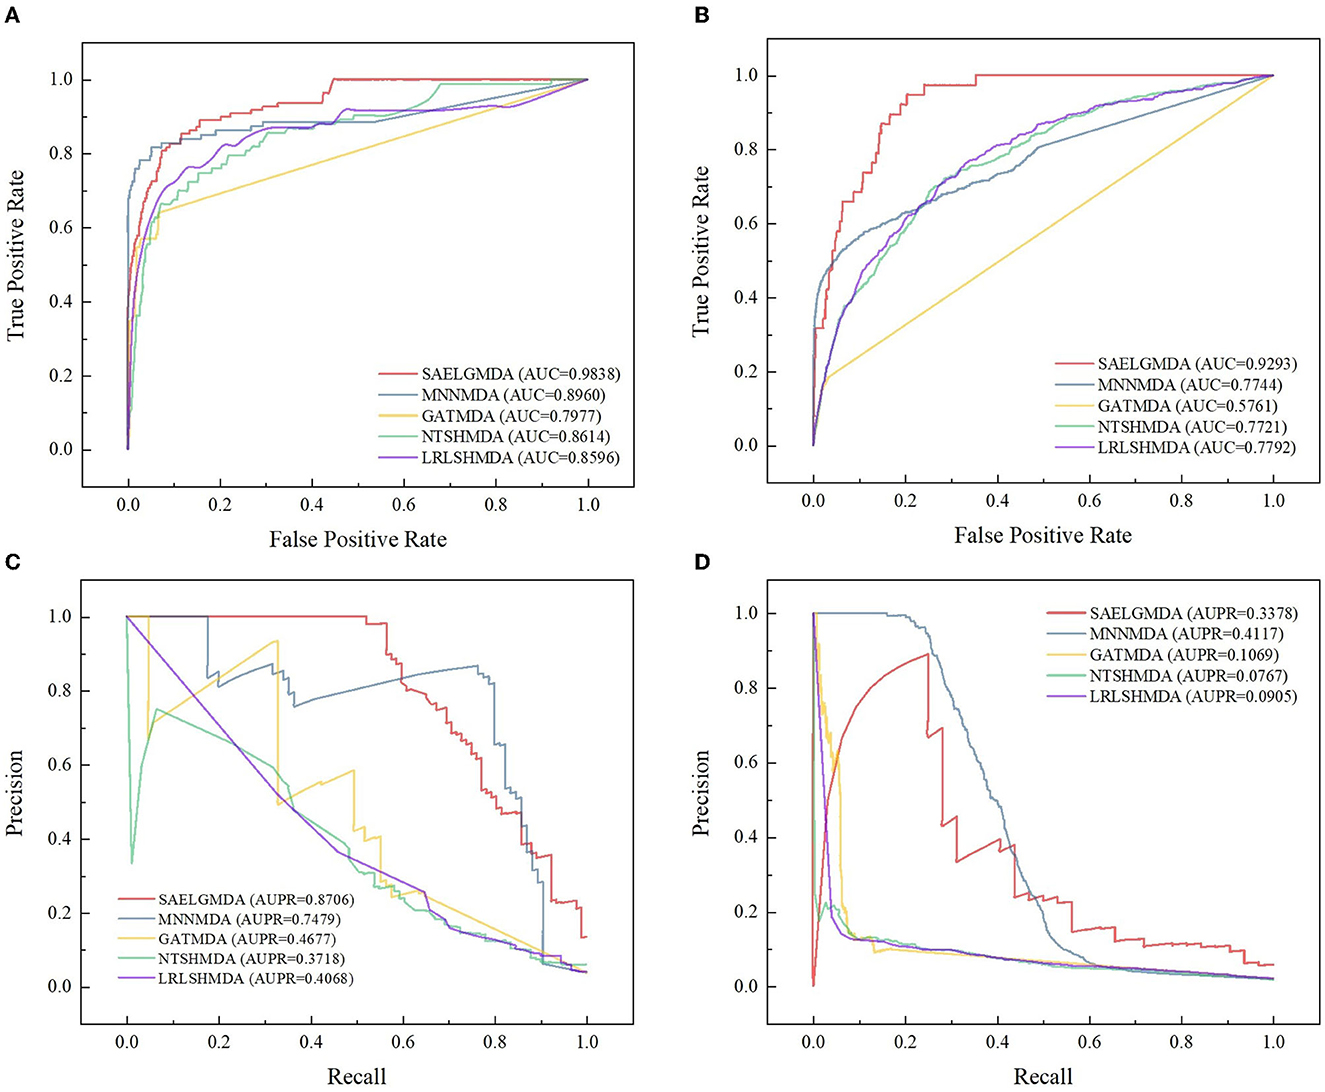
Figure 3. The ROC and the PR curves of five different methods under CV2 on the two databases. (A, B) Denote the ROC curves on the HMDAD and Disbiome databases, respectively. (C, D) Denote the PR curves on the HMDAD and Disbiome databases, respectively.
Table 3 shows the performance of SAELGMDA and the other four methods under CV3. The best performance in each column is described in boldface under CV3. The results from Table 3 suggest that SAELGMDA achieved the best accuracies, MCCs, and AUCs, significantly outperforming the other four MDA prediction methods under CV3. Moreover, the performance of all five methods under CV3 outperforms the ones under CV1 and CV2, demonstrating that more samples help improve the classification performance. Figure 4 shows the ROC and PR curves of the five methods under CV3.
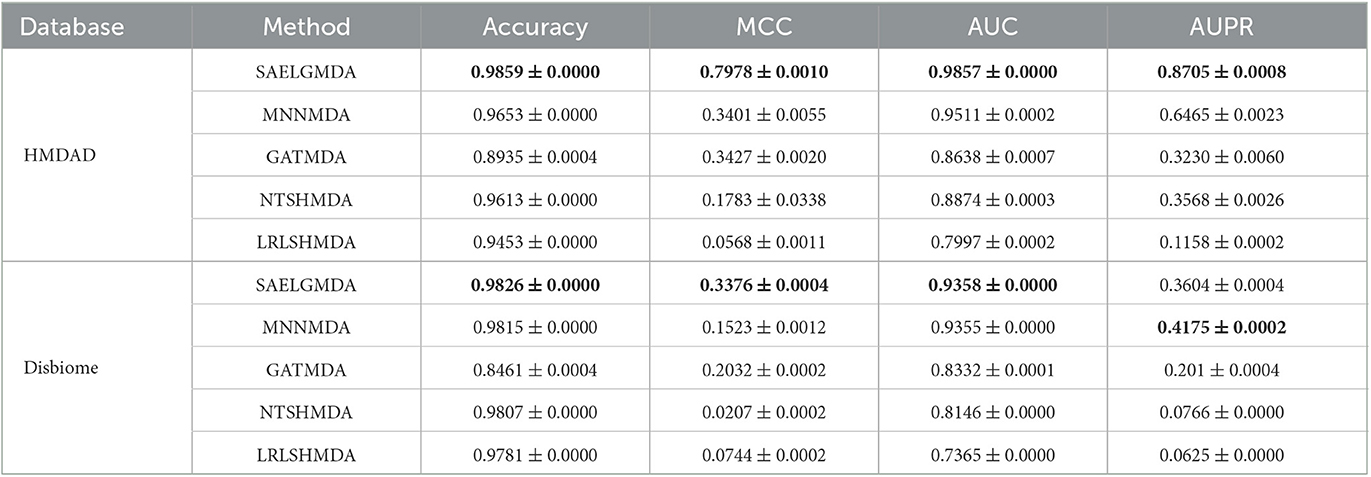
Table 3. The performance of five MDA identification methods under CV3.
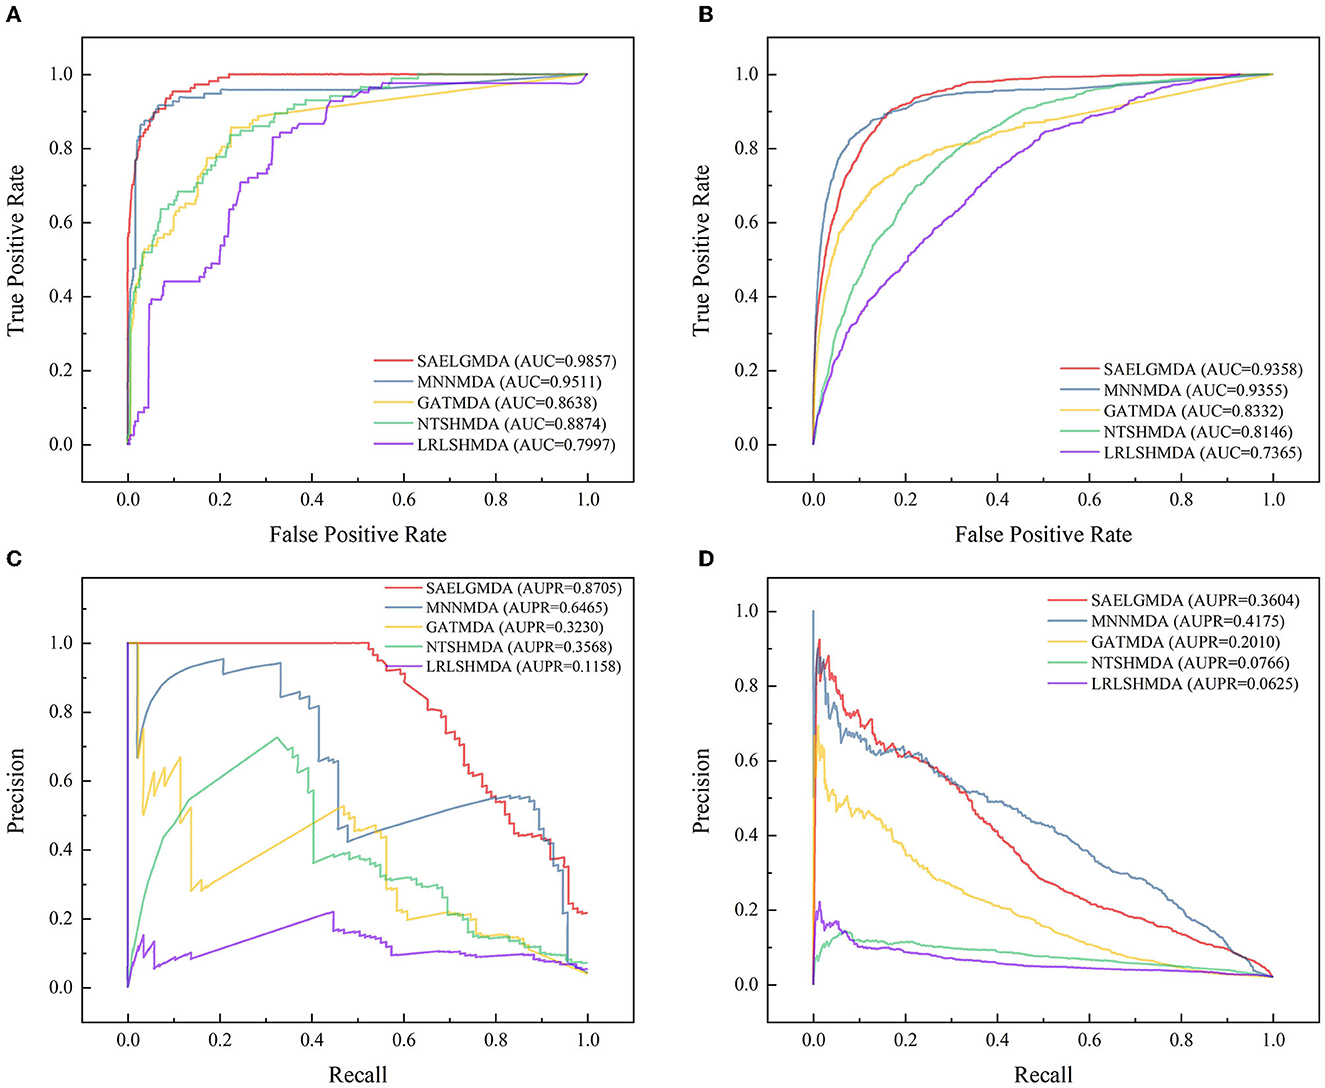
Figure 4. The ROC and the PR curves of five different methods under CV3 on the two databases. (A, B) Denote the ROC curves on the HMDAD and Disbiome databases, respectively. (C, D) Denote the PR curves on the HMDAD and Disbiome databases, respectively.
To measure the MDA classification performance of LightGBM, we compared it with two classical boosting algorithms, XGBoost and NGBoost. Extreme Gradient Boosting (XGBoost) is an ensemble learning method based on a gradient boost tree and can accurately cope with multicollinearity impact and complicated non-linearity interactions (Chen and Guestrin, 2016; Zhu and Zhu, 2019). Natural Gradient Boosting (NGBoost) uses natural gradients instead of regular gradients to implement flexible probabilistic forecast (Duan et al., 2020). Tables 4–6 show the accuracy, MCC, AUC, and AUPR of LightGBM, NGBoost, and XGBoost on the Disbiome and HMDAD datasets under three cross validations. The results from Tables 4–6 indicate that LightGBM obtained better performance on the majority of conditions and can be used to improve MDA classification ability.
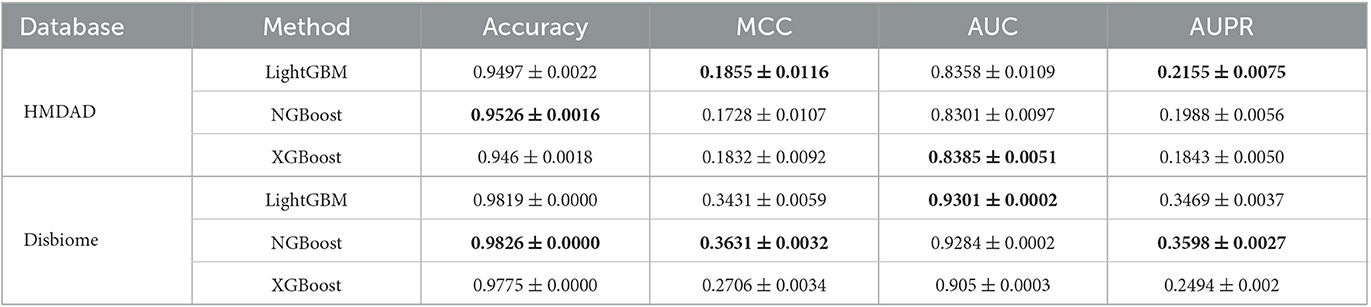
Table 4. The performance of three classification models under CV1.
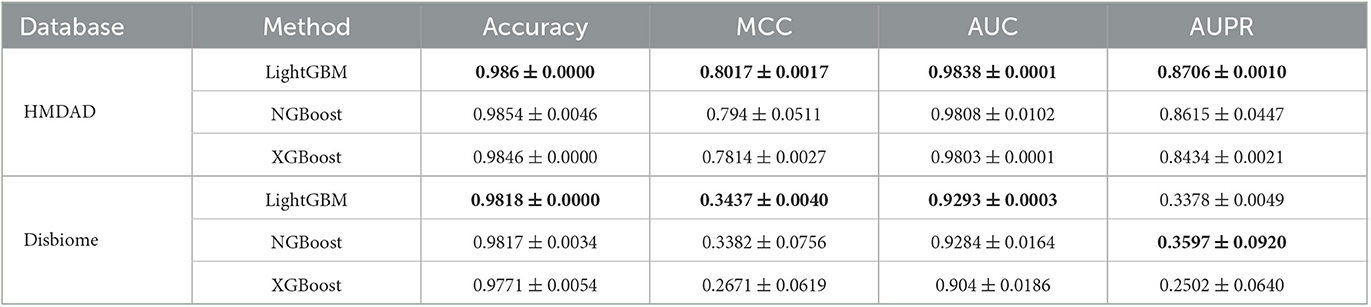
Table 5. The performance of three classification models under CV2.
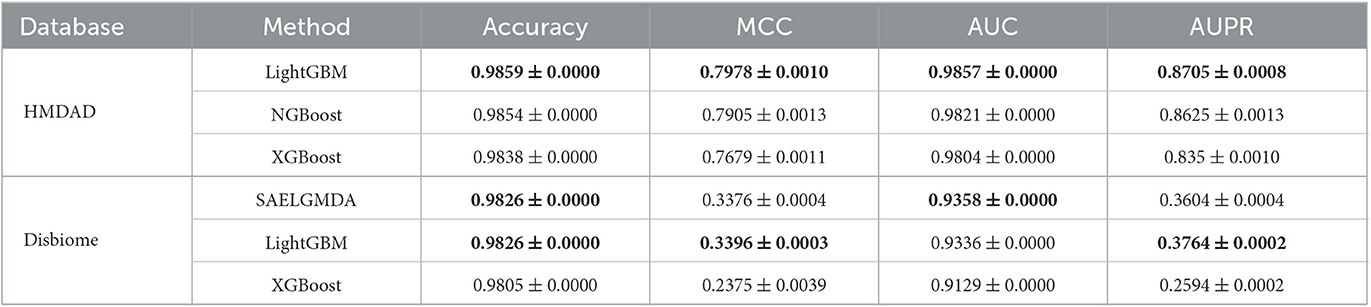
Table 6. The performance of three classification models under CV3.
We compared the computational time of SAELGMDA with the other four MDA prediction models, MNNMDA, GATMDA, NTSHMDA, and LRLSHMDA. The experiments were run on a machine with an AMD EPYC 7302 CPU, a GeForce RTX 2080 Ti, and 256GB RAM on Ubuntu 20.04.4 LTS operating system. Figure 5 shows computational time (m) of the five MDA prediction models on five-fold cross validation for one time on two MDA datasets. As shown in Figure 5, SAELGMDA is the most rapid method on the HMDAD dataset and the slowest one on the Disbiome dataset. SAELGMDA need only to spend 10.57 min, although it run slowly on the Disbiome database. In summary, SAELGMDA need not too much time on the two MDA datasets.
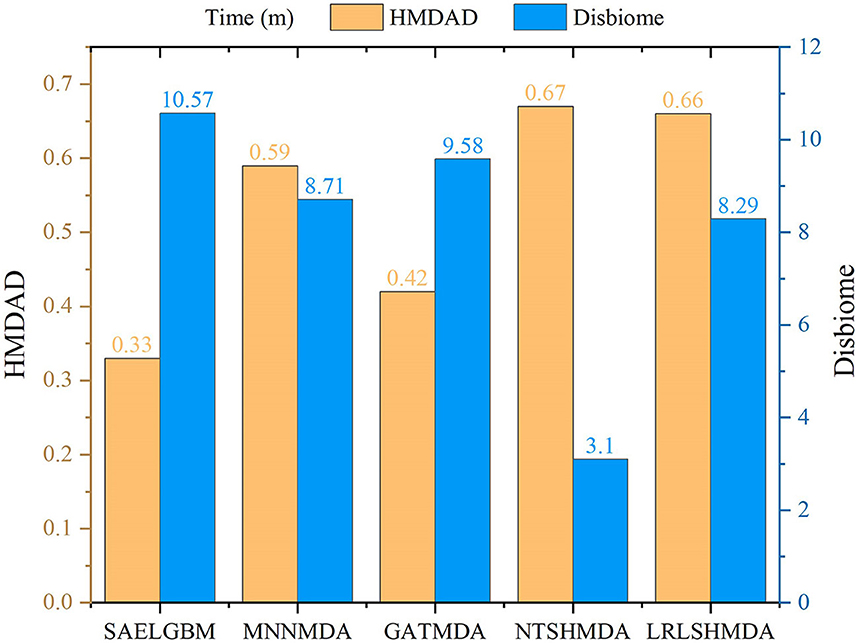
Figure 5. Computational time of five MDA methods.
In this section, we predicted potential MDAs on the two MDA databases. In addition, multiple evidence suggests that colorectal cancer, inflammatory bowel diseases, and lung cancer have dense linkages with microbes (Guarner and Malagelada, 2003; Müller and Macpherson, 2006; Zhang et al., 2015; Mármol et al., 2017; Chicco and Jurman, 2020). In this section, we aim to find possible microbes for the three diseases using the proposed SAELGMDA method. For the three diseases, microbes that are known to associate with them were removed. Next, we computed the association scores between them and all microbes. Third, the computed scores were sorted in descending order. Finally, the top 20 microbes with the highest association scores with them were listed and confirmed by the existing publications.
We further predicted new MDAs based on known MDAs using SAELGMDA. The predicted top 50 MDAs are shown in Figure 6. In Figure 6, sky blue solid lines and red dotted lines represent known and unknown MDAs obtained from SAELGMDA, respectively. Deep sky blue round rectangles represent microbes and green diamonds denote diseases.
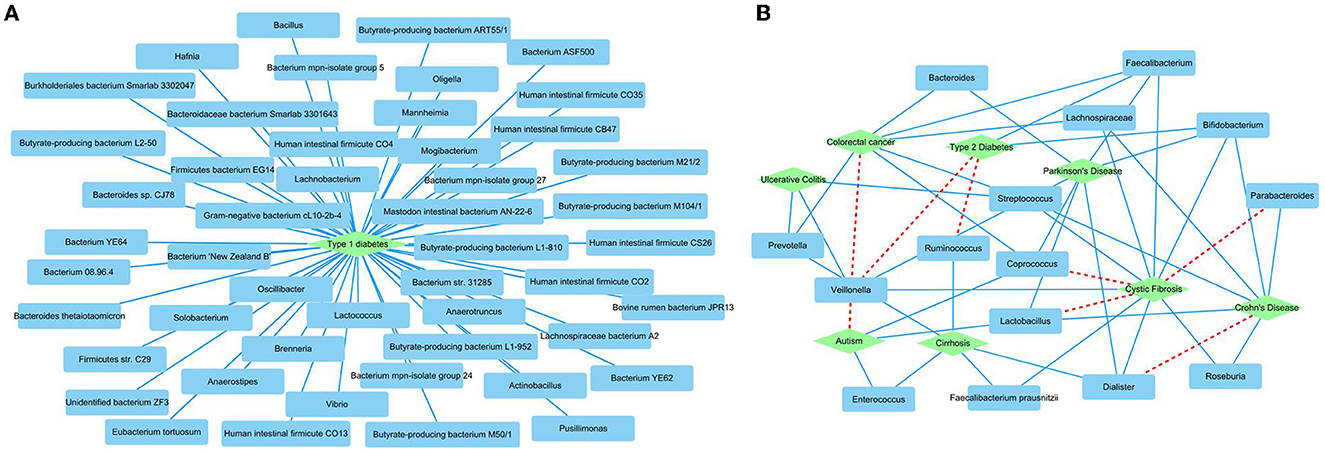
Figure 6. The predicted top 50 MDAs on the HMDAD (A) and Disbiome (B) databases.
On the HMDAD database, all predicted top 50 MDAs have been known to be associated with the database. SAELGMDA predicted that Actinobacteria and liver cirrhosis have the highest association probability with the ranking of 130 among all 11,388 microbe–disease pairs. Actinobacteria have been reported to associate with liver disease (Bull-Otterson et al., 2013). The expansion of Proteobacteria and Actinobacteria has a pathogenic effect on alcoholic liver disease (Bull-Otterson et al., 2013).
In the Disbiome database, SAELGMDA predicted that Veillonella may associate with autism with a ranking of three among all 229,336 microbe–disease pairs. Zhang et al. (2018) has reported that the abundance of Veillonella was severely decreased in stools of children suffering from autism spectrum disorder. The decreasing of its abundance has been also found in subjects involved in autism (Strati et al., 2017). Furthermore, the decreased Veillonella may affect the fermentation of lactate in the autism children (Gronow et al., 2010).
Colorectal cancer is the third most frequent cause of cancer mortality worldwide, severely threatening global life and health (Biller and Schrag, 2021; Saeed et al., 2021; Wong et al., 2023). There are more than 1.85 million colorectal cancer cases and 850,000 colorectal cancer-related deaths each year. In total, 20% of patients with colorectal cancer have metastasis cancer among new colorectal cancer diagnoses. It has been reported that ~70%–75% of patients survive more than 1 year, 30%–35% more than 3 years, and fewer than 20% more than 5 years among patients diagnosed with metastatic colorectal cancer. Although colonoscopy has been widely applied to the screen, its effect on colorectal cancer remains unclear (Bretthauer et al., 2022). Table 7 shows the top 20 microbes associated with colorectal cancer on the HMDAD database.
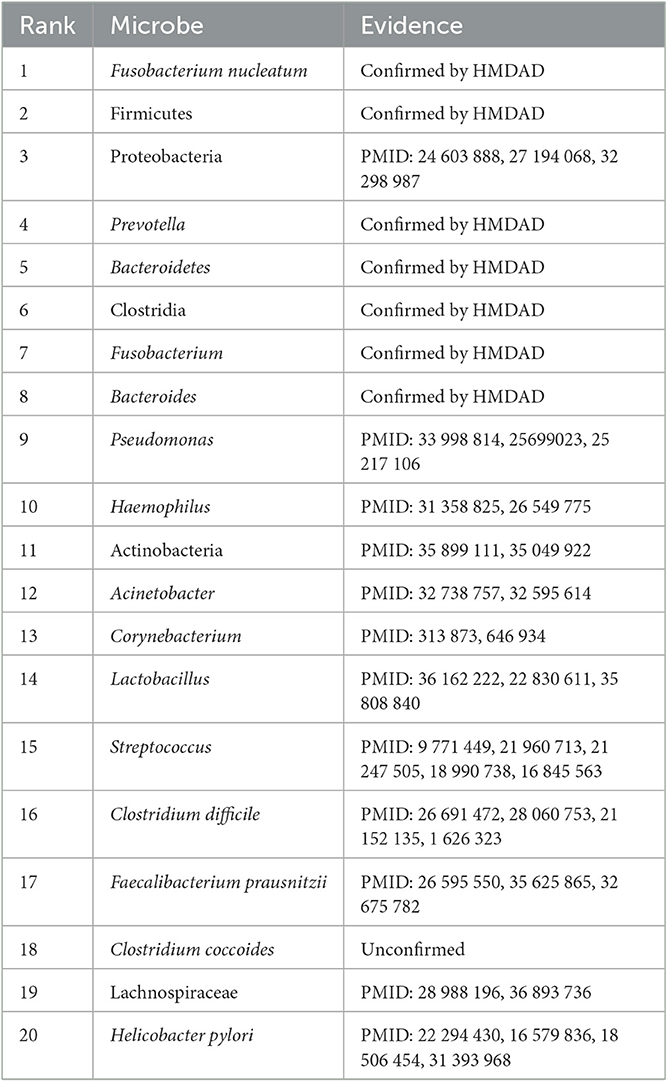
Table 7. The top 20 microbes related to colorectal cancer inferred by SAELGMDA on the HMDAD database.
For colorectal cancer, as shown in Table 7, 19 microbes have been confirmed to have associations with colorectal cancer by the existing literature on the top 20 inferred microbes on the HMDAD database. For example, pseudomonas is distinctly less abundant in cancer tissues than normal tissues and has been increasingly taken as an emerging clinic-related opportunistic pathogen (Decker and Palmore, 2014; Gao et al., 2015). Haemophilus parainfluenzae demonstrates higher representation in colorectal cancer subjects but is scarcely investigated in control subjects (Kasai et al., 2016). Research in 219 patients with colorectal cancer has suggested that clostridium difficile has a dense relationship with colorectal cancer (Yeom et al., 2010). Helicobacter pylori infection has been reported to be a potential risk increase factor of left-sided colorectal cancer (Zhang et al., 2012).
Moreover, we inferred that Clostridium coccoides has a possible association with colorectal cancer. Clostridium coccoides is taken as one of the most prevalent groups of bacteria in human intestines. They constitute ~60% of mucin-adhered microbiota and comprise different species with high oxygen-sensitive anaerobes (such as Clostridium, Coprococcus, Eubacterium, and Ruminococcus). They contribute to the prevention of colonization of vancomycin-resistant Enterococcus in an antibiotic-treated mouse model (Grenda et al., 2022). The association between Clostridium coccoides and colorectal cancer needs further validation.
Inflammatory bowel disease is one of the idiopathic inflammatory bowel disorders that severely affect the gastrointestinal tract. It has become a global, chronic, and life-threatening disease over the last few decades. Mak et al. (2020) predicted that patients with inflammatory bowel disease may be an exponential increase worldwide. It typically includes Crohn's disease and ulcerative colitis. It manifests progressive and unpredictable features and is partially caused by bacteria that activate patient's immune system to protect against foreign substances (Lomax et al., 2006; Kaplan and Windsor, 2021). It has a close relationship with microbes. Identification of associated microbes for the disease helps us better equip to stem its global rise in future. Table 8 lists the top 20 microbes associated with the disease on the HMDAD database.
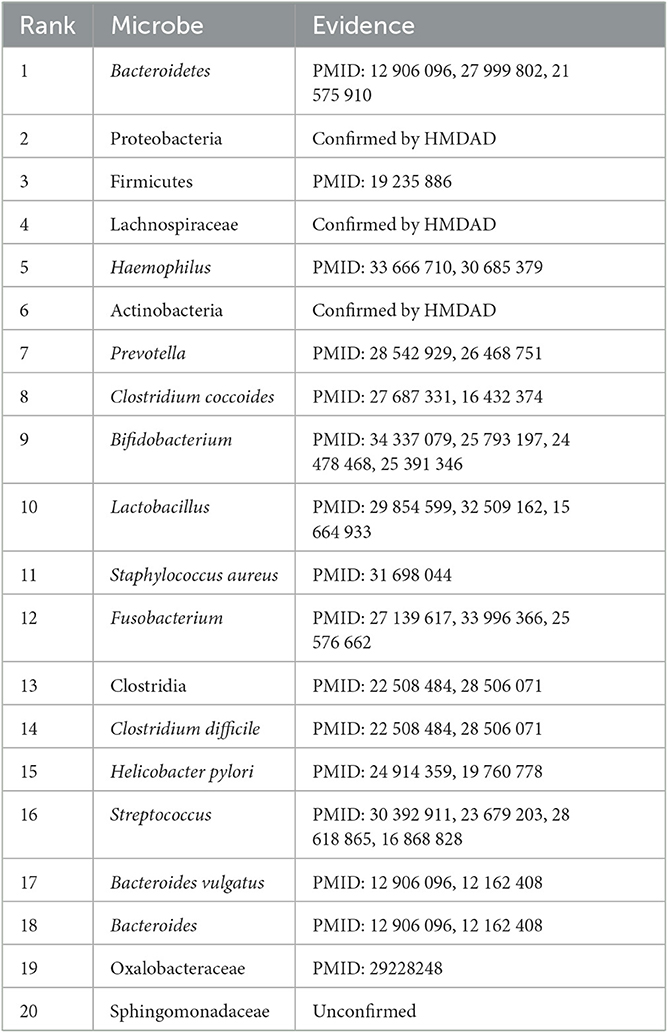
Table 8. The top 20 microbes related to inflammatory bowel disease inferred by SAELGMDA on the HMDAD database.
As shown in Table 8, 19 microbes have been validated to link to inflammatory bowel disorders by existing literature on the predicted top 20 microbes associated with it on the HMDAD database. Researchers reported that Firmicutes were less represented in patients suffered from inflammatory bowel disease than healthy subjects (Sokol et al., 2009). Streptococcus and Haemophilus were highly represented in patients with inflammatory bowel disease (Heidarian et al., 2019). Prevotella was reduced in pediatric Crohn's disease (Lewis et al., 2015). Clostridium coccoides was less abundant in patients with active inflammatory bowel disease than ones in remission (Prosberg et al., 2016).
In addition, we predicted that Sphingomonadaceae dense links to inflammatory bowel disease. Sphingomonadaceae family has high abundance in marine waters, freshwater, and even drinking water. They can degrade lignin-derived compounds and refractory organic matter that comprise monocyclic and polycyclic aromatic hydrocarbons (Shen S. et al., 2022). Sphingomonadaceae are significantly accommodated to bile salts through metabolic pathways (de Vries et al., 2019). In addition, Sphingomonadaceae has a high linkage with triclosan degradation in nitrification and denitrification systems (Dai et al., 2022). Microbial communities were adapted to Bisphenol A through the selection of Sphingomonadaceae populations including Sphingobium, Novosphingobium, and Sphingopyxis. The selected Sphingomonadaceae for Bisphenol A demonstrated higher Bisphenol A metabolic activity (Oh and Choi, 2019). The association between Sphingomonadaceae and inflammatory bowel disease needs further validation.
Lung cancer is one of the leading causes of cancer-related deaths worldwide. It accounts for ~18% of global cancer deaths (Sung et al., 2021). More than 350 patients died from lung cancer each day in the United States (Siegel et al., 2022). It has the highest incidence and mortality compared with other cancer types in China (Xia et al., 2022). We used the proposed SAELGMDA model to identify potential microbes for lung cancer. Table 9 lists the top 20 microbes associated with it on the Disbiome database. As shown in Table 9, all 20 top microbes have been confirmed to be associated with lung cancer by existing literatures or the Disbiome database. The results again validated the MDA prediction performance of SAELGMDA.
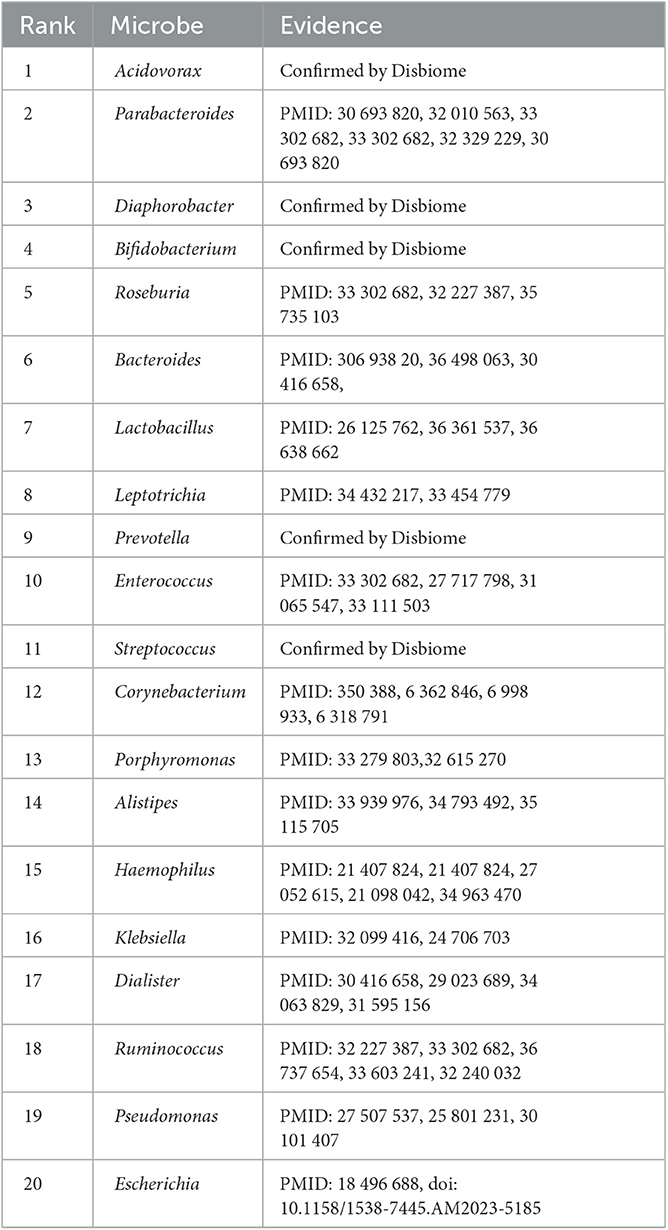
Table 9. The top 20 microbes associated with lung cancer identified by SAELGMDA on the Disbiome database.
Systematic identification of associations between microbes and diseases significantly contributes to the understanding of the complex pathogenic mechanism of various diseases (Takahashi et al., 2018; Zhou et al., 2018; Yang et al., 2022). In particular, computational pathogenic microorganism discovery helps to capture potential biomarkers from candidate compounds for human complex diseases (Barrows et al., 2016; Zhu et al., 2021).
Here, we developed a computational method called SAELGMDA to improve MDA prediction. First, microbe similarity and disease similarity were computed via their function similarity and GIPK similarity. Second, one microbe–disease pair was represented as a feature vector based on microbe similarity matrix and disease similarity matrix. Third, the obtained high-dimensional features were mapped to a low-dimensional space based on a sparse autoencoder. Finally, unknown microbe–disease pairs were classified using LightGBM.
Our proposed SAELGMDA method was compared with MNNMDA, GATMDA, LRLSHMDA, and NTSHMDA. Experimental results under CV1, CV2, and CV3 show that SAELGMDA outperforms the above four methods. SAELGMDA obtains the superior MDA identification ability. To investigate the MDA classification performance of LightGBM, we further compared it with XGBoost and NGBoost. The results demonstrate that LightGBM obtained better accuracy. Case studies demonstrate that there are possible associations between Clostridium coccoides and colorectal cancer, between Sphingomonadaceae and inflammatory bowel disease, and between Veillonella and autism and needs further validation.
We used two MDA databases (Disbiome and HMDAD) to investigate the performance of our proposed SAELGMDA method. The HMDAD dataset is a small dataset and Disbiome is a larger dataset. Under CV1, the performance of SAELGMDA, GATMDA, and LRLSHMDA on the Disbiome dataset outperforms the ones on the HMDAD dataset, demonstrating more data contribute to the performance improvement for the three methods under CV1. Under CV2 and CV3, all five methods computed higher accuracy and AUC on the two datasets. However, MCC and AUPR computed by these five methods significantly decreased the Disbiome dataset compared with the HMDAD dataset. It may be caused by data imbalance; that is, the generalization ability of SAELGMDA is good when identifying potential associated microbes for a query disease. However, its generalization ability needs further improvement under CV2 and CV3.
Although SAELGMDA outperformed the other four methods under the majority of condition on the HMDAD and Disbiome databases, the performance of all five MDA prediction methods, especially MCC and AUPR, remains an improvement. In future, we will integrate more biological data, such as microbe–drug associations and disease–gene associations, to extract effective features for microbe–disease pairs. Furthermore, we will explore new dimensional reduction algorithms and classification models to improve MDA prediction by combining deep learning.
The original contributions presented in the study are included in the article/supplementary material, further inquiries can be directed to the corresponding authors.
FW and HY: conceptualization and validation. LP: funding acquisition. YW, LP, and XL: project administration. FW: writing—original draft and software. HY, LP, and XL: writing—reviewing and editing and investigation. FW and LP: methodology. All authors contributed to the article and approved the submitted version.
LP was supported by the National Natural Science Foundation of China under Grant No. 61803151.
We would like to thank all authors of the cited references.
YW was employed by Geneis (Beijing) Co., Ltd., Beijing, China.
The remaining authors declare that the research was conducted in the absence of any commercial or financial relationships that could be construed as a potential conflict of interest.
All claims expressed in this article are solely those of the authors and do not necessarily represent those of their affiliated organizations, or those of the publisher, the editors and the reviewers. Any product that may be evaluated in this article, or claim that may be made by its manufacturer, is not guaranteed or endorsed by the publisher.
Barrows, N. J., Campos, R. K., Powell, S. T., Prasanth, K. R., Schott-Lerner, G., Soto-Acosta, R., et al. (2016). A screen of FDA-approved drugs for inhibitors of Zika virus infection. Cell Host Microbe 20, 259–270. doi: 10.1016/j.chom.2016.07.004
Biller, L. H., and Schrag, D. (2021). Diagnosis and treatment of metastatic colorectal cancer: a review. JAMA 325, 669–685. doi: 10.1001/jama.2021.0106
Bretthauer, M., Løberg, M., Wieszczy, P., Kalager, M., Emilsson, L., Garborg, K., et al. (2022). Effect of colonoscopy screening on risks of colorectal cancer and related death. N. Engl. J. Med. 387, 1547–1556. doi: 10.1056/NEJMoa2208375
Bull-Otterson, L., Feng, W., Kirpich, I., Wang, Y., Qin, X., Liu, Y., et al. (2013). Metagenomic analyses of alcohol induced pathogenic alterations in the intestinal microbiome and the effect of lactobacillus rhamnosus gg treatment. PLoS ONE 8, e53028. doi: 10.1371/journal.pone.0053028
Chen, T., and Guestrin, C. (2016). “Xgboost: a scalable tree boosting system,” in Proceedings of the 22nd ACM SIGKDD International Conference on Knowledge Discovery and Data Mining (New York, NY: Association for Computing Machinery), 785–794. doi: 10.1145/2939672.2939785
Chen, X., Li, T.-H., Zhao, Y., Wang, C.-C., and Zhu, C.-C. (2021). Deep-belief network for predicting potential mirna-disease associations. Brief. Bioinformatics 22, bbaa186. doi: 10.1093/bib/bbaa186
Chen, X., Xie, D., Zhao, Q., and You, Z.-H. (2019). Micrornas and complex diseases: from experimental results to computational models. Brief. Bioinformatics 20, 515–539. doi: 10.1093/bib/bbx130
Chen, Y., and Lei, X. (2022). Metapath aggregated graph neural network and tripartite heterogeneous networks for microbe-disease prediction. Front. Microbiol. 13, 919380. doi: 10.3389/fmicb.2022.919380
Cheng, E., Zhao, J., Wang, H., Song, S., Xiong, S., Sun, Y., et al. (2022). “Dual network contrastive learning for predicting microbe-disease associations,” in IEEE/ACM Transactions on Computational Biology and Bioinformatics (New Jersey, NJ: IEEE). doi: 10.1109/TCBB.2022.3228617
Cheng, L., Qi, C., Zhuang, H., Fu, T., and Zhang, X. (2020). gutmdisorder: a comprehensive database for dysbiosis of the gut microbiota in disorders and interventions. Nucleic Acids Res. 48, D554–D560. doi: 10.1093/nar/gkz843
Chicco, D., and Jurman, G. (2020). The advantages of the Matthews correlation coefficient (MCC) over f1 score and accuracy in binary classification evaluation. BMC Genom. 21, 1–13. doi: 10.1186/s12864-019-6413-7
Dai, H., Gao, J., Li, D., Wang, Z., Cui, Y., Zhao, Y., et al. (2022). Family sphingomonadaceae as the key executor of triclosan degradation in both nitrification and denitrification systems. Chem. Eng. J. 442, 1362021. doi: 10.1016/j.cej.2022.136202
de Vries, H. J., Beyer, F., Jarzembowska, M., Lipińska, J., van den Brink, P., Zwijnenburg, A., et al. (2019). Isolation and characterization of sphingomonadaceae from fouled membranes. NPJ Biofilms Microbiomes 5, 6. doi: 10.1038/s41522-018-0074-1
Decker, B. K., and Palmore, T. N. (2014). Hospital water and opportunities for infection prevention. Curr. Infect. Dis. Rep. 16, 1–8. doi: 10.1007/s11908-014-0432-y
Demirci, M., Tokman, H., Uysal, H., Demiryas, S., Karakullukcu, A., Saribas, S., et al. (2019). Reduced Akkermansia muciniphila and Faecalibacterium prausnitzii levels in the gut microbiota of children with allergic asthma. Allergol. Immunopathol. 47, 365–371. doi: 10.1016/j.aller.2018.12.009
Duan, T., Anand, A., Ding, D. Y., Thai, K. K., Basu, S., Ng, A., et al. (2020). “Ngboost: natural gradient boosting for probabilistic prediction,” in International Conference on Machine Learning (Vienna: The International Machine Learning Society), 2690–2700. PMLR.
El Mouzan, M. I., Winter, H. S., Assiri, A. A., Korolev, K. S., Al Sarkhy, A. A., Dowd, S. E., et al. (2018). Microbiota profile in new-onset pediatric crohn's disease: data from a non-western population. Gut Pathog. 10, 1–10. doi: 10.1186/s13099-018-0276-3
Gao, Z., Guo, B., Gao, R., Zhu, Q., and Qin, H. (2015). Microbiota disbiosis is associated with colorectal cancer. Front. Microbiol. 6, 20. doi: 10.3389/fmicb.2015.00020
Grenda, T., Grenda, A., Domaradzki, P., Krawczyk, P., and Kwiatek, K. (2022). Probiotic potential of Clostridium spp.—advantages and doubts. Curr. Issues Mol. Biol. 44, 3118–3130. doi: 10.3390/cimb44070215
Gronow, S., Welnitz, S., Lapidus, A., Nolan, M., Ivanova, N., Glavina Del Rio, T., et al. (2010). Complete genome sequence of Veillonella parvula type strain (te3t). Stand. Genomic Sci., 2, 57–65. doi: 10.4056/sigs.521107
Guarner, F., and Malagelada, J.-R. (2003). Gut flora in health and disease. Lancet 361, 512–519. doi: 10.1016/S0140-6736(03)12489-0
Guo, S.-S., Liu, J., Zhou, X.-G., and Zhang, G.-J. (2022). Deepumqa: ultrafast shape recognition-based protein model quality assessment using deep learning. Bioinformatics 38, 1895–1903. doi: 10.1093/bioinformatics/btac056
He, B.-S., Peng, L.-H., and Li, Z. (2018). Human microbe-disease association prediction with graph regularized non-negative matrix factorization. Front. Microbiol. 9, 2560. doi: 10.3389/fmicb.2018.02560
Heidarian, F., Alebouyeh, M., Shahrokh, S., Balaii, H., and Zali, M. R. (2019). Altered fecal bacterial composition correlates with disease activity in inflammatory bowel disease and the extent of il8 induction. Curr. Res. Transl. Med. 67, 41–50. doi: 10.1016/j.retram.2019.01.002
Hu, H., Feng, Z., Lin, H., Cheng, J., Lyu, J., Zhang, Y., et al. (2023). Gene function and cell surface protein association analysis based on single-cell multiomics data. Comput. Biol. Med., 157, 106733. doi: 10.1016/j.compbiomed.2023.106733
Hua, M., Yu, S., Liu, T., Yang, X., and Wang, H. (2022). MVGCNMDA: multi-view graph augmentation convolutional network for uncovering disease-related microbes. Interdiscip. Sci. Comput. Life Sci. 14, 669–682. doi: 10.1007/s12539-022-00514-2
Hwang, S., Kim, C. Y., Yang, S., Kim, E., Hart, T., Marcotte, E. M., et al. (2019). Humannet v2: human gene networks for disease research. Nucleic Acids Res. 47, D573–D580. doi: 10.1093/nar/gky1126
Janssens, Y., Nielandt, J., Bronselaer, A., Debunne, N., Verbeke, F., Wynendaele, E., et al. (2018). Disbiome database: linking the microbiome to disease. BMC Microbiol. 18, 1–6. doi: 10.1186/s12866-018-1197-5
Jiang, C., Tang, M., Jin, S., Huang, W., and Liu, X. (2022). Kgnmda: a knowledge graph neural network method for predicting microbe-disease associations. IEEE/ACM Trans. Comput. Biol. Bioinform. 20, 1147–1155. doi: 10.1109/TCBB.2022.3184362
Kamneva, O. K. (2017). Genome composition and phylogeny of microbes predict their co-occurrence in the environment. PLoS Comput. Biol. 13, e1005366. doi: 10.1371/journal.pcbi.1005366
Kaplan, G. G., and Windsor, J. W. (2021). The four epidemiological stages in the global evolution of inflammatory bowel disease. Nat. Rev. Gastroenterol. Hepatol. 18, 56–66. doi: 10.1038/s41575-020-00360-x
Kasai, C., Sugimoto, K., Moritani, I., Tanaka, J., Oya, Y., Inoue, H., et al. (2016). Comparison of human gut microbiota in control subjects and patients with colorectal carcinoma in adenoma: terminal restriction fragment length polymorphism and next-generation sequencing analyses. Oncol. Rep. 35, 325–333. doi: 10.3892/or.2015.4398
Ke, G., Meng, Q., Finley, T., Wang, T., Chen, W., Ma, W., et al. (2017). “LightGBM: a highly efficient gradient boosting decision tree,” in Advances in Neural Information Processing Systems, Vol. 30 (Long Beach, CA: MIT Press), 1–9.
Kingma, D. P., and Ba, J. (2014). ADAM: a method for stochastic optimization. arXiv [preprint]. doi: 10.48550/arXiv.1412.6980
Lewis, J. D., Chen, E. Z., Baldassano, R. N., Otley, A. R., Griffiths, A. M., Lee, D., et al. (2015). Inflammation, antibiotics, and diet as environmental stressors of the gut microbiome in pediatric crohn's disease. Cell Host Microbe 18, 489–500. doi: 10.1016/j.chom.2015.09.008
Li, S., Xie, M., and Liu, X. (2019). A novel approach based on bipartite network recommendation and katz model to predict potential micro-disease associations. Front. Genet. 10, 1147. doi: 10.3389/fgene.2019.01147
Li, T.-H., Wang, C.-C., Zhang, L., and Chen, X. (2023). Snrmpacdc: computational model focused on siamese network and random matrix projection for anticancer synergistic drug combination prediction. Brief. Bioinformatics 24, bbac503. doi: 10.1093/bib/bbac503
Liang, Y., Zhang, Z.-Q., Liu, N.-N., Wu, Y.-N., Gu, C.-L., Wang, Y.-L., et al. (2022). Magcnse: predicting lncrna-disease associations using multi-view attention graph convolutional network and stacking ensemble model. BMC Bioinformatics 23, 1–22. doi: 10.1186/s12859-022-04715-w
Lihong, P., Wang, C., Tian, X., Zhou, L., and Li, K. (2021). Finding lncRNA-protein interactions based on deep learning with dual-net neural architecture. IEEE/ACM Trans. Comput. Biol. Bioinform. 19, 3456–3468. doi: 10.1109/TCBB.2021.3116232
Liu, D., Liu, J., Luo, Y., He, Q., and Deng, L. (2021). MGATMDA: predicting microbe-disease associations via multi-component graph attention network. IEEE/ACM Trans. Comput. Biol. Bioinformatics 19, 3578–3585. doi: 10.1109/TCBB.2021.3116318
Liu, H., Bing, P., Zhang, M., Tian, G., Ma, J., Li, H., et al. (2023). MNNMDA: predicting human microbe-disease association via a method to minimize matrix nuclear norm. Comput Struct. Biotechnol. J. 21, 1414–1423. doi: 10.1016/j.csbj.2022.12.053
Liu, J., Zhao, K., and Zhang, G. (2023). Improved model quality assessment using sequence and structural information by enhanced deep neural networks. Brief. Bioinformatics 24, bbac507. doi: 10.1093/bib/bbac507
Liu, Y., Wang, S.-L., Zhang, J.-F., Zhang, W., Zhou, S., Li, W., et al. (2020). DMFMDA: prediction of microbe-disease associations based on deep matrix factorization using bayesian personalized ranking. IEEE/ACM Trans. Comput. Biol. Bioinformatics 18, 1763–1772. doi: 10.1109/TCBB.2020.3018138
Lomax, A. E., Linden, D. R., Mawe, G. M., and Sharkey, K. A. (2006). Effects of gastrointestinal inflammation on enteroendocrine cells and enteric neural reflex circuits. Auton. Neurosci 126, 250–257. doi: 10.1016/j.autneu.2006.02.015
Long, Y., and Luo, J. (2019). Wmghmda: a novel weighted meta-graph-based model for predicting human microbe-disease association on heterogeneous information network. BMC Bioinformatics 20, 1–18. doi: 10.1186/s12859-019-3066-0
Long, Y., Luo, J., Zhang, Y., and Xia, Y. (2021). Predicting human microbe-disease associations via graph attention networks with inductive matrix completion. Brief. Bioinformatics 22, bbaa146. doi: 10.1093/bib/bbaa146
Luo, J., and Long, Y. (2018). NTSHMDA: prediction of human microbe-disease association based on random walk by integrating network topological similarity. IEEE/ACM Trans. Comput. Biol. Bioinformatics 17, 1341–1351. doi: 10.1109/TCBB.2018.2883041
Lynch, S. V., and Pedersen, O. (2016). The human intestinal microbiome in health and disease. N. Engl. J. Med. 375, 2369–2379. doi: 10.1056/NEJMra1600266
Ma, W., Zhang, L., Zeng, P., Huang, C., Li, J., Geng, B., et al. (2017). An analysis of human microbe-disease associations. Brief. Bioinformatics 18, 85–97. doi: 10.1093/bib/bbw005
Mak, W. Y., Zhao, M., Ng, S. C., and Burisch, J. (2020). The epidemiology of inflammatory bowel disease: east meets west. J. Gastroenterol. Hepatol. 35, 380–389. doi: 10.1111/jgh.14872
Makhzani, A., and Frey, B. (2013). K-sparse autoencoders. arXiv. [preprint]. doi: 10.48550/arXiv.1312.5663
Mármol, I., Sánchez-de Diego, C., Pradilla Dieste, A., Cerrada, E., and Rodriguez Yoldi, M. J. (2017). Colorectal carcinoma: a general overview and future perspectives in colorectal cancer. Int. J. Mol. Sci. 18, 197. doi: 10.3390/ijms18010197
Müller, C., and Macpherson, A. (2006). Layers of mutualism with commensal bacteria protect us from intestinal inflammation. Gut 55, 276–284. doi: 10.1136/gut.2004.054098
Oh, S., and Choi, D. (2019). Microbial community enhances biodegradation of bisphenol a through selection of sphingomonadaceae. Microb. Ecol. 77, 631–639. doi: 10.1007/s00248-018-1263-4
Peng, L., Shen, L., Liao, L., Liu, G., and Zhou, L. (2020). RNMFMDA: a microbe-disease association identification method based on reliable negative sample selection and logistic matrix factorization with neighborhood regularization. Front. Microbiol. 11, 592430. doi: 10.3389/fmicb.2020.592430
Peng, L., Wang, C., Tian, G., Liu, G., Li, G., Lu, Y., et al. (2022a). Analysis of CT scan images for covid-19 pneumonia based on a deep ensemble framework with densenet, swin transformer, and regnet. Front. Microbiol. 13, 993523. doi: 10.3389/fmicb.2022.995323
Peng, L., Wang, F., Wang, Z., Tan, J., Huang, L., Tian, X., et al. (2022b). Cell-cell communication inference and analysis in the tumour microenvironments from single-cell transcriptomics: data resources and computational strategies. Brief. Bioinformatics 23, bbac234. doi: 10.1093/bib/bbac234
Prosberg, M., Bendtsen, F., Vind, I., Petersen, A. M., and Gluud, L. L. (2016). The association between the gut microbiota and the inflammatory bowel disease activity: a systematic review and meta-analysis. Scand. J. Gastroenterol. 51, 1407–1415. doi: 10.1080/00365521.2016.1216587
Saeed, M., Shoaib, A., Kandimalla, R., Javed, S., Almatroudi, A., Gupta, R., et al. (2021). Microbe-based therapies for colorectal cancer: advantages and limitations. Semin. Cancer Biol. 86(Pt 3), 652–665. doi: 10.1016/j.semcancer.2021.05.018
Shen, L., Liu, F., Huang, L., Liu, G., Zhou, L., Peng, L., et al. (2022). VDA-RWLRLS: an anti-sars-cov-2 drug prioritizing framework combining an unbalanced bi-random walk and laplacian regularized least squares. Comput. Biol. Med. 140, 105119. doi: 10.1016/j.compbiomed.2021.105119
Shen, S., Anazawa, T., Matsuda, T., and Shimizu, Y. (2022). Draft genome sequences of Sphingomonadaceae strains isolated from a freshwater lake. Microbiol. Resour. Announc. 11, e00070-22. doi: 10.1128/mra.00070-22
Shi, J.-Y., Huang, H., Zhang, Y.-N., Cao, J.-B., and Yiu, S.-M. (2018). Bmcmda: a novel model for predicting human microbe-disease associations via binary matrix completion. BMC Bioinformatics 19, 85–92. doi: 10.1186/s12859-018-2274-3
Siegel, R. L., Miller, K. D., Fuchs, H. E., and Jemal, A. (2022). Cancer statistics, 2022. CA Cancer J. Clin. 72, 7–33. doi: 10.3322/caac.21708
Sokol, H., Seksik, P., Furet, J., Firmesse, O., Nion-Larmurier, I., Beaugerie, L., et al. (2009). Low counts of faecalibacterium prausnitzii in colitis microbiota. Inflamm. Bowel Dis. 15, 1183–1189. doi: 10.1002/ibd.20903
Strati, F., Cavalieri, D., Albanese, D., De Felice, C., Donati, C., Hayek, J., et al. (2017). New evidences on the altered gut microbiota in autism spectrum disorders. Microbiome 5, 1–11. doi: 10.1186/s40168-017-0242-1
Sun, F., Sun, J., and Zhao, Q. (2022). A deep learning method for predicting metabolite-disease associations via graph neural network. Brief. Bioinformatics 23, bbac266. doi: 10.1093/bib/bbac266
Sung, H., Ferlay, J., Siegel, R. L., Laversanne, M., Soerjomataram, I., Jemal, A., et al. (2021). Global cancer statistics 2020: globocan estimates of incidence and mortality worldwide for 36 cancers in 185 countries. CA Cancer J. Clin. 71, 209–249. doi: 10.3322/caac.21660
Takahashi, M. K., Tan, X., Dy, A. J., Braff, D., Akana, R. T., Furuta, Y., et al. (2018). A low-cost paper-based synthetic biology platform for analyzing gut microbiota and host biomarkers. Nat. Commun. 9, 3347. doi: 10.1038/s41467-018-05864-4
Tian, G., Wang, Z., Wang, C., Chen, J., Liu, G., Xu, H., et al. (2022). A deep ensemble learning-based automated detection of covid-19 using lung CT images and vision transformer and convnext. Front. Microbiol. 13, 1024104. doi: 10.3389/fmicb.2022.1024104
Van Laarhoven, T., Nabuurs, S. B., and Marchiori, E. (2011). Gaussian interaction profile kernels for predicting drug-target interaction. Bioinformatics 27, 3036–3043. doi: 10.1093/bioinformatics/btr500
Wang, F., Huang, Z.-A., Chen, X., Zhu, Z., Wen, Z., Zhao, J., et al. (2017). LRLSHMDA: Laplacian regularized least squares for human microbe-disease association prediction. Sci. Rep. 7, 7601. doi: 10.1038/s41598-017-08127-2
Wang, T., Sun, J., and Zhao, Q. (2023). Investigating cardiotoxicity related with hERG channel blockers using molecular fingerprints and graph attention mechanism. Comput. Biol. Med. 153, 106464. doi: 10.1016/j.compbiomed.2022.106464
Wang, W., Zhang, L., Sun, J., Zhao, Q., and Shuai, J. (2022). Predicting the potential human lncrna-mirna interactions based on graph convolution network with conditional random field. Brief. Bioinformatics 23, bbac463. doi: 10.1093/bib/bbac463
Wang, Y., Lei, X., and Pan, Y. (2023). Microbe-disease association prediction using rgcn through microbe-drug-disease network. IEEE/ACM Trans. Comput. Biol. Bioinformatics. 1, 1–10. doi: 10.1109/TCBB.2023.3247035
Wei, H., and Liu, B. (2020). ICIRCDA-MF: identification of circrna-disease associations based on matrix factorization. Brief. Bioinformatics 21, 1356–1367. doi: 10.1093/bib/bbz057
Wong, A. H., Ma, B., and Lui, R. N. (2023). New developments in targeted therapy for metastatic colorectal cancer. Ther. Adv. Med. Oncol. 15, 17588359221148540. doi: 10.1177/17588359221148540
Wu, C., Gao, R., Zhang, D., Han, S., and Zhang, Y. (2018). Prwhmda: human microbe-disease association prediction by random walk on the heterogeneous network with pso. Int. J. Biol. Sci. 14, 849. doi: 10.7150/ijbs.24539
Xia, C., Dong, X., Li, H., Cao, M., Sun, D., He, S., et al. (2022). Cancer statistics in china and united states, 2022: profiles, trends, and determinants. Chin. Med. J. 135, 584–590. doi: 10.1097/CM9.0000000000002108
Xu, J., and Li, Y. (2006). Discovering disease-genes by topological features in human protein-protein interaction network. Bioinformatics 22, 2800–2805. doi: 10.1093/bioinformatics/btl467
Xu, J., Xu, J., Meng, Y., Lu, C., Cai, L., Zeng, X., et al. (2023). Graph embedding and gaussian mixture variational autoencoder network for end-to-end analysis of single-cell RNA sequencing data. Cell Rep. Methods 3, 100382. doi: 10.1016/j.crmeth.2022.100382
Yan, C., Duan, G., Wu, F.-X., Pan, Y., and Wang, J. (2019). BRWMDA: predicting microbe-disease associations based on similarities and bi-random walk on disease and microbe networks. IEEE/ACM Trans. Comput. Biol. Bioinformatics 17, 1595–1604. doi: 10.1109/TCBB.2019.2907626
Yang, M., Yang, H., Ji, L., Hu, X., Tian, G., Wang, B., et al. (2022). A multi-omics machine learning framework in predicting the survival of colorectal cancer patients. Comput. Biol. Med. 146, 105516. doi: 10.1016/j.compbiomed.2022.105516
Ye, J., Chow, J.-H., Chen, J., and Zheng, Z. (2009). “Stochastic gradient boosted distributed decision trees,” in Proceedings of the 18th ACM Conference on Information and Knowledge Management (Hong Kong), 2061–2064. doi: 10.1145/1645953.1646301
Yeom, C. H., Cho, M. M., Baek, S. K., Bae, O. S., et al. (2010). Risk factors for the development of Clostridium difficile associated colitis after colorectal cancer surgery. J. Korean Soc. Coloproctol. 26, 329–333. doi: 10.3393/jksc.2010.26.5.329
Zhang, L., Wang, C.-C., and Chen, X. (2022). Predicting drug-target binding affinity through molecule representation block based on multi-head attention and skip connection. Brief. Bioinformatics 23, bbac468. doi: 10.1093/bib/bbac468
Zhang, M., Ma, W., Zhang, J., He, Y., and Wang, J. (2018). Analysis of gut microbiota profiles and microbe-disease associations in children with autism spectrum disorders in china. Sci. Rep. 8, 13981. doi: 10.1038/s41598-018-32219-2
Zhang, W., Chen, Y., Liu, F., Luo, F., Tian, G., Li, X., et al. (2017). Predicting potential drug-drug interactions by integrating chemical, biological, phenotypic and network data. BMC Bioinformatics 18, 1–12. doi: 10.1186/s12859-016-1415-9
Zhang, Y., Hoffmeister, M., Weck, M. N., Chang-Claude, J., and Brenner, H. (2012). Helicobacter pylori infection and colorectal cancer risk: evidence from a large population-based case-control study in germany. Am. J. Epidemiol. 175, 441–450. doi: 10.1093/aje/kwr331
Zhang, Y.-J., Li, S., Gan, R.-Y., Zhou, T., Xu, D.-P., Li, H.-B., et al. (2015). Impacts of gut bacteria on human health and diseases. Int. J. Mol. Sci. 16, 7493–7519. doi: 10.3390/ijms16047493
Zhang, Z., Xu, J., Wu, Y., Liu, N., Wang, Y., Liang, Y., et al. (2023). CAPSNET-LDA: predicting lncrna-disease associations using attention mechanism and capsule network based on multi-view data. Brief. Bioinformatics 24, bbac531. doi: 10.1093/bib/bbac531
Zhou, Y., Xu, Z. Z., He, Y., Yang, Y., Liu, L., Lin, Q., et al. (2018). Gut microbiota offers universal biomarkers across ethnicity in inflammatory bowel disease diagnosis and infliximab response prediction. MSystems 3, e00188–17. doi: 10.1128/mSystems.00188-17
Zhu, S., and Zhu, F. (2019). Cycling comfort evaluation with instrumented probe bicycle. Transp. Res. Part A. Policy Pract. 129, 217–231. doi: 10.1016/j.tra.2019.08.009
Zhu, T., Dai, Q., and He, P.-A. (2021). Identification of potential immune-related biomarkers in gastrointestinal cancers. Curr. Bioinform. 16, 1203–1213. doi: 10.2174/1574893615666210106121335
Keywords: microbe-disease association, feature representation, dimensional reduction, sparse autoencoder, LightGBM
Citation: Wang F, Yang H, Wu Y, Peng L and Li X (2023) SAELGMDA: Identifying human microbe–disease associations based on sparse autoencoder and LightGBM. Front. Microbiol. 14:1207209. doi: 10.3389/fmicb.2023.1207209
Received: 17 April 2023; Accepted: 18 May 2023;
Published: 21 June 2023.
Edited by:
Qi Zhao, University of Science and Technology Liaoning, ChinaReviewed by:
Yulin Zhang, Shandong University of Science and Technology, ChinaCopyright © 2023 Wang, Yang, Wu, Peng and Li. This is an open-access article distributed under the terms of the Creative Commons Attribution License (CC BY). The use, distribution or reproduction in other forums is permitted, provided the original author(s) and the copyright owner(s) are credited and that the original publication in this journal is cited, in accordance with accepted academic practice. No use, distribution or reproduction is permitted which does not comply with these terms.
*Correspondence: Lihong Peng, cGxoaG51QDE2My5jb20=; Xiaoling Li, YXRoZW5hMjExMUAxNjMuY29t
†These authors have contributed equally to this work and share first authorship
Disclaimer: All claims expressed in this article are solely those of the authors and do not necessarily represent those of their affiliated organizations, or those of the publisher, the editors and the reviewers. Any product that may be evaluated in this article or claim that may be made by its manufacturer is not guaranteed or endorsed by the publisher.
Research integrity at Frontiers
Learn more about the work of our research integrity team to safeguard the quality of each article we publish.