 Qiang Li
 Yingyong Luo
 Lianxin Peng
- Key Laboratory of Coarse Cereal Processing, Ministry of Agriculture and Rural Affairs, School of Food and Biological Engineering, Chengdu University, Chengdu, Sichuan, China
Introduction: Codon basis is a common and complex natural phenomenon observed in many kinds of organisms.
Methods: In the present study, we analyzed the base bias of 12 mitochondrial core protein-coding genes (PCGs) shared by nine Amanita species.
Results: The results showed that the codons of all Amanita species tended to end in A/T, demonstrating the preference of mitochondrial codons of Amanita species for a preference for this codon. In addition, we detected the correlation between codon base composition and the codon adaptation index (CAI), codon bias index (CBI), and frequency of optimal codons (FOP) indices, indicating the influence of base composition on codon bias. The average effective number of codons (ENC) of mitochondrial core PCGs of Amanita is 30.81, which is <35, demonstrating the strong codon preference of mitochondrial core PCGs of Amanita. The neutrality plot analysis and PR2-Bias plot analysis further demonstrated that natural selection plays an important role in Amanita codon bias. In addition, we obtained 5–10 optimal codons (ΔRSCU > 0.08 and RSCU > 1) in nine Amanita species, and GCA and AUU were the most widely used optimal codons. Based on the combined mitochondrial sequence and RSCU value, we deduced the genetic relationship between different Amanita species and found large variations between them.
Discussion: This study promoted the understanding of synonymous codon usage characteristics and evolution of this important fungal group.
Introduction
The genetic information contained in biological DNA is transferred to the sequence of 20 amino acids according to the “central rule.” Of the 64 nucleotide triplets (codons) contained in DNA, 61 can encode standard 20 amino acids, while the other three are translation stop signals. Eighteen of the 20 amino acids are coded by multiple synonymous codons, while tryptophan and methionine are coded by only one codon in most species (Quax et al., 2015). The degeneration of the genetic code allows the same amino acid to be encoded by different codons or synonymous codons (Yao et al., 2019; Bailey et al., 2021). However, in different organisms, different genes, or even the same gene from different species, the probability of synonymous codons being used is not equal or random, and some codons are repeatedly preferred to other codons to encode amino acids (Behura and Severson, 2012; Barbhuiya et al., 2020). There is a common phenomenon called codon usage bias (CUB), in which synonymous codons appear with different frequencies (Hershberg and Petrov, 2008; Choudhury et al., 2018). Mutations in the gene coding region, particularly in the second or third nucleotide of the existing codon, can lead to the alteration of one synonymous codon to another; however, this will not have an effect on the amino acid or peptide primary sequence specified by the new and modified codon (Iriarte et al., 2021; Parvathy et al., 2022). In evolution, these synonymous mutations, or “silent mutations” that do not change the initial sequence of proteins or peptides will lead to the variation of synonymous codons in organisms. Thus, codon usage bias occurs as a result of biased mutation patterns; as some codons may be more prone to mutation than others, selection can maintain such bias (Behura and Severson, 2013; Arella et al., 2021). A codon use bias can also be derived from GC heterogeneity and GC-biased gene transformation (gBGC) based on local recombination rates (Akashi, 1997; Dilucca et al., 2021; Parvathy et al., 2022). As a result, synonymous codons evolved through a balance of mutations, natural selection, and genetic drift in gene translation efficiency, which may contribute significantly to genome evolution (Krasovec and Filatov, 2019; Dilucca et al., 2020; Gomez et al., 2020). The mutation mechanism of codon bias assumes that codon bias is caused by nucleotide bias or the rate or repair of point mutation and explains the interspecific variation in codon use (Palidwor et al., 2010; Rao et al., 2011; Wang et al., 2011). The theory of natural selection also assumes that synonymous mutations, which affect the adaptability of organisms, will be promoted or suppressed throughout the evolution process when the force affecting biological adaptability is large enough, thus resulting in variations in the use of codons in genomes or genes (Lal et al., 2016; Xu et al., 2021).
Codon bias is thought to affect a wide range of cellular processes, including mRNA stability, transcription, translation efficiency and accuracy, as well as protein expression, structure, function, and cotranslation folding (Chu and Wei, 2021; Franzo et al., 2021; Hia and Takeuchi, 2021). By affecting chromatin structure and mRNA folding, codon bias can influence transcription levels and translation efficiency by regulating the elongation rate of translation (Uddin et al., 2015). Thus, codon bias is caused by genome adaptations to transcription and translation mechanisms or only adaptations (Biswas et al., 2019). Selecting gene sequences without changing amino acids has far-reaching significance for the study of the molecular evolution of genes. As closely related organisms use codons in similar ways, codon bias analysis can reveal horizontal gene transfer and evolutionary relationships between organisms (LaBella et al., 2019; Kokate et al., 2021). Most highly expressed proteins are encoded by genes with appropriate codons. Therefore, heterologous genes can be optimized in genetic engineering or recombinant DNA technology to enhance the protein expression of heterologous genes. With the rapid development of high-throughput sequencing technology, fully analyzing codon bias is helpful to understanding the genetic mechanism of species evolution, environmental adaptation, genetics, and so on (Huo et al., 2021; Hugaboom et al., 2023). However, so far, the genetic characteristics of codon bias in fungal species, especially in large higher fungi, have not been fully understood (Araujo et al., 2021; Wint et al., 2022).
Amanita is a population rich in species diversity, and approximately 600 species are described in the genus of Amanita (Wolfe et al., 2012). Some Amanita species are considered edible, while some species are considered toxic (Cai et al., 2016; Ye and Liu, 2018). Most species of Amanita are ectomycorrhizal fungi, while a few are saprophytic, and they all evolved from their symbiotic ancestors (Wolfe et al., 2012; De Mares et al., 2015). Amanita has been used as a model organism to study the origin, evolution, and genetics of fungal life patterns (Hess et al., 2014, 2018). During the evolution of Amanita, a series of genes have evolved to better adapt to its diverse lifestyles (Kohler et al., 2015). The mitochondrial genome is considered the “second genome” of fungi besides the nuclear genome, encoding a series of oxidative phosphorylation-related genes for fungal energy metabolism (Sankoff et al., 1992; Boore, 1999; Poliseno et al., 2017; Qian et al., 2018). It has been reported that most fungi contain 15 core protein-coding genes (CDSs), including atp6, atp8, atp9, cob, cox1, cox2, cox3, nad1, nad2, nad3, nad4, nad4L, nad5, nad6, and rps3 (Li et al., 2018, 2019). Mutations in fungal mitochondrial core protein-coding genes may lead to the destruction of fungal cell homeostasis and induce cell damage, growth inhibition, and even fungal death (Osiewacz, 2002; Chatre and Ricchetti, 2014). Therefore, the study of base bias of fungal mitochondrial core protein-coding genes will help to understand the genetic and evolutionary characteristics of fungal mitochondrial genes, especially in this diverse Amanita population.
In this study, we systematically analyzed and compared the codon usage characteristics of mitochondrial core protein-coding genes of nine Amanita species, including A. basii, A. bisporigera, A. brunnescens, A. muscaria, A. phalloides, A. pseudoporphyria, A. sinensis, A. inopinata, and A. thiersii. The phylogenetic tree of Amanita species was constructed based on the relative synonymous codon usage of mitochondrial core genes of Amanita species and was compared with the phylogenetic tree constructed based on the core protein encoding gene sequences. The results promoted the understanding of the codon inheritance, evolution, and environmental adaptation of important energy metabolism genes of diverse fungal groups.
Materials and methods
Sequence processing
To date, nine complete mitochondrial genomes from the Amanita genus have been deposited in the National Center for Biotechnology Information (NCBI) database, including eight species previously reported by us and one reported by other scholars (Li et al., 2020). We downloaded the core protein-coding genes of the eight Amanita mitochondrial genomes from the NCBI database under the accession numbers NC_045194–NC_045201 and NC_058596. The mitochondrial coding genes obtained were further screened, and those with sequences less than 100 coding amino acids were excluded from downstream analysis (Bu et al., 2021). Finally, we obtained 12 core protein-coding genes in each mitochondrial genome of Amanita for downstream analysis: atp6, cob, cox1, cox2, cox3, nad1, nad2, nad3, nad4, nad5, nad6, and rps3.
Codon usage indices
The GC3s parameter determines the proportion of codons with guanine and cytosine at third synonymous positions, excluding Met, Trp, and termination codons (Huo et al., 2021). The codon adaptation index (CAI) is commonly used to assess bias toward codons, which are known to be preferred in highly expressed genes. It ranges from 0 to 1.0; the larger the value is, the more frequently the synonymous codon is used. The codon bias index (CBI) is used as a standard to evaluate gene expression, which reflects the components of a gene with high expression of superior codons. The frequency of optimal codons (FOP) is calculated by counting the ratio of the optimal codon number to the total synonymous codon number in the gene. The effective number of codons (ENC) refers to the number of effective codons used in a gene and ranges from 20 to 61. An ENC value equal to 20 means that only one codon is used for each amino acid, and 61 means that each codon is used on average. If the value of ENC is lower than 35, then the codon usage preference is strong; if it is higher than 35, then the codon usage preference is weak. By dividing the amino acids encoded by the same codons and their probability of appearing in the same codons, the relative synonymous codon usage (RSCU) value was calculated. An RSCU value greater than 1 indicates a positive codon bias, an RSCU value less than 1 indicates a negative codon bias, and an RSCU value equal to 1 indicates a random codon usage. We calculated general average hydropathicity (GRAVY) values by summing the hydropathy values of all of the amino acids in the polymerase gene sequences and multiplying them by the number of residues in the gene sequences. GRAVY values range from −2 to 2; positive and negative values represent hydrophobic and hydrophilic proteins, respectively. The aromaticity (AROMO) value indicates the frequency of aromatic amino acids (Phe, Tyr, and Trp). GRAVY and AROMO values are also indicators of amino acid usage, and changes in amino acid composition will also affect the results of codon usage analysis. All of the codon usage indicators above were calculated through CodonW1.4.2 (Peden, 1999) and CAIcal server (Puigbo et al., 2008).
Neutrality plot analysis
The neutrality plot (GC12 vs. GC3) can illustrate the balance between mutation and selection when codon bias is formed. GC12 represents the average GC content in the first and second positions of the codon (GC1 and GC2), while GC3 represents the GC content in the third position. If we find a strong statistical correlation between GC12 and GC3, then the main driving force of the species is mutation pressure. In contrast, if there is no correlation between GC12 and GC3, then the main driving force of the tested species is natural selection.
ENC-GC3s plot analysis
The ENC-GC3s plot (ENC vs. GC3s) is usually used to check whether the codon usage of a specific gene is affected only by mutation or other factors, such as natural selection. The ENC-GC3s diagram consists of the ordinate ENC value and abscissa GC3s value. Furthermore, we calculated the expected curve on the ENC-GC3s diagram based on the following formula. If we find that the corresponding points are distributed around the expected curve, we can conclude that the mutation pressure is an independent force in the formation of codon bias. If the corresponding point is lower or far from the expected curve, there should be some other factors, such as natural selection, playing a key role in the formation of codon bias.
We further tested the variations between the expected value and the actual value of ENC, which is reflected by the ENCRatio index. The ENCRatio value reflects the variation range between the expected value and the actual value of ENC.
PR2-bias plot analysis
We further performed the Parity Rule 2 bias (PR2-Bias) plot analysis based on [A3/(A3 + U3) vs. G3/(G3 + C3)]. The value when the center point in the plot is A = T and C = G, that is, the codon has no usage bias, and the other vectors emitted from the center point indicate the degree and direction of the gene bias.
Correspondence analysis
Correspondence analysis (COA) is a widely accepted multivariate statistical analysis method to determine codon usage patterns. As these genes have 59 sense codons (Met and Trp are excluded from the 61 total codons), we put all genes in the 59-dimensional hyperspace in the figure. This method can explore the main trend of codon usage change in the core CDS of Amanita and distribute codons along the axis according to the RSCU value.
Determination of optimal codons
We arranged all of the tested genes in order from large to small according to the CAI value, and 10% of the genes were selected from the front and rear ends to establish a high-and low-expression gene dataset. We further calculated the D-value between the RSCU of the two datasets (ΔRSCU), where ΔRSCU values greater than 0.08 were defined as codons with high expression. Codons with RSCU values greater than 1 are regarded as high-frequency codons. A codon with ΔRSCU>0.08 and RSCU>1 was defined as the optimal codon.
Phylogenetic analysis
We compared the phylogenetic relationships of Amanita species between codon usage-based and mitochondrial sequence-based methods. Based on the RSCU values of the nine Amanita species, we used SPSS v19.0 software based on the hierarchical clustering method to draw the relationship tree between different species. We then used the combined mitochondrial gene datasets to construct phylogenetic trees of the 9 Amanita species according to the method described by our previous studies (Li et al., 2022a,b). Briefly, individual mitochondrial genes were first aligned using MAFFT v7.037(Katoh et al., 2019), and then the aligned mitochondrial sequences were concatenated into a combined mitochondrial gene set based on Sequence Matrix v1.7.8 (Vaidya et al., 2011). Potential phylogenetic conflicts between different mitochondrial genes were detected by a preliminary partition homogeneity test. We then used Partition Finder 2.1.1 (Lanfear et al., 2017) to detect the best-fit model of partitioning schemes and evolution for the combined mitochondrial gene set. We constructed the phylogenetic tree by the Bayesian inference (BI) method using MrBayes v3.2.6 (Ronquist et al., 2012). Specifically, two independent runs with four chains (three heated and one cold) each were conducted simultaneously for 2 × 10⁶ generations. Each run was sampled every 100 generations. We assumed that stationarity had been reached when the estimated sample size was greater than 100 and the potential scale reduction factor approached 1.0. The first 25% of samples were discarded as burn-in, and the remaining trees were used to calculate Bayesian posterior probabilities (BPP) in a 50% majority-rule consensus tree.
Results
Nucleotide composition of Amanita core PCGs
We selected 12 mitochondrial core PCGs from the nine Amanita species for codon usage analysis. Statistical analysis found that the average length of these core PCGs ranged from 376 bp to 2004 bp, with the nad3 gene having the shortest average length and the nad5 gene having the longest average length. Among the 12 core PCGs, eight genes showed sequence length variations among different Amanita species, while four genes had the same gene length among nine Amanita species. Among the 12 core PCGs, the rps3 gene showed the largest length variation among different species, and different Amanita species have different gene lengths from other species. We further calculated the base composition of the 12 core PCGs of nine Amanita species and found that the mitochondrial core PCGs of nine Amanita species were rich in the T base, with an average content of 41.08%, followed by the A base, with an average content of 31.73%. The G and C base contents of mitochondrial core PCGs in Amanita species were relatively small, with an average of 13.90 and 13.29%, respectively. The average GC content of the 12 core PCGs ranged from 18.67 to 33.47%, with the rps3 gene containing the lowest GC content and the cox1 gene containing the highest GC content.
Codon usage index analysis
The GC1, GC2, and GC3 contents of 12 core PCGs in 9 Amanita species were 35.06, 34.13 and 12.38%, respectively (Figure 1A). The average GC3s value of 12 PCGs in nine Amanita species was 10.73%, which showed that the codon of the mitochondrial core PCGs of Amanita tended to end with an A or T base. We further calculated the indices of A3s, T3s, G3s, and C3s of 12 core PCGs of Amanita species and found that the mitochondrial codons of Amanita were more inclined to end with A, followed by T, C and G, with values of 55.84, 52.31, 8.11, and 3.45%, respectively. We calculated the CAI values of 12 core PCGs of nine Amanita species and found that the CAI values of core PCGs ranged from 0.11 to 0.19. Among them, nad2 had the lowest CAI value, while the cox2 gene had the highest CAI value, indicating that the nad2 gene had high codon bias. In terms of species, the core PCGs of A. thiersii have the highest CAI value, followed by those of A. basii, while the CAI values of A. brunnescens and A. sinensis are the lowest, indicating that A. brunnescens and A. sinensis have strong codon bias of mitochondrial core PCGs (Figure 1B). The CBI values of the 12 core PCGs we detected ranged from-0.24 to-0.1. Among them, nad2 had the lowest CBI value, and cox1 had the highest CBI value. Regarding species, the CBI values of nine Amanita species ranged from −0.19 to −0.15, among which A. inopinata had the lowest CBI value and A. thiersii had the highest CBI value. In terms of PCGs, the average FOP values ranged from 0.26 to 0.35 among the 12 core PCGs detected, while nad2 had the lowest FOP value and cox1 had the highest FOP value. Among the nine Amanita species, A. inopinata had the lowest FOP value, while A. thiersii had the largest FOP value, which were 0.29 and 0.31, respectively. We further calculated the GRAVY values of 12 core PCGs in nine Amanita species. The results showed that 11 of the 12 core PCGs had positive GRAVY values, indicating that they might be hydrophobic proteins, while only the rps3 gene was considered hydrophilic. The AROMO value range of different PCGs is 0.11–0.18; the nad2 gene has the highest AROMO value, and the cox3 gene has the lowest AROMO. The AROMO values of different Amanita species varied little, with an average of 0.14.
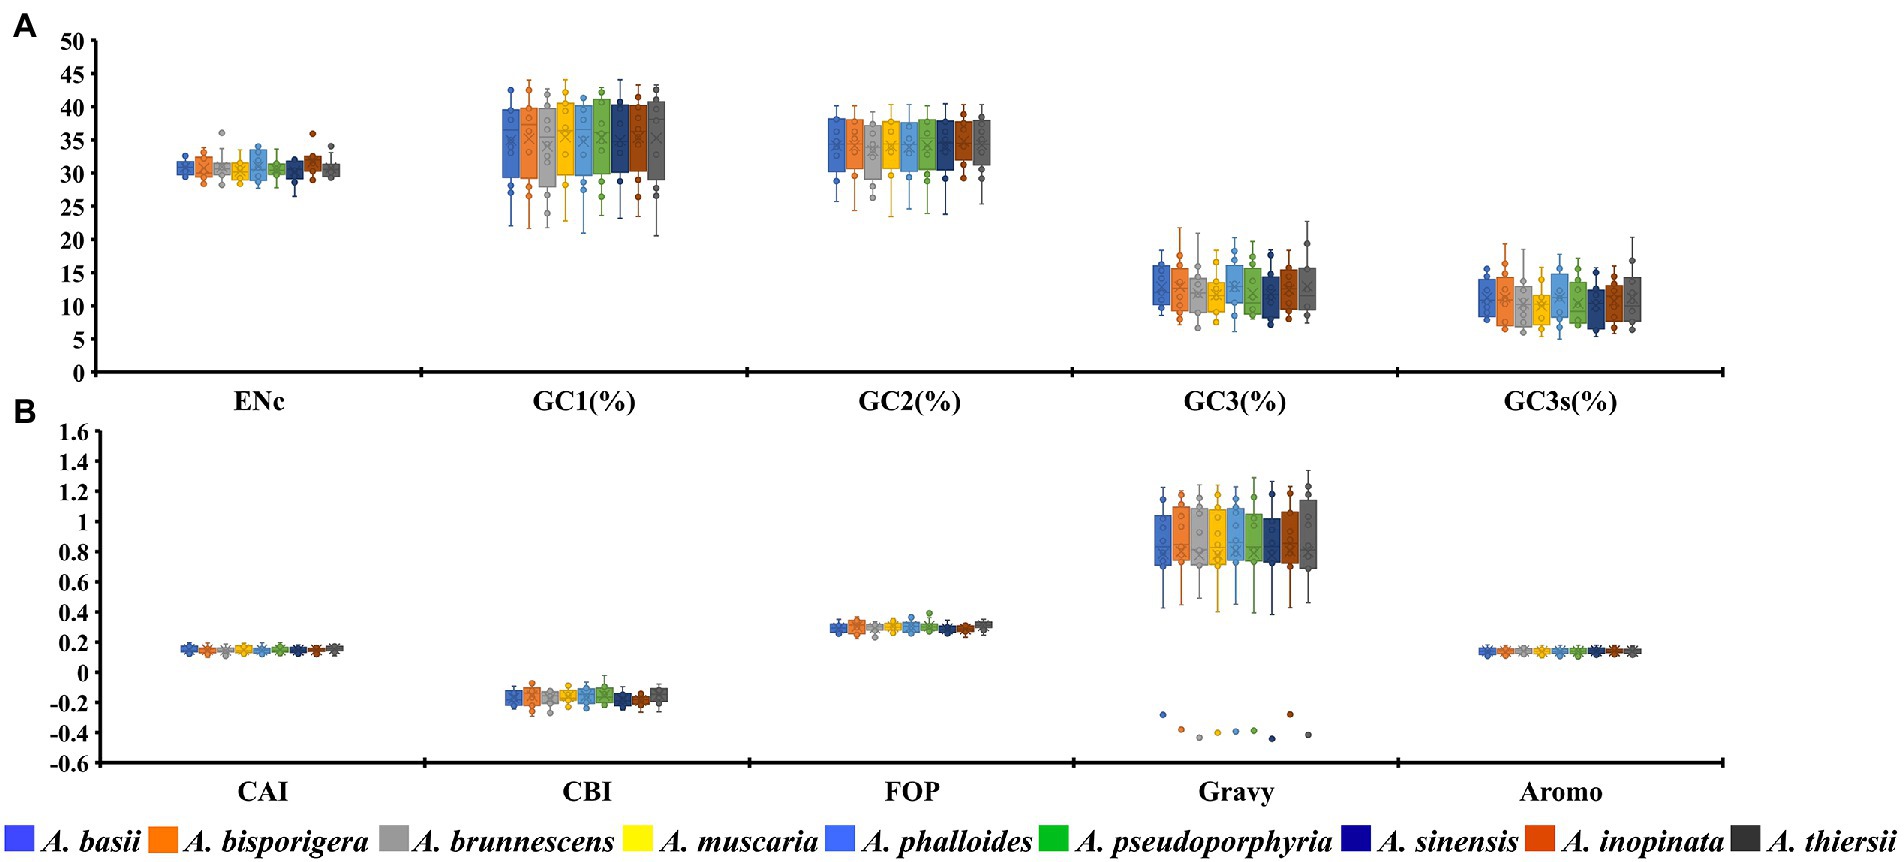
Figure 1. Box plot of codon usage indicators of 12 mitochondrial core protein-coding genes in different species of Amanita. A, ENc, GC1, GC2, GC3, and GC3s indicators; B, CAI, CBI, FOP, Gravy, and Aromo indicators.
Correlation analysis of codon usage indices
We found that the content of GC1 in mitochondrial codons was significantly correlated with the GC2, GC3, GC3s and GC content in seven of nine Amanita species: A. basii, A. bisporigera, A. muscaria, A. pseudoporphyria, A. sinensis, A. inopinata, and A. thiersii (Figure 2). In A. brunnescens and A. phalloides, we did not observe a significant correlation between GC1 and GC2 or GC3 (Figures 2C,E). In addition, the content of GC1 had a significant correlation with the CAI index of the seven Amanita species, A. basii, A. brunnescens, A. muscaria, A. pseudoporphyria, A. sinensis, A. inopinata, and A. thiersii, which showed that the GC1 content could significantly affect the codon basis in Amanita mitochondrial PCGs. There was a significant correlation between the GC2 and GC contents of all Amanita species (p < 0.01), indicating that the GC2 content could affect the GC composition of species to some extent. In all nine Amanita species tested, the GC3 content in the mitochondrial codon was considered to be significantly correlated with the GC3s and GC contents (p < 0.01). In all Amanita species, the CAI index of mitochondrial codons was significantly correlated with the CBI index and FOP index (p < 0.05). The CBI index was found to have a significant correlation with the FOP index in 9 Amanita species (p < 0.05).
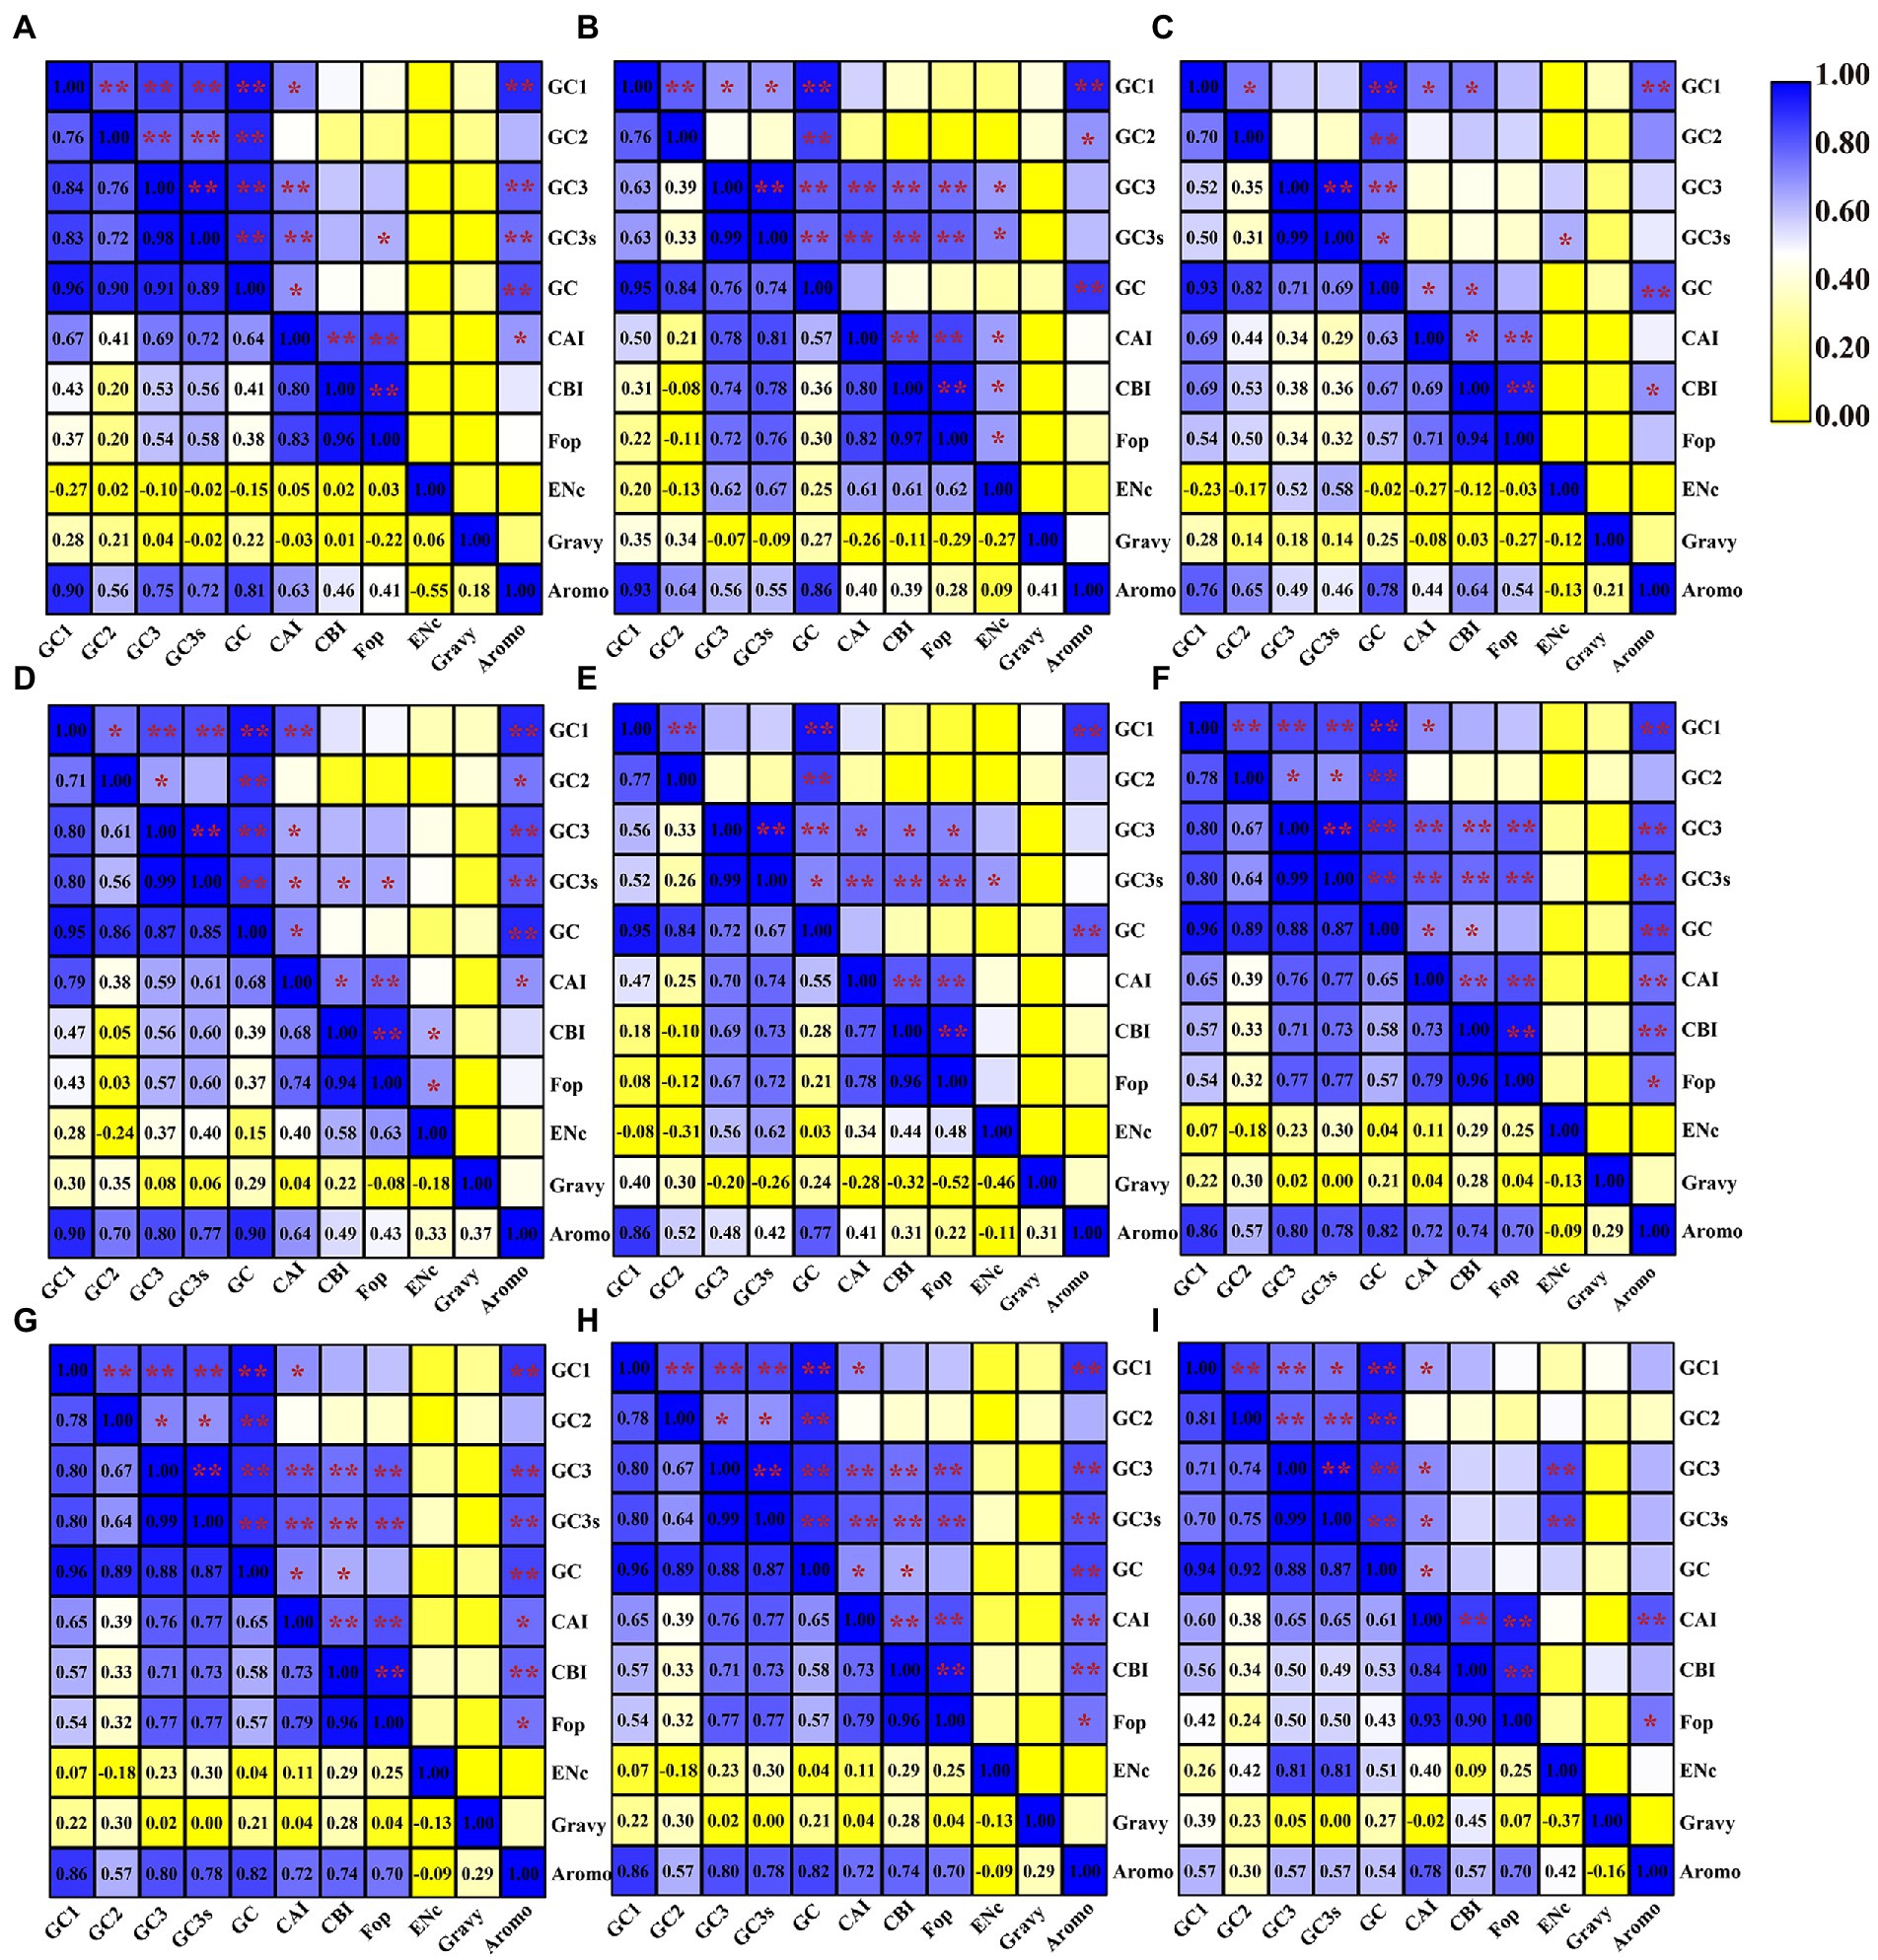
Figure 2. Pearson’s correlation analysis heatmap of different codon usage indicators of nine Amanita species. The color of the color block changes from yellow to blue, indicating that the correlation index is increasing. One asterisk indicates a significant correlation between the two indicators at the p < 0.05 level, while two asterisks indicate a significant correlation between the two indicators at the p < 0.01 level. (A), A. basii; (B), A. bisporigera; (C), A. brunnescens; (D), A. muscaria; (E), A. phalloides; (F), A. pseudoporphyria; (G), A. sinensis; (H), A. inopinata; and (I), A. thiersii.
Neutrality plot analysis
We calculated the relationships between GC12 and GC3 based on neutrality plot analysis (Figure 3). The GC12 content varied from 22.81 to 41.14%, and the GC3 content varied from 6.14 to 22.73%. The slopes of the regression lines (regression coefficient) ranged from 0.622 to 1.387, indicating that the content of GC12 and GC3 in mitochondrial codons of Amanita is weak correlated. In addition, the R2 value of the standard curve ranged from 0.2381 to 0.7318. There is no significant correlation between GC12 value and GC3 value (p > 0.05), which indicated that natural selection may play an important role in driving the evolution of mitochondrial PCGs in Amanita.
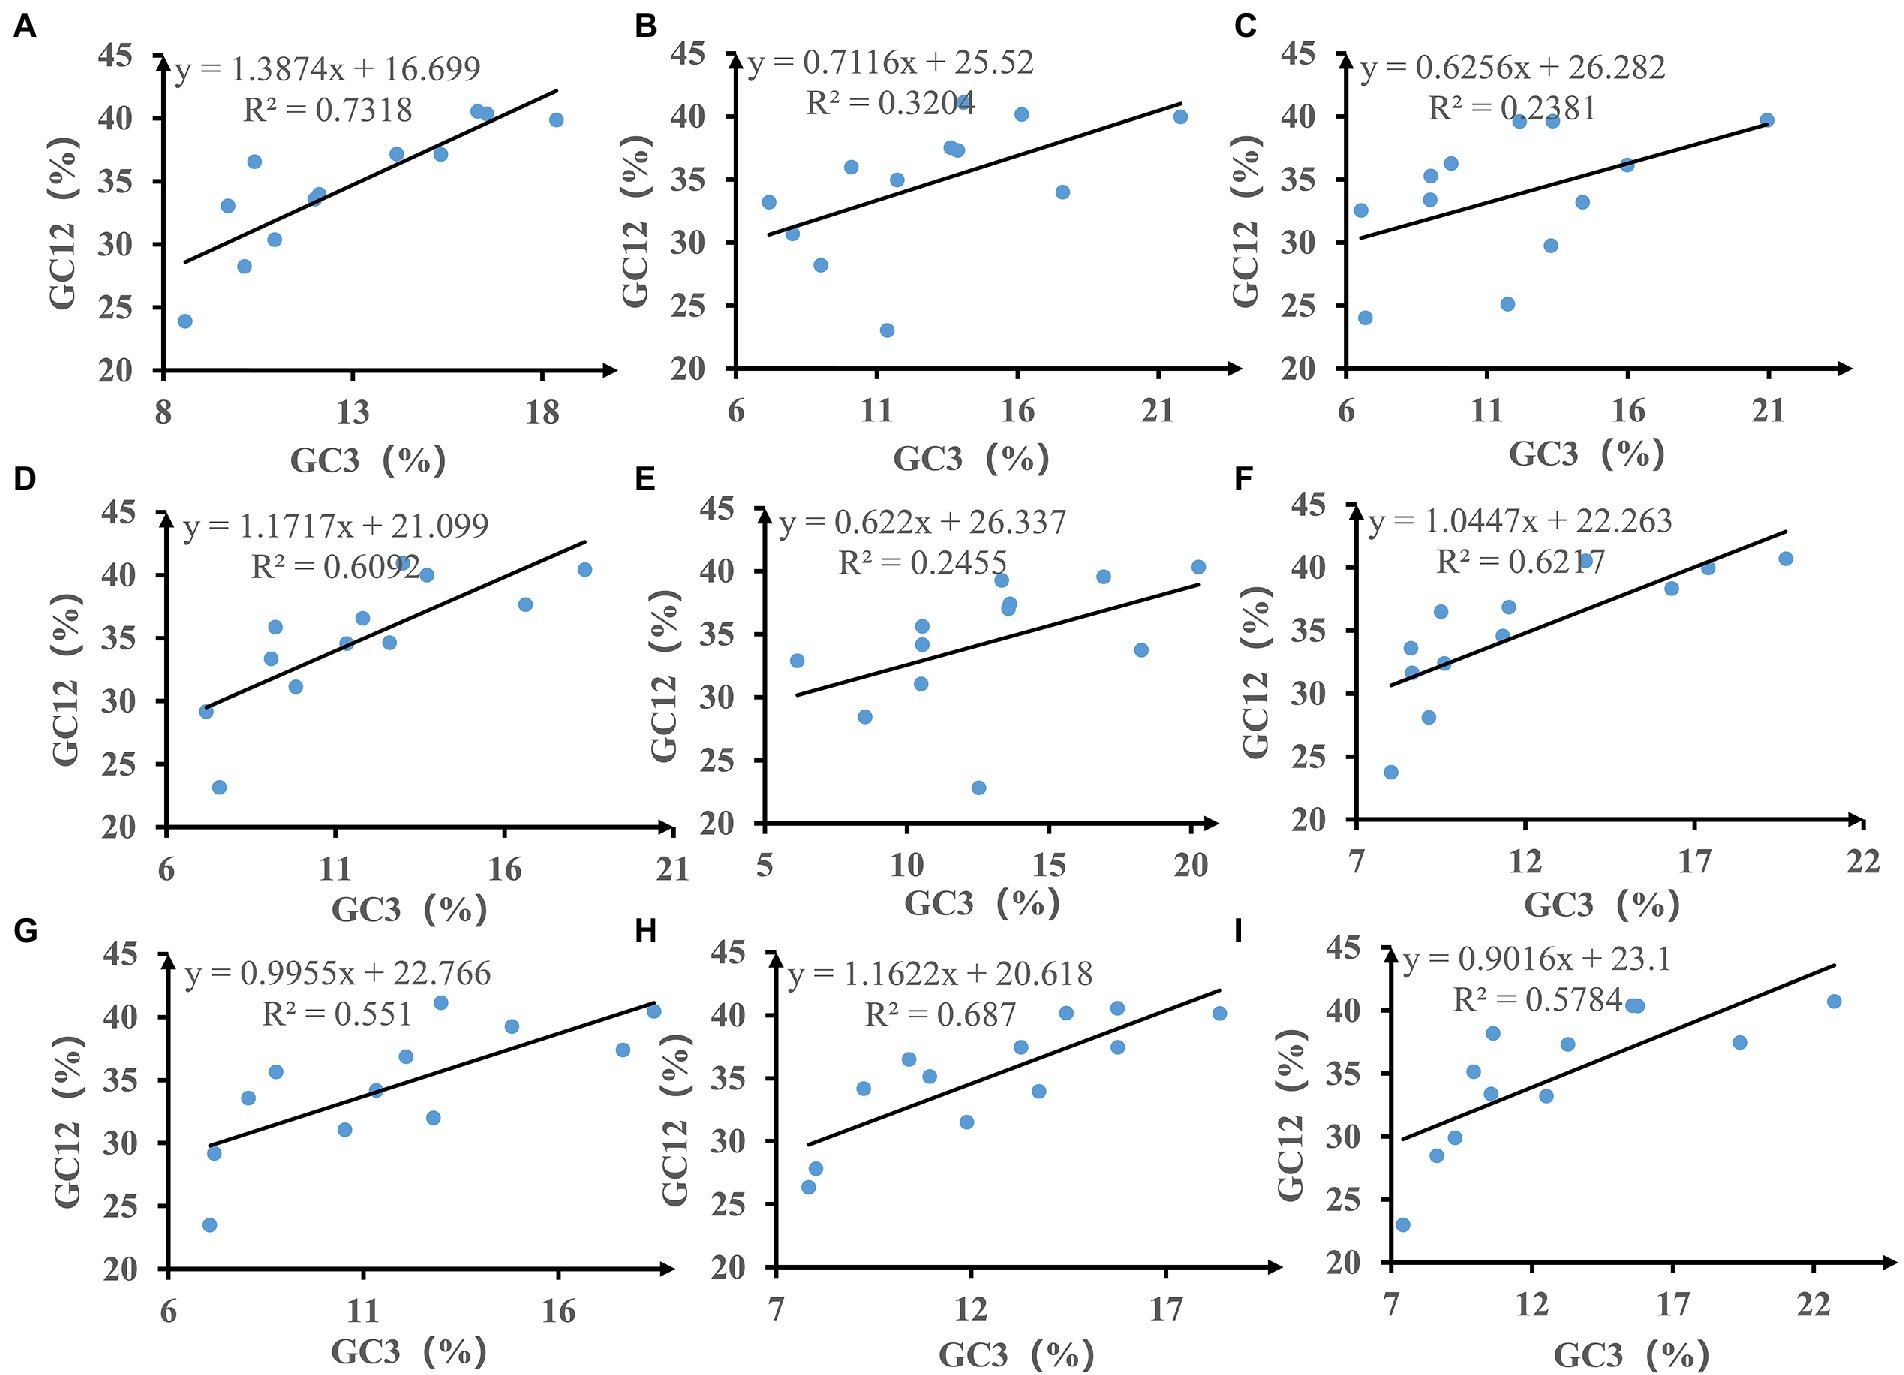
Figure 3. Neutrality plot analysis of GC12 and the third codon position (GC3) for the entire coding DNA sequence of nine Amanita species. (A), A. basii; (B), A. bisporigera; (C), A. brunnescens; (D), A. muscaria; (E), A. phalloides; (F), A. pseudoporphyria; (G), A. sinensis; (H), A. inopinata; and (I), A. thiersii.
The effect of ENC on codon bias
The average ENC value of all 12 core PCGs detected ranged from 29.16 to 32.12, with an average ENC value of 30.81 (Figure 1A). The ENC value of all core PCGs was less than 35, indicating that these genes had a strong codon usage preference. In addition, in terms of species, the ENC values of nine Amanita species ranged from 30.28 to 31.68, which also indicated that the mitochondrial gene of Amanita has a strong preference for codon usage.
To distinguish the influence of GC3s on codon bias of Amanita, we constructed an ENC plot. Figure 4 shows that all Amanita genes were below the expected ENC-plot curve. According to the results, mutational pressure is not the only factor that shapes codon bias; other factors, such as natural selection, also play a key role in codon bias formation.
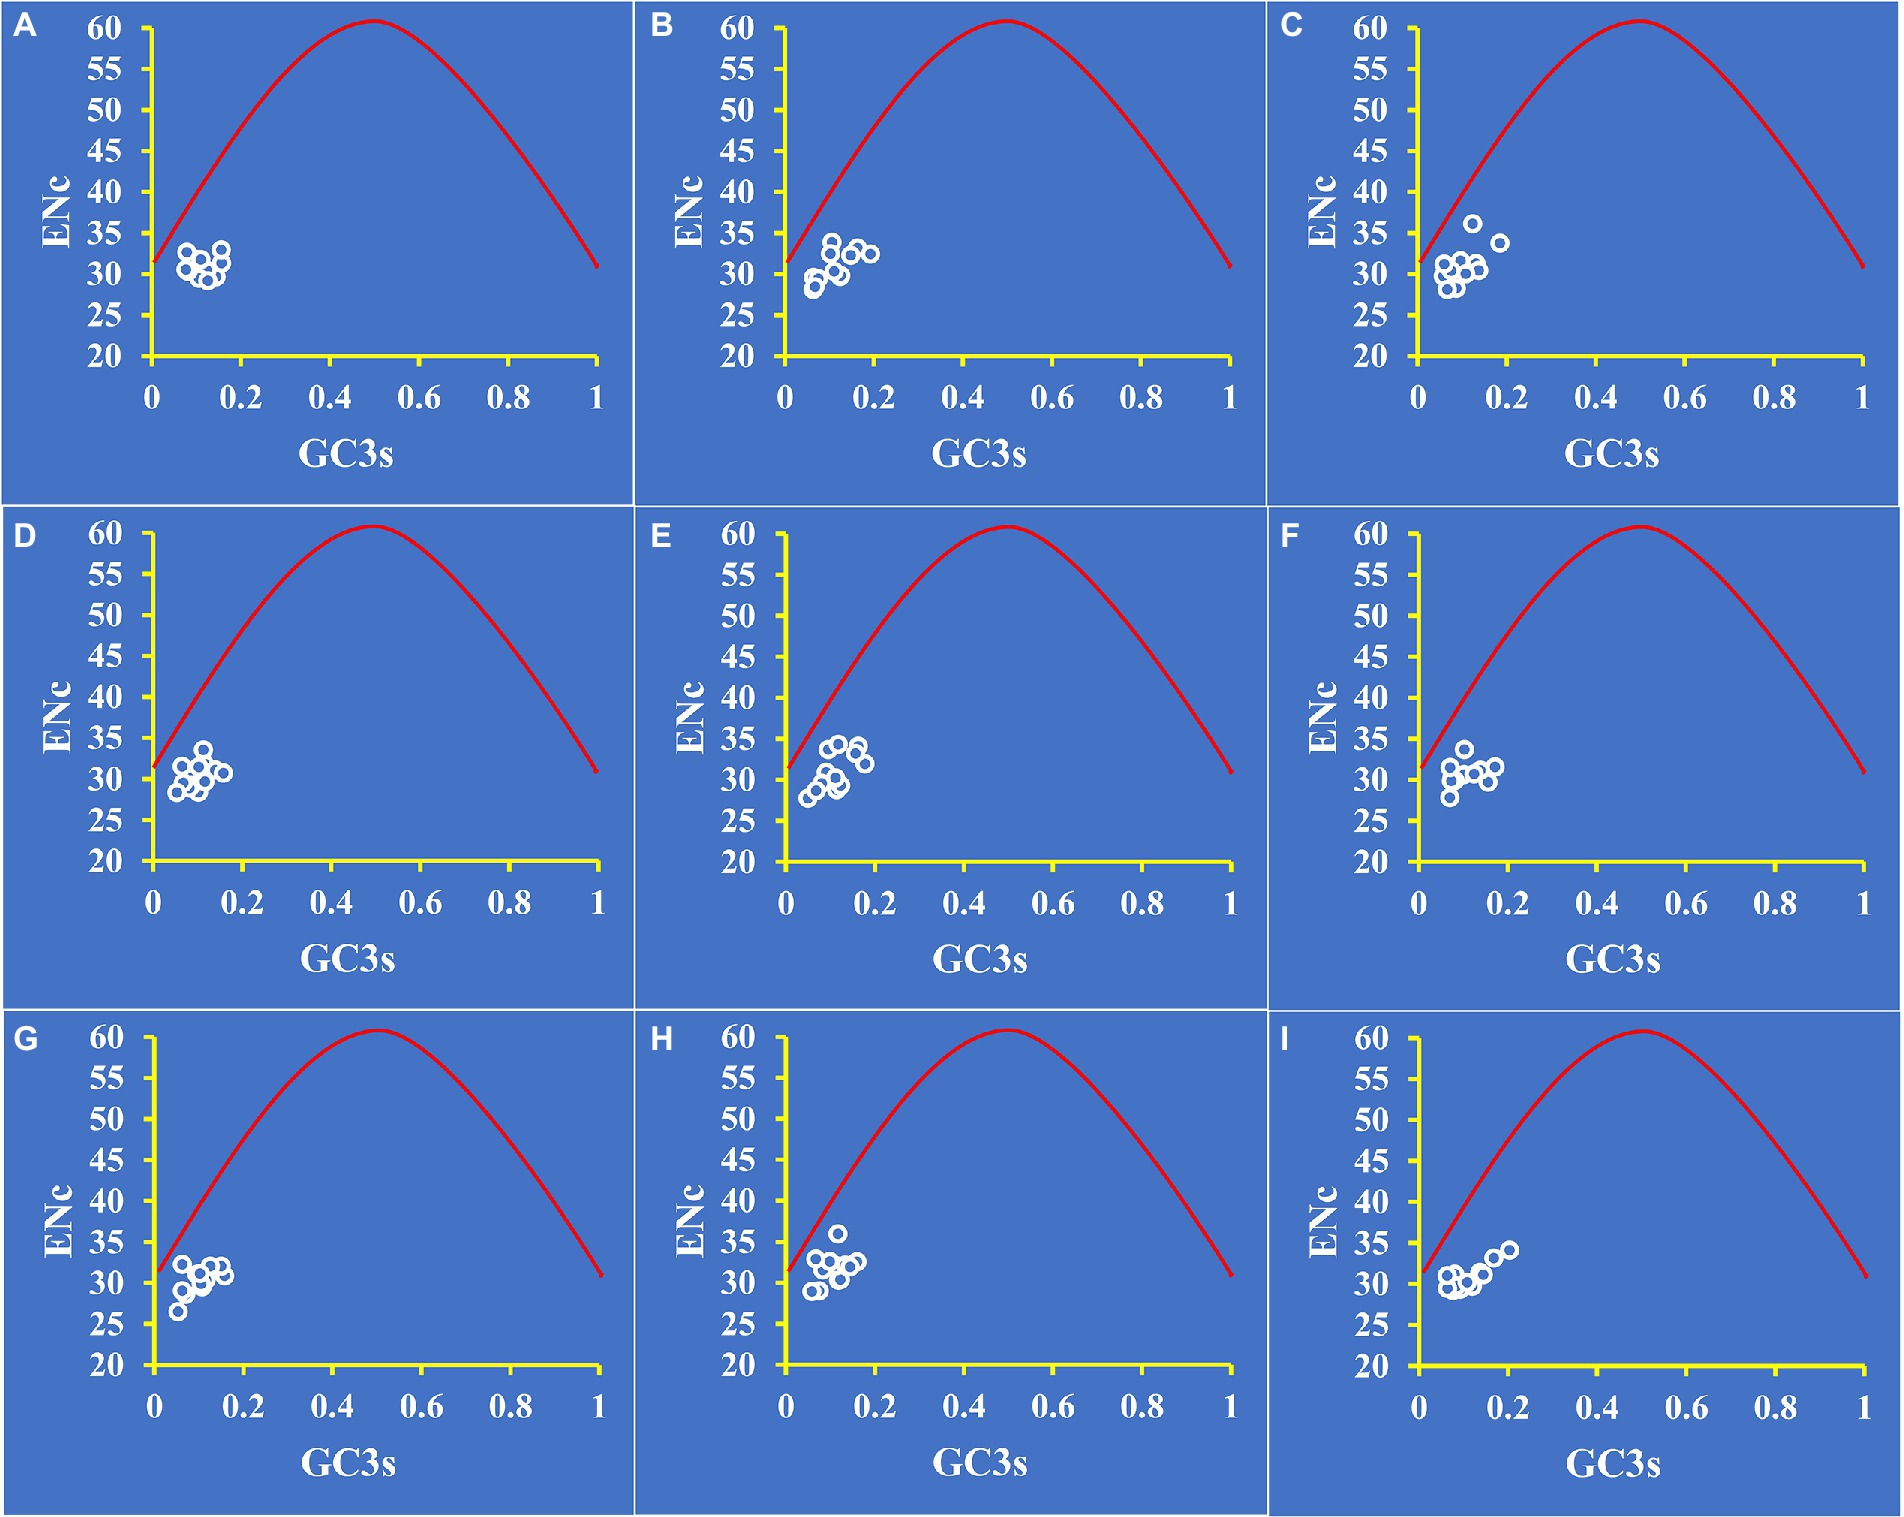
Figure 4. ENC-GC3 plot analysis of 12 core PCGs in nine Amanita species. The red solid line represents the expected curve when codon usage bias is affected only by mutation pressure. (A), A. basii; (B), A. bisporigera; (C), A. brunnescens; (D), A. muscaria; (E), A. phalloides; (F), A. pseudoporphyria; (G), A. sinensis; (H), A. inopinata; and (I), A. thiersii.
In addition, we calculated ENCRatio for mitochondrial core genes in Amanita to determine the difference between observed and expected ENC values. As shown in Supplementary Figure S1, the average ENCRatio values for all core PCGs ranged from 17.70 to 20.65%, indicating that the expected values were greater than the actual values. The GC3s values affected the expected ENC value calculated based on the calculation formula, which further demonstrates that GC3s plays an important role in the formation of codon bias. In conclusion, the results prove that other factors, such as natural selection, determine the formation of Amanita codon bias.
The preference of third codon
To determine if Amanita mitochondrial genes have biases, we further performed a Parity Rule 2 (PR2) plot analysis (Figure 5). Both axes were centered on 0.5 to divide the plot into four quadrants. Most of the dots were found to be distributed in the third quadrant of the nine Amanita species, indicating that the third base of the mitochondrial codon of Amanita has a strong preference, preferring T to A and C to G. In addition, eight of the nine Amanita species are not distributed in the first quadrant (preferring A to T and G to C), with A. bisporigera being the exception (Figure 5B). The results showed that other factors, such as natural selection, play an important role in the process of codon bias in Amanita species. The third base of the mitochondrial codon of Amanita has a strong preference, which preferred T to A and C to G.
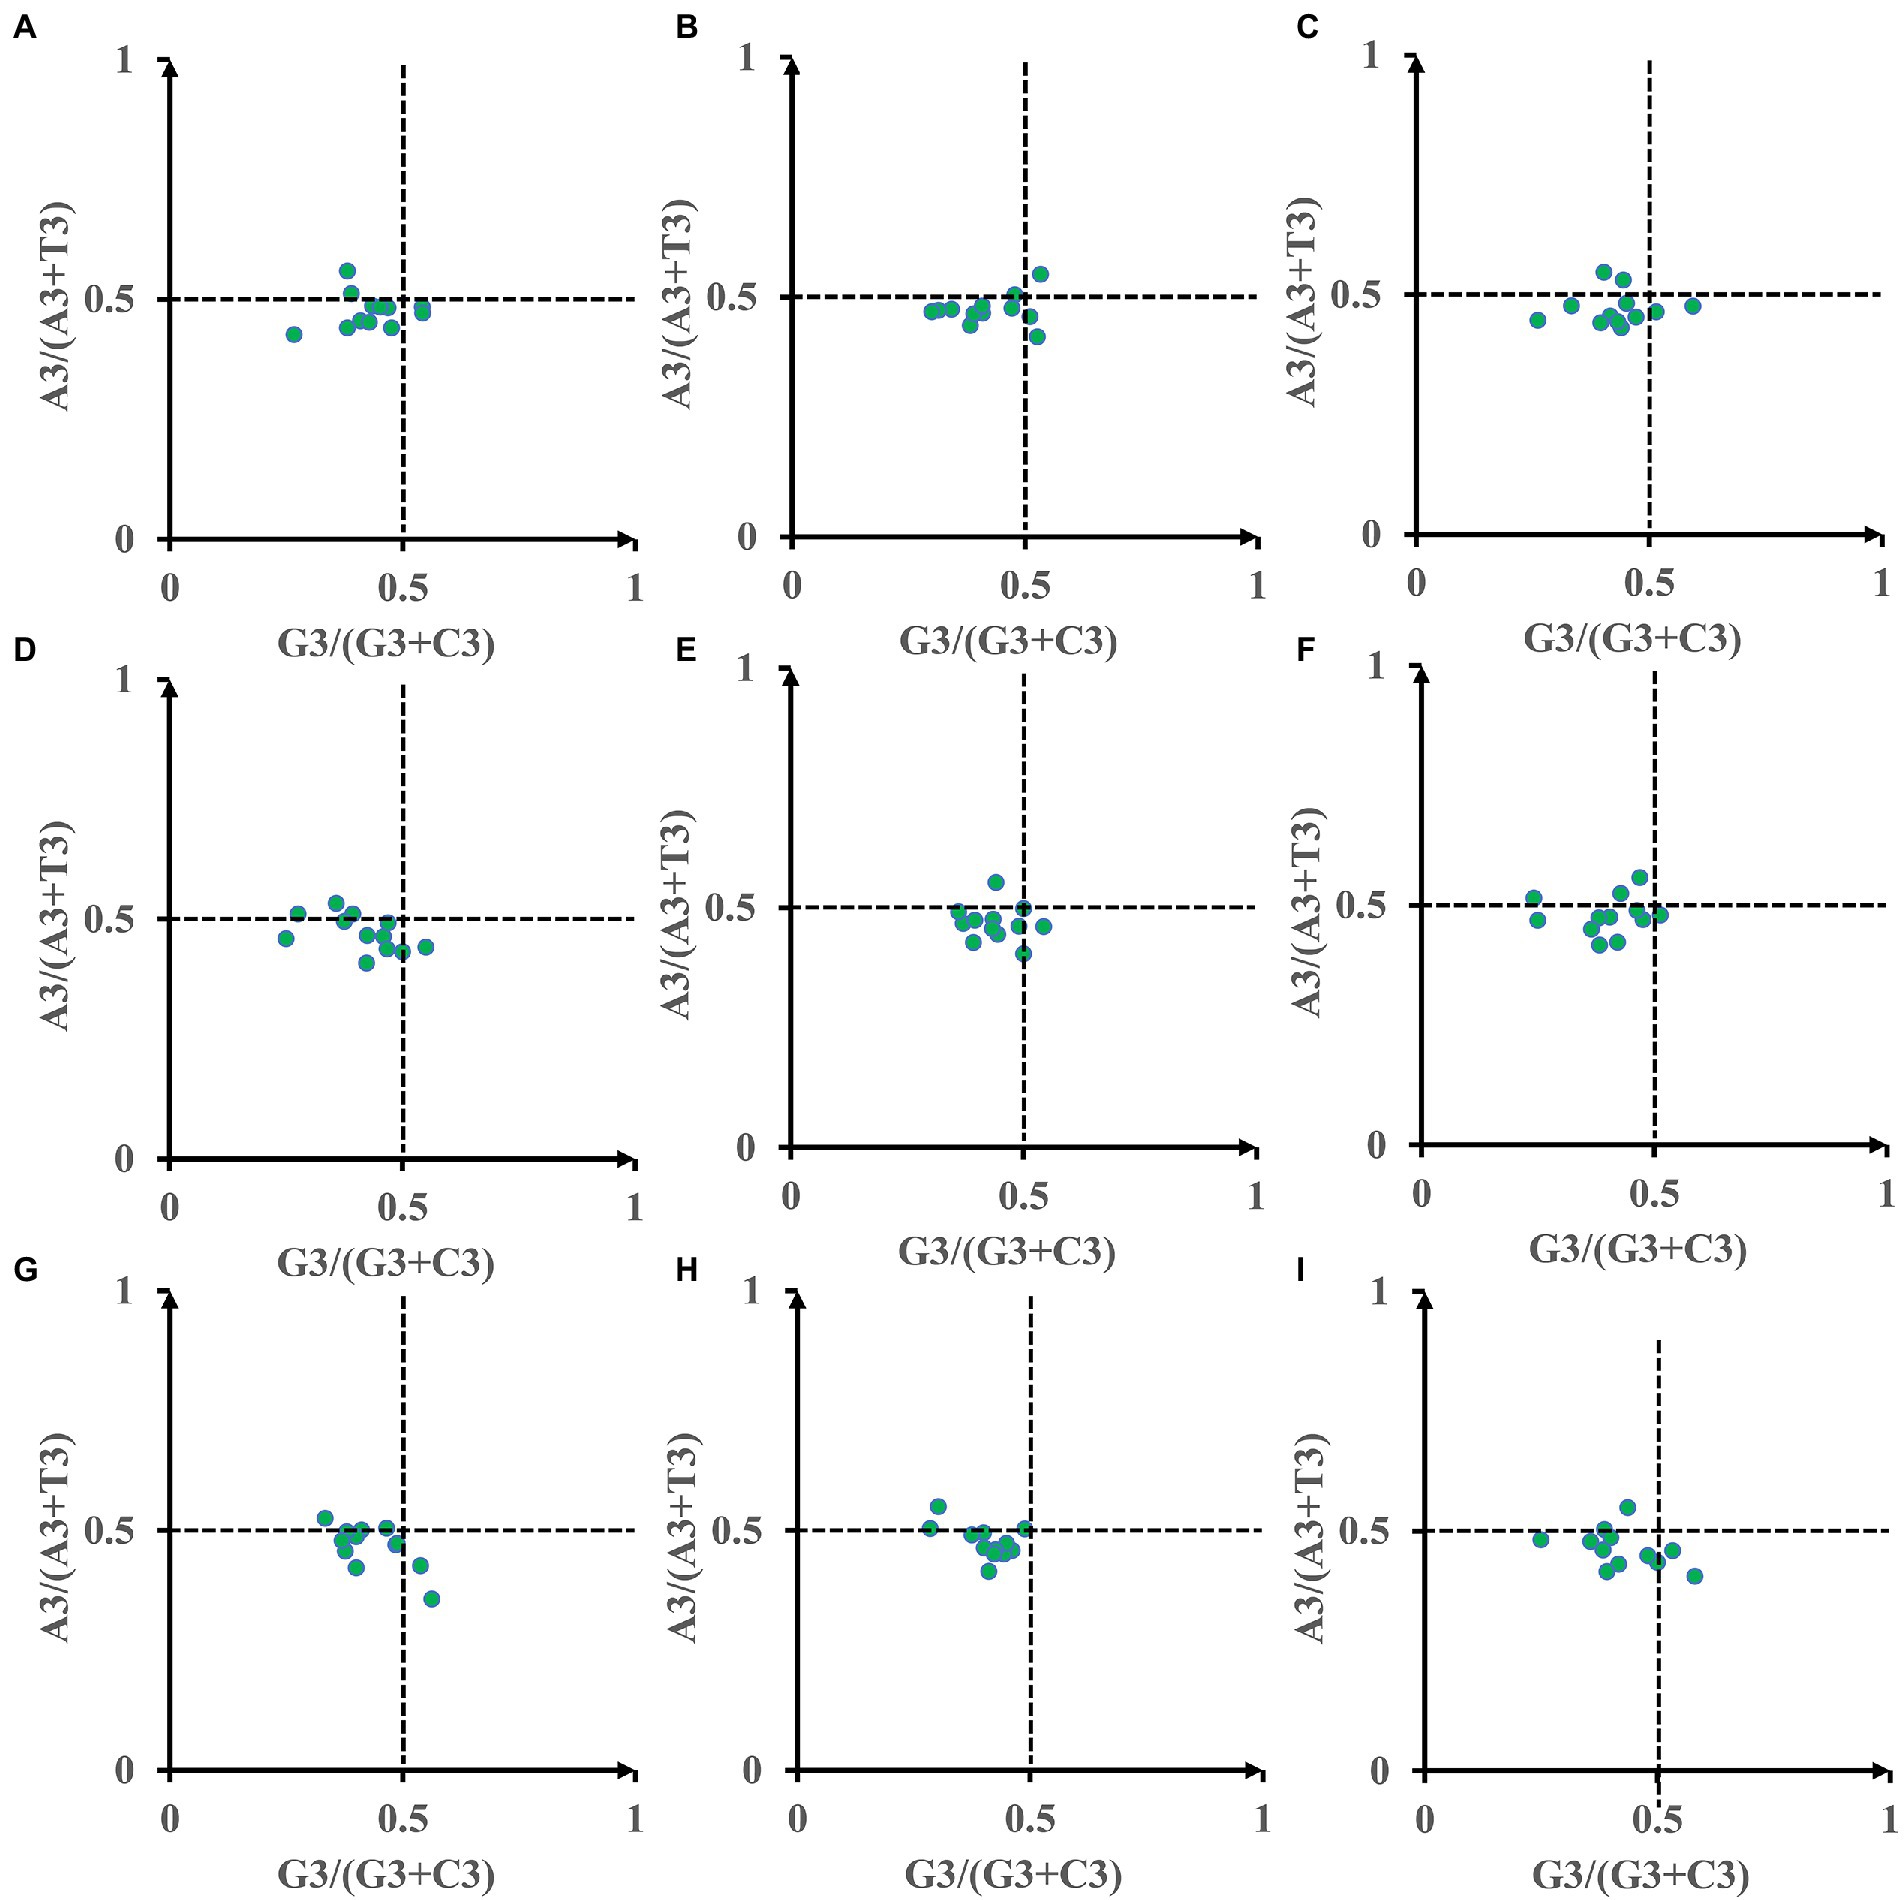
Figure 5. Parity Rule 2 (PR2) plot analysis of 12 core PCGs in 9 Amanita species. (A), A. basii; (B), A. bisporigera; (C), A. brunnescens; (D), A. muscaria; (E), A. phalloides; (F), A. pseudoporphyria; (G), A. sinensis; (H), A. inopinata; and (I), A. thiersii.
Correspondence analysis
We performed a correspondence analysis based on the RSCU values of mitochondrial genes from nine Amanita species (Figure 6). Axis 1, Axis 2, Axis 3, and Axis 4 are the main contributors to variance, with average contribution rates of 38.61, 16.45, 9.89, and 7.90%, respectively. Among them, Axis 1 is considered to be the largest contributor to variance. We further analyzed the correlation between Axis 1 and GC, GC3s, ENC, CAI, CBI, and FOP. Among the nine Amanita species, Axis 1 was found to be significantly correlated with CAI, CBI, FOP, GC, and GC3s (p < 0.05), indicating that multiple factors jointly affected the base bias of Amanita. In addition, we found that the rps3 gene and other core PCGs showed large variation, indicating the differentiation of synonymous codon usage of core PCGs.
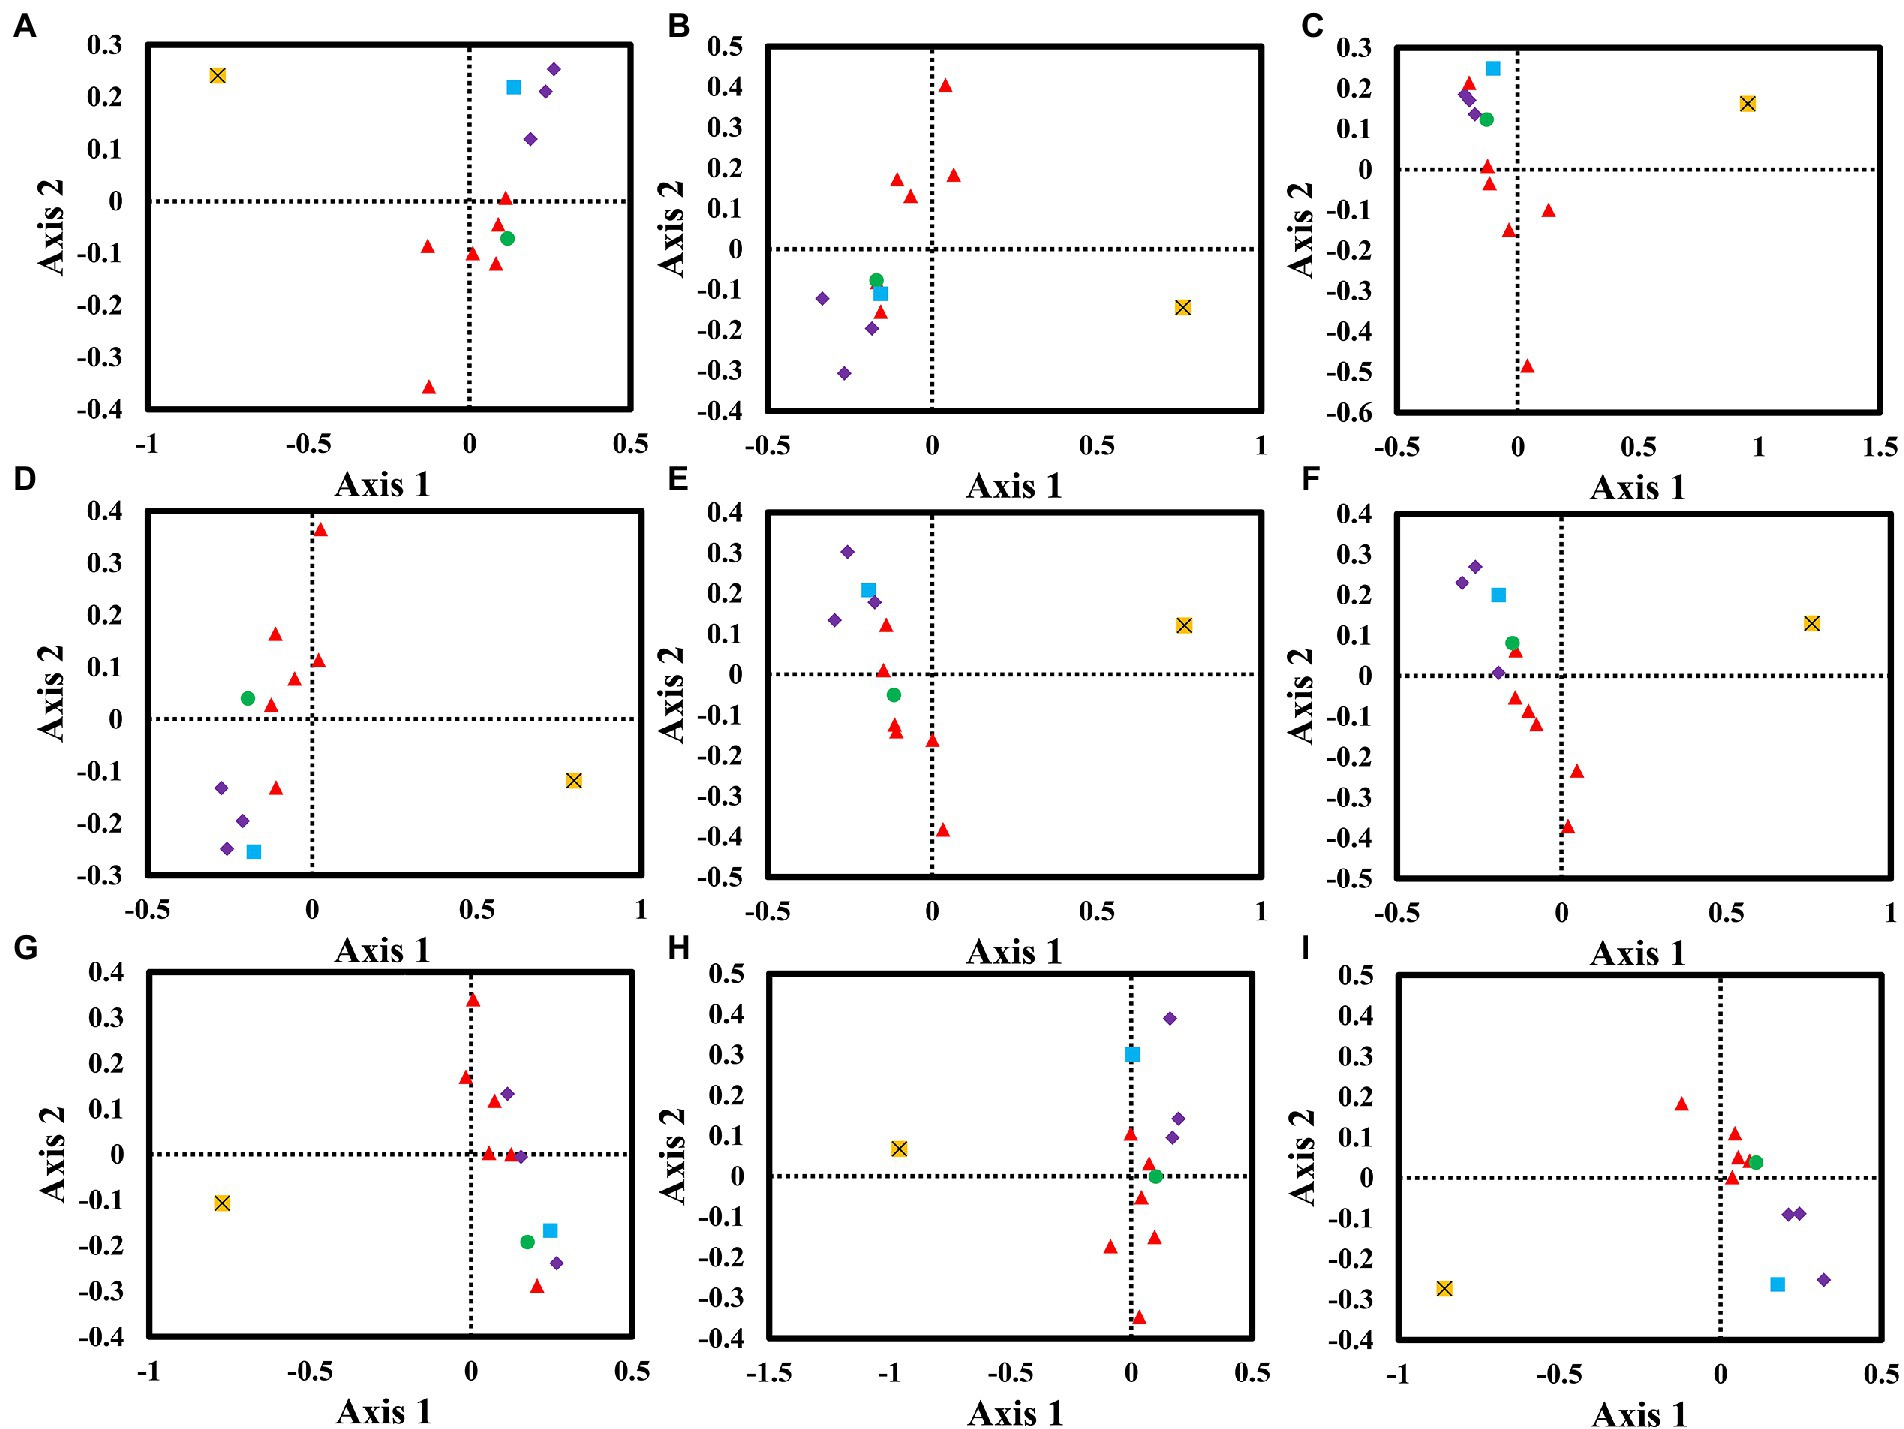
Figure 6. Correspondence analysis (COA) based on the relative synonymous codon usage (RSCU) values of 12 mitochondrial genes from nine Amanita species. Purple represents the cox gene, red represents the nad gene, green represents the atp6 gene, blue represents the cob gene, and yellow represents the rps3 gene. (A), A. basii; (B), A. bisporigera; (C), A. brunnescens; (D), A. muscaria; (E), A. phalloides; (F), A. pseudoporphyria; (G), A. sinensis; (H), A. inopinata; and (I), A. thiersii.
Optimal codon determination of Amanita mitogenomes
RSCU analysis found that seven of the nine Amanita species contained 29 high-frequency codons, including A. basii, A. bisporigera, A. phalloides, A. pseudoporphyria, A. sinensis, A. inopinata, and A. thiersii (Figure 7). In addition, two Amanita species, A. brunnescens, and A. muscaria, both contain 28 high-frequency codons because of their RSCU values >1. GCA and CCA are used at a high frequency in other Amanita species but they are used at a low frequency in A. brunnescens and A. muscaria. Among the 29 frequently used codons of Amanita, 14 end with T, 13 end with A, and only 2 end with G, indicating that Amanita mitochondrial codons tend to end with A/T. In addition, we detected 21, 19, 26, 17, 29, 18, 22, 20, and 26 highly expressed codons (ΔRSCU > 0.08) in nine Amanita species: A. basii, A. bisporigera, A. brunnescens, A. muscaria, A. phalloides, A. pseudoporphyria, A. sinensis, A. inopinata, and A. thiersii, respectively. The comparative analysis showed that 10, 7, 5, 8, 7, 8, 10, 8, and 9 optimal codons (ΔRSCU > 0.08 and RSCU > 1) were identified in A. basii, A. bisporigera, A. brunnescens, A. muscaria, A. phalloides, A. pseudoporphyria, A. sinensis, A. inopinata, and A. thiersii, respectively (Figure 8). Most of these optimal codons end with A/T, with the exception of UGG. Among the optimal codons, GCA and AUU are the most widely used, being the optimal codons of 7 Amanita species, followed by CCA and GUU, which are used as the optimal codons of 6 Amanita species. In addition, GCU, GAA, AUA, UUA, CCU, AGU, UAA, and GUA are each only used as the optimal codons of one species of Amanita.
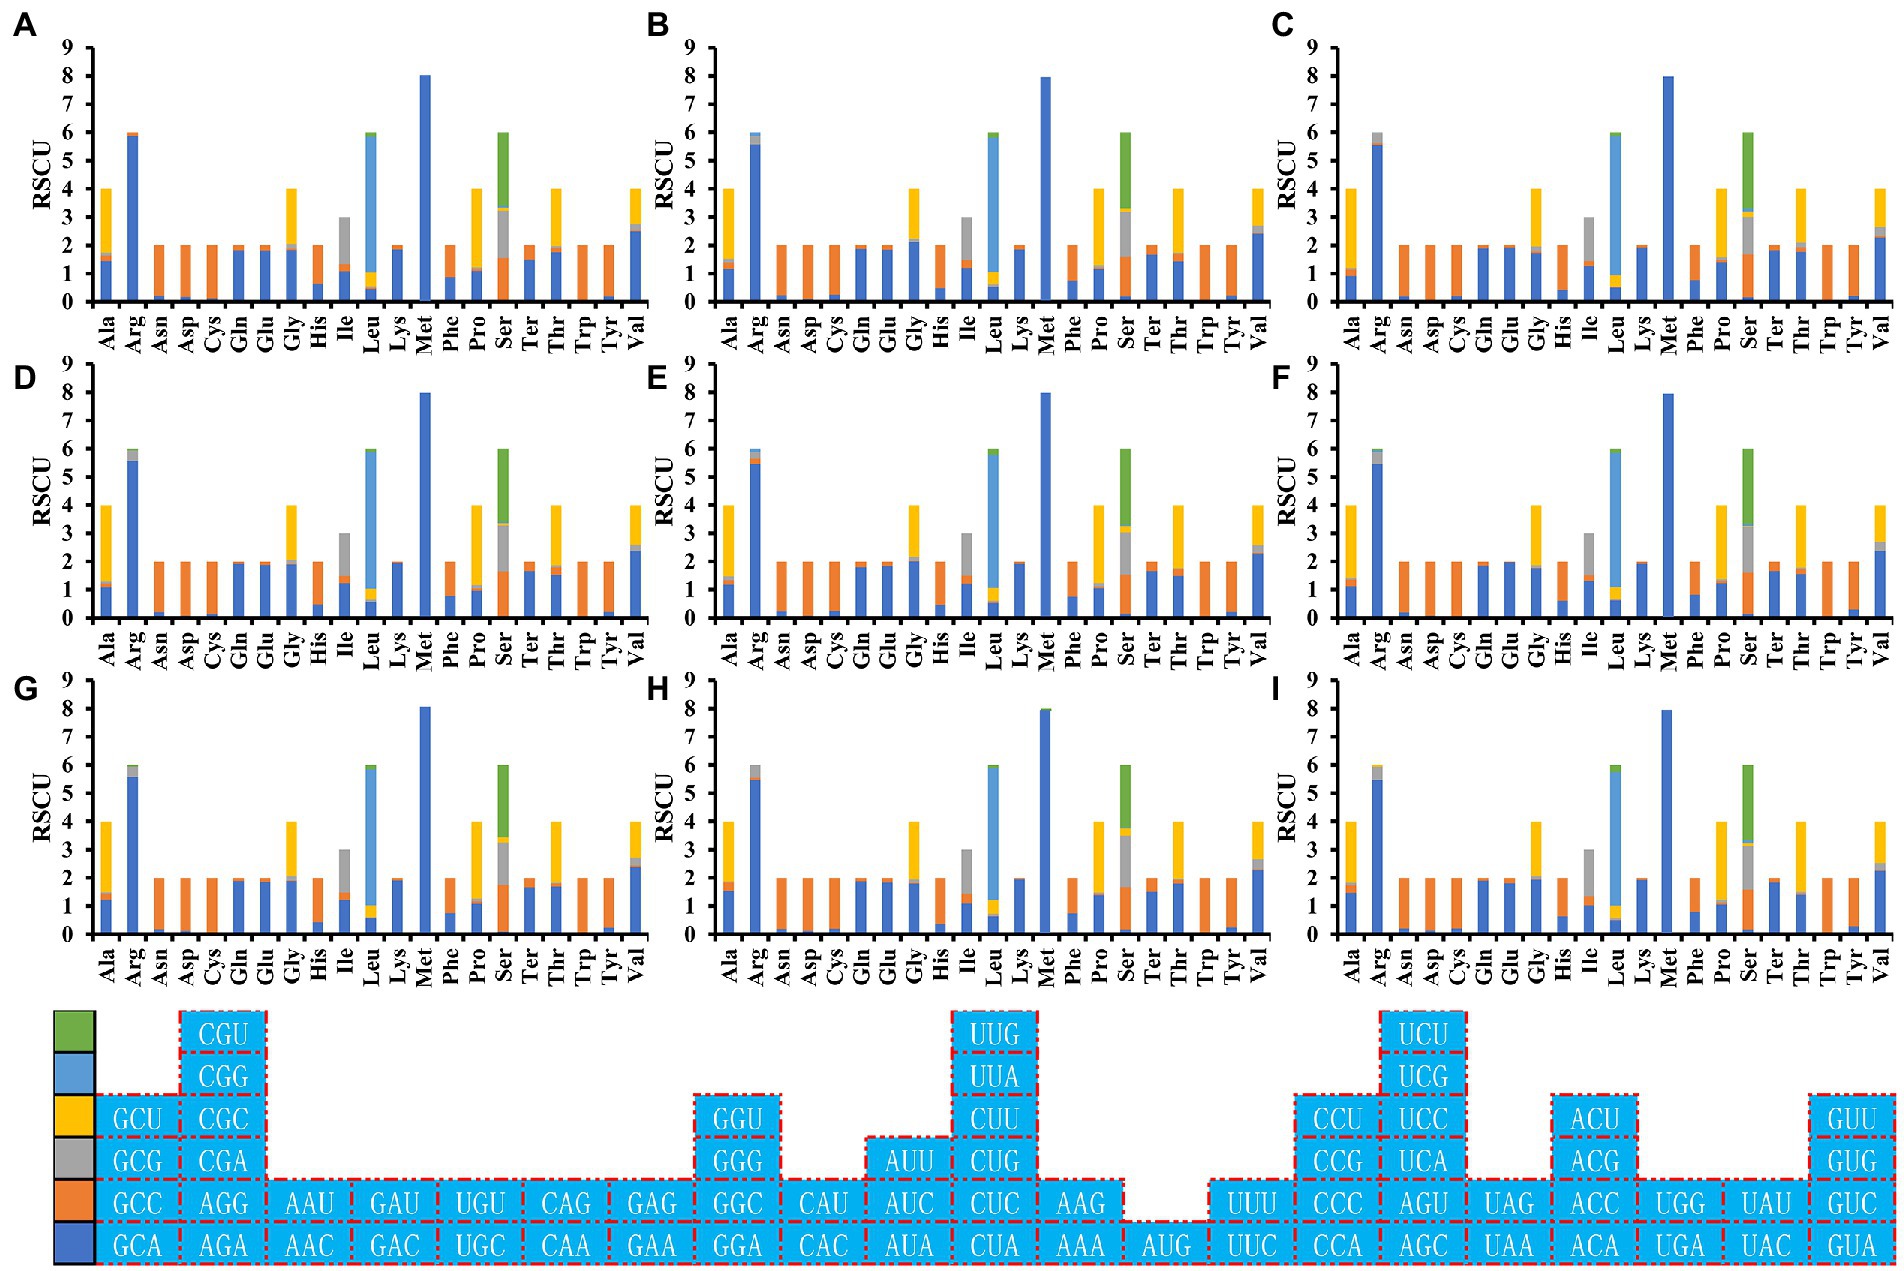
Figure 7. Relative synonymous codon usage (RSCU) analysis of 12 mitochondrial genes from nine Amanita species. (A), A. basii; (B), A. bisporigera; (C), A. brunnescens; (D), A. muscaria; (E), A. phalloides; (F), A. pseudoporphyria; (G), A. sinensis; (H), A. inopinata; and (I), A. thiersii.
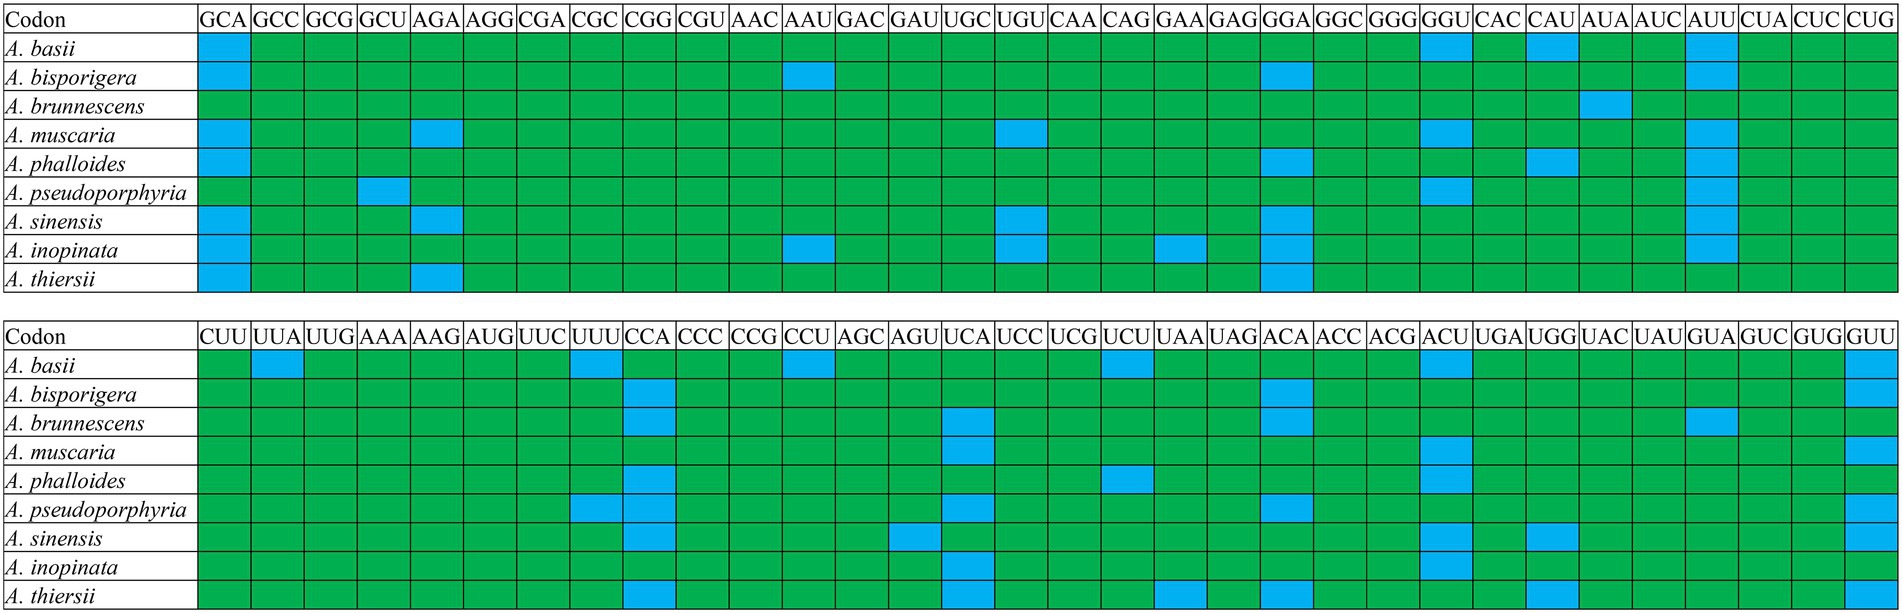
Figure 8. Optimal codons of nine Amanita species (ΔRSCU > 0.08 and RSCU > 1), which are marked in blue.
Phylogenetic analysis
We used the Bayesian inference (BI) method to construct phylogenetic trees of nine Amanita species based on the combined mitochondrial gene set (Figure 9). The results showed that the two saprophytic Amanita species, A. thiersii and A. inopinata, were separated from the Amanita population earlier. The symbiotic Amanita species can be divided into two main evolutionary clades, where A. basii, A. muscaria, and A. sinensis are one evolutionary clade, while A. bisporigera, A. phalloides, A. brunnescens, and A. pseudoporphyria are the other (Figure 9A). Compared with the phylogenetic relationship based on sequences, the species relationship inferred based on RSCU has some differences, such as the phylogenetic status of A. pseudoporphyria, A. thiersii, A. basii, and A. brunnescens (Figure 9B). However, the RSCU-based species relationship status also clearly shows the close relationship between A. bisporigera and A. phalloides, as well as that between A. muscaria and A. sinensis.
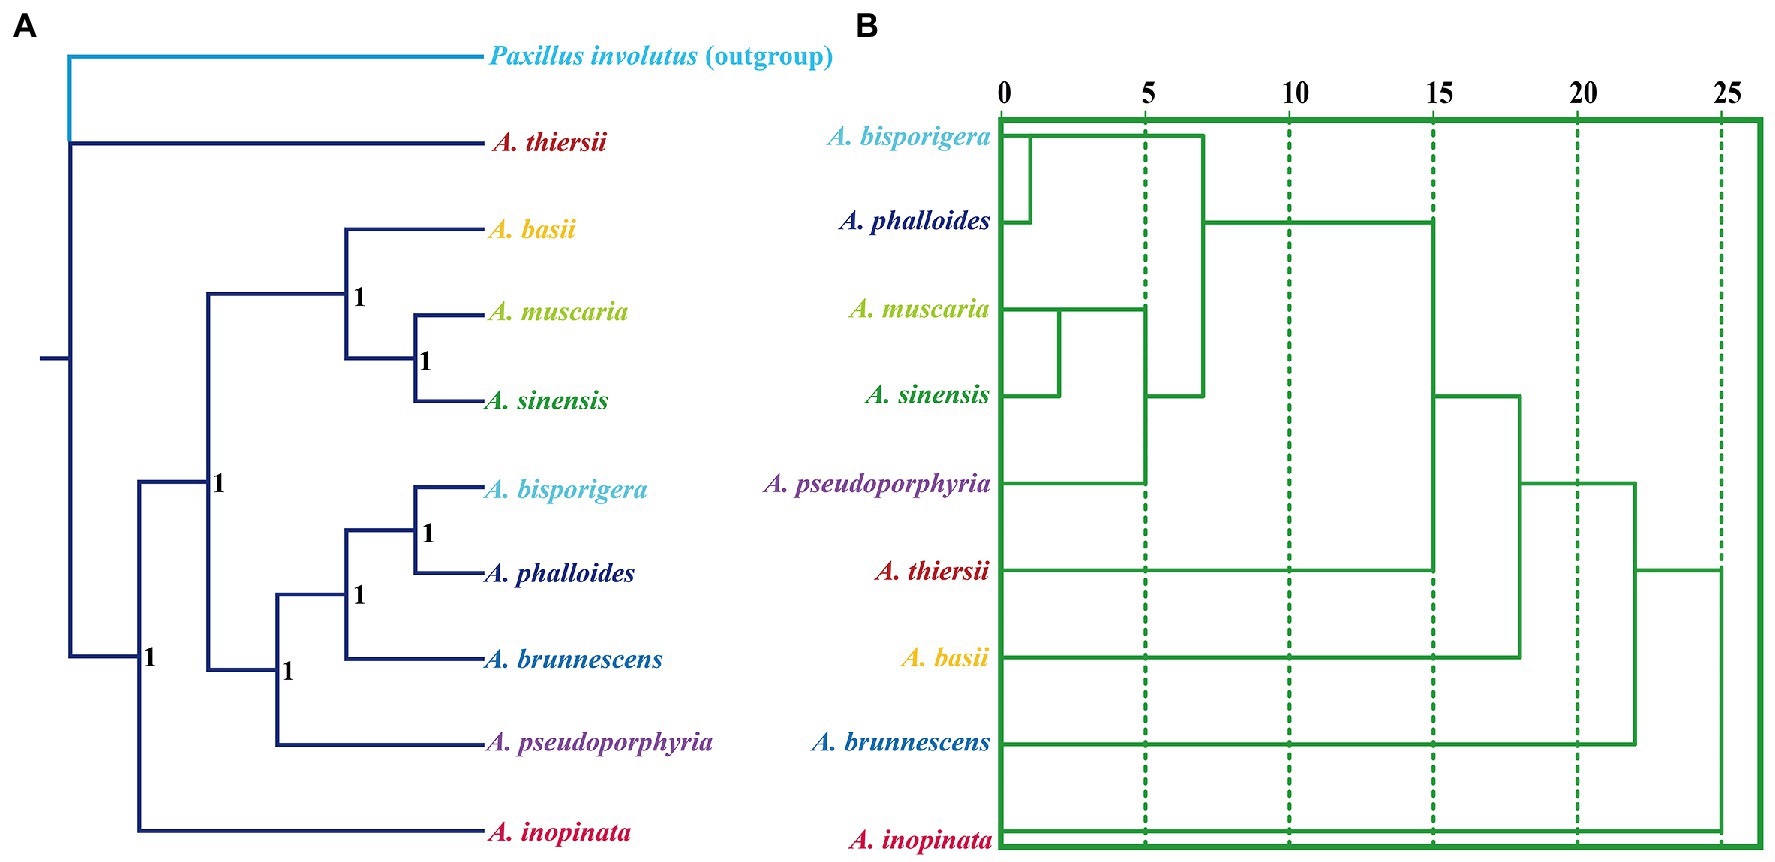
Figure 9. Relationship inference of different Amanita species based on the Bayesian inference (BI) (A) method and relative synonymous codon usage (RSCU) hierarchical clustering (B). The Bayesian posterior probabilities (BPP) value is displayed on the nodes of the clades.
Discussion
With the development of sequencing technology, researchers can obtain the genetic sequences of various species and types of genomes, including the nuclear genome, chloroplast genome, and mitochondrial genome (Chakraborty et al., 2020; Bao et al., 2022; Tu et al., 2022; Bao et al., 2023). In the process of analyzing the genetic information of species, researchers have found that the probability of synonymous codons of different species being used is not always equal. Some synonymous codons are used more frequently, while some codons are used less frequently (Liu et al., 2020). Codon use bias is mainly affected by many factors, including gene base composition, gene length, gene expression level, tRNA abundance, amino acid hydrophobicity, aromaticity, mutation, and selection, among which mutation and selection are the most important factors affecting codon use bias (Trotta, 2013; Chen et al., 2014). Analyzing the codon bias characteristics and variations of different species is helpful to understanding the genetic structure and evolution trend of species (Yang et al., 2021; Yu et al., 2021). Optimal codon analysis can also provide reference for the genetic expression of host genes. However, to date, the characteristics of codon usage for important organelle genomes of higher fungi have not been fully understood.
The mitochondrial genome is called the “second genome” of eukaryotes. In this study, we found that the length and base composition of mitochondrial core PCGs of different Amanita species showed large variations, indicating the differentiation of Amanita mitochondrial genes. The difference in synonymous codons is mainly reflected in the difference in the third codon. In this study, we found that all core PCGs of Amanita species tend to end with A/T, which is consistent with the rule of mitochondrial codon usage in many eukaryotes (Mazumder et al., 2021; Montana-Lozano et al., 2023). Most high-frequency codons parsed by RSCU also end with A/T, which further proves the tendency of using the third codon of Amanita. Different species and genes also show differences in base usage. In addition, we also detected the correlation between codon base composition and CAI, CBI, and FOP, indicating the influence of base composition on codon bias. An ENC value lower than 35 indicates a strong codon preference (Prabha et al., 2017; Pepe and Keersmaecker, 2020). In this study, we found that the average ENC of mitochondrial core PCGs of Amanita is 30.81, which demonstrates the strong codon preference of mitochondrial core PCGs of Amanita. In addition, the expected ENC value was significantly different from the actual ENC value (17.70–20.65%). The neutrality plot analysis and PR2-Bias plot analysis further demonstrated that natural selection plays an important role in Amanita codon bias. The results showed that despite some differences in codon usage indicators among different Amanita species, their common point was that mitochondrial PCGs were affected by strong natural selection, which was consistent with the results observed in the mitochondrial genomes of other species.
Mitochondria are believed to have been obtained from alphaproteobacteria by the ancestors of eukaryotes through endosymbiosis (Lang et al., 1999). During the long-term evolution of eukaryotes, most mitochondrial genes have been transferred to the nuclear genome (Adams and Palmer, 2003). At present, most eukaryotes only retain some core PCGs, some tRNA genes and rRNA genes shared by most eukaryotes (Bullerwell et al., 2000; Costa et al., 2012). The mitochondrial genome is considered a powerful tool for inferring the phylogenetic relationships of species because of its advantages (Li et al., 2015, 2022; Johri et al., 2019), including single-parent inheritance, containing many available molecular markers, independent of the origin of the nuclear genome, unique evolution rate, etc. In this study, we analyzed the genetic relationship of different Amanita species based on the combined mitochondrial gene set, and each evolutionary clade had a high support rate, indicating the reliability of analyzing fungal phylogenetic relationships based on mitochondrial genetic sequences. In addition, based on the RSCU values of different species, we constructed the relationship between different Amanita and found that the relationship between different species based on RSCU was different from the sequence-based relationships. However, the genetic relationship between some species was correctly interpreted according to the RSCU value, which was consistent with other studies (Crane et al., 2021; Gupta et al., 2021). The results show that the phylogenetic results based on RSCU can be an important supplement to the phylogenetic results based on sequence. In conclusion, this study analyzed the base bias characteristics of different Amanita species and core mitochondrial PCGs and increased the understanding of codon usage characteristics and genetic evolution of this higher fungal group.
Data availability statement
The original contributions presented in the study are included in the article/Supplementary material, further inquiries can be directed to the corresponding authors.
Author contributions
QL: conceived and designed experiments and wrote and reviewed the paper. YL, AS, WX, ZX, JH, and XC: analyzed the data. LZ and LP: project management. All authors contributed to the article and approved the submitted version.
Conflict of interest
The authors declare that the research was conducted in the absence of any commercial or financial relationships that could be construed as a potential conflict of interest.
Publisher’s note
All claims expressed in this article are solely those of the authors and do not necessarily represent those of their affiliated organizations, or those of the publisher, the editors and the reviewers. Any product that may be evaluated in this article, or claim that may be made by its manufacturer, is not guaranteed or endorsed by the publisher.
Supplementary material
The Supplementary material for this article can be found online at: https://www.frontiersin.org/articles/10.3389/fmicb.2023.1134228/full#supplementary-material
References
Adams, K. L., and Palmer, J. D. (2003). Evolution of mitochondrial gene content: gene loss and transfer to the nucleus. Mol. Phylogenet. Evol. 29, 380–395. doi: 10.1016/S1055-7903(03)00194-5
Akashi, H. (1997). Codon bias evolution in drosophila. Population genetics of mutation-selection drift. Gene 205, 269–278. doi: 10.1016/S0378-1119(97)00400-9
Araujo, D. S., De-Paula, R. B., Tome, L. M. R., Quintanilha-Peixoto, G., Salvador-Montoya, C. A., Del-Bem, L. E., et al. (2021). Comparative mitogenomics of Agaricomycetes: diversity, abundance, impact and coding potential of putative open-reading frames. Mitochondrion 58, 1–13. doi: 10.1016/j.mito.2021.02.002
Arella, D., Dilucca, M., and Giansanti, A. (2021). Codon usage bias and environmental adaptation in microbial organisms. Mol. Gen. Genomics. 296, 751–762. doi: 10.1007/s00438-021-01771-4
Bailey, S. F., Alonso Morales, L. A., and Kassen, R. (2021). Effects of synonymous mutations beyond codon bias: the evidence for adaptive synonymous substitutions from microbial evolution experiments. Genome Biol. Evol. 13:evab141. doi: 10.1093/gbe/evab141
Bao, Z., Feng, H., Tu, W., Li, L., and Li, Q. (2022). Method and mechanism of chromium removal from soil: a systematic review. Environ. Sci. Pollut. Res. Int. 29, 35501–35517. doi: 10.1007/s11356-022-19452-z
Bao, Z., Wang, X., Wang, Q., Zou, L., Peng, L., Li, L., et al. (2023). A novel method of domestication combined with ARTP to improve the reduction ability of bacillus velezensis to Cr(VI). J. Environ. Chem. Eng. 11:109091. doi: 10.1016/j.jece.2022.109091
Barbhuiya, P. A., Uddin, A., and Chakraborty, S. (2020). Analysis of compositional properties and codon usage bias of mitochondrial CYB gene in anura, urodela and gymnophiona. Gene 751:144762. doi: 10.1016/j.gene.2020.144762
Behura, S. K., and Severson, D. W. (2012). Comparative analysis of codon usage bias and codon context patterns between dipteran and hymenopteran sequenced genomes. PLoS One 7:e43111. doi: 10.1371/journal.pone.0043111
Behura, S. K., and Severson, D. W. (2013). Codon usage bias: causative factors, quantification methods and genome-wide patterns: with emphasis on insect genomes. Biol. Rev. Camb. Philos. Soc. 88, 49–61. doi: 10.1111/j.1469-185X.2012.00242.x
Biswas, K. K., Palchoudhury, S., Chakraborty, P., Bhattacharyya, U. K., Ghosh, D. K., Debnath, P., et al. (2019). Codon usage bias analysis of citrus tristeza virus: higher codon adaptation to Citrus reticulata host. Viruses 11:331. doi: 10.3390/v11040331
Boore, J. L. (1999). Animal mitochondrial genomes. Nucleic Acids Res. 27, 1767–1780. doi: 10.1093/nar/27.8.1767
Bu, Y., Wu, X., Sun, N., Man, Y., and Jing, Y. (2021). Codon usage bias predicts the functional MYB10 gene in Populus. J. Plant Physiol. 265:153491. doi: 10.1016/j.jplph.2021.153491
Bullerwell, C. E., Burger, G., and Lang, B. F. (2000). A novel motif for identifying rps3 homologs in fungal mitochondrial genomes. Trends Biochem. Sci. 25, 363–365. doi: 10.1016/S0968-0004(00)01612-1
Cai, Q., Cui, Y. Y., and Yang, Z. L. (2016). Lethal Amanita species in China. Mycologia 108, 993–1009. doi: 10.3852/16-008
Chakraborty, S., Yengkhom, S., and Uddin, A. (2020). Analysis of codon usage bias of chloroplast genes in Oryza species: codon usage of chloroplast genes in Oryza species. Planta 252:67. doi: 10.1007/s00425-020-03470-7
Chatre, L., and Ricchetti, M. (2014). Are mitochondria the Achilles' heel of the kingdom fungi? Curr. Opin. Microbiol. 20, 49–54. doi: 10.1016/j.mib.2014.05.001
Chen, H., Sun, S., Norenburg, J. L., and Sundberg, P. (2014). Mutation and selection cause codon usage and bias in mitochondrial genomes of ribbon worms (Nemertea). PLoS One 9:e85631. doi: 10.1371/journal.pone.0085631
Choudhury, M. N., Uddin, A., and Chakraborty, S. (2018). Nucleotide composition and codon usage bias of SRY gene. Andrologia 50:e12787. doi: 10.1111/and.12787
Chu, D., and Wei, L. (2021). Direct in vivo observation of the effect of codon usage bias on gene expression in Arabidopsis hybrids. J. Plant Physiol. 265:153490. doi: 10.1016/j.jplph.2021.153490
Costa, G. G., Cabrera, O. G., Tiburcio, R. A., Medrano, F. J., Carazzolle, M. F., Thomazella, D. P., et al. (2012). The mitochondrial genome of Moniliophthora roreri, the frosty pod rot pathogen of cacao. Fungal Biol. 116, 551–562. doi: 10.1016/j.funbio.2012.01.008
Crane, A., Versoza, C. J., Hua, T., Kapoor, R., Lloyd, L., Mehta, R., et al. (2021). Phylogenetic relationships and codon usage bias amongst cluster K mycobacteriophages. G3 11:jkab291. doi: 10.1093/g3journal/jkab291
De Mares, M. C., Hess, J., Floudas, D., Lipzen, A., Choi, C., Kennedy, M., et al. (2015). Horizontal transfer of carbohydrate metabolism genes into ectomycorrhizal Amanita. New Phytol. 205, 1552–1564. doi: 10.1111/nph.13140
Dilucca, M., Cimini, G., Forcelloni, S., and Giansanti, A. (2021). Co-evolution between codon usage and protein-protein interaction in bacteria. Gene 778:145475. doi: 10.1016/j.gene.2021.145475
Dilucca, M., Pavlopoulou, A., Georgakilas, A. G., and Giansanti, A. (2020). Codon usage bias in radioresistant bacteria. Gene 742:144554. doi: 10.1016/j.gene.2020.144554
Franzo, G., Tucciarone, C. M., Legnardi, M., and Cecchinato, M. (2021). Effect of genome composition and codon bias on infectious bronchitis virus evolution and adaptation to target tissues. BMC Genomics 22:244. doi: 10.1186/s12864-021-07559-5
Gomez, M. M., de Mello Volotao, E., Assandri, I. R., Peyrou, M., and Cristina, J. (2020). Analysis of codon usage bias in potato virus Y non-recombinant strains. Virus Res. 286:198077. doi: 10.1016/j.virusres.2020.198077
Gupta, S., Paul, K., and Roy, A. (2021). Codon usage signatures in the genus Cryptococcus: a complex interplay of gene expression, translational selection and compositional bias. Genomics 113, 821–830. doi: 10.1016/j.ygeno.2020.10.013
Hershberg, R., and Petrov, D. A. (2008). Selection on codon bias. Annu. Rev. Genet. 42, 287–299. doi: 10.1146/annurev.genet.42.110807.091442
Hess, J., Skrede, I., De Mares, M. C., Hainaut, M., Henrissat, B., and Pringle, A. (2018). Rapid divergence of genome architectures following the origin of an ectomycorrhizal Symbiosis in the genus amanita. Mol. Biol. Evol. 35, 2786–2804. doi: 10.1093/molbev/msy179
Hess, J., Skrede, I., Wolfe, B. E., LaButti, K., Ohm, R. A., Grigoriev, I. V., et al. (2014). Transposable element dynamics among Asymbiotic and ectomycorrhizal amanita fungi. Genome Biol. Evol. 6, 1564–1578. doi: 10.1093/gbe/evu121
Hia, F., and Takeuchi, O. (2021). The effects of codon bias and optimality on mRNA and protein regulation. Cell. Mol. Life Sci. 78, 1909–1928. doi: 10.1007/s00018-020-03685-7
Hugaboom, M., Hatmaker, E. A., LaBella, A. L., and Rokas, A. (2023). Evolution and codon usage bias of mitochondrial and nuclear genomes in Aspergillus section Flavi. G3 (Bethesda). 13:jkac285. doi: 10.1093/g3journal/jkac285
Huo, X., Liu, S., Li, Y., Wei, H., Gao, J., Yan, Y., et al. (2021). Analysis of synonymous codon usage of transcriptome database in Rheum palmatum. PeerJ 9:e10450. doi: 10.7717/peerj.10450
Iriarte, A., Lamolle, G., and Musto, H. (2021). Codon usage bias: an endless tale. J. Mol. Evol. 89, 589–593. doi: 10.1007/s00239-021-10027-z
Johri, P., Marinov, G. K., Doak, T. G., and Lynch, M. (2019). Population genetics of paramecium mitochondrial genomes: recombination, mutation spectrum, and efficacy of selection. Genome Biol. Evol. 11, 1398–1416. doi: 10.1093/gbe/evz081
Katoh, K., Rozewicki, J., and Yamada, K. D. (2019). MAFFT online service: multiple sequence alignment, interactive sequence choice and visualization. Brief. Bioinform. 20, 1160–1166. doi: 10.1093/bib/bbx108
Kohler, A., Kuo, A., Nagy, L. G., Morin, E., Barry, K. W., Buscot, F., et al. (2015). Convergent losses of decay mechanisms and rapid turnover of symbiosis genes in mycorrhizal mutualists (vol 47, pg 410, 2015). Nat. Genet. 47, 410–415. doi: 10.1038/ng.3223
Kokate, P. P., Techtmann, S. M., and Werner, T. (2021). Codon usage bias and dinucleotide preference in 29 drosophila species. G3 11:jkab191. doi: 10.1093/g3journal/jkab191
Krasovec, M., and Filatov, D. A. (2019). Evolution of codon usage bias in diatoms. Genes 10:894. doi: 10.3390/genes10110894
LaBella, A. L., Opulente, D. A., Steenwyk, J. L., Hittinger, C. T., and Rokas, A. (2019). Variation and selection on codon usage bias across an entire subphylum. PLoS Genet. 15:e1008304. doi: 10.1371/journal.pgen.1008304
Lal, D., Verma, M., Behura, S. K., and Lal, R. (2016). Codon usage bias in phylum Actinobacteria: relevance to environmental adaptation and host pathogenicity. Res. Microbiol. 167, 669–677. doi: 10.1016/j.resmic.2016.06.003
Lanfear, R., Frandsen, P. B., Wright, A. M., Senfeld, T., and Calcott, B. (2017). Partition finder 2: new methods for selecting partitioned models of evolution for molecular and morphological phylogenetic analyses. Mol. Biol. Evol. 34, 772–773. doi: 10.1093/molbev/msw260
Lang, B. F., Gray, M. W., and Burger, G. (1999). Mitochondrial genome evolution and the origin of eukaryotes. Annu. Rev. Genet. 33, 351–397. doi: 10.1146/annurev.genet.33.1.351
Li, Q., Zhang, T., Li, L., Bao, Z., Tu, W., Xiang, P., et al. (2022). Comparative mitogenomic analysis reveals intraspecific, interspecific variations and genetic diversity of medical fungus Ganoderma. J. Fungi (Basel) 8:781. doi: 10.3390/jof8080781
Li, Q., Bao, Z., Tang, K., Feng, H., Tu, W., Li, L., et al. (2022a). First two mitochondrial genomes for the order Filobasidiales reveal novel gene rearrangements and intron dynamics of Tremellomycetes. IMA Fungus 13:7. doi: 10.1186/s43008-022-00094-2
Li, Q., He, X., Ren, Y., Xiong, C., Jin, X., Peng, L., et al. (2020). Comparative mitogenome analysis reveals mitochondrial genome differentiation in ectomycorrhizal and asymbiotic Amanita species. Front. Microbiol. 11:1382. doi: 10.3389/fmicb.2020.01382
Li, Q., Li, L., Zhang, T., Xiang, P., Wu, Q., Tu, W., et al. (2022b). The first two mitochondrial genomes for the genus Ramaria reveal mitochondrial genome evolution of Ramaria and phylogeny of Basidiomycota. IMA Fungus 13:16. doi: 10.1186/s43008-022-00100-7
Li, H., Shao, R., Song, N., Song, F., Jiang, P., Li, Z., et al. (2015). Higher-level phylogeny of paraneopteran insects inferred from mitochondrial genome sequences. Sci. Rep. 5:8527. doi: 10.1038/srep08527
Li, Q., Wang, Q., Jin, X., Chen, Z., Xiong, C., Li, P., et al. (2019). Characterization and comparison of the mitochondrial genomes from two Lyophyllum fungal species and insights into phylogeny of Agaricomycetes. Int. J. Biol. Macromol. 121, 364–372. doi: 10.1016/j.ijbiomac.2018.10.037
Li, Q., Yang, M., Chen, C., Xiong, C., Jin, X., Pu, Z., et al. (2018). Characterization and phylogenetic analysis of the complete mitochondrial genome of the medicinal fungus Laetiporus sulphureus. Sci. Rep. 8:9104. doi: 10.1038/s41598-018-27489-9
Liu, H., Lu, Y., Lan, B., and Xu, J. (2020). Codon usage by chloroplast gene is bias in Hemiptelea davidii. J. Genet. 99:8. doi: 10.1007/s12041-019-1167-1
Mazumder, G. A., Uddin, A., and Chakraborty, S. (2021). Analysis of codon usage bias in mitochondrial CO gene among platyhelminthes. Mol. Biochem. Parasitol. 245:111410. doi: 10.1016/j.molbiopara.2021.111410
Montana-Lozano, P., Balaguera-Reina, S. A., and Prada-Quiroga, C. F. (2023). Comparative analysis of codon usage of mitochondrial genomes provides evolutionary insights into reptiles. Gene 851:146999. doi: 10.1016/j.gene.2022.146999
Osiewacz, H. D. (2002). Aging in fungi: role of mitochondria in Podospora anserina. Mech. Ageing Dev. 123, 755–764. doi: 10.1016/S0047-6374(01)00421-3
Palidwor, G. A., Perkins, T. J., and Xia, X. (2010). A general model of codon bias due to GC mutational bias. PLoS One 5:e13431. doi: 10.1371/journal.pone.0013431
Parvathy, S. T., Udayasuriyan, V., and Bhadana, V. (2022). Codon usage bias. Mol. Biol. Rep. 49, 539–565. doi: 10.1007/s11033-021-06749-4
Pepe, D., and Keersmaecker, K. D. E. (2020). Codon bias analyses on thyroid carcinoma genes. Minerva Endocrinol. 45, 295–305. doi: 10.23736/S0391-1977.20.03252-6
Poliseno, A., Feregrino, C., Sartoretto, S., Aurelle, D., Worheide, G., McFadden, C. S., et al. (2017). Comparative mitogenomics, phylogeny and evolutionary history of Leptogorgia (Gorgoniidae). Mol. Phylogenet. Evol. 115, 181–189. doi: 10.1016/j.ympev.2017.08.001
Prabha, R., Singh, D. P., Sinha, S., Ahmad, K., and Rai, A. (2017). Genome-wide comparative analysis of codon usage bias and codon context patterns among cyanobacterial genomes. Mar. Genomics 32, 31–39. doi: 10.1016/j.margen.2016.10.001
Puigbo, P., Bravo, I. G., and Garcia-Vallve, S. (2008). CAIcal: a combined set of tools to assess codon usage adaptation. Biol. Direct 3:38. doi: 10.1186/1745-6150-3-38
Qian, L., Wang, H., Yan, J., Pan, T., Jiang, S., Rao, D., et al. (2018). Multiple independent structural dynamic events in the evolution of snake mitochondrial genomes. BMC Genomics 19:354. doi: 10.1186/s12864-018-4717-7
Quax, T. E., Claassens, N. J., Soll, D., and van der Oost, J. (2015). Codon bias as a means to fine-tune gene expression. Mol. Cell 59, 149–161. doi: 10.1016/j.molcel.2015.05.035
Rao, Y., Wu, G., Wang, Z., Chai, X., Nie, Q., and Zhang, X. (2011). Mutation bias is the driving force of codon usage in the Gallus gallus genome. DNA Res. 18, 499–512. doi: 10.1093/dnares/dsr035
Ronquist, F., Teslenko, M., van der Mark, P., Ayres, D. L., Darling, A., Hohna, S., et al. (2012). MrBayes 3.2: efficient Bayesian phylogenetic inference and model choice across a large model space. Syst. Biol. 61, 539–542. doi: 10.1093/sysbio/sys029
Sankoff, D., Leduc, G., Antoine, N., Paquin, B., Lang, B. F., and Cedergren, R. (1992). Gene order comparisons for phylogenetic inference: evolution of the mitochondrial genome. Proc. Natl. Acad. Sci. U. S. A. 89, 6575–6579. doi: 10.1073/pnas.89.14.6575
Trotta, E. (2013). Selection on codon bias in yeast: a transcriptional hypothesis. Nucleic Acids Res. 41, 9382–9395. doi: 10.1093/nar/gkt740
Tu, W., Cao, X., Cheng, J., Li, L., Zhang, T., Wu, Q., et al. (2022). Chinese baijiu: the perfect works of microorganisms. Front. Microbiol. 13:919044. doi: 10.3389/fmicb.2022.919044
Uddin, A., Mazumder, T. H., Choudhury, M. N., and Chakraborty, S. (2015). Codon bias and gene expression of mitochondrial ND2 gene in chordates. Bioinformation 11, 407–412. doi: 10.6026/97320630011407
Vaidya, G., Lohman, D. L., and Meier, R. (2011). Sequence matrix: concatenation software for the fast assembly of multi-gene datasets with character set and codon information. Cladistics 27, 171–180. doi: 10.1111/j.1096-0031.2010.00329.x
Wang, B., Yuan, J., Liu, J., Jin, L., and Chen, J. Q. (2011). Codon usage bias and determining forces in green plant mitochondrial genomes. J. Integr. Plant Biol. 53, 324–334. doi: 10.1111/j.1744-7909.2011.01033.x
Wint, R., Salamov, A., and Grigoriev, I. V. (2022). Kingdom-wide analysis of fungal protein-coding and tRNA genes reveals conserved patterns of adaptive evolution. Mol. Biol. Evol. 39:msab372. doi: 10.1093/molbev/msab372
Wolfe, B. E., Kuo, M., and Pringle, A. (2012). Amanita thiersii is a saprotrophic fungus expanding its range in the United States. Mycologia 104, 22–33. doi: 10.3852/11-056
Wolfe, B. E., Tulloss, R. E., and Pringle, A. (2012). The irreversible loss of a decomposition pathway marks the single origin of an ectomycorrhizal symbiosis. PLoS One 7:e39597. doi: 10.1371/journal.pone.0039597
Xu, Y., Liu, K., Han, Y., Xing, Y., Zhang, Y., Yang, Q., et al. (2021). Codon usage bias regulates gene expression and protein conformation in yeast expression system P. pastoris. Microb. Cell Factories 20:91. doi: 10.1186/s12934-021-01580-9
Yang, C., Zhao, Q., Wang, Y., Zhao, J., Qiao, L., Wu, B., et al. (2021). Comparative analysis of genomic and transcriptome sequences reveals divergent patterns of codon bias in wheat and its ancestor species. Front. Genet. 12:732432. doi: 10.3389/fgene.2021.732432
Yao, H., Chen, M., and Tang, Z. (2019). Analysis of synonymous codon usage bias in Flaviviridae virus. Biomed. Res. Int. 2019:5857285. doi: 10.1155/2019/5857285
Ye, Y. Z., and Liu, Z. N. (2018). Management of Amanita phalloides poisoning: a literature review and update. J. Crit. Care 46, 17–22. doi: 10.1016/j.jcrc.2018.03.028
Keywords: codon usage, mitochondrial genome, evolution, genetics, natural selection
Citation: Li Q, Luo Y, Sha A, Xiao W, Xiong Z, Chen X, He J, Peng L and Zou L (2023) Analysis of synonymous codon usage patterns in mitochondrial genomes of nine Amanita species. Front. Microbiol. 14:1134228. doi: 10.3389/fmicb.2023.1134228
Edited by:
Georg Hausner, University of Manitoba, CanadaReviewed by:
Paula Luize Camargos Fonseca, Federal University of Minas Gerais, BrazilAbigail LaBella, University of North Carolina at Charlotte, United States
Copyright © 2023 Li, Luo, Sha, Xiao, Xiong, Chen, He, Peng and Zou. This is an open-access article distributed under the terms of the Creative Commons Attribution License (CC BY). The use, distribution or reproduction in other forums is permitted, provided the original author(s) and the copyright owner(s) are credited and that the original publication in this journal is cited, in accordance with accepted academic practice. No use, distribution or reproduction is permitted which does not comply with these terms.
*Correspondence: Lianxin Peng, cGVuZ2xpYW54aW5AY2R1LmVkdS5jbg==; Liang Zou, em91bGlhbmdAY2R1LmVkdS5jbg==
†Present address: Lianxin Peng and Liang Zou, School of Food and Biological Engineering, Chengdu University, Chengdu, Sichuan, China