 Xuan Jia
 ZhiXiang Yin*
 Yu Peng
- School of Mathematics, Physics and Statistics, Shanghai University of Engineering Science, Shanghai, China
Male infertility has always been one of the important factors affecting the infertility of couples of gestational age. The reasons that affect male infertility includes living habits, hereditary factors, etc. Identifying the genetic causes of male infertility can help us understand the biology of male infertility, as well as the diagnosis of genetic testing and the determination of clinical treatment options. While current research has made significant progress in the genes that cause sperm defects in men, genetic studies of sperm content defects are still lacking. This article is based on a dataset of gene expression data on the X chromosome in patients with azoospermia, mild and severe oligospermia. Due to the difference in the degree of disease between patients and the possible difference in genetic causes, common classical clustering methods such as k-means, hierarchical clustering, etc. cannot effectively identify samples (realize simultaneous clustering of samples and features). In this paper, we use machine learning and various statistical methods such as hypergeometric distribution, Gibbs sampling, Fisher test, etc. and genes the interaction network for cluster analysis of gene expression data of male infertility patients has certain advantages compared with existing methods. The cluster results were identified by differential co-expression analysis of gene expression data in male infertility patients, and the model recognition clusters were analyzed by multiple gene enrichment methods, showing different degrees of enrichment in various enzyme activities, cancer, virus-related, ATP and ADP production, and other pathways. At the same time, as this paper is an unsupervised analysis of genetic factors of male infertility patients, we constructed a simulated data set, in which the clustering results have been determined, which can be used to measure the effect of discriminant model recognition. Through comparison, it finds that the proposed model has a better identification effect.
1. Introduction
For a long time, infertility has been a difficult problem for many couples of gestational age. With the increase of life pressure, infertility is increasing every year. About 15% of gestational age couples suffer from infertility symptoms of varying degrees, of which about 50% are caused by male infertility (Dada et al., 2003). About 7% of men in the general population suffer from different degrees of infertility. The causes of male infertility are related to many influencing factors, including different diseases, genetics, living habits and other factors that may cause or interact to cause male infertility. Although men with this disorder cannot pass on their genetic information naturally, genetic factors can still contribute to male infertility. In approximately 15% of infertile men a genetic defect is most likely the underlying cause of the pathology (Tournaye et al., 2017; Krausz and Riera-Escamilla, 2018). For example, autosomal recessive or X-linked male infertility mutations transmitted by normal parents can cause infertility (Chillón et al., 1995; Yatsenko et al., 2015). Genetic causes have also been found to have an important role in severe male infertility, such as severe oligospermia (<5 million sperm cells per milliliter) or azoospermia (azoospermia in ejaculation; Lopes et al., 2013; Krausz and Riera-Escamilla, 2018). Identifying the genes responsible for male infertility is important for increasing our understanding of the biology of the disease and for genetic testing for diagnosis and clinical treatment. Genes such as NLRP3, BRD7 and others have been shown to affect male fertility (Aquila et al., 2004; Wang et al., 2016; Antonuccio et al., 2021). At the same time, with the rapid development of genetics, more than 3,000 genetic diseases have been discovered, of which about 250 are only found in men, and women have no or little disease. Because women have two X chromosomes, the pathogenic gene on one X chromosome can often be masked by the normal gene on the other X chromosome, so they do not show symptoms. Men, on the other hand, have only one X chromosome. If there is a disease-causing gene on it, there is no corresponding normal gene to cover up, resulting in the disease. In recent years, with the deepening of research, there are about 521 genes that cause male infertility in different forms (Xavier et al., 2021), many of which are related to the X chromosome, such as mouse androgen receptor gene mutation, through chain reaction mapping The X chromosome leads to infertility in mice (Lyon et al., 1970), and there is one more X chromosome in males, that is, the sex chromosome is XXY (Jacobs and Strong, 1959) and so on.
Many scholars have carried out various experimental methods to study the genetic causes of male infertility. Through RNA interference or knockout experiments, the gene cannot be expressed normally, and whether the target abnormality occurs in cells or individuals is observed, and whether the gene is related to the cause of the disease is detected. However, experimental methods are generally time-consuming, labor-intensive, and expensive, and experimental methods are generally designed in a targeted manner on the premise that the experimenter obtains genes that may have basic interference. Technological advances and methodological developments in genomics are critical for identifying genetic factors in male infertility.
In this paper, we use a data set covering all gene expression levels of the male X chromosome in the GEO database, the Gene Expression Omnibus (GEO), a public database that contains 659,203 gene sample data from 9,528 different platforms (Ron et al., 2002). And based on a variety of statistical methods and machine learning analysis of gene expression data of male infertility patients, to identify groups of interacting gene clusters that may contribute to male infertility of various phenotypes in various ways. Common hierarchical clustering, k-means and other clustering algorithms are clustering under the assumption that all samples have certain characteristics, and the cluster data of the identified clusters have the same characteristics in all samples. However, the expression of gene data is affected by different sampling individuals, different tissues of the same individual, etc., resulting in different expression of measured gene data in different samples, and common clustering algorithms cannot meet the identification of differential gene expression modules (implementation basis Partial samples of gene expression data to partition gene sample data). For the identification of differentially co-expressed modules, a biclustering algorithm can be used to screen functionally related genes, genes involved in the same pathway, and genes affected by the same drug or a pathological condition. The biclustering algorithm was first proposed in Hartigan (1972), is a two-dimensional data mining technique that allows simultaneous clustering of rows (representing genes) and columns (representing samples/conditions) in a gene expression matrix. Developments continued in the following decades, with (Cheng and Church, 2000; Lazzeroni and Owen, 2000; Bergmann et al., 2003; Kluger et al., 2003; Chiu et al., 2004; Prelić et al., 2006; Dhollander et al., 2007; Gu and Liu, 2008; Li et al., 2009; Hochreiter et al., 2010; Madeira et al., 2010; Medina et al., 2010; Chen et al., 2011; De Smet and Marchal, 2011; Zhao et al., 2011; Zhou et al., 2012; Goncalves and Madeira, 2014; Henriques and Madeira, 2016a,b; Alzahrani et al., 2017; Guo et al., 2021) being articles on different clustering algorithms. Among them, BCPlaid (Lazzeroni and Owen, 2000), QUBIC (Li et al., 2009), C&C (Cheng and Church, 2000), FABIA (Hochreiter et al., 2010) are the more popular biclustering algorithms. Genomics data analysis clustering using machine learning, deep learning, etc., for identifying cell subpopulations, genomic analysis, etc.(Jiang et al., 2020; Lazareva et al., 2020; Peng et al., 2020; Gerniers et al., 2021; Peng et al., 2021; Yi et al., 2021; Peng et al., 2022; Zhai et al., 2022). Analysis of bronchoalveolar immune cells in COVID-19 patients based on genetic data (Liao et al., 2020). By processing the GSE37948 data set (Krausz et al., 2012), which contains expression levels of gene data on the X chromosome in testicular tissue from patients with varying degrees of infertility, we identified 19 distinct double clusters, indicating the existence of multiple double clusters identified in this paper there are multiple enriched pathways and there are functional and organizational correlations between the enriched pathways. And the performance of the method is verified using a data set similar to the real gene expression level.
2. Materials and methods
2.1. Methods
Rank-rank hyper geometric overlap (RRHO; Plaisier et al., 2010) uses unsupervised learning to sort the gene expression profile data of two samples of different categories, and uses hyper geometric distribution to iteratively calculate the p-values of all combinations to find the optimal overlap gene combination. In this paper, the sample expression data of two different genes is brought into the RRHO method to find the optimal overlapping sample set, and the SNR value of the signal-to-noise ratio of the sample gene set is calculated to determine whether the clusters have differential expression. For a single gene in the sample set, the SNR value is defined as:
, are the mean in the delimited sample set and the mean in the data outside the sample set, respectively. , represent the standard deviation of the data in the corresponding set. The overall signal-to-noise ratio of the cluster is the average of the signal-to-noise ratios of individual genes in the sample set.
If the signal-to-noise ratio value of the identified sample and gene set is greater than the specified threshold, the set will be retained, and the corresponding genome is considered to have a relationship with the gene data. If one gene cannot form a relationship with other genes in the data, it will be discarded in the subsequent processing, so as to realize the dimensionality reduction processing of the gene data. However, since the genes known to be associated with disease from Ghiassian et al. (2015) form a compact but not tightly connected subgraph on the PPI, this paper does not loop through all the genes in the data set, but adds a gene interaction network to the data processing. Using the String database, there is known and predicted gene-protein interaction networks in the database. In this paper, the genes involved in the data set are searched for the interaction network, and the isolated gene points are discarded. The genes existing in the gene network are combined in pairs, and the hierarchical clustering method is used for preliminary clustering to assist in determining the default set signal-to-noise ratio threshold. The set of gene samples constructed by preliminary clustering is calculated as the average of the signal-to-noise ratio values in all sets, and 1/2 of this mean is used as the threshold. When the signal-to-noise ratio of the gene sample set constructed by the RRHO method is used. If the ratio is greater than this threshold, the gene is retained and a new set of double clusters is obtained. Otherwise, in the gene network, the connected edges are discarded. Due to the large number of genes, a partial gene network is shown in Figure 1. Figure 2 briefly depicts the model’s approach. The interrelation data of all genes are presented in Supplementary Table 1.
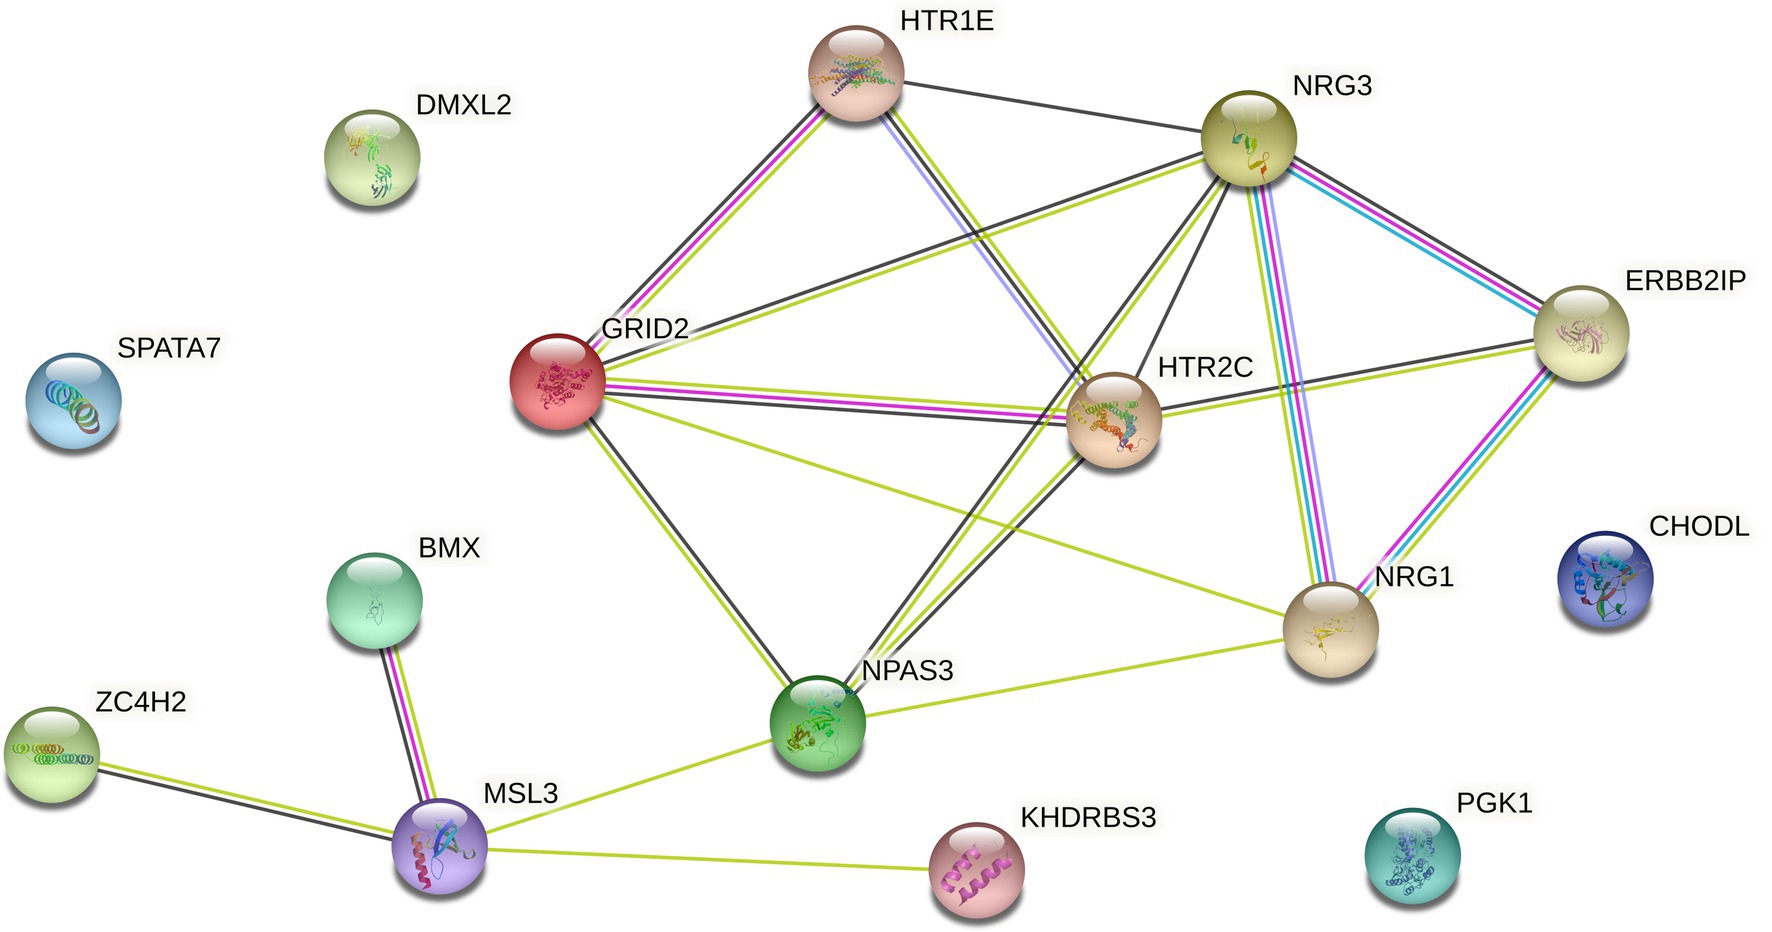
Figure 1. Interaction network of some genes in GDS37948.
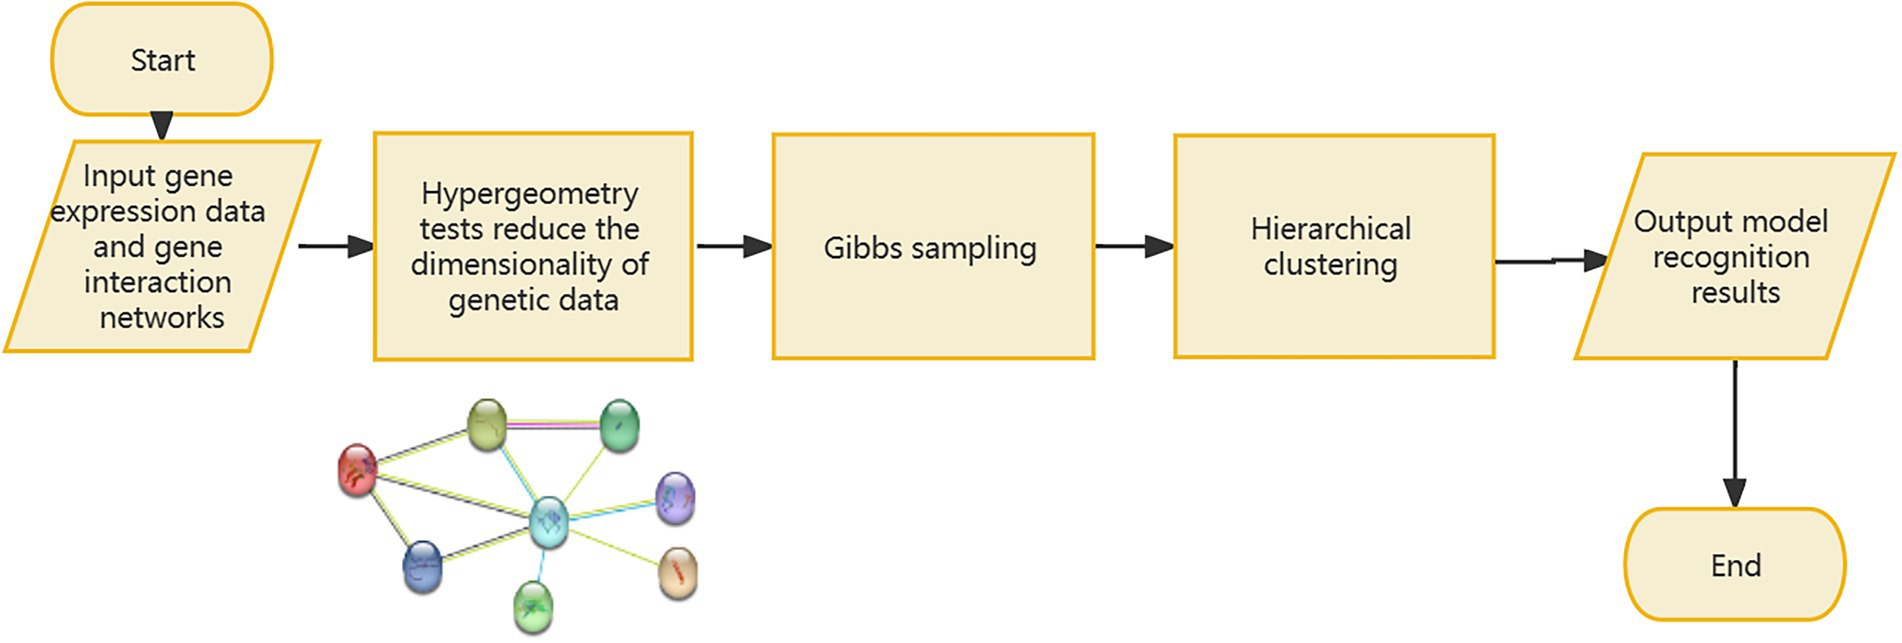
Figure 2. Introduction to the model process.
Since only gene pairs and their corresponding sample sets can be obtained after using the RRHO method, Gibbs sampling (Sheng et al., 2003) is used for the data processed in the first step to make assumptions about the distribution of gene sample data to merge gene clusters. The statistical assumptions for sampling are as following:
represents the gene, represents the sample, if the association exists after step 1, is assigned 1 else it is 0. represents which module the gene edge belongs to, through the calculation of the edge transition probability in Gibbs sampling:
Among them, k is set to the number of clusters retained after the calculation and processing of the RRHO method. Finally, the statistical part of Gibbs sampling assumes that the data has a certain prior distribution involving parameter α and β, but because the genetic data lacks the corresponding statistical research foundation, the parameter α and β are set as hyperparameters. At the end of data processing, Fisher’s exact test is used to process the calculated set data again, and the sample data in the two clusters are processed to calculate its value of p. The set threshold is used to determine whether there is a significant difference between the two sets, and the genes in the two sample sets without significant differences are merged, and the sample data of the corresponding gene is taken out and brought into the hierarchical clustering, and the number of clusters is 2. Since a gene is up-regulated in half of the samples, it will be differentially expressed in the remaining part, so, we limit samples in clusters to less than 55% of the total number of samples in the data set as a difference in the gene set. At the same time, in order to limit that the cluster is differentially expressed in the whole data, the SNR value of the newly formed cluster is required to be greater than the threshold value. Otherwise it will not be merged. All the identified clusters are merged cyclically until no new clusters are generated.
2.2. Datasets
2.2.1. Male infertility gene expression data
First, the corresponding gene expression data were obtained from the micro array gene expression database. In this paper, the GSE37948 (Krausz et al., 2012) gene expression data set was selected. This data set contains relevant gene expression data of 96 patients with different degrees of infertility, including 74 cases of azoospermia, 6 cases of mild oligozoospermia, and 16 cases of severe oligozoospermia. Excluding known causes of impairing spermatogenesis in patients, gene expression data identification was performed using testicular tissue from 47 men, and KNN nearest neighbor algorithm was used to impute missing values in gene expression profile data while normalizing data for each gene, to remove the effect of different units on the data. The GSE37948 data set contains 1855 genes and gene-identified expression data from 200 male sperm samples. The genes identified therein to cover the entire X chromosome. The related gene network based on the GSE37948 data set was extracted from the String database. Specific gene interaction data are shown in the Supplementary Table: Interrelation data among genes.
2.2.2. Synthetic datasets
Since the method in this paper belongs to unsupervised learning, there are no standard results for the study of male infertility-related genes, so we constructed simulation data similar in structure to GSE39748. The GSE37948 data set has a total of 1,855 genes and 200 samples, but the size of the double-cluster deletion is unknown. To this end, simulated data of 20 known differentially expressed modules were constructed with gene and sample dimensions of 2,000 and 200, respectively. Based on previous research (Prelić et al., 2006; Eren et al., 2013), we can generate simulation data according to the following rules: Genes and sample numbers are sampled from (100, 50, 20, 10, 5) and (100, 50, 20, 10) respectively, the data within the cluster is sampled from N (2, 1), and the rest of the data are sampled from N (0, 1) and allow the intersection of different clusters. Simulated data is used to determine hyperparameters and statistics are used to evaluate clustering results. Since the gene interaction network graph used in the gene data processing corresponds to the gene interaction graph with certain connectivity, we correspondingly construct the connected network graph according to the determined clustering data. Studies have shown that in the gene interaction network, genes related to disease can form compact linker maps (Ghiassian et al., 2015), so we use the method proposed in Bollobás et al. (2003) to construct the network diagram, which can construct a reasonable gene network connection map according to the clustering modules in the expression data.
3. Results
3.1. Experimental results of male infertility-related gene expression data
By processing the GSE37948 data set, which contains expression levels of gene data on the X chromosome in testicular tissue from patients with azoospermia, mild and severe oligozoospermia. We identified 19 distinct double clusters. There are multiple enriched pathways and there are functional and organizational correlations between the enriched pathways. The hypergeometric test involved in the RRHO method, in which the significance index is adjusted from the set (0.01, 0.05), and the parameter α and β/k involved in the statistical hypothesis in Gibbs sampling are adjusted from the set (5.0, 1.0, 0.5, 0.1) and (100, 1.0, 0.01), respectively. According to the recognition effect of the model on the simulated data set, the final parameters p = 0.01, α = 0.5, and β/k = 1.0 were determined. The data processed based on the GSE39748 data is brought into the model to identify the gene sample module, and the results were analyzed using a variety of biometric indicators Includes: Disease (OMIN_DISEASE, UP_KW_DISEASE), Functional_Annotations (COG_ONTOLO, UP_KW_BIOLOGICAL_PROCESS, UP_KW_CELLOULAR_COMPONENT, UP_KW_MOLECULAR_FUNCTION, UP_KW_PTM, UP_SEQ_FEATURE), Protein_Domains (INTERPRO, PIR_SUPERFAMILY, SMART, UP_KW_DOMAIN), Gene_Ontology (GOTERBP, CC, MF), Interactins (UP_KW_LIGAND), Pathways (KEGG_PATHWAY, BBID,BIOCARTA), Protein_Domains (INTERPRO, PIR_SUPERFAMILY, SMART, UP_KW_DOMAIN).
Corresponding to the Enrichment analysis results with the cluster id of 1 in Table 1, there were four significantly enriched pathways after analysis by GO and KEGG, two of which were associated with proteins of the autism spectrum, which includes different phenotypic manifestations such as classic autism, Asperger’s syndrome, childhood disintegration Sexual disorder, Rett’s syndrome, and pervasive developmental disorder not otherwise specified. Also significantly enriched into axons, the site of neurotransmitter storage and release. And outside the cytoplasmic membrane, referring to gene products attached to the plasma membrane or cell wall.

Table 1. Clustering results identified in the statistical method proposed in this paper based on the GDS37948 male infertility data set.
Corresponding to the Enrichment analysis results with the cluster id of 2 in Table 1, enriched in chemical synaptic transmission, cell membrane, and plasma membrane pathways. Release of neurotransmitter molecules from presynaptic vesicles across chemical synapses followed by post synaptic activation of neurotransmitter receptors on target cells (neurons, muscles, or secretory cells), and the effect of this activation on synapses Post-membrane potential and ionic composition of the post synaptic cytoplasm. This process includes spontaneous and evoked release of neurotransmitters and all parts of synaptic vesicle exocytosis. Evoked transmission begins when the action potential reaches the presynaptic.
Corresponding to the Enrichment analysis results with the cluster id of 3 in Table 1, by SMART, INTERPRO, UP_KW_DOMAIN showed enrichment to the SH3 domain. The SH3 (src homology-3) domain is a small protein module containing approximately 50 amino acid residues. They are present in a variety of intracellular or membrane-associated proteins, for example, in a variety of proteins with enzymatic activity, in adaptor proteins such as fodrin and the yeast actin-binding protein ABP-1. The SH3 domain has a characteristic fold, which consists of five or six β-strands arranged in two tightly packed antiparallel β-sheets. The linker region may contain short helices. The surface of the SH3 domain bears a flat hydrophobic ligand-binding pocket consisting of three shallow grooves defined by conserved aromatic residues in which the ligands are arranged in an extended left-handed helix. Ligands bind with low affinity, but this can be enhanced by multiple interactions. The region bound by the SH3 domain is proline-rich in all cases and contains PXXP as a core conserved binding motif. The function of SH3 domains is unclear, but they may mediate many different processes, such as increasing the local concentration of proteins, changing their subcellular location and mediating the assembly of large multiprotein complexes.
Through enrichment analysis, we found that the gene sets of the identified clusters were enriched in a variety of enzyme activities, ADP and ATP related generation reactions, replication and translation of genetic material DNA and RNA, neurotransmitter transmission links and other pathways. Multiple clusters were enriched in RNA polymerase II forward and transcriptional regulatory pathways, protein tyrosine related enzyme pathways, neural synapses, neurotransmitter transmission links, ATP, ADP synthesis related links. There were two clusters of gene sets enriched to human papillomavirus infection pathway. One cluster was significantly enriched in calcium ion related pathways. Another cluster was significantly enriched in the inositol phosphate metabolism pathway. SH3 (src Homology-3) domains, proteoglycan cancer pathway, PDZ domain, Hippo signaling pathway, Tight junction pathway, PB1 domain and other pathways were also enriched in some clusters. Each cluster enriched in the above described pathways at the same time there are other enrichment pathways with different functions. There may be multiple gene interactions enriched in different pathways leading to differences in sperm motility.
In order to determine whether the data is significantly enriched, the p-values of the enrichment results are corrected using the Benjamini method and the Bonferroni method. The specific identified differentially expressed genes and the number of samples is shown in Table 1. Specific gene and sample data are included in the Supplementary Table: The result of identification. Table 2 is the cluster-related enrichment results, Figure 3 visualizes the correlation enrichment results, and the enrichment analysis results of all clusters are shown in Supplementary Data.

Table 2. Enrichment results of genes in a cluster identified by our method in the male infertility data set.
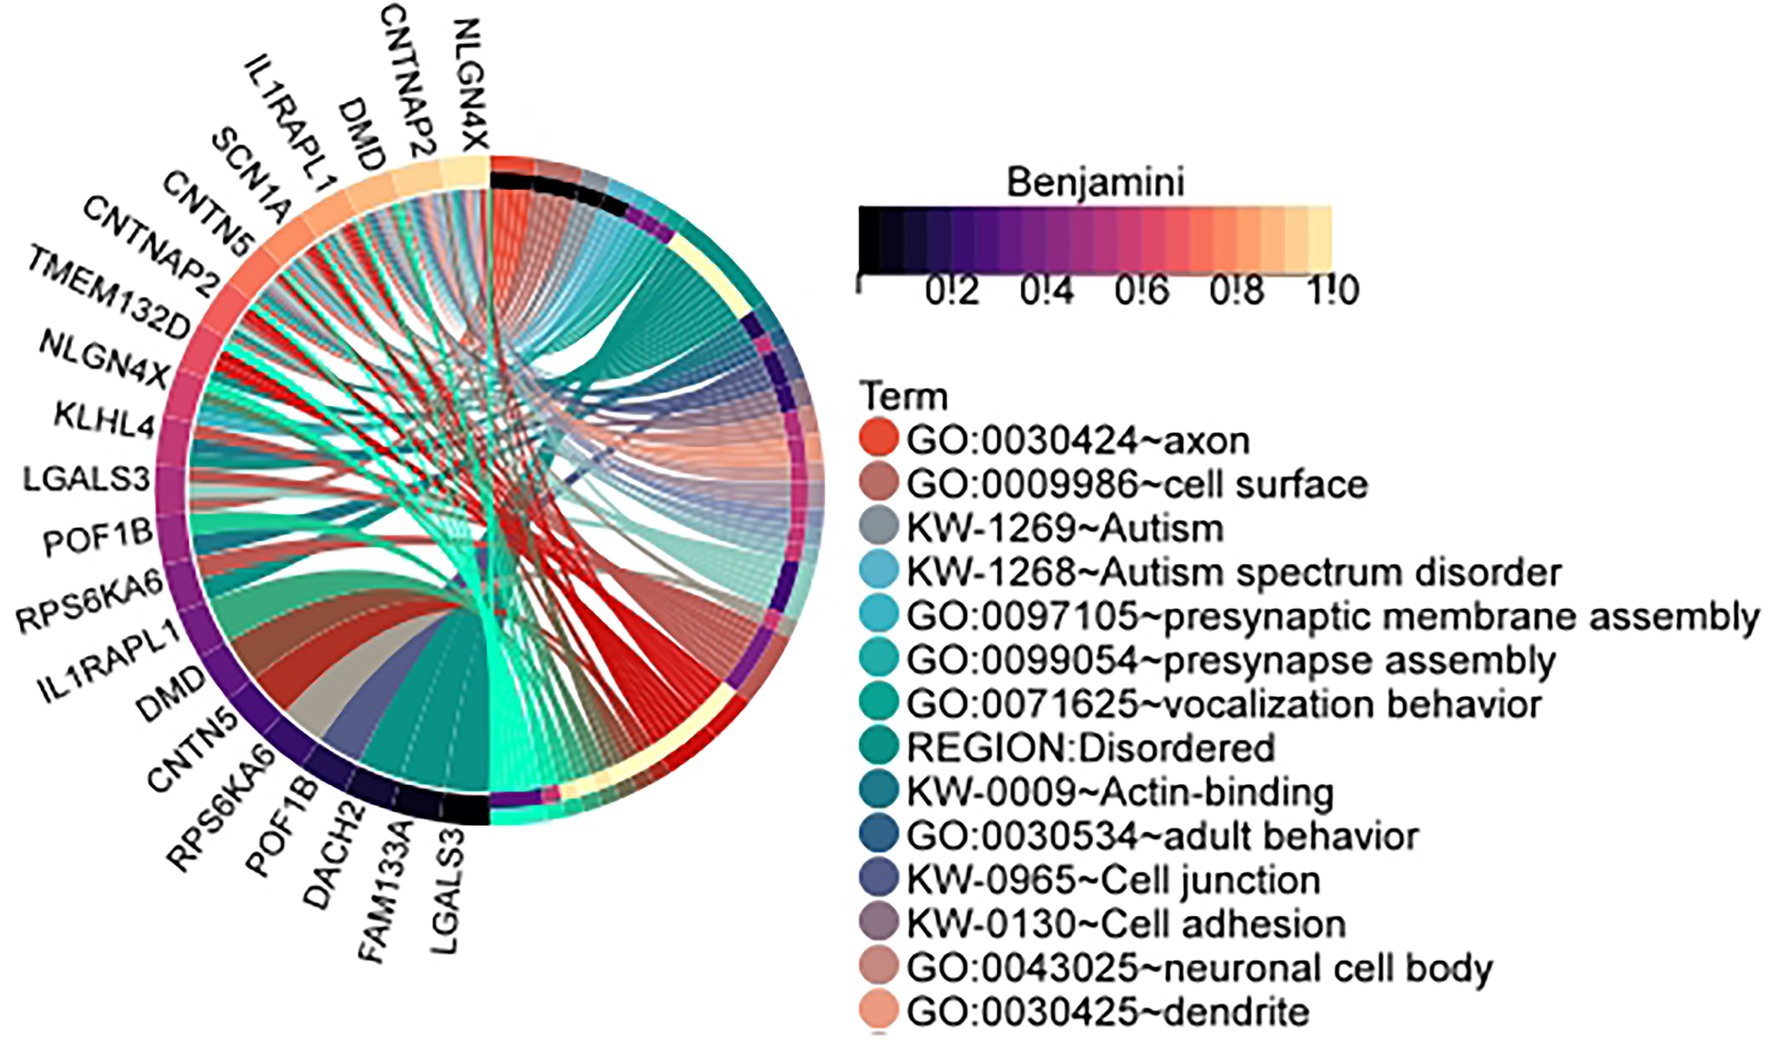
Figure 3. Enrichment circle plot of genes in clusters identified by our method in the male infertility data set. The cluster is the id in Table 1: 1. (Visualization of the relationship between genes and enrichment pathways).
3.2. Simulation data experimental results
Since this paper belongs to unsupervised learning, there is no standard answer for the quantitative study of male sperm motility. At the same time, in order to better determine the value of hyper-parameters in the statistical method used in this paper, simulated data similar to gene expression profile datasets are constructed to be used in the method proposed in this paper. The clustering results in the simulated data have been determined and can be used to evaluate the model performance. Comparing the identification results of the simulated data set with the results of similar methods, and the results show that the model proposed in this paper may have higher accuracy in the analysis of genetic factors in the quantitative study of male sperm (Table 3).
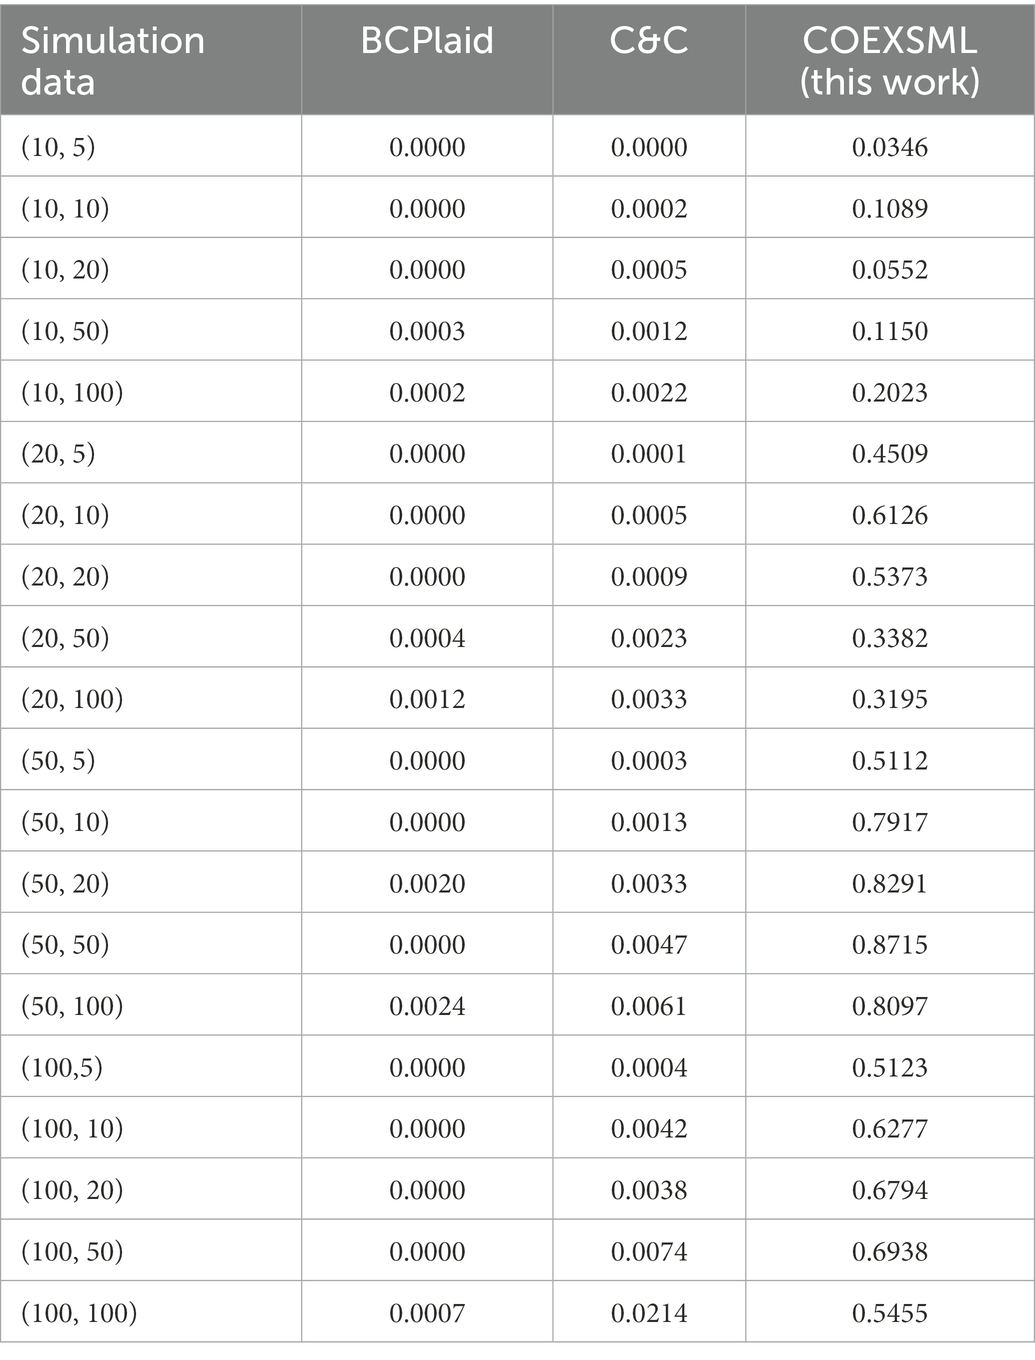
Table 3. The jaccard similarity coefficient between the clustering results identified by the three methods on different simulated datasets and the real clusters, where simulation data represents (the number of samples, the number of genes).
To identify the differential expression module of the simulated data, we used the C&C (Cheng and Church, 2000) and BCPlaid (Lazzeroni and Owen, 2000) methods to cluster the data, and calculated the jaccard similarity coefficient of the results, which was often used to compare the similarity and difference between the limited sample sets, among which the jaccard coefficient. The higher the value, the higher the similarity between sets. The stable parameters were tuned best in each model. The specific results are shown in Supplementary Table 3, and the corresponding box plot is in Figure 4.
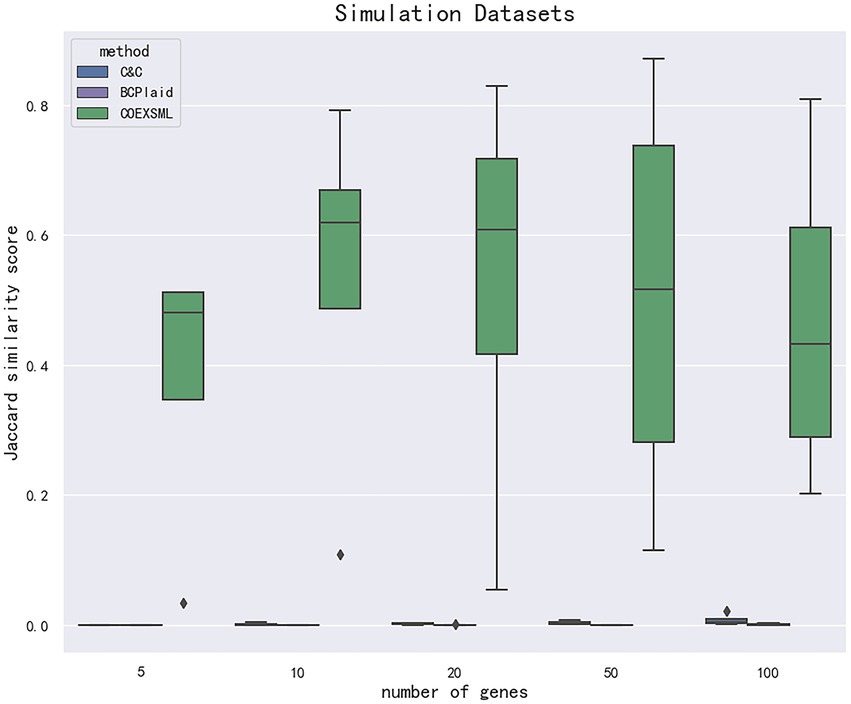
Figure 4. The data are divided according to the difference in the number of genes in the clusters in the simulated data set. The clustering effect is measured according to the jaccard similarity coefficient, and compared with other methods. COEXSML is the method proposed in this paper.
4. Conclusion
Based on the analysis of the GSE37948 male infertility-related gene detection data set in the GEO database, this paper proposes a bicluster analysis method based on hypergeometric distribution, Gibbs sampling and machine learning, and establishes simulation data similar to the GSE37948 data set. The common bicluster analysis methods C&C (Cheng and Church, 2000) and BCPlaid (Lazzeroni and Owen, 2000) have compared the experimental results. The results show that the method proposed in this paper has a higher accuracy in the identification of biclusters on the established simulation data set.
Through enrichment analysis, we found that the gene sets of the identified clusters were enriched in a variety of enzyme activities, ADP and ATP related generation reactions, replication and translation of genetic material DNA and RNA, neurotransmitter transmission links and other pathways. Multiple clusters were enriched in RNA polymerase II forward and transcriptional regulatory pathways, protein tyrosine related enzyme pathways, neural synapses, neurotransmitter transmission links, ATP, ADP synthesis related links. There were two clusters of gene sets enriched to human papillomavirus infection pathway. One cluster was significantly enriched in the inositol phosphate metabolism pathway. Each cluster enriched in the above described pathways at the same time there are other enrichment pathways with different functions. There may be multiple gene interactions enriched in different pathways leading to differences in sperm motility.
Infertility is a complex pathological condition that presents with a wide range of heterogeneous prototypes, and identifying the genes that cause male infertility is important to increase our biological understanding and clinically relevant treatments. The genetic causes of male infertility are chromosomal abnormalities, gene mutations and other reasons, which may be present in autosomes or in sex chromosomes, considering the particularity of male infertility, this article only considers the study of related genes on the X chromosome. With the development of genetic testing technology, the relevant data has increased significantly, and follow-up research can fully explore the information contained in the gene expression data of relevant patients from more aspects.
Data availability statement
The original contributions presented in the study are included in the article/Supplementary material, further inquiries can be directed to the corresponding author.
Author contributions
XJ proposed the model and completed the manuscript writing. YP assisted in completing the model construction. YP and ZY reviewed and revised the manuscript. ZY provided financial support. All authors contributed to the article and approved the submitted version.
Funding
This research was supported by the National Natural Science Foundation of China (No: 62072296).
Conflict of interest
The authors declare that the research was conducted in the absence of any commercial or financial relationships that could be construed as a potential conflict of interest.
Publisher’s note
All claims expressed in this article are solely those of the authors and do not necessarily represent those of their affiliated organizations, or those of the publisher, the editors and the reviewers. Any product that may be evaluated in this article, or claim that may be made by its manufacturer, is not guaranteed or endorsed by the publisher.
Supplementary material
The Supplementary material for this article can be found online at: https://www.frontiersin.org/articles/10.3389/fmicb.2023.1092143/full#supplementary-material
References
Alzahrani, M., Kuwahara, H., Wang, W., and Gao, X. (2017). Gracob: a novel graph-based constant-column biclustering method for mining growth phenotype data. Bioinformatics 33, 2523–2531. doi: 10.1093/bioinformatics/btx199
Antonuccio, P., Micali, A. G., Romeo, C., Freni, J., Vermiglio, G., Puzzolo, D., et al. (2021). NLRP3 inflammasome: a new pharmacological target for reducing testicular damage associated with varicocele. Int. J. Mol. Sci. 22. doi: 10.3390/ijms22031319
Aquila, S., Sisci, D., Gentile, M., Middea, E., Catalano, S., Carpino, A., et al. (2004). Estrogen receptor (ER) alpha and ER beta are both expressed in human ejaculated spermatozoa: evidence of their direct interaction with phosphatidylinositol-3-OH kinase/Akt pathway. J. Clin. Endocrinol. Metab. 89, 1443–1451. doi: 10.1210/jc.2003-031681
Bergmann, S., Ihmels, J., and Barkai, N. (2003). Iterative signature algorithm for the analysis of large-scale gene expression data. Phys. Rev. E Stat. Nonlinear Soft Matter Phys. 67:031902. doi: 10.1103/PhysRevE.67.031902
Bollobás, B., Borgs, C., and Chayes, J. (2003). “Directed scale-free graphs,’’ in Proceedings of the fourteenth annual ACM-SIAM symposium on discrete algorithms. (Philadelphia, PA, USA). 132–139.
Chen, Y., Mao, F., Li, G., and Xu, Y. J. B. B. (2011). Genome-wide discovery of missing genes in biological pathways of prokaryotes. BMC Bioinformatics 12:S1. doi: 10.1186/1471-2105-12-S1-S1
Cheng, Y., and Church, G. M. (2000). “Biclustering of expression data,” in Proceedings of the eighth international conference on intelligent systems for molecular biology. (AAAI Press). 93–103.
Chillón, M., Casals, T., Mercier, B., Bassas, L., Lissens, W., Silber, S., et al. (1995). Mutations in the cystic fibrosis gene in patients with congenital absence of the vas deferens. N. Engl. J. Med. 332, 1475–1480. doi: 10.1056/NEJM199506013322204
Chiu, H.S., Chuang, H.Y., Tsai, H.K., Huang, T.W., and Kao, C.Y. (2004). Discovering statistically significant clusters by using iterative genetic algorithms in gene expression data. In Proceedings of the International Conference on Mathematics and Engineering Techniques in Medicine and Biological Scienes, METMBS, Las Vegas, Nevada, USA.
Dada, R., Gupta, N. P., and Kucheria, K. (2003). Molecular screening for Yq microdeletion in men with idiopathic oligozoospermia and azoospermia. Proc. Anim. Sci. 28, 163–168. doi: 10.1007/BF02706215
De Smet, R., and Marchal, K. (2011). An ensemble biclustering approach for querying gene expression compendia with experimental lists. Bioinformatics 27, 1948–1956. doi: 10.1093/bioinformatics/btr307
Dhollander, T., Sheng, Q., Lemmens, K., De Moor, B., Marchal, K., and Moreau, Y. (2007). Query-driven module discovery in microarray data. Bioinformatics 23, 2573–2580. doi: 10.1093/bioinformatics/btm387
Eren, K., Deveci, M., Kucuktunc, O., and Catalyurek, U. V. (2013). A comparative analysis of biclustering algorithms for gene expression data. Brief. Bioinform. 14, 279–292. doi: 10.1093/bib/bbs032
Gerniers, A., Bricard, O., and Dupont, P. (2021). MicroCellClust: mining rare and highly specific subpopulations from single-cell expression data. Bioinformatics 37, 3220–3227. doi: 10.1093/bioinformatics/btab239
Ghiassian, S. D., Menche, J., and Barabasi, A. L. (2015). A DIseAse MOdule Detection (DIAMOnD) algorithm derived from a systematic analysis of connectivity patterns of disease proteins in the human interactome. PLoS Comput. Biol. 11:e1004120. doi: 10.1371/journal.pcbi.1004120
Goncalves, J. P., and Madeira, S. C. (2014). LateBiclustering: efficient heuristic algorithm for time-lagged bicluster identification. IEEE/ACM Trans. Comput. Biol. Bioinform. 11, 801–813. doi: 10.1109/TCBB.2014.2312007
Gu, J., and Liu, J. S. (2008). Bayesian biclustering of gene expression data. BMC Genomics 9:S4. doi: 10.1186/1471-2164-9-S1-S4
Guo, F., Yin, Z., Zhou, K., and Li, J. (2021). PLncWX: a machine-learning algorithm for plant lncRNA identification based on WOA-XGBoost. J. Chem. 2021, 1–11. doi: 10.1155/2021/6256021
Hartigan, J. A. (1972). Direct clustering of a data matrix. J. Am. Stat. Assoc. 67, 123–129. doi: 10.1080/01621459.1972.10481214
Henriques, R., and Madeira, S. C. (2016a). BiC2PAM: constraint-guided biclustering for biological data analysis with domain knowledge. Algorithms Mol. Biol. 11:23. doi: 10.1186/s13015-016-0085-5
Henriques, R., and Madeira, S. C. (2016b). BicNET: flexible module discovery in large-scale biological networks using biclustering. Algorithms Mol. Biol. 11:14. doi: 10.1186/s13015-016-0074-8
Hochreiter, S., Bodenhofer, U., Heusel, M., Mayr, A., Mitterecker, A., Kasim, A., et al. (2010). FABIA: factor analysis for bicluster acquisition. Bioinformatics 26, 1520–1527. doi: 10.1093/bioinformatics/btq227
Jacobs, P. A., and Strong, J. A. (1959). A case of human intersexuality having a possible XXY sex-determining mechanism. Nature 183, 302–303. doi: 10.1038/183302a0
Jiang, J., Pan, W., Xu, Y., Ni, C., Xue, D., Chen, Z., et al. (2020). Tumour-infiltrating immune cell-based subtyping and signature gene analysis in breast cancer based on gene expression profiles. J. Cancer 11, 1568–1583. doi: 10.7150/jca.37637
Kluger, Y., Basri, R., Chang, J. T., and Gerstein, M. (2003). Spectral biclustering of microarray data: coclustering genes and conditions. PCR Methods Appl. 13, 703–716. doi: 10.1101/gr.648603
Krausz, C., Giachini, C., Lo Giacco, D., Daguin, F., Chianese, C., Ars, E., et al. (2012). High resolution X chromosome-specific array-CGH detects new CNVs in infertile males. PLoS One 7:e44887. doi: 10.1371/journal.pone.0044887
Krausz, C., and Riera-Escamilla, A. J. (2018). Genetics of male infertility. Nat. Clin. Pract. Urol. 15, 369–384. doi: 10.1038/s41585-018-0003-3
Lazareva, O., Canzar, S., Yuan, K., Baumbach, J., Blumenthal, D. B., Tieri, P., et al. (2020). BiCoN: network-constrained biclustering of patients and omics data. Bioinformatics 37, 2398–2404. doi: 10.1093/bioinformatics/btaa1076
Li, G., Ma, Q., Tang, H., Paterson, A. H., and Xu, Y. (2009). QUBIC: a qualitative biclustering algorithm for analyses of gene expression data. Nucleic Acids Res. 37:e101. doi: 10.1093/nar/gkp491
Liao, M., Liu, Y., Yuan, J., Wen, Y., Xu, G., Zhao, J., et al. (2020). Single-cell landscape of bronchoalveolar immune cells in patients with COVID-19. Nat. Med. 26, 842–844. doi: 10.1038/s41591-020-0901-9
Lopes, A. M., Aston, K. I., Thompson, E. E., Carvalho, F., Gonçalves, J., Huang, N., et al. (2013). Human spermatogenic failure purges deleterious mutation load from the autosomes and both sex chromosomes, including the gene DMRT1. Public Library Sci. Genet. 9:e1003349. doi: 10.1371/journal.pgen.1003349
Lyon, M. F., Hawkes, S. G., and Nature, H. J. (1970). X-linked gene for testicular feminization in the mouse. Nature 227, 1217–1219. doi: 10.1038/2271217a0
Madeira, S. C., Teixeira, M. C., Sa-Correia, I., and Oliveira, A. L. (2010). Identification of regulatory modules in time series gene expression data using a linear time biclustering algorithm. IEEE/ACM Trans. Comput. Biol. Bioinform. 7, 153–165. doi: 10.1109/TCBB.2008.34
Medina, I., Carbonell, J., Pulido, L., Madeira, S. C., Goetz, S., Conesa, A., et al. (2010). Babelomics: an integrative platform for the analysis of transcriptomics, proteomics and genomic data with advanced functional profiling. Nucleic Acids Res. 38, W210–W213. doi: 10.1093/nar/gkq388
Peng, L., Tian, X., Tian, G., Xu, J., Huang, X., Weng, Y., et al. (2020). Single-cell RNA-seq clustering: datasets, models, and algorithms. RNA Biol. 17, 765–783. doi: 10.1080/15476286.2020.1728961
Peng, L., Wang, F., Wang, Z., Tan, J., Huang, L., Tian, X., et al. (2022). Cell–cell communication inference and analysis in the tumour microenvironments from single-cell transcriptomics: data resources and computational strategies. Brief. Bioinform. 23:bbac234. doi: 10.1093/bib/bbac234
Peng, L., Yuan, R., Shen, L., Gao, P., and Zhou, L. J. (2021). LPI-EnEDT: an ensemble framework with extra tree and decision tree classifiers for imbalanced lncRNA-protein interaction data classification. BioData Min 14, 50–22. doi: 10.1186/s13040-021-00277-4
Plaisier, S. B., Taschereau, R., Wong, J. A., and Graeber, T. G. (2010). Rank-rank hypergeometric overlap: identification of statistically significant overlap between gene-expression signatures. Nucleic Acids Res. 38:e169. doi: 10.1093/nar/gkq636
Prelić, A., Bleuler, S., Zimmermann, P., Wille, A., Bühlmann, P., Gruissem, W., et al. (2006). A systematic comparison and evaluation of biclustering methods for gene expression data. Bioinformatics 22, 1122–1129. doi: 10.1093/bioinformatics/btl060
Ron, E., Michael, D., and Lash, A. E. (2002). Gene expression omnibus: NCBI gene expression and hybridization array data repository. Nucleic Acids Res. 1, 207–210. doi: 10.1093/nar/30.1.207
Sheng, Q., Moreau, Y., and De Moor, B. (2003). Biclustering microarray data by Gibbs sampling. Bioinformatics 19:ii196-205. doi: 10.1093/bioinformatics/btg1078
Tournaye, H., Krausz, C., and Oates, R. D. (2017). Novel concepts in the aetiology of male reproductive impairment. Lancet Diabetes Endocrinol. 5, 544–553. doi: 10.1016/S2213-8587(16)30040-7
Wang, H., Zhao, R., Guo, C., Jiang, S., Yang, J., Xu, Y., et al. (2016). Knockout of BRD7 results in impaired spermatogenesis and male infertility. Sci. Rep. 6:21776. doi: 10.1038/srep21776
Xavier, M. J., Salas-Huetos, A., Oud, M. S., Aston, K. I., and Veltman, J. A. (2021). Disease gene discovery in male infertility: past, present and future. Hum. Genet. 140, 7–19. doi: 10.1007/s00439-020-02202-x
Yatsenko, A. N., Georgiadis, A. P., Röpke, A., Berman, A. J., Jaffe, T., Olszewska, M., et al. (2015). X-linked TEX11 mutations, meiotic arrest, and azoospermia in infertile men. N. Engl. J. Med. 372, 2097–2107. doi: 10.1056/NEJMoa1406192
Yi, H., Huang, L., Mishne, G., and Chi, E. C. (2021). COBRAC: a fast implementation of convex biclustering with compression. Bioinformatics 37, 3667–3669. doi: 10.1093/bioinformatics/btab248
Zhai, Z., Lei, Y. L., Wang, R., and Xie, Y. (2022). Supervised capacity preserving mapping: a clustering guided visualization method for scRNA-seq data. Bioinformatics 38, 2496–2503. doi: 10.1093/bioinformatics/btac131
Zhao, H., Cloots, L., Bulcke, T. V. D., Wu, Y., and Marchal, K. J. B. B. (2011). Query-based biclustering of gene expression data using probabilistic relational models. Bioinformatics 12:S37. doi: 10.1186/1471-2105-12-S1-S37
Keywords: male infertility, hypergeometric distribution, Fisher test, Gibbs sampling, machine learning, gene interaction network, HPV
Citation: Jia X, Yin Z and Peng Y (2023) Gene differential co-expression analysis of male infertility patients based on statistical and machine learning methods. Front. Microbiol. 14:1092143. doi: 10.3389/fmicb.2023.1092143
Edited by:
Lihong Peng, Hunan University of Technology, ChinaReviewed by:
Guohua Huang, Shaoyang University, ChinaZhen Tang, Shanghai Jiao Tong University, China
Copyright © 2023 Jia, Yin and Peng. This is an open-access article distributed under the terms of the Creative Commons Attribution License (CC BY). The use, distribution or reproduction in other forums is permitted, provided the original author(s) and the copyright owner(s) are credited and that the original publication in this journal is cited, in accordance with accepted academic practice. No use, distribution or reproduction is permitted which does not comply with these terms.
*Correspondence: ZhiXiang Yin, ✉ enh5aW42NkAxNjMuY29t