 Li Meng
 Ruyue Zhou
94% of researchers rate our articles as excellent or good
Learn more about the work of our research integrity team to safeguard the quality of each article we publish.
Find out more
ORIGINAL RESEARCH article
Front. Microbiol., 04 August 2022
Sec. Microbial Physiology and Metabolism
Volume 13 - 2022 | https://doi.org/10.3389/fmicb.2022.956421
This article is part of the Research TopicGene Regulation of Fungal Secondary MetabolismView all 10 articles
Ganoderma lucidum is an important medicinal fungus in Asian countries. Ganoderic acid (GA) is the major variety of bioactive and medicative components in G. lucidum. Biosynthesis of secondary metabolites is usually associated with cell differentiation and development. However, the mechanism underlying these phenomena remain unclear. Transcription factors play an essential regulatory role in the signal transduction pathway, owing to the fact that they represent the major link between signal transduction and expression of target genes. In the present study, we performed transcriptome and metabolome analyses to identify transcription factors involved in GA biosynthesis during development of G. lucidum. Transcriptome data revealed differentially expressed genes between mycelia and primordia, as well as between mycelia and the fruiting body. Results from gene ontology enrichment analysis and metabolome analyses suggested that GAs and flavonoids biosynthetic process significantly changed during fungal development. The analysis of predicted occurrences of DNA-binding domains revealed a set of 53 potential transcription factor families in G. lucidum. Notably, we found homeobox transcription factor and velvet family protein played important role in GA biosynthesis. Combined with previous studies, we provided a model diagram of transcription factors involved in GA biosynthesis during fruiting body formation. Collectively, these results are expected to enhance our understanding into the mechanisms underlying secondary metabolite biosynthesis and development in fungi.
Fungi are remarkable organisms that readily produce a wide range of natural products often called secondary metabolites (Calvo et al., 2002), some of which are beneficial to humankind (Demain and Fang, 2000). Ganoderma spp., an important medicinal fungus, has been widely used to improve health and prevent certain diseases in traditional Chinese medicine for thousands of years (Ahmad, 2018), owing to a variety of biomedical efficacies including anti-cancer, anti-tumor, immune modulatory effects. Results from phytochemical studies over the last 40 years have resulted in isolation of 431 secondary metabolites from various Ganoderma species. The major secondary compounds isolated from these species include C30 lanostanes, C27 lanostanes, C24, C25 lanostanes, C30 pentacyclic triterpenes, meroterpenoids, and farnesyl hydroquinones, and so on (Baby et al., 2015).
Ganoderic acids (GAs), a triterpenoid produced by Ganoderma lucidum that has a range of biological activities, is regulated by interplay between external (environmental) and internal (genetic) factors. Previous studies have shown that expression of GA biosynthetic machinery can be modulated by various external factors, including salicylic acid (Cao et al., 2017), sodium acetate (Meng et al., 2019), and ethylene (Zhang et al., 2017a; Meng et al., 2022), and so on. Additionally, genes encoding 3-hydroxy-3-methylglutaryl CoA reductase (HMGR) (Shang et al., 2008), squalene synthase (SQS) (Zhao et al., 2007), and oxidosqualene cyclase (OSC) (Shang et al., 2010) as well as other important transcription factors reportedly contribute to GA biosynthesis.
Although biosynthesis of natural products has been associated with cell differentiation and development, previously reports have demonstrated that mutants of transcription factors not only affect mycelia morphology, growth rate, hypha branch, primordia and fruiting body formation, but also play a role in biosynthesis of secondary metabolites. Notably, Cary et al. (2017) revealed that homeobox transcription factor gene hbx1 is required for the development and aflatoxin biosynthesis in Aspergillus flavus. Moreover, the MAP kinase Fus3 (AnFus3) interacts with the conserved nuclear transcription factor AnSte12 to initiate sexual development and phosphorylates VeA, which is a major regulatory protein required for sexual development and coordinated secondary metabolite production in A. nidulans (Bayram et al., 2012). In G. lucidum, APSES transcription factor (GlSwi6) (Zhang et al., 2018; Lian et al., 2022), GATA transcription factor (AreA) (Zhu et al., 2019), Cys2His2 zinc finger protein gene C2H2-type transcription factor (CRZ1) (Li and Zhong, 2020), and Pcc1 transcription factor (PacC) (Wu et al., 2016) were found to play a role in fungal growth, fruiting body development and GA biosynthesis. We previously identified and characterized a transcription factor MADS1, which can regulate GA biosynthesis, and the gene-silencing mutants of MADS1 hinder the formation of the primordia in G. lucidum (Meng et al., 2021). Collectively, these studies have provided insights into molecular mechanisms and pathways that link chemical and morphological differentiation processes in fungi.
Although previous reports have shown that most secondary metabolites are produced by organisms that exhibit filamentous growth and have a relatively complex morphology, the mechanism underlying this connection unclear.
In the present study, we performed transcriptome and metabolome analyses to identify genes involved in GA biosynthesis during development of G. lucidum. Particularly, we evaluated the effect of transcription factors in GA biosynthesis by quantitatively analyzing GA accumulation, intermediate formation, and gene expression of key regulatory enzymes. This is the first time to investigate the global changes of transcription factors during development of G. lucidum. Taken together, our results provide invaluable insights into the connection between secondary metabolism and fruiting body formation in G. lucidum, and are expected to guide future studies.
A G. lucidum strain (accession number: ACCC53264) was provided by Prof. Mingwen Zhao of Nanjing Agricultural University, and preserved at the Agricultural Culture Collection of China. Fungal mycelia were cultured in complete yeast medium (CYM), comprising 1% maltose, 2% glucose, 0.2% yeast extract, 0.2% tryptone, 0.05% MgSO4 7H2O, and 0.46% KH2PO4, and maintained at 28°C. Spawn was prepared in polypropylene bags and incubated at growth conditions described in a previous study (Meng et al., 2019). Samples were collected at three stages, namely mycelia, primordia, and fruiting body, then stored in liquid nitrogen.
RNA was isolated from samples (Mycelia, Primordia, and Fruiting body), and detected RNA concentration and purity using previously described methods (Meng et al., 2022). 1.5 μg of total RNA per sample was reverse transcribed to complementary DNA (cDNA). The cDNA was purified and ligated to sequencing adapters, then resolved on an agarose gel. cDNA fragments (300 bp) were extracted from the gels, purified and enriched by PCR to construct the final cDNA library (Mycelia, Primordia, and Fruiting body). Libraries were generated using the NEBNext® Ultra™ RNA Library Prep Kit for Illumina® (NEB, United States). Clustering of the index-coded samples was performed on a cBot Cluster Generation System using TruSeq PE Cluster Kit v3-cBot-HS (Illumina) according to the manufacturer’s instructions. Next, libraries were sequenced on the Illumina Hiseq platform, to generate 150-bp paired-end reads. About 47 M raw reads were generated per sample.
Raw reads (fastq format) were first processed through in-house perl scripts to remove adapters, as well as low-quality reads and those containing poly-N. At the same time, we calculated Q20, Q30, GC-content and sequence duplication level of the clean data. All other downstream analyses were performed on clean, high-quality data. The transcriptome was assembled by mapping the reads to G. lucidum reference genome (Project accession number PRJNA71455) (Chen et al., 2012). Transcript abundances were presented as normalized fragments per kb of transcript per million mapped reads. A gene was considered to be significantly differentially expressed if its expression differed between two samples by a fold change > 2 and a p-value < 0.05.
Annotations, to identify gene function, were performed on the following databases: NCBI non-redundant (Nr) protein sequences; NCBI non-redundant nucleotide sequences (Nt); Protein family (Pfam); Clusters of Orthologous Groups of Proteins (KOG/COG); Swiss-Prot (A manually annotated and reviewed protein sequence database); KEGG Ortholog database (KO); and Gene Ontology (GO).
Samples for LC-MS analysis were prepared as previously reported (Meng et al., 2022). Briefly, 80 mg of each sample was extracted by 1 mL solution of methanol-water (7: 3, v/v). Ultrasonic extraction was performed in an ice-water bath for 30 min, after which extracts were stored overnight at −20°C. The supernatants were then collected, filtered through 0.22 μm polyvinylidene fluoride membranes, and stored at −80°C until subsequent LC-MS analysis. All sample extracts were mixed with 20 μL of 2-chloro-l-phenylalanine (0.3 mg/mL methanol), as an internal standard.
To identify differentially accumulated metabolites cross various periods, we randomly analyzed 18 samples from three independent biological replicates via LC-MS as described previously (Meng et al., 2022). Chromatographic separation of samples was performed using an ACQUITY UPLC HSS T3 column (2.1 mm × 100 mm, 1.8 μm) equipped with a binary solvent system (solvent A: 0.1% formic acid in deionized water; solvent B: 0.1% formic acid in acetonitrile). The following gradient elution procedure was used: 0–2 min, 5% B; 2–4 min, 5% B; 4–8 min, 30% B; 8–10 min, 50% B; 10–14 min, 80% B; 14–15 min, 100% B; 15.1 min, 5% B and 16 min, 5% B. The process included a flow rate of 0.35 mL/min, an injection volume of 2 μL, and column temperature maintained at 45°C. Instrument settings were as follows: Ion source: ESI; capillary temperature: 320°C; spray voltages: (+3.8, -3) kV; mass scan range: 100–1200; resolution (full scan): 70000; resolution (HCD MS/MS scans): 17500; sheath gas flow rate (Arb): 35 (positive ion) and 35 (negative ion); aux. gas flow rate (Arb): 8 (positive ion) and 8 (negative ion). Metabolomics data were deposited to the EMBL-EBI MetaboLights database (Haug et al., 2019).
Identification of transcription factors were according to Fungal Transcription Factor Database (FTFD), which was designed for integrating the putative fungal transcription factors and its references. This site provides sequences, taxonomical and phylogomic context of all putative fungal transcription factors. Transcription factor family map and transcription factor matrix will provide overall sketch of all fungal transcription factors. FTFD included 123,899 fungal and Oomycetes transcription factors, 75,064 transcription factors belonging to phylum Ascomycota, and 37,831 transcription factors belonging to the phylum Basidiomycota, and others belonging to Chytridiomycota, Microsporidia, and Peronosporomycota. Blastp was used to find paralogs for all proteins (initial blastp parameters at limit expect value < 1e-5, and matrix was BLOSUM62).
Identification of differentially expressed metabolites in the raw data was performed using the UNIFI 1.8.1 software. Baseline filtration, peak identification, peak alignment, peak filling, retention time (RT), and normalization of the raw data were statistically analyzed using QI v2.3 (Waters Corporation, Milford, United States). Metabolite identification was performed based on exact mass to charge ratios (m/z), isotope distributions, fragmentation patterns and database hits (The Human Metabolome Database, Lipidmaps, and METLIN). Additionally, we applied a self-written R package and in-house self-built secondary mass spectrometry database containing 550 metabolites for metabolite identification. Data processing parameters were as follows: precursor tolerance 5 ppm, fragment tolerance 10 ppm, and product ion threshold 5%. Compounds with more than 50% missing values, for each condition, were eliminated while the remaining missing values were replaced by half of the minimum value. Qualitative data were analyzed according to the score of qualitative results. Compounds with a score of more than 36 (a full score of 60) and less than 36 were accepted and deleted, respectively. The maximum total score was 60 points, allocated as follows: 20 points for MS/MS matching, 20 points for MS/MS fragmentation matching, and 20 points for isotopic distribution matching.
Ganoderic acid content and flavonoid contents were measured as described in our previous studies (Meng et al., 2019; Meng et al., 2021).
Functional analyses were performed via gene silencing and fungal transformation, using constructs developed as previously described (Meng et al., 2021). Briefly, the fungal RNAi vector pAN7-ura3-dual was used to silence genes encoding homeobox transcription factor and velvet family proteins in G. lucidum. The cDNA fragment was digested with KpnI and SpeI (Takara) and then inserted into pAN7-ura3-dual at the corresponding restriction sites. This vector was used to transform the G. lucidum protoplasts by liposome transformation, with a 1:1 volumetric ratio of liposome to vector. Coincubation was performed for half an hour at 4°C.
Total RNA was extracted from all samples using the RNAiso Plus Kit (Takara, Kusatsu, Japan) according to the manufacturer’s instructions. Equal concentrations of the RNA were reverse transcribed to cDNA using the TransStart All-in-One first-strand cDNA synthesis supermix (TransGen Biotech, Beijing, China). The cDNA was then used for quantitative real time PCR (qRT-PCR) using the SYBR Green kit (Bio-Rad, Hercules, United States), performed on a LightCycler 96 SW 1.1 instrument, to analyze the transcription levels of gene-silenced strains. Primer sequences for the target genes are listed in Table 1. Expression data for genes in silenced strains were normalized against the internal reference gene 18S rRNA. The relative expression levels were calculated by comparing the cycle threshold (Ct) of each target gene with the corresponding internal reference gene using the 2–ΔΔCt method (Livak and Schmittgen, 2001).
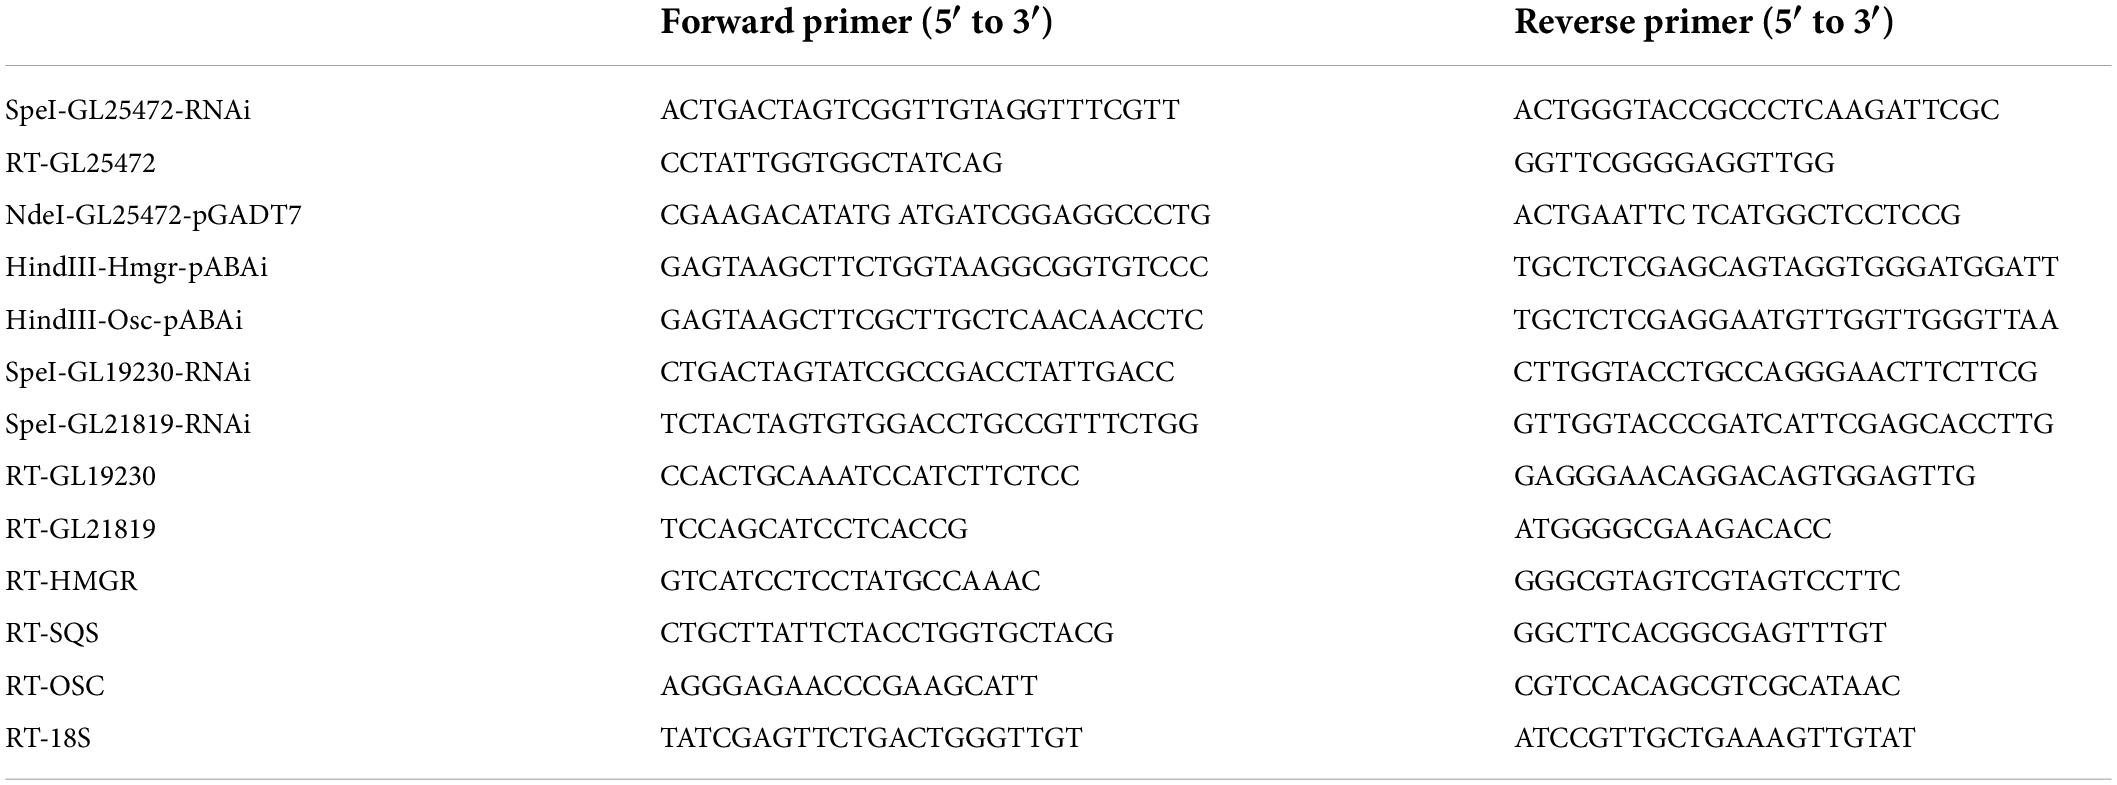
Table 1. The primers in this study.
Yeast one hybrid assays were conducted using the Matchmaker One-hybrid System (Clontech). Briefly, a 100-bp AATT region surrounding the osc and hmgr promoter sequences was synthesized with Hind III and Xho I flanking restriction sites, then cloned into pAbAi. Next, GL25472 cDNA were cloned into the pGADT7 vector for expression in yeast. Plasmids for yeast one-hybrid were co-transformed into yeast Gold strain, then cells harboring the target plasmids cultivated in SD medium lacking leucine containing 200 ng/μL Aureobasidin A (AbA). The primers sequences of the target fragments used are outlined in Table 1.
We elucidated the relationship between secondary metabolites and fruiting body formation at different developmental stages using transcriptome and metabolome profiling, including mycelia (CYM), primordia (PR-H2O), and fruiting body (MA-H2O). Transcriptome data were deposited in the NCBI database, under accession numbers PRJNA 825330 and PRJNA769204. Results revealed 5332 and 4822 differentially expressed genes (DEGs) between CYM and PR-H2O, MA-H2O, respectively (Figures 1A,B and Supplementary Tables 1, 2). Among them, 3369 DEGs were common between PR-H2O vs. CYM and MA-H2O vs. CYM (Figure 1C). To test the level of coregulation among differentially expressed genes, we performed cluster analysis of the 3,369 differentially regulated genes (Figure 1D), and found that most genes were highly expressed in mycelia but lowly in both primordia and fruiting body except a few genes. Interestingly, genes were differentially expressed between mycelia and primordia, but not between primordia and fruiting body. Results from GO enrichment analysis showed that 3,369 common DEGs were enriched in various terms, namely flavonoid biosynthetic process, regulation of the jasmonic acid mediated signaling pathway, electron transport chain, and secondary metabolite biosynthetic process (Figure 1E). Moreover, primordia not only represented a transition from vegetative to reproductive growth, but was also an important turning point during fungal growth and development. GO terms suggested that secondary metabolite biosynthetic process significantly changed during fungal development.
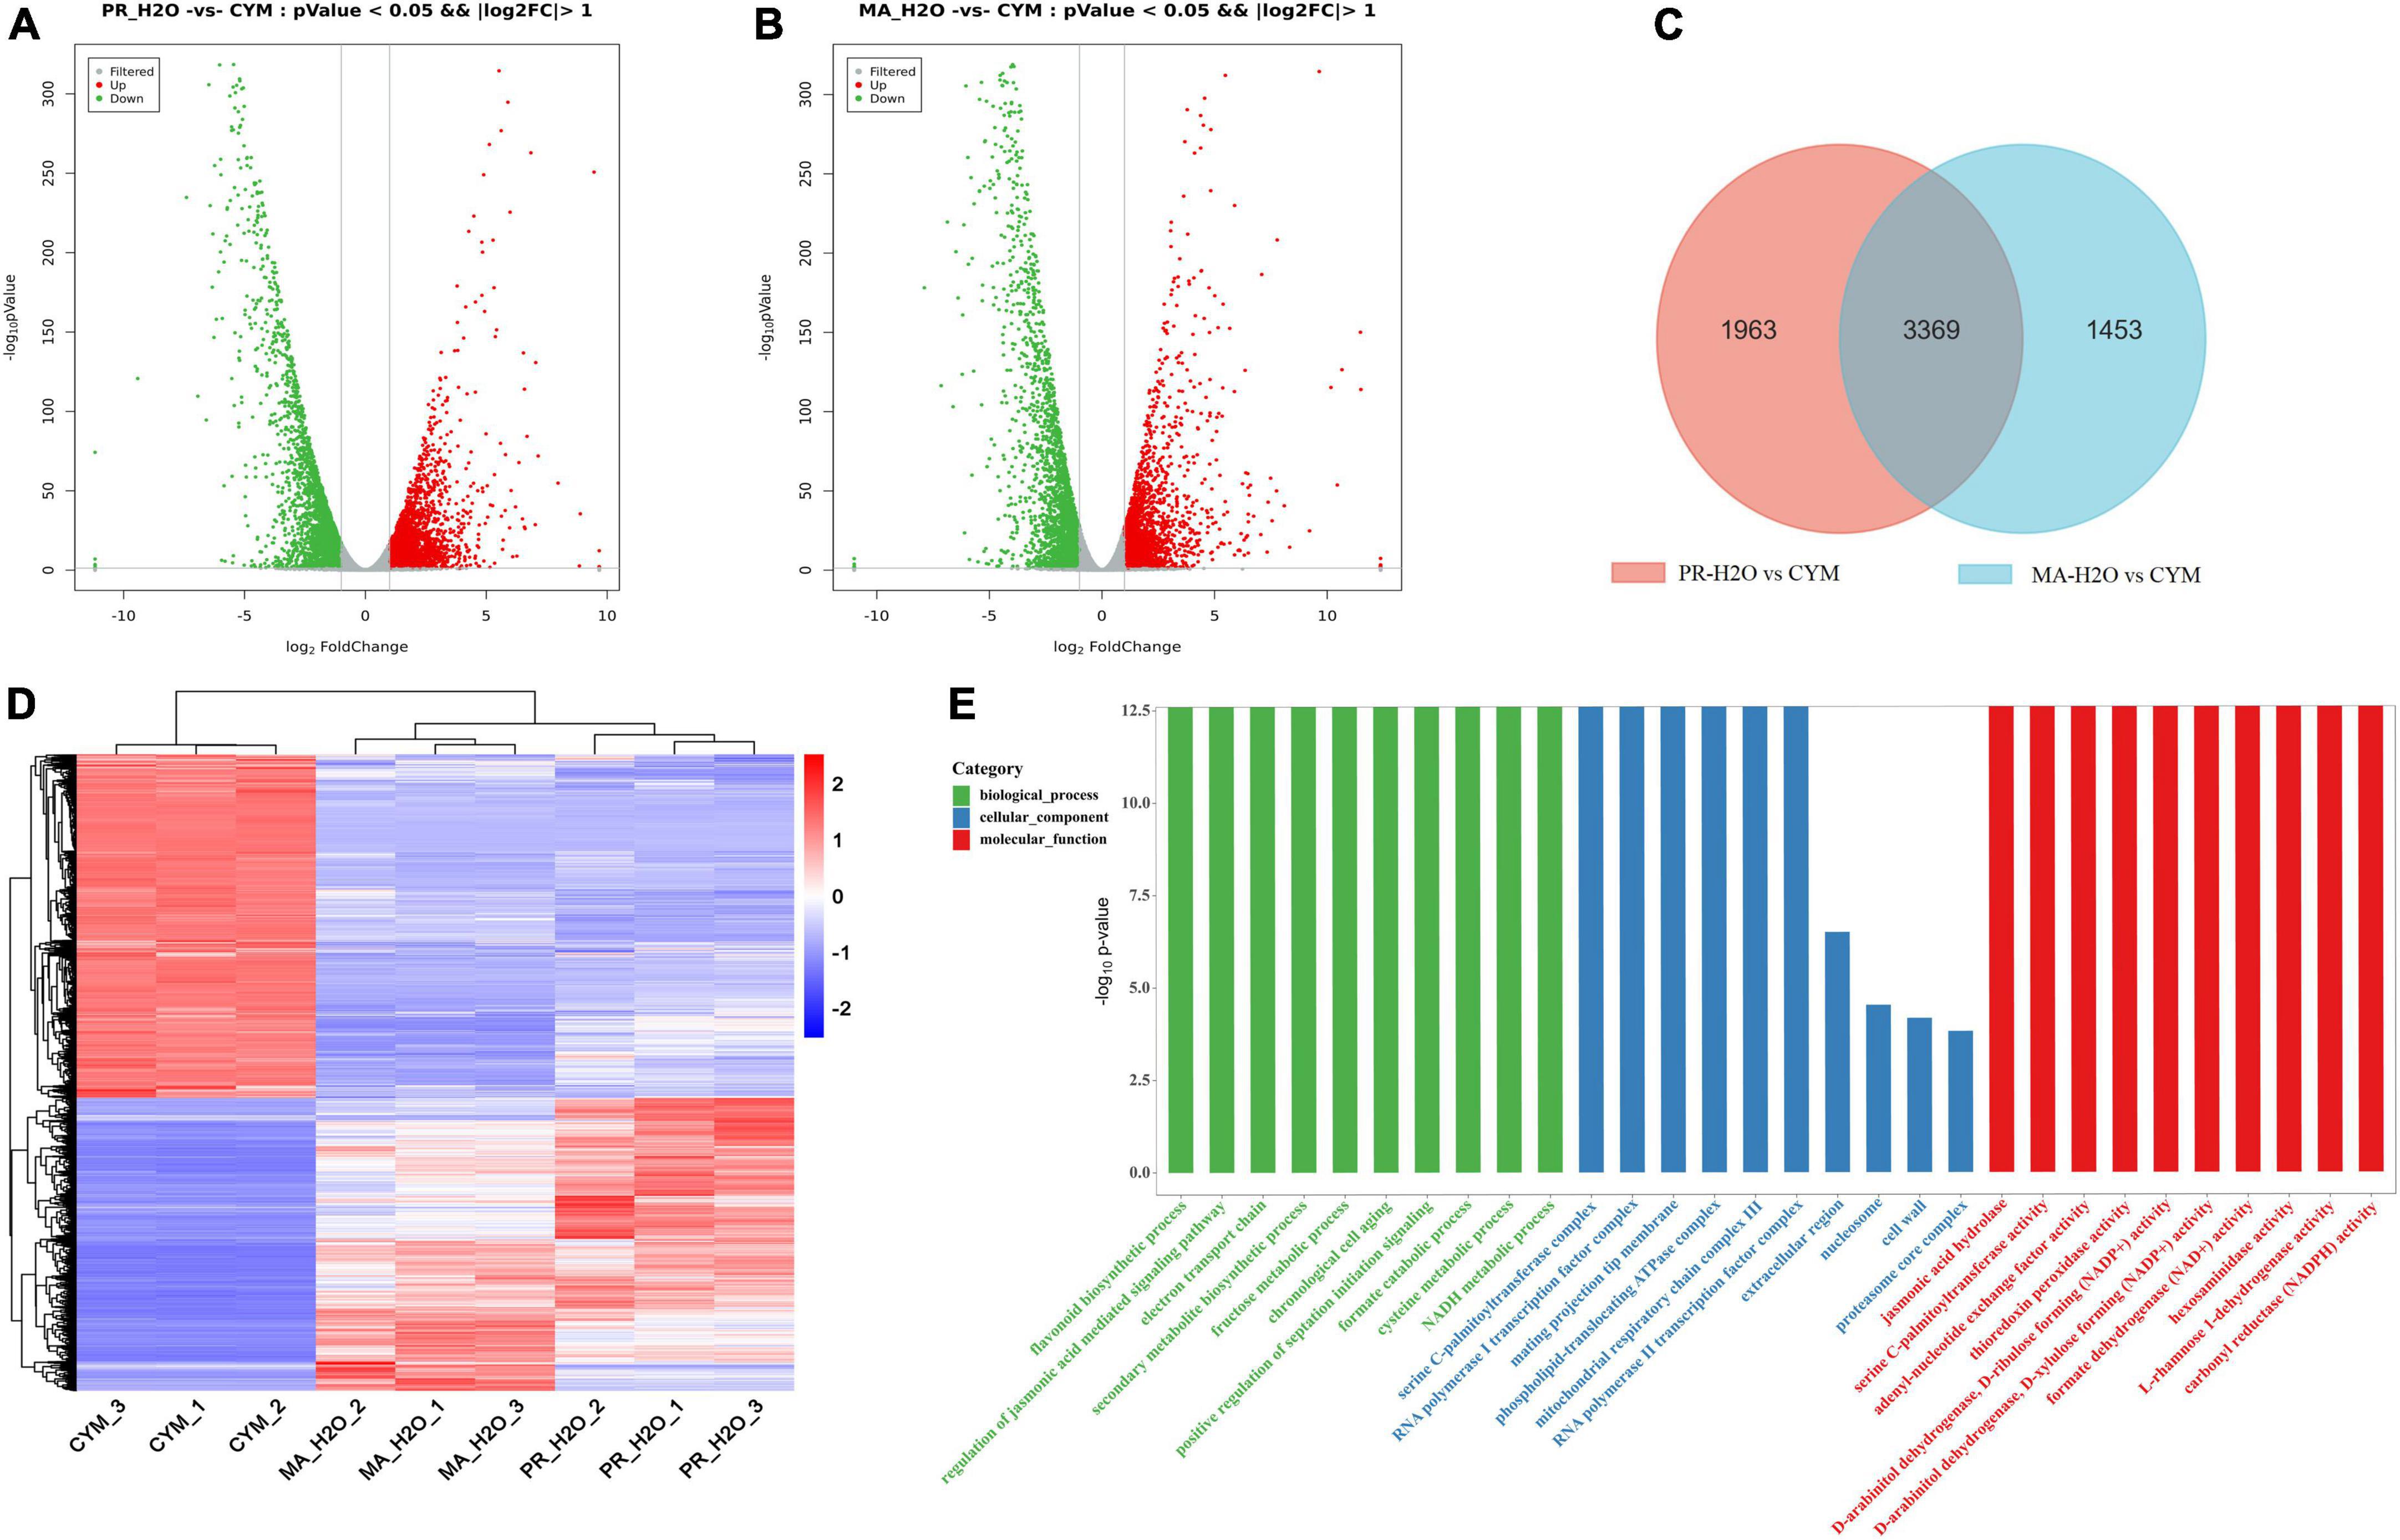
Figure 1. The transcriptome analysis in different developmental stages. Panels (A,B) are the DEGs in PR-H2O vs. CYM and MA-H2O vs. CYM, respectively. Panel (C) is Venn diagram of DEGs between (PR-H2O vs. CYM) and (MA-H2O vs. CYM). Panels (D,E) are the heat map and GO enrichment analysis of common genes. CYM, mycelia; PR-H2O, primordia; MA-H2O, fruiting body. There are three replicates in each sample of transcriptome.
Non-targeted metabolomics analysis revealed a total of 16,327 metabolites in mycelia of G. lucidum, of which 5,920 were successfully annotated (Figure 2A and Supplementary Table 3). The major metabolites included lipids and lipid-like molecules, organic acids and derivatives, organoheterocyclic compounds, and organic nitrogen compounds. Notably, 24,876 metabolites were detected in the primordia and fruiting body stages, of which 8,245 metabolites were successfully annotated (Figure 2B and Supplementary Table 4). Mycelia, primordia and fruiting body stages resulted in largely similar types of metabolites, with a total of 2003 found to be common among the aforementioned stages (Figure 2C). Notably, there were 32 and 61 compounds annotated as GAs and flavonoids in the primordia and fruiting body, which were more than those obtained in mycelia (10 and 29 compounds annotated as GAs and flavonoids) (Figure 2D and Supplementary material). In addition, GA and flavonoid contents in the primordia and fruiting body were higher than those obtained in mycelia (Figures 2E,F).
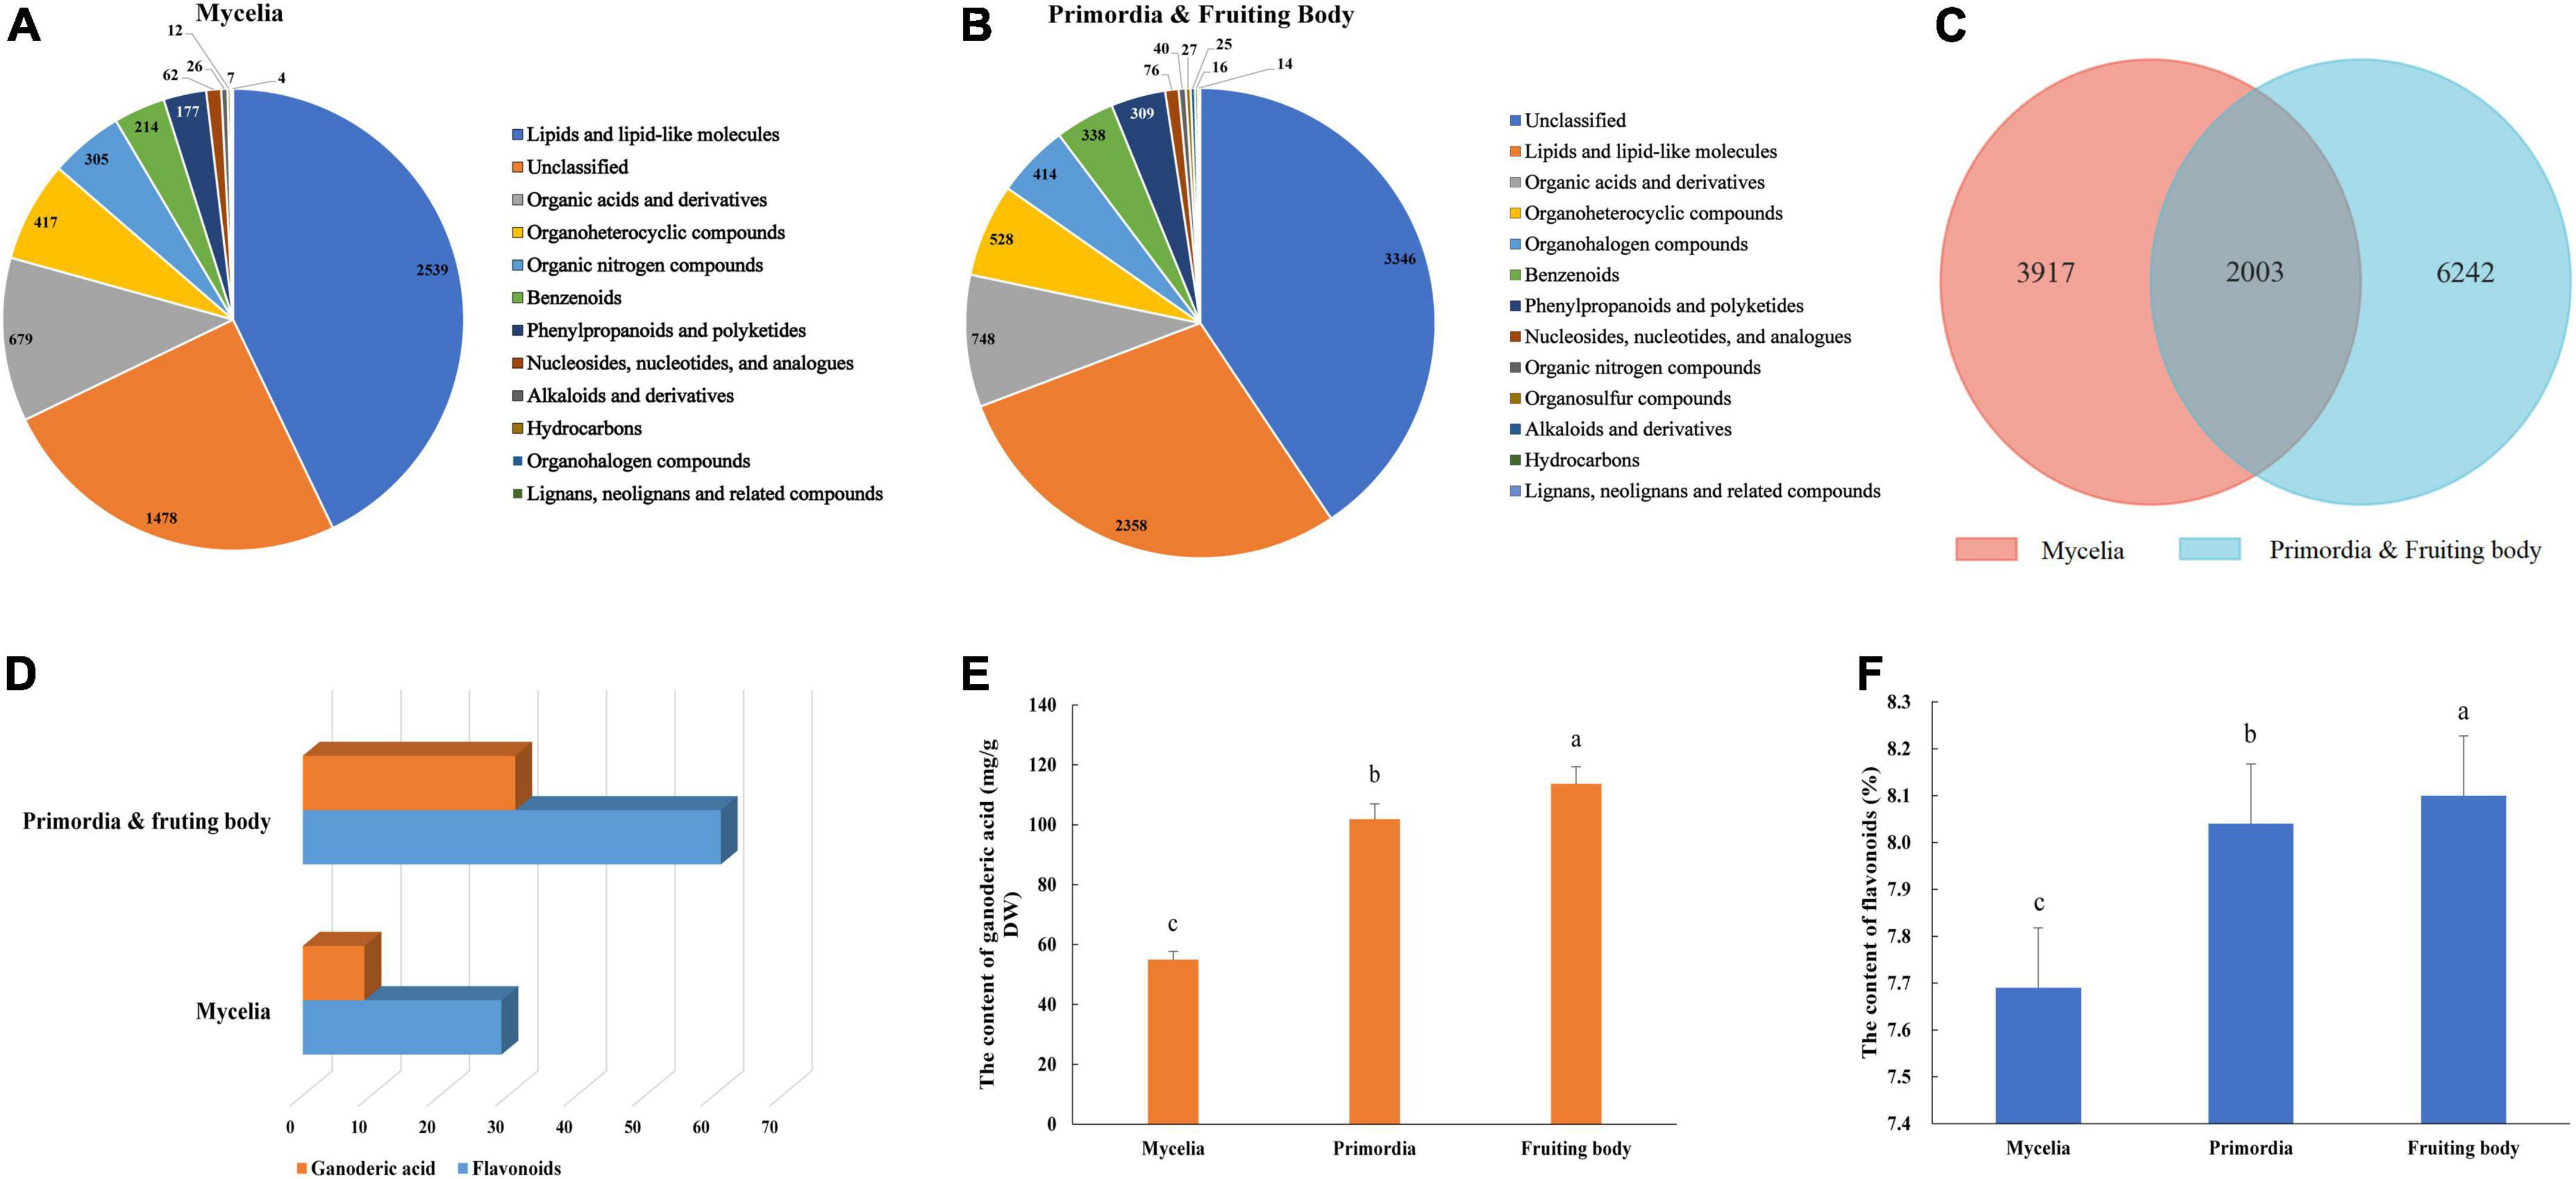
Figure 2. Metabolite identification in the development of G. lucidum. Panels (A,B) are the kinds of metabolites in the Mycelia, and Primordia and Fruiting body. Panel (C) the is Venn diagram of common metabolites in the Mycelia and Primordia and Fruiting body. Panels (D–F) are the kinds of secondary metabolites, contents of GAs and flavonoids. Means within a column carrying the same letter are not significantly different. Different superscript lowercase letters (a, b, and c) indicate significant differences (p < 0.05).
In order to elucidate mechanism underlying the effect of development on triterpenoid biosynthesis, we examined encoding enzymes involved in terpenoid backbone biosynthesis (Figure 3A). Results showed that phosphomevalonate kinase (MPK, GL17808), acetyl-CoA acetyltransferase (ACAT, GL26574), and farnesyl diphosphate synthase (FDPS, GL25499, GL22068) genes were significantly upregulated with fruiting body development (Figure 3B). Specifically, MPK, ACAT, and 2 FDPSs exhibited a 1.82-fold, 1.97-fold, 7.85-fold, and 10.60-fold upregulation in the fruiting body, respectively. Moreover, squalene monooxygenase (SE, GL22565) exhibited a 1.58-fold upregulation in the primordia compared with mycelia, while isopentenyl-diphosphate isomerase (IDI, GL29704), squalene synthase (SQS, GL21690) and oxidosqualene cyclase (OSC, GL18675) exhibited a 1. 06-, 1. 10-, and 1.16-fold upregulation, respectively, in the fruiting body relative to mycelia. Notably, the highest expression for most genes encoding enzymes was recorded during primordia or fruiting body developmental periods (Figure 3).
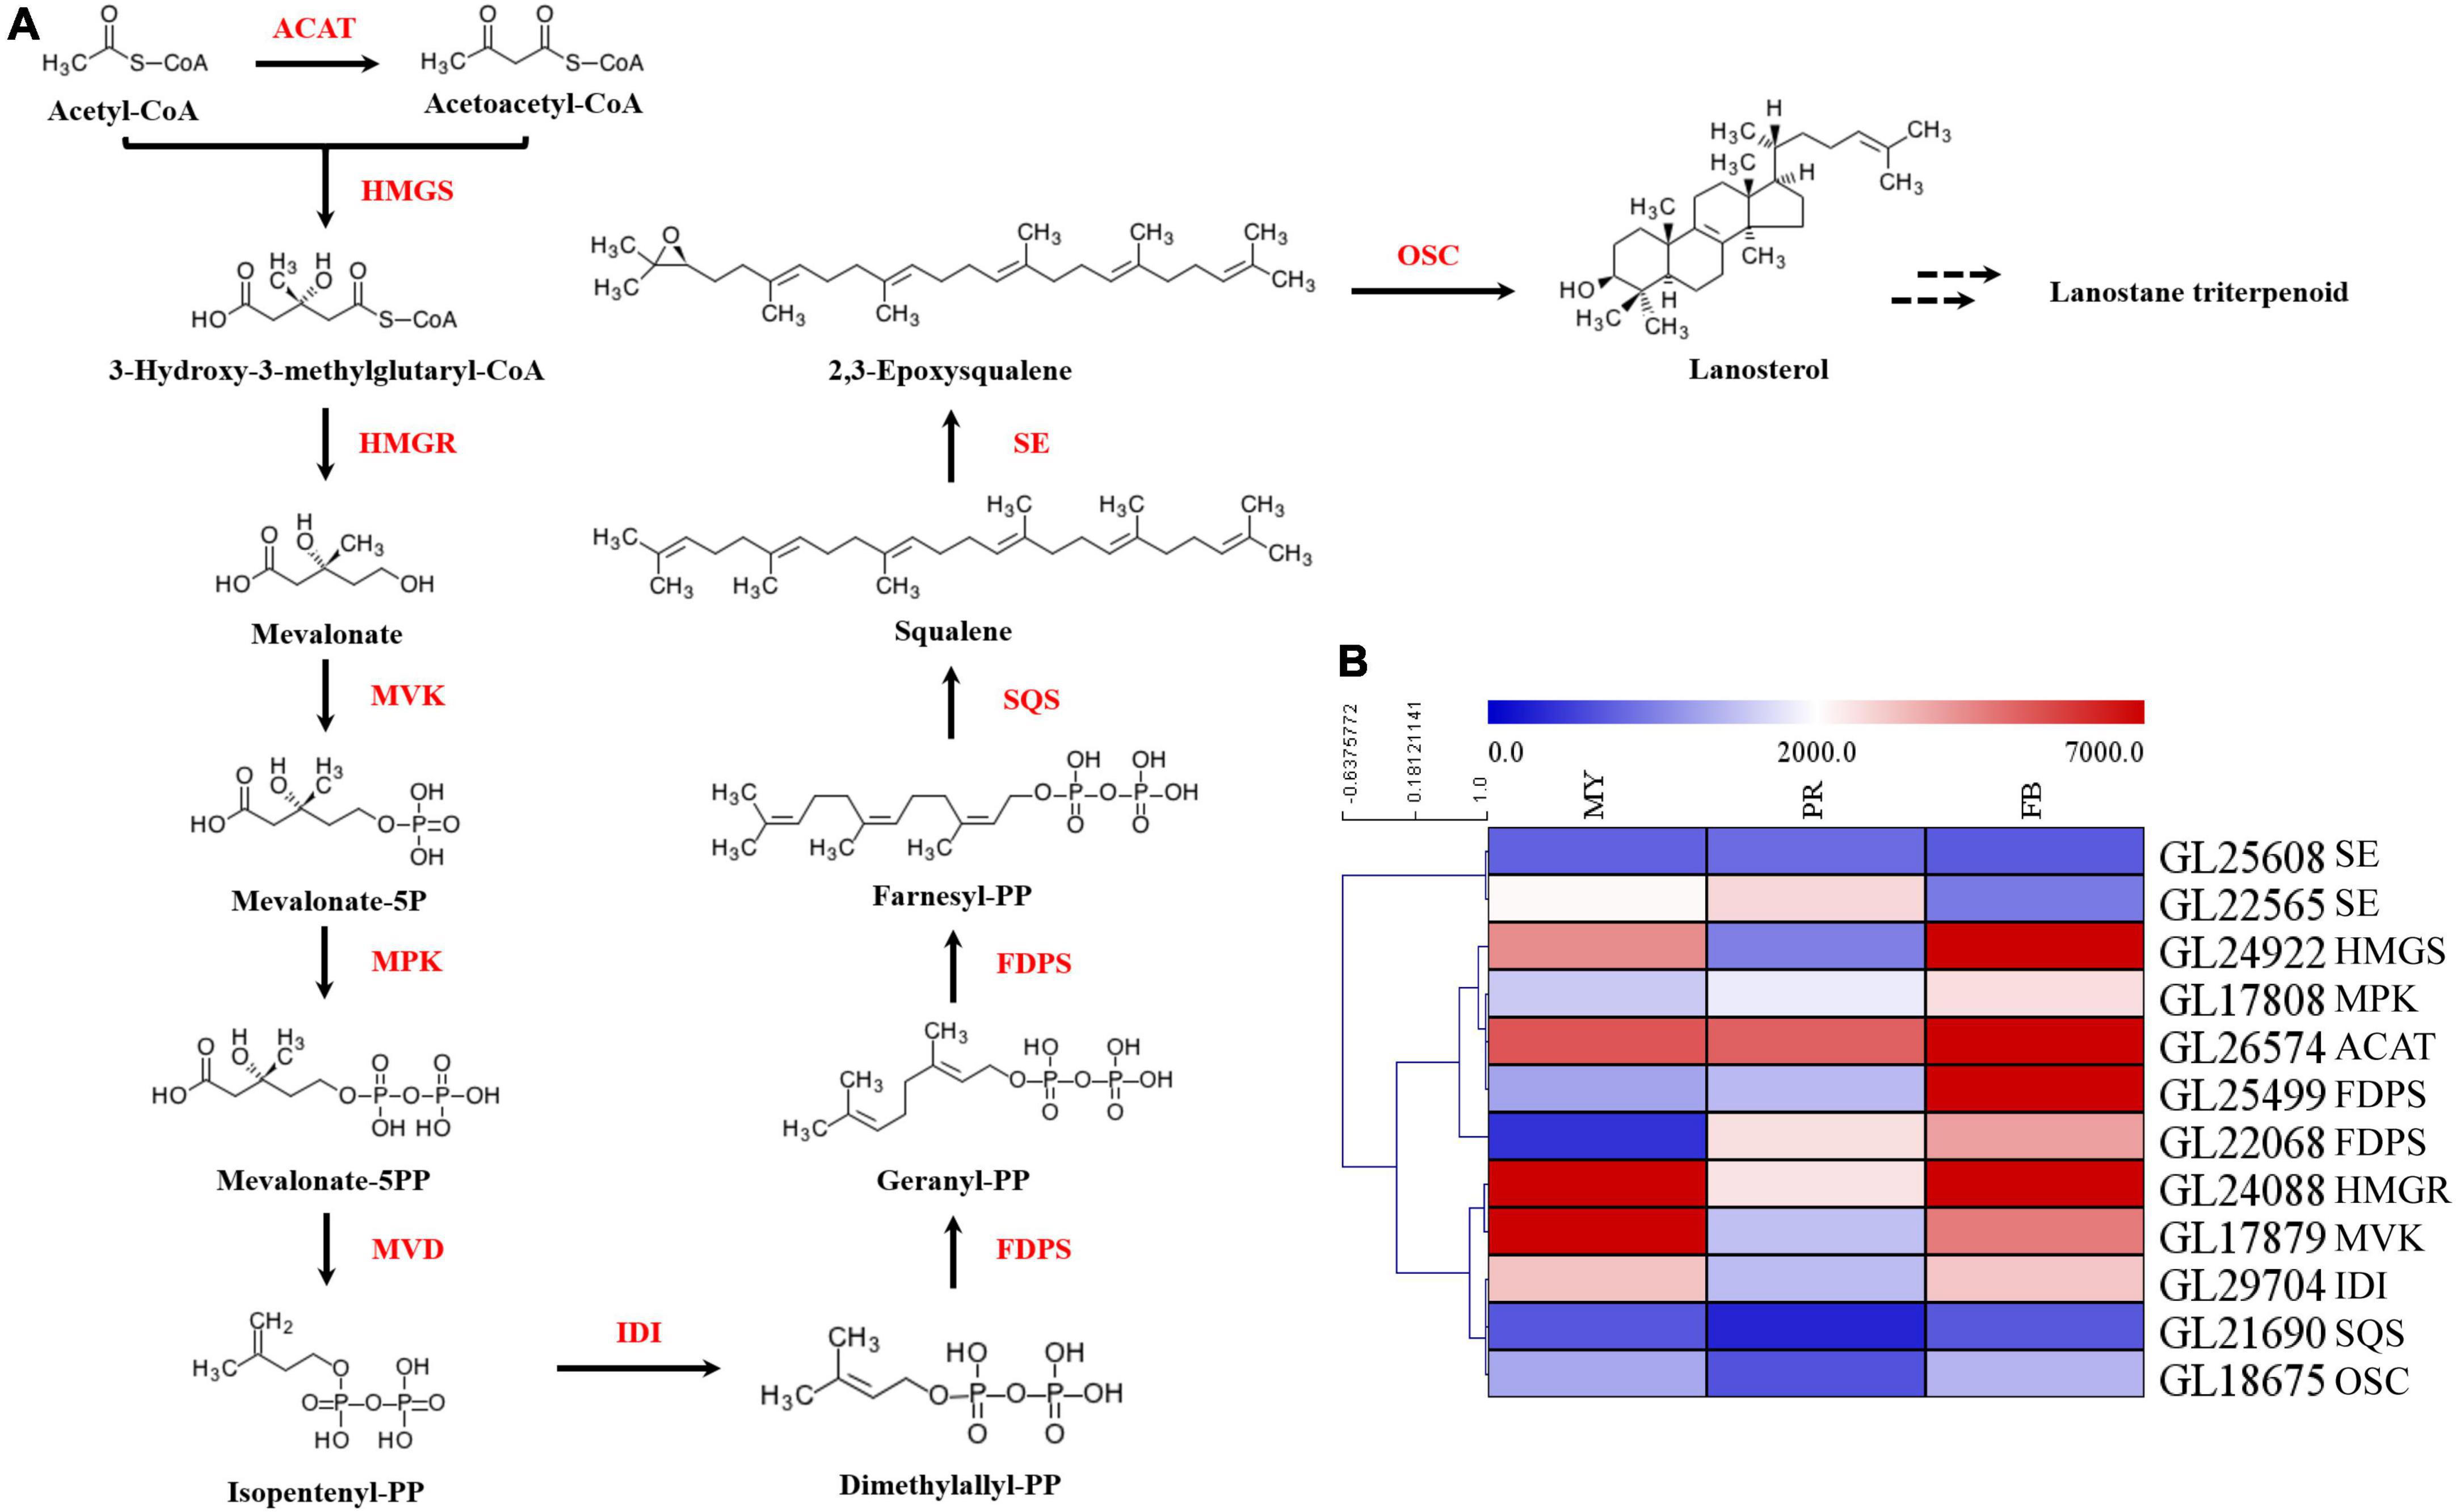
Figure 3. The key genes of enzymes in ganoderic acid biosynthesis pathway of G. lucidum. Panel (A) the terpenoid backbone biosynthesis in G. lucidum. Red represents the enzyme, and black represents the metabolites. Panel (B) the gene expression levels of enzymes involved in terpenoid backbone biosynthesis. ATAC, acetyl-CoA -acetyltransferase; HMGS, hydroxymethylglutaryl-CoA synthase; HMGR, 3-hydroxy-3-methylglutaryl-coenzyme A reductase; MVK, mevalonate kinase; MPK, phosphomevalonate kinase; MVD, pyrophosphomevalonate decarboxylase; IDI, isopentenyl-diphosphate isomerase; FDPS, farnesyl diphosphate synthase; SQS, squalene synthase; SE, squalene epoxidase; OSC, 2,3-oxidosqualene-lanosterol cyclase. MY, mycelia; PR, primordia; FB, fruiting body.
Transcription factors regulate gene expression in a cell, thus in many respects, their repertoire determines the cell’s life and functionality. To better understand the regulatory mechanisms underlying fungal development and secondary metabolism, we analyzed expression patterns of transcription factors during G. lucidum development.
Consequently, we identified a total of 516 homologous protein of transcription factors in G. lucidum. Among them, 90 had more than two domains, and belonged to 53 transcription factor families (Figure 4A and Supplementary Table 5). The highest number of significantly affected genes encoding transcription factors belonged to the C2H2 transcription factor family, followed by Zn2Cys6 and Zf-MYND (Figure 4B). A total of 110 differentially expressed transcription factors were recorded across the three stages (Supplementary Table 6). Moreover, 67 C2H2, 70 Zn2Cys6, and 50 Zine finger-MYND (Zf-MYND) transcription factors, including 24 DEGs of C2H2, 27 DEGs of Zn2Cys6, and 13 DEGs of Zf-MYND were expressed across the three stages Interestingly, mycelia exhibited the highest transcriptional levels for 15 DEGs of C2H2 (62.5%), and 24 DEGs of Zn2Cys6 (88.9%) transcription factors, while other DEGs expressed in the primordia or fruiting body. The primordia or fruiting body exhibited the highest transcriptional levels for 10 DEGs of Zf-MYND (76.9%) transcription factors. Collectively, these results suggested that these transcription factor homologs might be vital regulators of gene expression and play different roles at different developmental stages of G. lucidum.
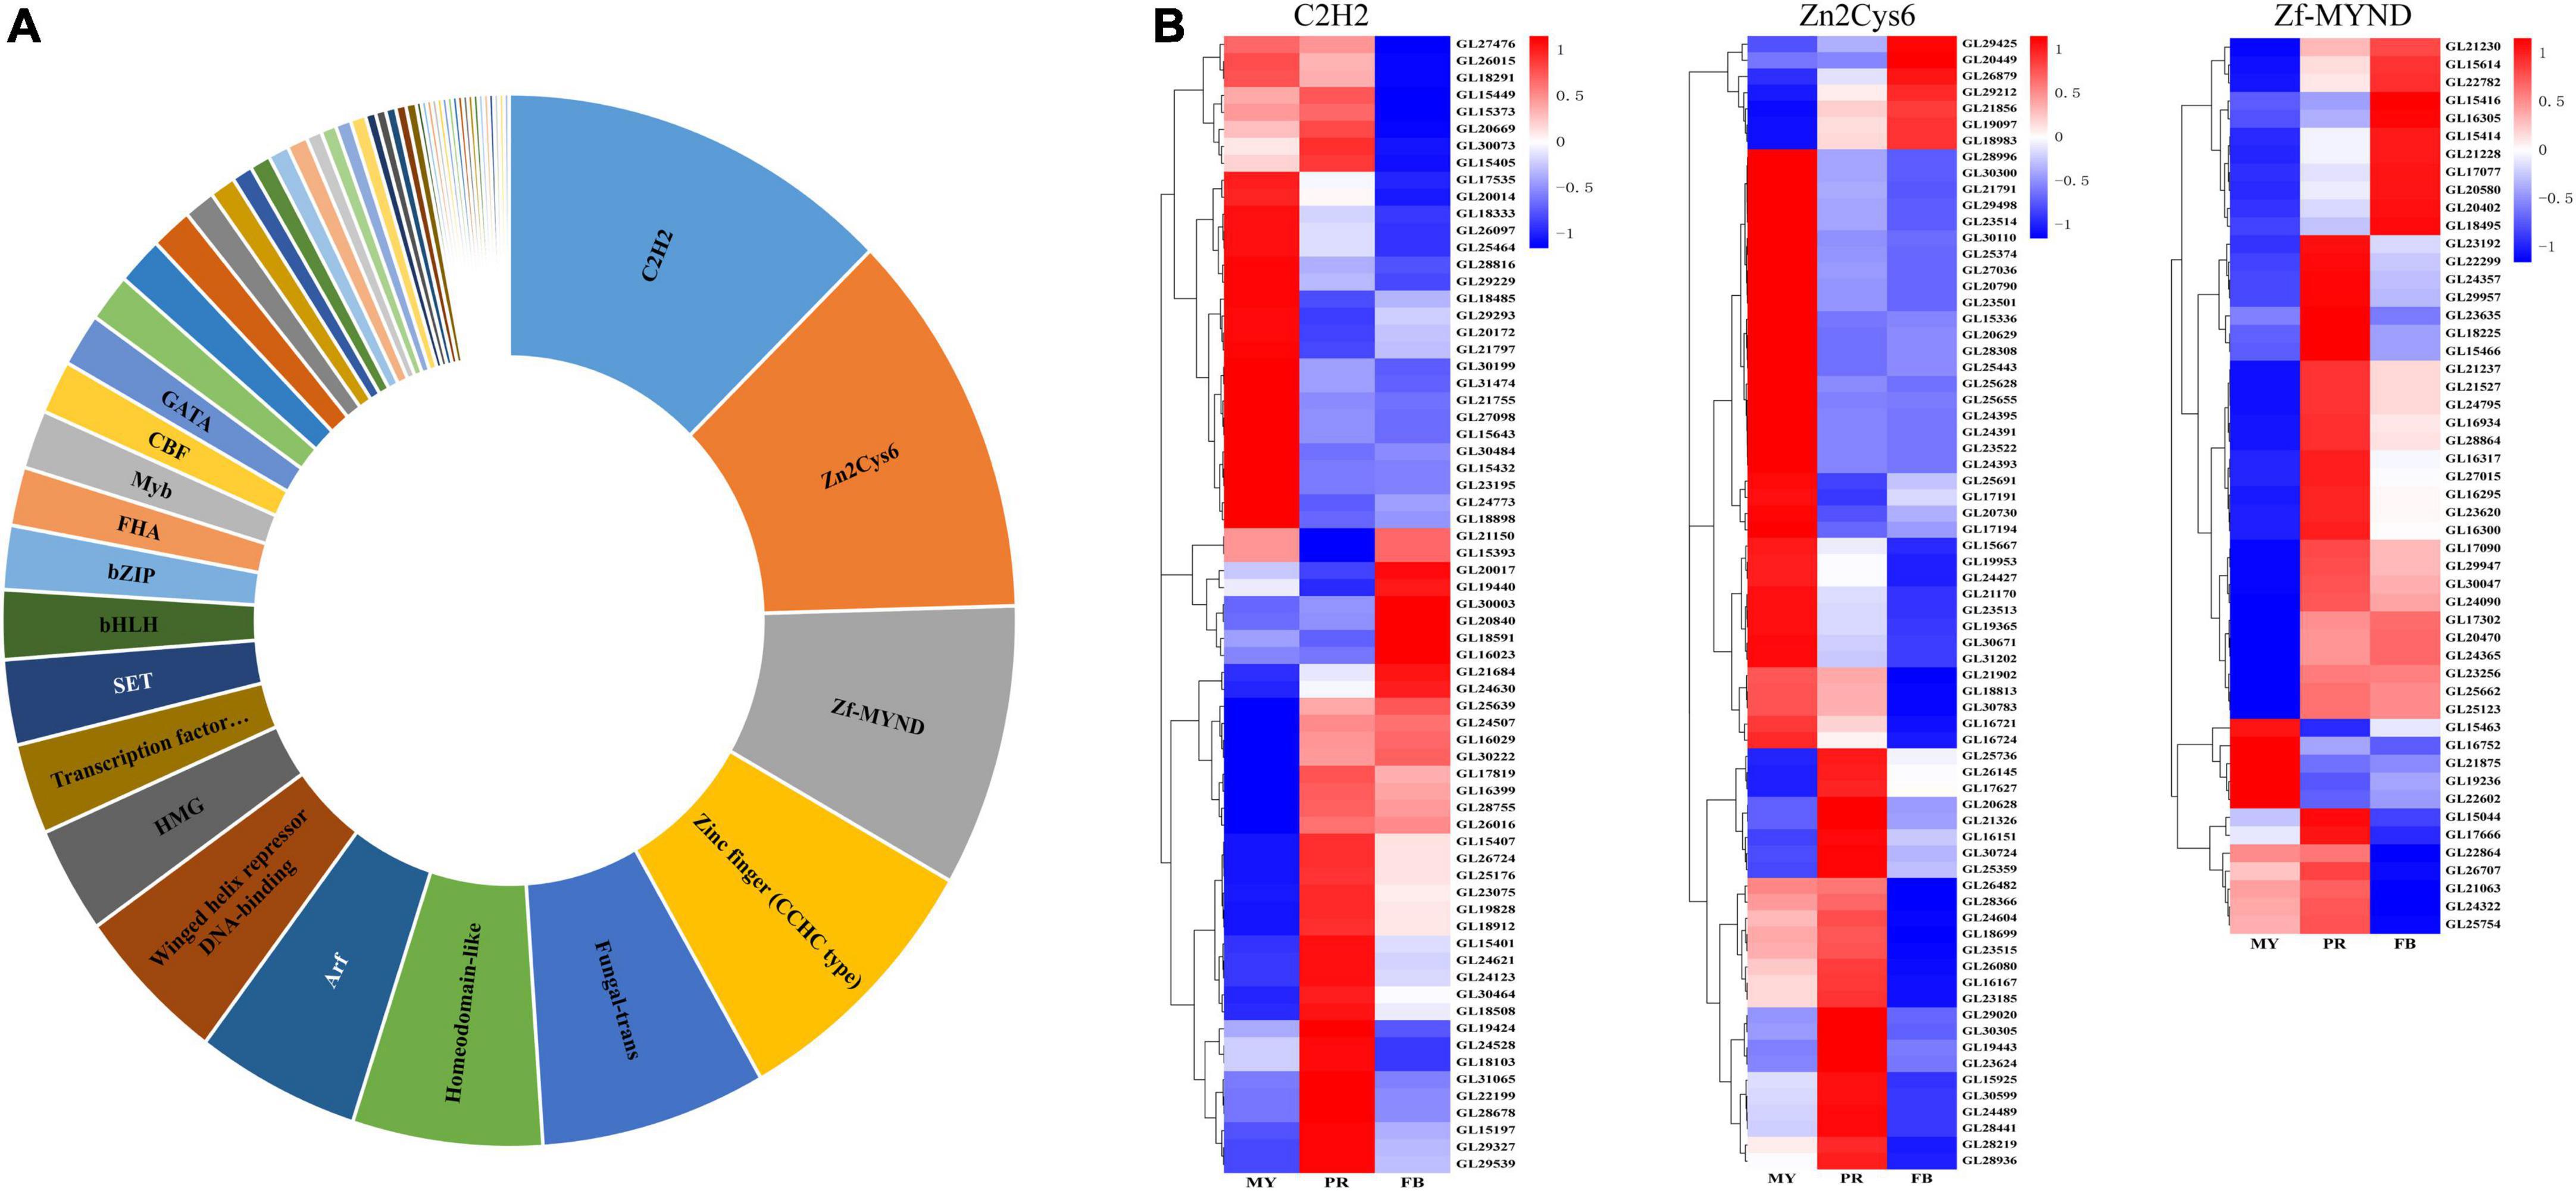
Figure 4. The transcription factors in Ganoderma lucidum. Panel (A) is the transcription factors family in G. lucidum. Panel (B) is the expression levels of C2H2, Zn2Cys6, and Zf-MYND in the development of G. lucidum. MY, mycelia; PR, primordia; FB, fruiting body.
Although homeobox transcription factors have been implicated in secondary metabolism in fungi (Cary et al., 2017), their roles in GA biosynthesis in G. lucidum are largely unknown. To further identify the relationship between homeobox transcription factors and GA biosynthesis, we annotated 9 homeobox transcription factors from the fungal transcription factor database, including 1 gene (GL30604) that was not expressed (Figure 5A). To screen the key homeobox transcription factors, we analyzed 1 kb promoter sequences upstream of hmgr and osc (pHmgr and pOsc) coding region via Yeastract database, and compared the cis-regulatory elements (CREs) present in pHmgr and pOsc with homeobox protein YOX1 in S. cerevisiae. Previous studies have shown that many common CREs in corresponding sites shared by pHmgr and pOsc can be recognized by many transcriptional factors (Guo et al., 2015). In the present study, we found that a homeobox transcription factor GL25472 contained CREs located in the promoter region of hmgr and osc (Figure 5B), and Yeast-one-hybrid results showed that GL25472 could bind to the promoter regions of hmgr and osc (Figure 5C). Therefore, we selected GL25472 for further investigations.
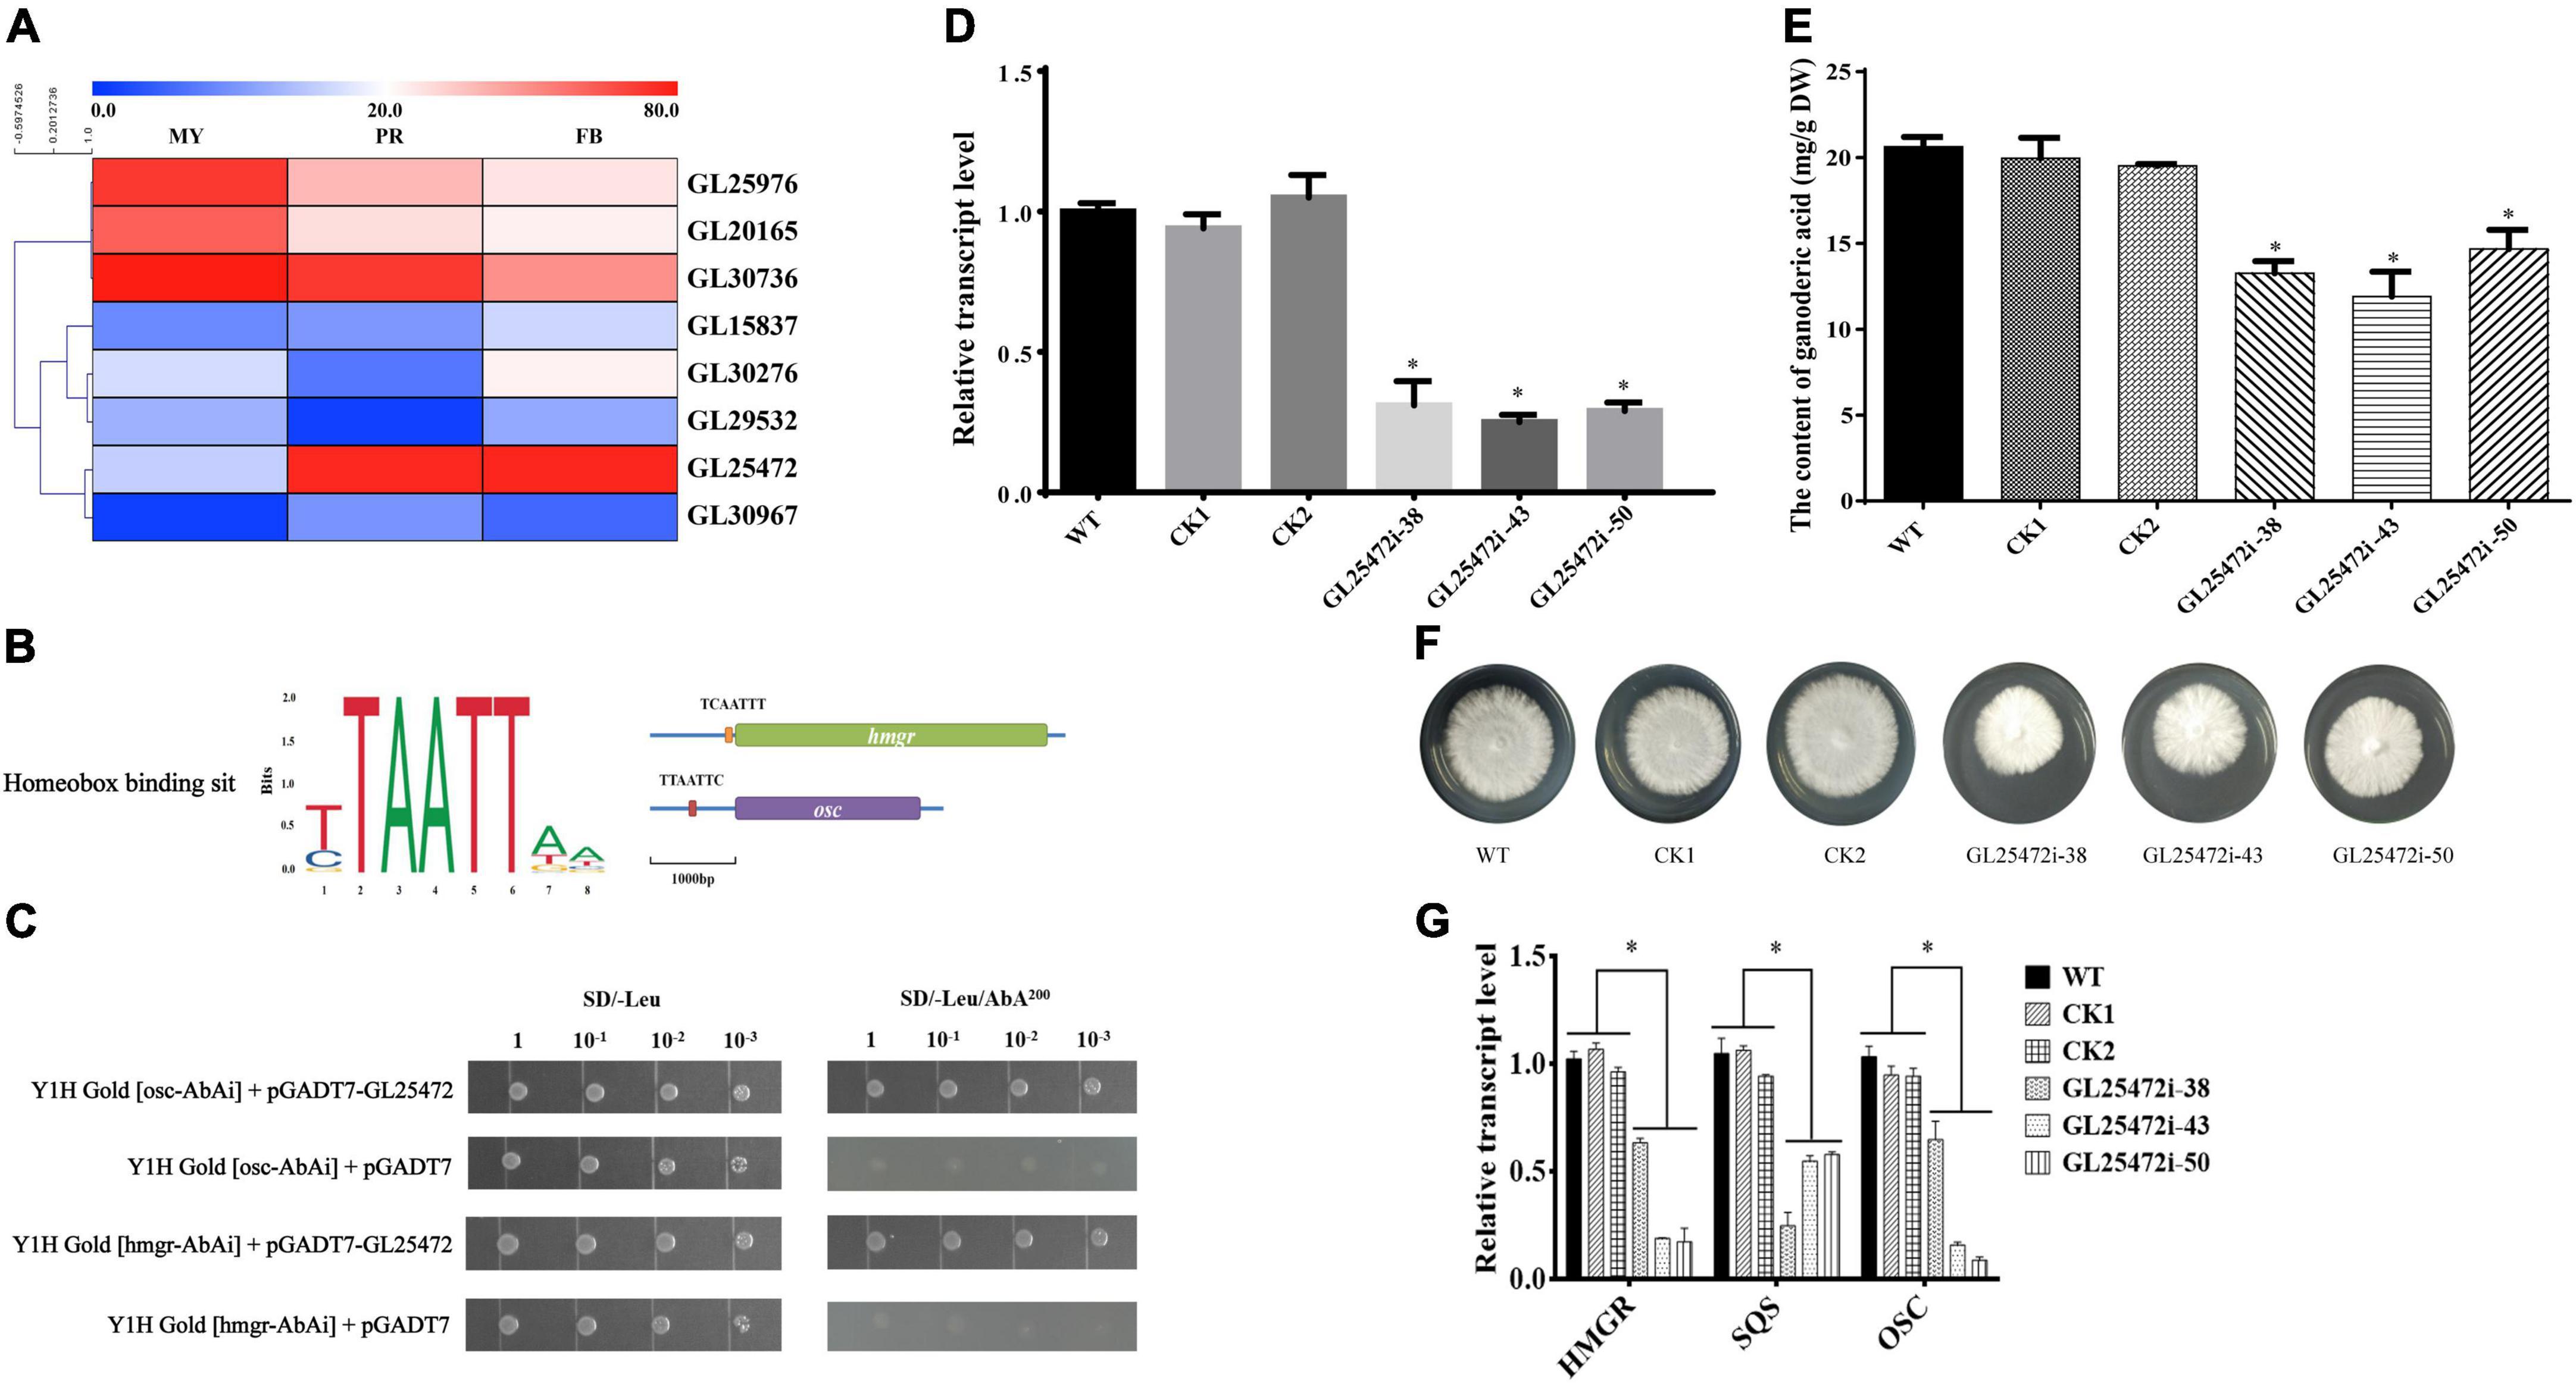
Figure 5. The effects of homeobox transcription factors on ganoderic acid biosynthesis in G. lucidum. Panel (A) is the gene expression level of homeobox transcription factors. MY, mycelia; PR, primordia; FB, fruiting body. Panel (B) is the binding sit of homeobox transcription factor. The orange box (TCAATTT) and red box (TTAATTC) were CREs located in the promoter region of hmgr and osc. Panel (C) is yeast one-hybrid assay. Panels (D,E) are the relative transcript levels and GA contents of gene-silencing strains. Panel (F) the mycelial colony. Panel (G) the transcript levels of the genes encoding key enzymes. WT (wild-type), CK1 and CK2 (the empty vector controls), GL25472 (38, 43, 50) were gene-silencing strains. HMGR, 3-hydroxy-3-methylglutaryl-coenzyme A reductase; SQS, squalene synthase; OSC, 2,3-oxidosqualene-lanosterol cyclase. The histograms marked with * represent significant differences; it indicates statistical significance (p < 0.05) compared to WT.
To determine whether GL25472 influences GA biosynthesis in G. lucidum, we constructed an RNAi vector targeting the GL25472 gene. qRT-PCR results revealed silencing efficiencies of 70, 75, and 71% for GL25472i-38, GL25472i-43, and GL25472i-50, respectively (Figure 5D). Moreover, GL25472i-38, GL25472i-43, and GL25472i-50 silencing constructs mediated a 35.73, 42.33, and 28.91% reduction in GA content of mycelia, respectively, compared to the WT strain (Figure 5E). Strains in which the GL25472 had been silenced also exhibited reduced growth rates (Figure 5F). Moreover, silencing of the GL26472 mediated a significant downregulation of HMGR, SQS, and OSC, key genes involved in GA biosynthesis, relative to WT strain (Figure 5G).
Previous studies have shown that the VeA-VelB-LaeA complex can activate secondary metabolism in fungi (Bayram et al., 2008). Therefore, we analyzed expression levels of members of the velvet family and LaeA across different development stages. We annotated three genes encoding velvet family protein, including VeA (GL19230), VelB (GL21819), and VelC (GL23472), and one gene (GL26103) encoding LaeA (Figure 6A). All velvet family proteins contain a velvet conserved domain, while VeA has a proline glutamic acid serine and threonine (PEST) rich sequence. Additionally, LaeA contains a S-adenosyl methionine-binding site (SAM) and a methyltransferase domain (MTD) in its amino acid sequence. Notably, VeA expression was upregulated during fruiting body development, with the highest level recorded at the fruiting body stage (Figure 6B). By contrast, VelB showed relatively high expression at primordia stage, while VelC was lowly expressed at the fruiting body stage. LaeA was down-regulated at both primordia and fruiting body stages.
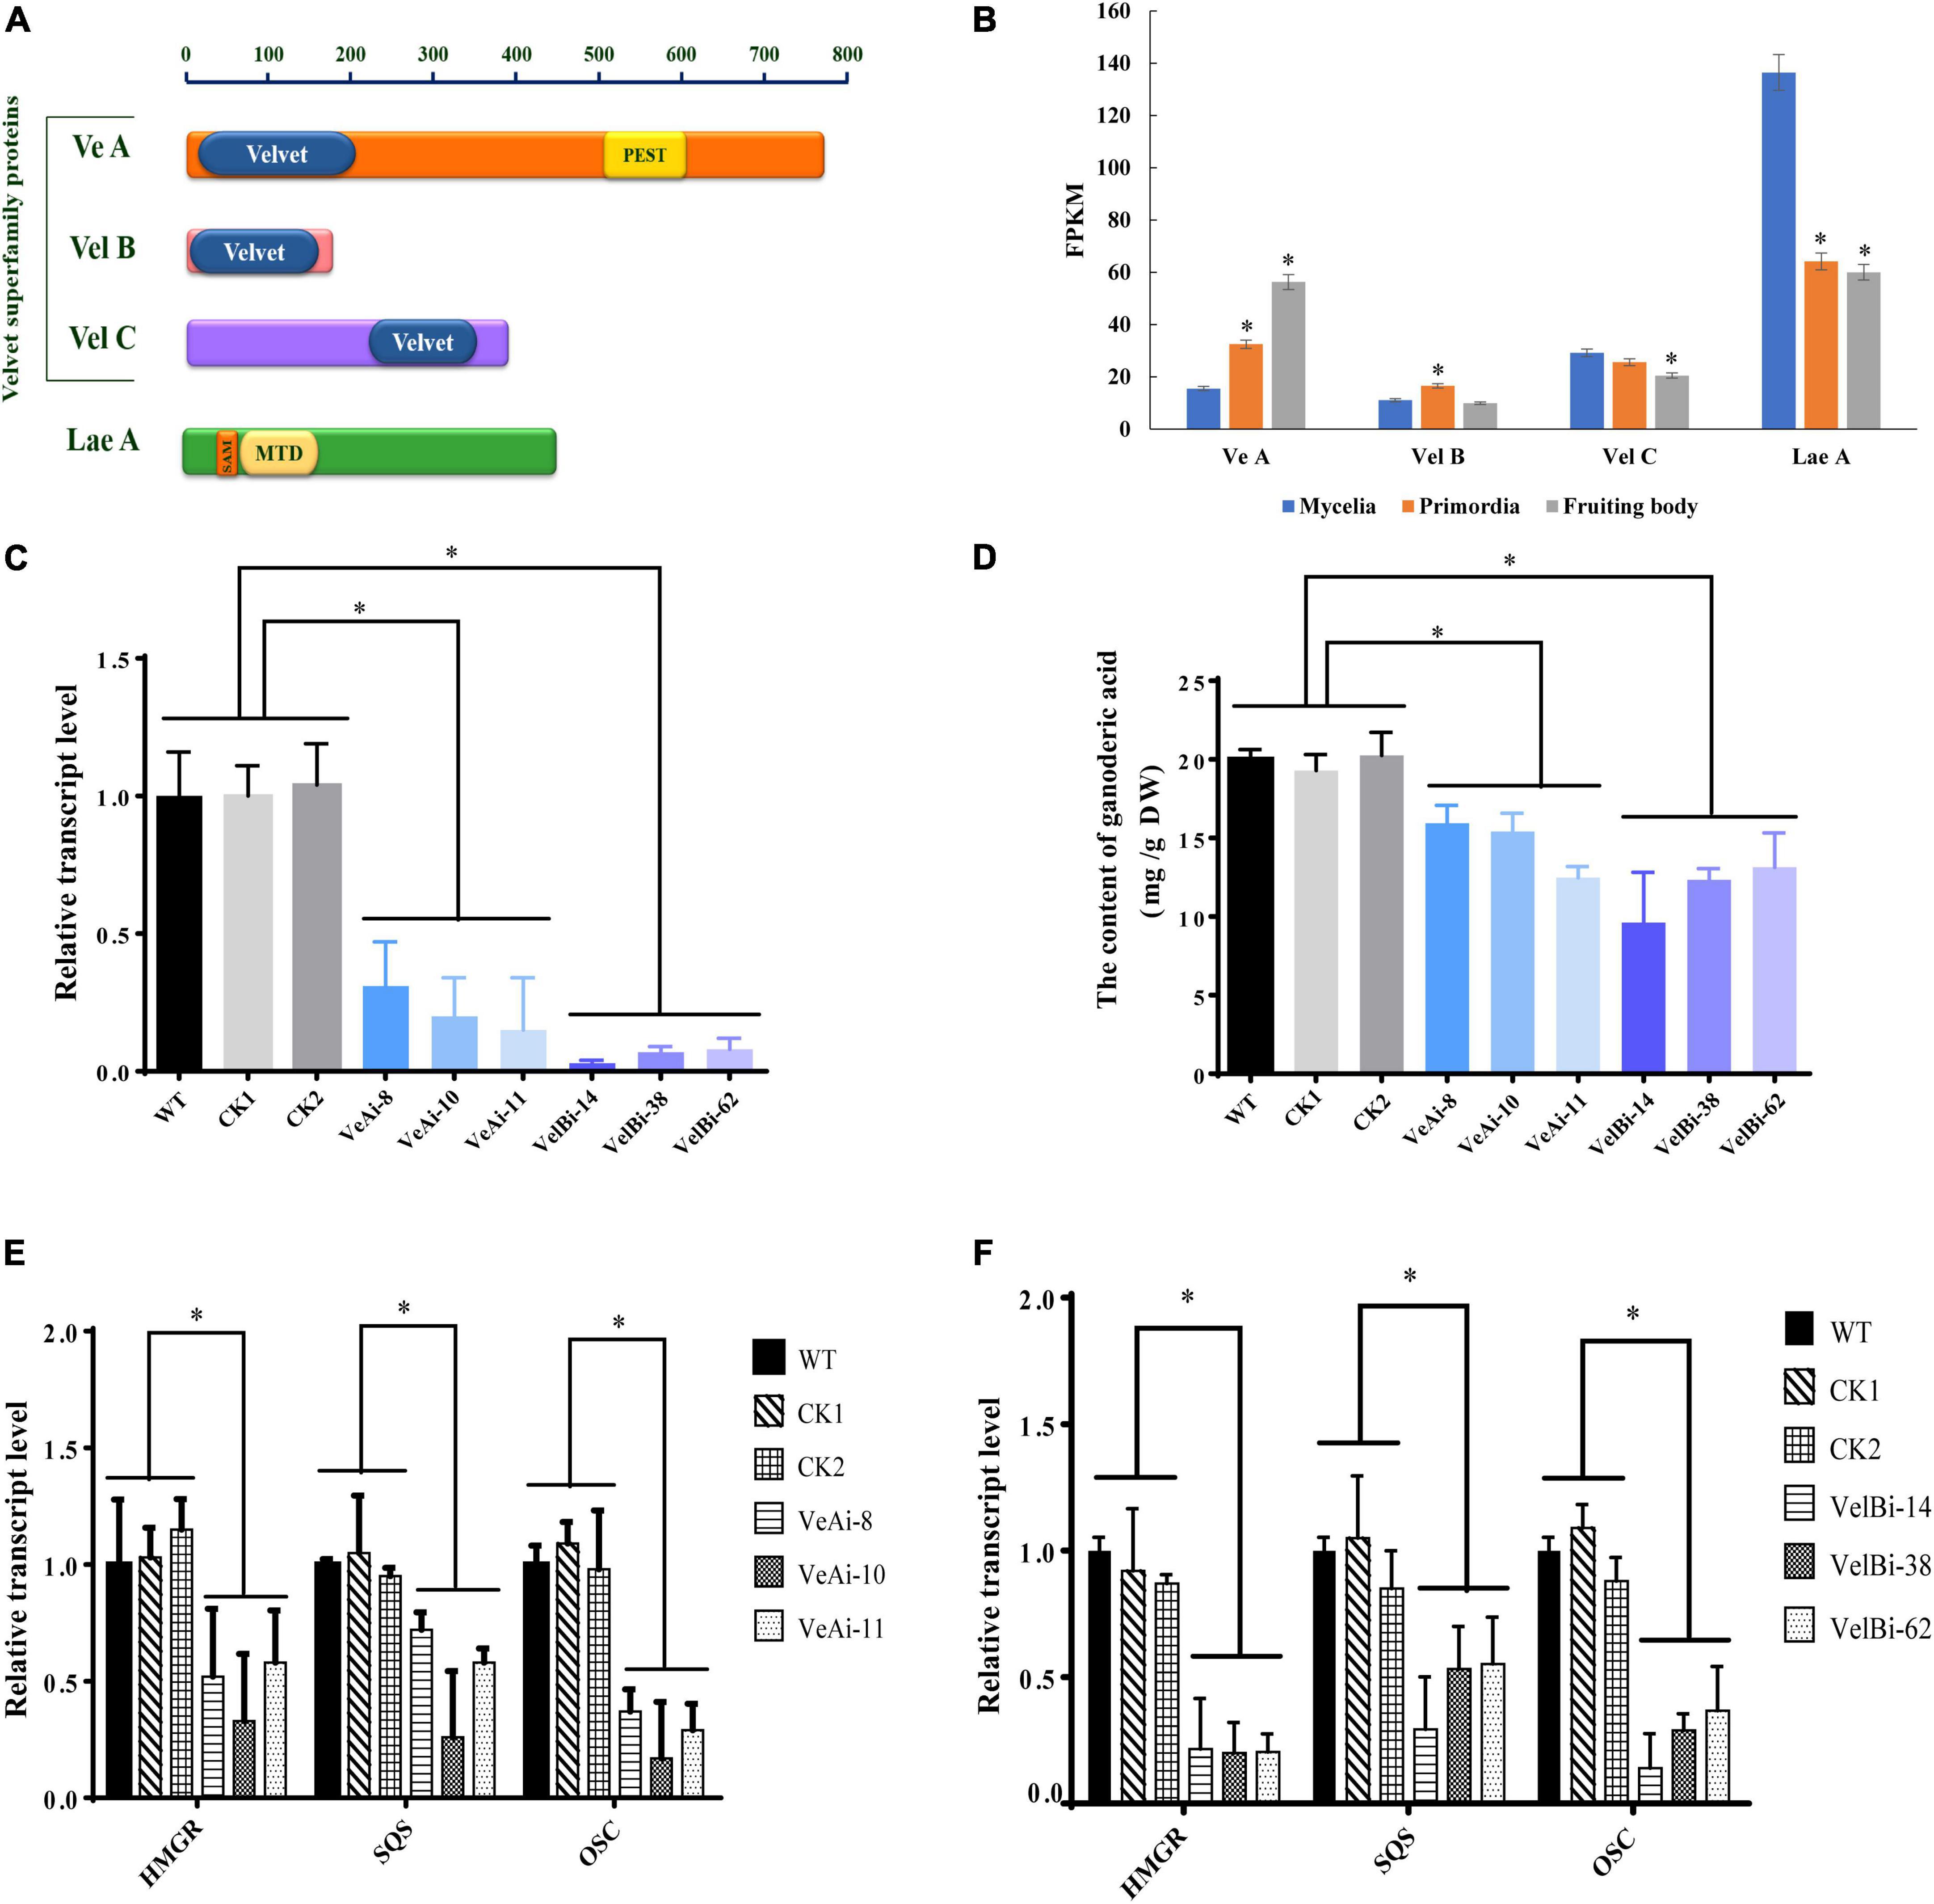
Figure 6. The effects of velvet family on ganoderic acid biosynthesis in G. lucidum. Panel (A) is predicted conserved domains. Panel (B) the gene expression level in development of G. lucidum. FPKM, Fragments Per Kilobase Million. Panels (C,D) are the gene expression levels and GA contents of VeA and VelB. Panels (E,F) are the transcript levels of the genes encoding key enzymes. WT (wild-type), CK1 and CK2 (the empty vector controls), VeAi (8, 10, 11) and VelBi (14, 38, 62) were gene-silencing strains. HMGR, 3-hydroxy-3-methylglutaryl-coenzyme A reductase; SQS, squalene synthase; OSC, 2,3-oxidosqualene-lanosterol cyclase. The histograms marked with * represent significant differences; it indicates statistical significance (p < 0.05) compared to WT.
To further study the function of velvet family proteins, we separately silenced two important key velvet family proteins, namely VeA and VelB, in G. lucidum via RNAi (Figure 6C). qRT-PCR results revealed a silencing efficiency of > 70%. Results showed that silencing of VeA and VelB mediated a significant reduction in GA content of mycelia compared to the WT strain (Figure 6D). Moreover, HMGR, SQS, and OSC, key genes involved in GA biosynthesis, were markedly down-regulated in VeA and VelB silencing strains compared to WT (Figures 6E,F). Collectively, these results indicated that velvet family proteins play a key role in development and GA biosynthesis in G. lucidum.
Transcription factors play essential roles in the signal transduction pathway, being the last link between signal flow and target genes expression. Fungi have significantly lower number of experimentally verified transcription factors compared to higher eukaryotes, as reflected in databases such as TRANSFAC (Wingender et al., 1996) and MycoPath. This phenomenon may be attributed to two possible scenarios: either they are really less abundant or they have not yet been identified. In this study, we estimated the potential mechanism underlying regulation of secondary metabolism during development of G. lucidum.
The transcriptional regulation process is a complex and dynamic process that is regulated by transcription factors. Expression of developmental transcription factors has also been found to be transiently present. Therefore, we quantified gene expression using previously described datasets (Chen et al., 2012). Although most gene expression models were similar in available transcriptome data, there were also localized distinctions between transcriptome data from different strains and growth status. In this study, transcriptome data revealed differentially expressed genes between mycelia and primordia, as well as between mycelia and the fruiting body. The difference is likely caused by two reasons. On the one hand, the discrepancy of gene expression profile could be due to differences Ganoderma in important aspects of growth and development. On the other hand, it could also be due to the differences between media.
Moreover, metabolome is often thought of as a “readout” of physiological states. Therefore, it is widely used in the study of the growth and development of organisms. Notably, mycelia, primordia and fruiting body stages resulted in largely similar types of metabolites, the major metabolites included lipids and lipid-like molecules, organic acids and derivatives, organoheterocyclic compounds, and organic nitrogen compounds. However, a large diversity of metabolites between mycelia and primordia/fruiting body were also significantly different. There were 3,917 specific metabolites in mycelia, and 6,242 specific metabolites in primordia and fruiting body stages. Previous report has revealed that fungal lipids are involved in organism development as well as regulatory machinery for secondary metabolism (Tugizimana et al., 2019). In this regard, linolenic -, oleic -, nonanoic - and decanoic acids have been shown to participate in the regulation of spore development and mycotoxin production in Aspergillus spp., and Fusarium verticillioides (Christensen and Kolomiets, 2011). Concerning secondary metabolites during developmental stages, ten out of the thirty-two GAs in the primordia/fruiting body stages were same with those in mycelia stage. Twenty-two GAs were unique in primordia/fruiting body, such as Ganoderenic acid B, Ganoderenic acid A, and so on, and the flavonoids greatly varied between mycelia and primordia/fruiting body (Supplementary material). These results implied that secondary metabolite patterns were altered as development progresses. The mechanism for this association may be multifaceted. One speculation might be perhaps that the variation in development resulted in diversity of metabolites. Another speculation might be perhaps that the various metabolites had an impact on the fungal development.
This is the first time a direct link has been shown between fruiting body development and GA biosynthesis in G. lucidum (Figure 7). In this study, we found that the homeobox transcription factor and velvet family protein played an important role in regulating the GA biosynthesis in during G. lucidum development. We previously identified and characterized a transcription factor MADS1, which can regulate GA biosynthesis, and the gene-silencing mutants of MADS1 hinder the formation of the primordia in G. lucidum (Meng et al., 2021). Previous studies have shown that strains in which the Cys2His2 zinc finger protein gene C2H2 has been inactivated are arrested at the aggregate stage (Ohm et al., 2011). Results of the present study revealed that C2H2 transcription factors were upregulated in mycelia than in both primordia and fruiting body, a phenomenon that may contribute to mycelia aggregation. Studies have also shown that C2H2 transcription factors, such as glcrz2, play an important role in secondary metabolism (Li and Zhong, 2020). Notably, knocking out glcrz2 resulted in marked attenuation of both mycelia growth and GA synthesis, and this was accompanied by a decline in GA production even with Ca2+ treatment. In addition, Zhang et al. (2018) found that silencing GlSwi6 reduced fungal growth and increased hyphal branching, and the GlSwi6-silenced strains did not exhibit primordium or fruiting body formation. Moreover, the GA level of the GlSwi6-silenced strains decreased approximately 25% compared with those of the WT strain. The similar phenotypic characteristics were found in knockdown of GlSlt2 (Zhang et al., 2017b). These results showed that GlSwi6 and GlSlt2 were involved in fungal growth, development and GA biosynthesis in G. lucidum.
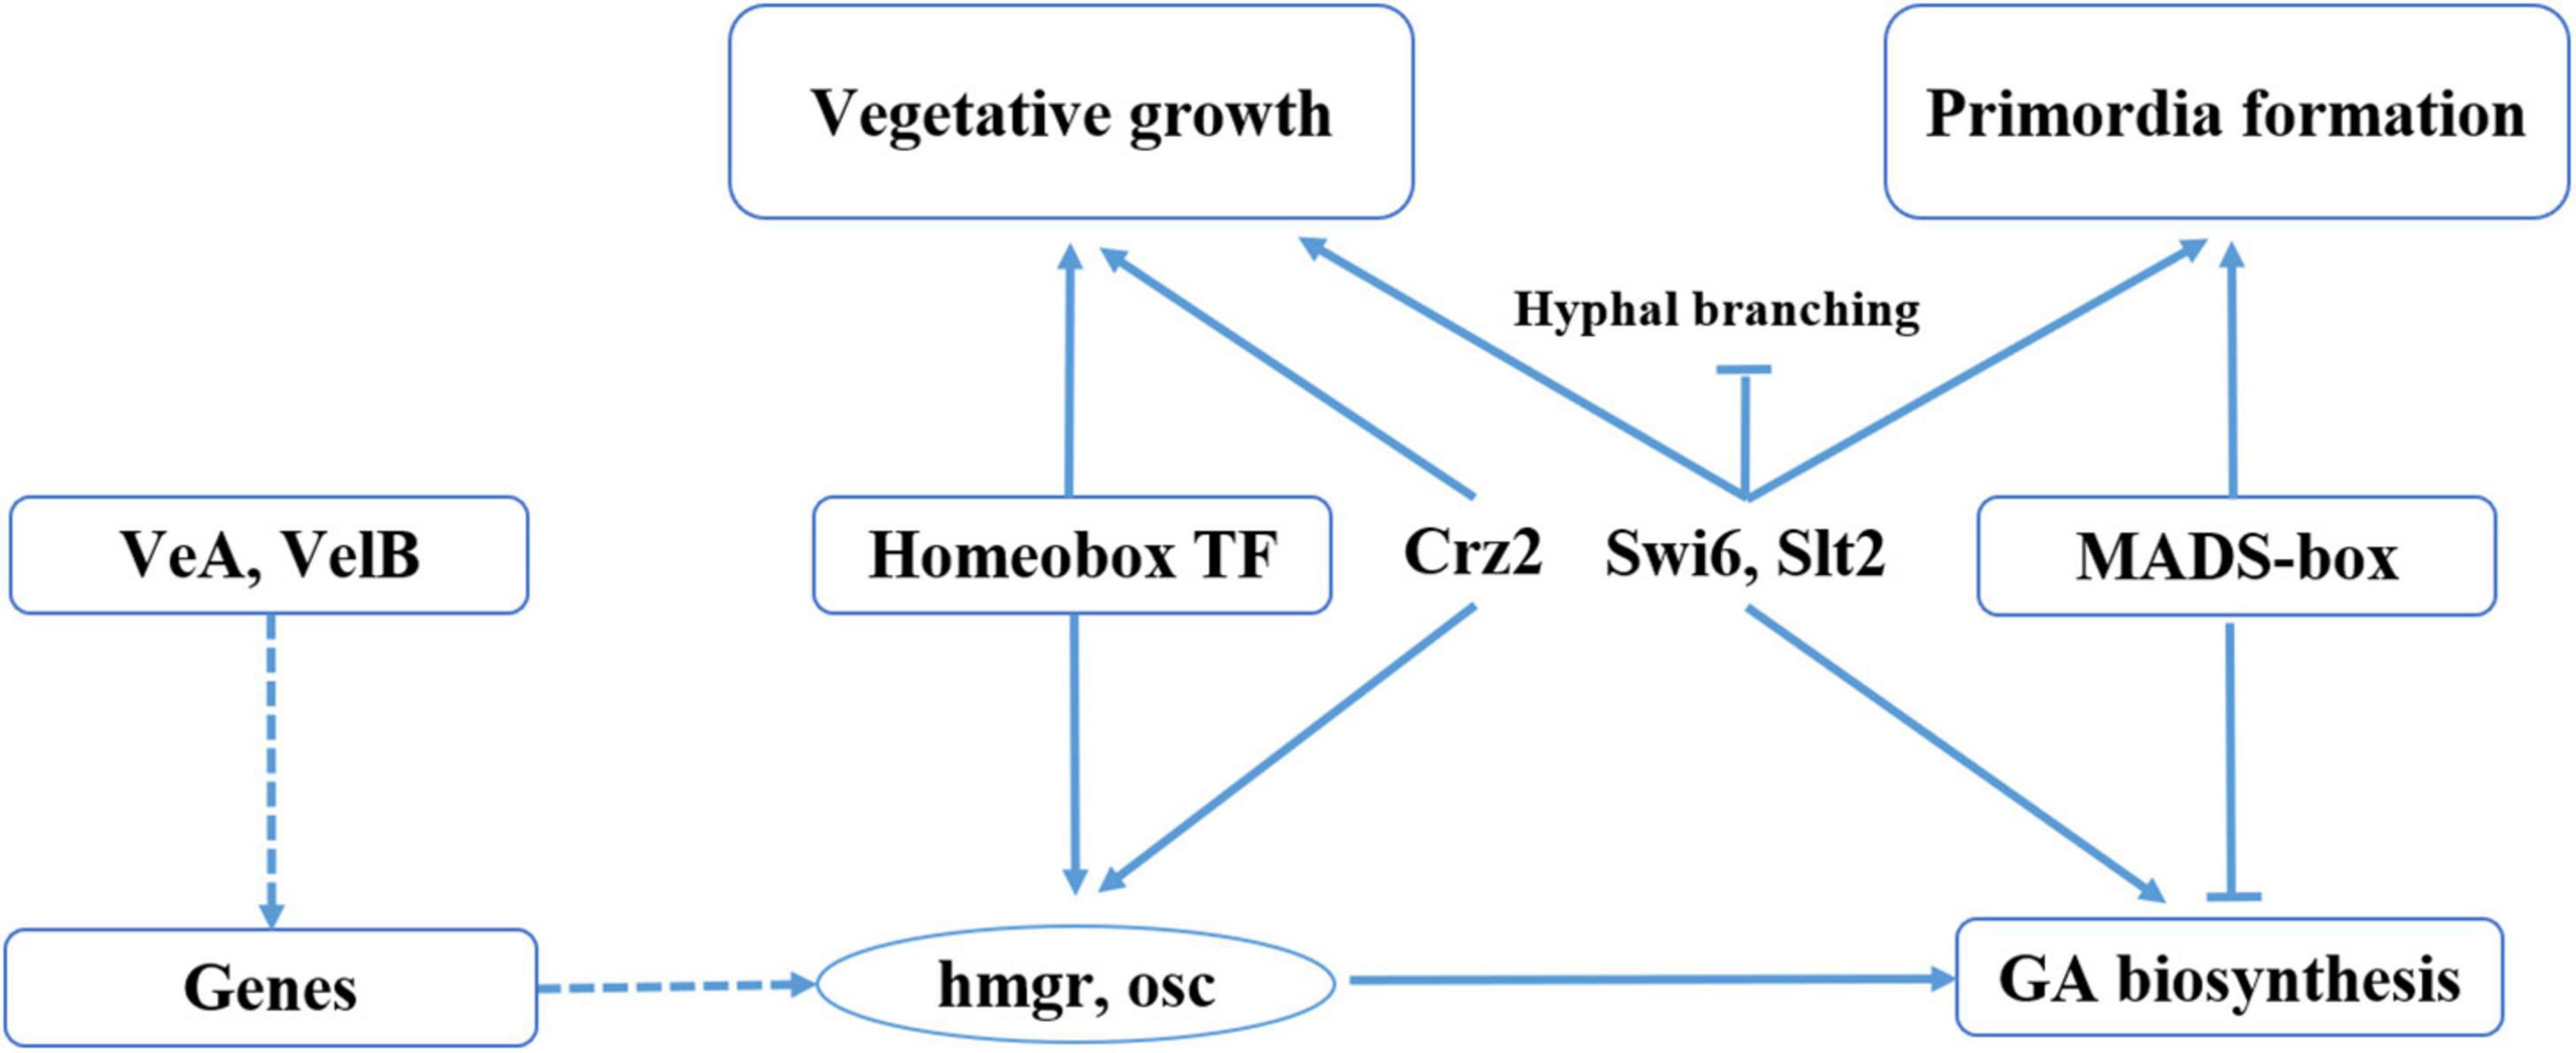
Figure 7. Model of regulation of fruiting body development and GA biosynthesis in G. lucidum. Solid lines represent the determined regulatory effect, dotted lines represent the regulatory effect of an unknown regulatory mechanism, arrows represent the facilitated effect, and short lines represent inhibition.
Furthermore, there are several no defined InterPro Term in the Fungal Transcription Factor Database, such as the heat shock factor. Previous studies have demonstrated that heat stress modulates heat shock protein expression, thereby affecting GA biosynthesis and hyphal branching of G. lucidum via Cytosolic Ca2+. However, the identified transcription factors might be less than the actual number in G. lucidum, due to lack the defined InterPro. The large array of transcription factors annotated in the present study warrant further research attention. There is also need to investigate many aspects, such as the function of transcription factors, gene interactions, and transcriptional regulatory networks, among others.
In summary, transcription factors act as an important link between secondary metabolites biosynthesis and fungal development. In the present study, we found that genes were differentially expressed between mycelia and primordia. GO terms of the DEGs revealed that secondary metabolite biosynthetic process significantly changed during fungal development. A set of 53 potential transcription factor families was annotated in G. lucidum. Notably, we found homeobox transcription factor and velvet family protein played important role in GA biosynthesis. Combined with previous studies, we provided a model diagram of transcription factors involved in GA biosynthesis during fruiting body formation. Taken together, these findings are expected to significantly improve our understanding of secondary metabolites biosynthesis and development in fungi.
The datasets presented in this study can be found in online repositories. The names of the repository/repositories and accession number(s) can be found in the article/Supplementary material.
LM: conceptualization, funding acquisition, and writing – original draft. RZ: methodology. XZ: investigation. JL: formal analysis. QW: visualization. PW: software. LW: project administration. ZL: supervision. WW: writing – review and editing. All authors contributed to the article and approved the submitted version.
This work was financially supported by the National Natural Science Foundation of China (grant number 32002107) and the Mushroom Technology System of Shandong Province (grant number SDAIT-07-06).
We thank the Shanghai LuMing biological technology Co., Ltd., (Shanghai, China) for providing metabolomics services.
The authors declare that the research was conducted in the absence of any commercial or financial relationships that could be construed as a potential conflict of interest.
All claims expressed in this article are solely those of the authors and do not necessarily represent those of their affiliated organizations, or those of the publisher, the editors and the reviewers. Any product that may be evaluated in this article, or claim that may be made by its manufacturer, is not guaranteed or endorsed by the publisher.
The Supplementary Material for this article can be found online at: https://www.frontiersin.org/articles/10.3389/fmicb.2022.956421/full#supplementary-material
Ahmad, M. F. (2018). Ganoderma lucidum: Persuasive biologically active constituents and their health endorsement. Biomed. Pharmacother. 107, 507–519. doi: 10.1016/j.biopha.2018.08.036
Baby, S., Johnson, A. J., and Govindan, B. (2015). Secondary metabolites from Ganoderma. Phytochemistry 114, 66–101.
Bayram, Ö, Bayram, ÖS., Ahmed, Y. L., Maruyama, J., Valerius, O., Rizzoli, S. O., et al. (2012). The Aspergillus nidulans MAPK module AnSte11-Ste50-Ste7-Fus3 controls development and secondary metabolism. PLoS Genet. 8:e1002816. doi: 10.1371/journal.pgen.1002816
Bayram, Ö, Krappmann, S., Ni, M., Bik, J. W., Helmstaedt, K., Valerius, O., et al. (2008). VelB/VeA/LaeA complex coordinates light signal with fungal development and secondary metabolism. Science 320, 1504–1506. doi: 10.1126/science.1155888
Calvo, A. M., Wilaon, R. A., Bok, J. W., and Keller, N. P. (2002). Relationship between secondary metabolism and fungal development. Microbiol. Mol. Biol. Rev. 66, 447–459.
Cao, P. F., Wu, C., Dang, Z., Shi, L., Jiang, A., Ren, A., et al. (2017). Effects of exogenous salicylic acid on ganoderic acid biosynthesis and the expression of key genes in the ganoderic acid biosynthesis pathway in the lingzhi or reishi medicinal mushroom, Ganoderma lucidum (Agaricomycetes). Int. J. Med. Mushrooms 19, 65–73. doi: 10.1615/IntJMedMushrooms.v19.i1.70
Cary, J. W., Harris-Coward, P., Scharfenstein, L., Mack, B. M., Chan, P., Wei, Q., et al. (2017). The Aspergillus flavus homeobox gene, hbx1, is required for development and aflatoxin production. Toxins 9:315. doi: 10.3390/toxins9100315
Chen, S., Xu, J., Liu, C., Zhu, Y., Nelson, D. R., Zhou, S., et al. (2012). Genome sequence of the model medicinal mushroom Ganoderma lucidum. Nat. Commun. 3:913.
Christensen, S. A., and Kolomiets, M. V. (2011). The lipid language of plant-fungal interactions. Fungal Genet. Biol. 48, 4–14. doi: 10.1016/j.fgb.2010.05.005
Demain, A. L., and Fang, A. (2000). “The natural functions of secondary metabolites,” in History of modern biotechnology i. advances in biochemical engineering/biotechnology, Vol. 69, ed. A. Fiechter (Berlin: Springer).
Guo, D., Yi, H., Li, H., Liu, C., Yang, Z., and Peng, S. (2015). Molecular characterization of HbCZF1, a Hevea brasiliensis CCCH-type zinc finger protein that regulates hmg1. Plant Cell Rep. 34, 1569–1578. doi: 10.1007/s00299-015-1809-6
Haug, K., Cochrane, K., Nainala, V. C., Williams, M., Chang, J., Jayaseelan, K. V., et al. (2019). MetaboLights: A resource evolving in response to the needs of its scientific community. Nucleic Acids Res. 48, D440–D444. doi: 10.1093/nar/gkz1019
Li, H., and Zhong, J. (2020). Role of calcineurin-responsive transcription factor CRZ1 in ganoderic acid biosynthesis by Ganoderma lucidum. Process Biochem. 95, 166–173.
Lian, L., Shi, L., Zhu, J., Liu, R., Shi, L., Ren, A., et al. (2022). GlSwi6 positively regulates cellulase and xylanase activities through intracellular Ca2+ signaling in Ganoderma lucidum. J. Fungi 8:187. doi: 10.3390/jof8020187
Livak, K. J., and Schmittgen, T. D. (2001). Analysis of relative gene expression data using real-time quantitative PCR and the 2-ΔΔCt method. Methods 25, 402–408.
Meng, L., Bai, X., Zhang, S., Zhang, M., Zhou, S., Mukhtar, I., et al. (2019). Enhanced ganoderic acids accumulation and transcriptional responses of biosynthetic genes in Ganoderma lucidum fruiting bodies by elicitation supplementation. Int. J. Mol. Sci. 20:2830. doi: 10.3390/ijms20112830
Meng, L., Zhang, S., Chen, B., Bai, X., Li, Y., Yang, J., et al. (2021). The MADS-box transcription factor GlMADS1 regulates secondary metabolism in Ganoderma lucidum. Mycologia 113, 12–19. doi: 10.1080/00275514.2020.1810515
Meng, L., Zhou, R., Lin, J., Wang, Q., Wang, P., Wang, W., et al. (2022). Integrated transcriptomics and nontargeted metabolomics analysis reveal key metabolic pathways in Ganoderma lucidum in response to ethylene. J. Fungi 8:456. doi: 10.3390/jof8050456
Ohm, R. A., de Jong, J. F., de Bekker, C., Wösten, H. A. B., and Lugones, L. G. (2011). Transcription factor genes of Schizophyllum commune involved in regulation of mushroom formation. Mol. Microbiol. 81, 1433–1445. doi: 10.1111/j.1365-2958.2011.07776.x
Shang, C., Shi, L., Ren, A., Qin, L., and Zhao, M. (2010). Molecular cloning, characterization, and differential expression of a lanosterol synthase gene from Ganoderma lucidum. Biosci. Biotechnol. Biochem. 74, 974–978. doi: 10.1271/bbb.90833
Shang, C., Zhu, F., Li, N., Ou-Yang, X., Shi, L., Zhao, M., et al. (2008). Cloning and characterization of a gene encoding HMG-CoA reductase from Ganoderma lucidum and its functional identification in yeast. Biosci. Biotechnol. Biochem. 72, 1333–1339. doi: 10.1271/bbb.80011
Tugizimana, F., Djami-Tchatchou, A. T., Fahrmann, J. F., Steenkamp, P. A., Piater, L. A., and Dubery, I. A. (2019). Time-resolved decoding of metabolic signatures of in vitro growth of the hemibiotrophic pathogen Colletotrichum sublineolum. Sci. Rep. 9:3290. doi: 10.1038/s41598-019-38692-7
Wingender, E., Dietze, P., Karas, H., and Knüppel, R. (1996). TRANSFAC: A database on transcription factors and their DNA binding sites. Nucleic Acids Res. 24, 238–241.
Wu, F., Zhang, G., Ren, A., Dang, Z., Shi, L., Jiang, A., et al. (2016). The pH-responsive transcription factor PacC regulates mycelial growth, fruiting body development, and ganoderic acid biosynthesis in Ganoderma lucidum. Mycologia 108, 1104–1113. doi: 10.3852/16-079
Zhang, G., Ren, A., Shi, L., Zhu, J., Jiang, A., Shi, D., et al. (2018). Functional analysis of an APSES transcription factor (GlSwi6) involved in fungal growth, fruiting body development and ganoderic-acid biosynthesis in Ganoderma lucidum. Microbiol. Res. 207, 280–288. doi: 10.1016/j.micres.2017.12.015
Zhang, G., Ren, A., Wu, F., Yu, H., Shi, L., and Zhao, M. (2017a). Ethylene promotes mycelial growth and ganoderic acid biosynthesis in Ganoderma lucidum. Biotechnol. Lett. 39, 269–275. doi: 10.1007/s10529-016-2238-5
Zhang, G., Sun, Z., Ren, A., Shi, L., Shi, D., Li, X., et al. (2017b). The mitogen-activated protein kinase GlSlt2 regulates fungal growth, fruiting body development, cell wall integrity, oxidative stress and ganoderic acid biosynthesis in Ganoderma lucidum. Fungal Genet. Biol. 104, 6–15. doi: 10.1016/j.fgb.2017.04.004
Zhao, M., Liang, W., Zhang, D., Wang, N., Wang, C., and Pan, Y. (2007). Cloning and characterization of squalene synthase (SQS) gene from Ganoderma lucidum. J. Microbiol. Biotechnol. 17, 1106–1112.
Keywords: development, medicinal fungi, regulatory mechanisms, secondary metabolites, Ganoderma lucidum
Citation: Meng L, Zhou R, Lin J, Zang X, Wang Q, Wang P, Wang L, Li Z and Wang W (2022) Transcriptome and metabolome analyses reveal transcription factors regulating ganoderic acid biosynthesis in Ganoderma lucidum development. Front. Microbiol. 13:956421. doi: 10.3389/fmicb.2022.956421
Received: 30 May 2022; Accepted: 18 July 2022;
Published: 04 August 2022.
Edited by:
Pinmei Wang, Zhejiang University, ChinaReviewed by:
Ang Ren, Nanjing Agricultural University, ChinaCopyright © 2022 Meng, Zhou, Lin, Zang, Wang, Wang, Wang, Li and Wang. This is an open-access article distributed under the terms of the Creative Commons Attribution License (CC BY). The use, distribution or reproduction in other forums is permitted, provided the original author(s) and the copyright owner(s) are credited and that the original publication in this journal is cited, in accordance with accepted academic practice. No use, distribution or reproduction is permitted which does not comply with these terms.
*Correspondence: Zhuang Li, bGl6NTUyQDEyNi5jb20=; Wei Wang, dW5pd2FuZ3dlaUAxNjMuY29t
Disclaimer: All claims expressed in this article are solely those of the authors and do not necessarily represent those of their affiliated organizations, or those of the publisher, the editors and the reviewers. Any product that may be evaluated in this article or claim that may be made by its manufacturer is not guaranteed or endorsed by the publisher.
Research integrity at Frontiers
Learn more about the work of our research integrity team to safeguard the quality of each article we publish.