 Lei Gu1†
 Tian Li
 Litian Ma
- 1Department of Cardiology, Xi'an International Medical Center Hospital Affiliated to Northwest University, Xi'an, China
- 2Department of Traditional Chinese Medicine, Tangdu Hospital, Air Force Medical University, Xi'an, China
- 3Health Center of 95816 of the People's Liberation Army, Wuhan, China
- 4National Demonstration Center for Experimental Preclinical Medicine Education, Air Force Medical University, Xi'an, China
- 5Department of Internal Medicine, The Third Affiliated Hospital of Xinxiang Medical College, Xinxiang, China
- 6School of Basic Medicine, Fourth Military Medical University, Xi'an, China
- 7Department of Gastroenterology, Tangdu Hospital, Air Force Medical University, Xi'an, China
Objective: Elemene emulsion injection (EEI) has been approved for interventional and intracavitary chemotherapy in treating malignant ascites in China, but few studies have focused on the effects of EEI on gut microbiota and metabolites. In this study, we investigated the effects of EEI on the fecal microbiota and metabolites in healthy Sprague-Dawley (SD) rats.
Methods: We randomly assigned 18 male SD rats to three groups (n = 6 in each group): the sham group (group S), the low-concentration EEI group (L-EEI), and the high-concentration EEI group (H-EEI). The L-EEI and H-EEI rats were administered 14 days of consecutive EEI, 20 mg/kg, and 40 mg/kg intraperitoneally (IP). Group S rats were administered the same volume of normal saline. On day 14, each animal's feces were collected for metagenomic sequencing and metabolomic analysis, and the colonic contents were collected for 16S rRNA sequencing.
Results: EEI could alter the β-diversity but not the α-diversity of the fecal microbiota and induce structural changes in the fecal microbiota. Different concentrations of EEI affect the fecal microbiota differently. The effects of different EEI concentrations on the top 20 bacteria with significant differences at the species level among the three groups were roughly divided into three categories: (1) A positive or negative correlation with the different EEI concentrations. The abundance of Ileibacterium Valens increased as the EEI concentration increased, while the abundance of Firmicutes bacteria and Clostridium sp. CAC: 273 decreased. (2) The microbiota showed a tendency to increase first, then decrease or decrease first, and then increase as EEI concentration increased—the abundance of Prevotella sp. PCHR, Escherichia coli, and Candidatus Amulumruptor caecigallinarius tended to decrease with L-EEI but significantly increased with H-EEI. In contrast, L-EEI significantly increased Ruminococcus bromii and Dorea sp. 5–2 abundance, and Oscillibacter sp. 1–3 abundance tended to increase, while H-EEI significantly decreased them. (3) L-EEI and H-EEI decreased the abundance of bacteria (Ruminococcaceae bacterium, Romboutsia ilealis, and Staphylococcus xylosus). Fecal metabolites, like microbiota, were sensitive to different EEI concentrations and correlated with fecal microbiota and potential biomarkers.
Conclusion: This study shows that intraperitoneal EEI modulates the composition of rat fecal microbiota and metabolites, particularly the gut microbiota's sensitivity to different concentrations of EEI. The impact of changes in the microbiota on human health remains unknown, particularly EEI's efficacy in treating tumors.
Introduction
Elemenes are sesquiterpene compounds derived from the traditional Chinese medicinal plant, Curcuma wenyujin. Elemene emulsion injection (EEI) contains the active ingredients β-, γ-, and δ-elemene and excipients such as soybean lecithin, cholesterol, ethanol, disodium hydrogen phosphate, and sodium dihydrogen phosphate. The National Medical Products Administration of China has approved it for interventional and intracavitary chemotherapy and for treating cancerous pleural ascites. Furthermore, combining EEI with conventional radiotherapy or chemotherapy could improve their therapeutic effects (Jiang et al., 2017; Tong et al., 2020) against lung cancer (Chen et al., 2020), nasopharyngeal cancer, brain tumors (Liu S. et al., 2020), bone metastases, and others (Cai et al., 2021) while decreasing their adverse effects (Chen et al., 2020; Liu S. et al., 2020; Hashem et al., 2021).
Elemene-containing hyperthermic intraperitoneal chemotherapy has been used to treat peritoneal metastatic advanced gastric cancer with minimal myelosuppression (Zheng et al., 2014). Recent studies have shown that gut microbiota is critical to human health (Markowiak and Slizewska, 2017; Singh et al., 2017; Sommer et al., 2017; Gentile and Weir, 2018). Natural selection and adaptation maintain the microbiota-host-environment system in dynamic equilibrium, creating mutual constraints (Smits et al., 2013). Studies have linked gut microbiota to gastric and breast cancers (Chen et al., 2019). In addition, long-term antibiotic use can change gut microbes, increasing the risk of colorectal and prostate cancers (Boursi et al., 2015a,b; Dik et al., 2016; Ianiro et al., 2016; Chen et al., 2019). Elemene is an anticancer drug with unknown effects on the gut microbiota. The only study showing that β-elemene improves brain metabolites in obese C57BL/6 male mice fed a high-fat diet (HFD) and reversed HFD-induced changes in gut bacterial composition and content in mice (Zhou et al., 2021). Based on the above evidence, it is not yet possible to link the neuroprotective effect of EEI to the intestinal microbiota, nor can it be proved that there is a causal relationship between gut microbiota and EEI on neuroprotective effects. Likewise, it is not yet known whether the regulation of the gut microbiota would affect the therapeutic effect of EEI on tumors and the protective effect on nerves. Therefore, this study used meta-genomic sequencing and untargeted metabolomics techniques to explore the effects of different EEI concentrations on the rat fecal microbiota and metabolites and provide evidence that EEI administration could regulate the microbiota and metabolites in the rat.
Materials and methods
Animals
Eighteen male Sprague-Dawley (SD) rats (weighing 220–250 g, aged 9–11 weeks) were acquired from the Air Force Medical University under certificate number SCXK (Shaan) 2019-001. The rats were kept in separate cages, each with three rats. A 12-h light/dark cycle was implemented in the rearing environment, with a temperature of 20–25 °C and a relative humidity of 50–65%. The Animal Welfare and Ethics Committee, Laboratory Animal Center, and Air Force Military Medical University (IACUC-20220522) approved this study. All animal procedures were performed following the US National Institutes of Health's (NIH) Guide for the Care and Use of Laboratory Animals (NIH publication no. 85–23, revised).
Materials
EEI was bought from Huali Jingang Pharmaceutical Co., Ltd. (Liaoning, China). According to literature reports, the detection data of 24 batches of samples showed that the content of β-syringene was 6.0 to 8.4%, with an average value of 7.2%, the content of β-elemene chiral isomer (RRT about 0.96) was 3.2–4.6%, with an average value of 3.9%, and the total of the two was 9.2–12.7%, with an average of 11.1% (Zhihua, 2018). The NEXTFLEX Rapid DNA-Seq Kit (Bioo Scientific, USA) and NovaSeq Reagent Kits/HiSeq X Reagent Kits (Illumina, America) were used as the primary kits for metagenomic sequencing. The main reagents and instruments for liquid chromatography-mass spectrometry (LC-MS) untargeted metabolomics include an ultra-high pressure liquid chromatography (UHPLC) liquid chromatography system (Vanquish Horizon system, Thermo), a mass spectrometer (Q-Exactive, Thermo), methanol and acetonitrile (Fisher Chemical), 2-propanol (Merck), and 2-Chloro-L-Phenylalanine (Adamas-beta).
Grouping and administration
Eighteen male SD rats were randomly divided into three groups of six rats each: the sham group (group S), the low-concentration EEI group (L-EEI), and the high-concentration EEI group (H-EEI). Before the experiment started, rats were fed adaptively for 1 week and had free access to water and food. Different EEI concentrations were selected based on previously published studies (Ma et al., 2021; Sun et al., 2022; Wu et al., 2022). For 14 days, L-EEI rats received elemene emulsion [20 mg/(kg·d)] intraperitoneally (IP), H-EEI rats received elemene emulsion [40 mg/(kg·d)] IP, and group S rats received the same volume of normal saline IP as H-EEI. To equalize volume, L-EEI rats were supplemented with normal saline to equal the volume in H-EEI before injection.
Amplification of the 16S rRNA gene and sequencing of colon contents
Fresh colon contents samples from 3 groups (n = 18) were collected in cryogenic vials and stored immediately in liquid nitrogen. Amplification and sequencing of 16S rRNA genes of colon contents were performed on the Illumina platform (Illumina, San Diego, USA) according to the standard protocols of Majorbio Bio-Pharm Technology Co. Ltd. (Shanghai, China). The V3–V4 region of the bacterial 16S rRNA gene was amplified with primer pairs 338F (5'-ACTCCTACGGGAGGCAGCAG-3') and 806R (5'-GGACTACHVGGGTWTCTAAT-3') (Liu et al., 2016). Raw FASTQ files were de-multiplexed using an in-house Perl script, then quality-filtered by Fast version 0.19.6 (Chen et al., 2018) and merged by FLASH version 1.2.7 (https://ccb.jhu.edu/software/FLASH/index.shtml) (Mago and Salzberg, 2011) with the following criteria: (1) The 300 bp reads were truncated at any site receiving an average quality score of <20 over a 50 bp sliding window, and the truncated reads shorter than 50 bp were discarded; reads containing ambiguous characters were also discarded. (2) Only overlapping sequences longer than 10 bp were assembled according to their overlapped sequence. The maximum mismatch ratio of the overlap region is 0.2. Readings that could not be assembled were discarded. After that, operational taxonomic units (OTUs) clustering analysis and taxonomic analysis were performed (UPARSE, version 7.0.1090, http://drive5.com/uparse/) (Edgar, 2013). OTU clustering was performed on non-repetitive sequences (excluding single sequences) according to 97% similarity, and the chimeras were removed in the clustering process to obtain the representative sequences of OTUs. The sequences with more than 97% similarity to the representative sequences were selected, and the OTU table was generated. To obtain the corresponding species classification information of each OTU, compare the following databases: the bacterial and archaeal 16S rRNA databases [Silva (Release 138 http://www.arb-silva.de) and Greengene (Release 13.5 http://greengenes.secondgenome.com/)]. First, the α-diversity analysis (http://www.mothur.org/wiki/Calculators) of colonic contents was assessed by community richness (ACE, Sobs, and Chao), community diversity (Shannon and Simpson), and community coverage (coverage) (Mothur, version 1.30.2, https://mothur.org/wiki/calculators/). Based on the results of OTU clustering analysis, a Venn diagram was used to display the common and unique microbiota among the three groups (R, version 3.3.1) at the genus level. Second, the composition and relative abundance were analyzed at the genus level in each group (R, version 3.3.1). Partial least squares discriminant analysis (PLS-DA) (Gromski et al., 2015) was used to analyze the similarity among the three groups at the genus level (http://fiehnlab.ucdavis.edu/staff/kind/Statistics/Concepts/OPLS-PLSDA, R, version 3.3.1). Permutational multivariate analysis of variance (PERMANOVA) (Kelly et al., 2015) was used to analyze the degree of explanation of different grouping factors on differences between samples (Bray-Curtis). Third, the non-metric multidimensional scaling (NMDS) was used to evaluate the β-diversity of colon contents among three groups at the genus level.
Metagenomic sequencing and assembly
Total genome DNA was extracted from 200–300 mg of stool samples. Before analyzing the raw data generated using the Illumina sequencing platform (Illumina, San Diego, USA), the software Fast (https://github.com/OpenGene/fastp) was used to perform statistical and quality control on the raw data to ensure subsequent analysis accuracy. About 300 bp of fragments were sequenced in metagenomics. Supplementary Table 1 lists the original sequence and clean data statistics. Then, the software BWA v0.7.17 was used to decontaminate the sample's host genome. The host name was Vertebrates: rattus_norvegicus. Supplementary Table 1 lists the data after removing the host genome. Sequences of different sequencing depths were assembled using tEGAHIT v1.1.2 (https://github.com/voutcn/megahit) (Li et al., 2015). After splicing and assembly, the shortest contig length retained was 300 bp. Supplementary Table 2 lists the data after assembly. Afterward, an open reading frame (ORF) prediction was performed on the contigs in the splicing results using Prodigal (https://github.com/hyattpd/Prodigal). Genes with a nucleic acid length ≧ of 100 bp were selected and translated to amino acid sequences to generate a statistical table of gene prediction results for each sample (Supplementary Table 3). CD-HIT software (http://www.bioinformatics.org/cd-hit/) (Fu et al., 2012) was used to cluster the predicted gene sequences of all samples (the default parameters are 90% identity and 90% coverage). The representative sequence for constructing a gene set with no duplicate genes was the longest gene in each class. The SOAPaligner software (http://soap.genomics.org.cn/) (Li et al., 2009) was used to align each sample's high-quality reads with the non-redundant gene set (default parameter: 95% identity) and count the genes in the corresponding sample's abundance information. Gene abundance was calculated using reads per kilobase million (Lawson et al., 2017). The linear discriminant analysis effect size (LEfSe) differential discriminant analysis (http://huttenhower.sph.harvard.edu/galaxy/root?tool_id=lefse_upload) (Segata et al., 2011; Zhang et al., 2013) was used to identify the species that best explains the differences between groups in multiple samples.
Taxonomic annotation and difference analysis
The non-redundant gene set was aligned with the non-redundant protein sequence database (NR database) using DIAMOND (Buchfink et al., 2015, 2021) (https://github.com/bbuchfink/diamond) (parameters: BLASTP; E-value ≤ 1 × 10⁻⁵). The taxonomic information database correlating to the NR database was used to get species annotation results. The species abundance was calculated by adding up the abundance of its genes. Venn plots were used to count shared and unique species across multiple groups, and community column charts were used to visually study the dominant species in a community.
Fecal metabolomics
Different groups of fecal metabolites were detected using LC-MS, and metabolites with differential expressions were found. First, a 50 mg sample was weighed accurately, and then 400 μL of extraction solution [methanol: water = 4:1 (v: v)] containing 0.02 mg/mL of the internal standard (L-2-chlorophenyl alanine) was added. Second, the sample was ground with a frozen tissue grinder for 6 min (−10°C, 50 Hz), and ultrasonic extraction was used for 30 min (5°C, 40 kHz) at low temperature. Third, let the sample stand at −20°C for 30 min, centrifuge for 15 min (13,000 g, 4°C), and then transfer the supernatant to the inlet with an inner cannula. In addition, 20 μL of supernatant was pipetted from each sample and mixed as a quality control sample (Zheng et al., 2021; Zhu et al., 2022).
The raw data were imported into the metabolomics processing software ProgenesisQI (Waters Corporation, Milford, USA) for baseline filtering, peak identification, integration, retention time correction, peak alignment, and other tasks before a data matrix containing retention time, mass-to-charge ratio, and peak intensity was obtained. The software was then used to perform a library search of characteristic peaks, matching the MS and MS/MS mass spectral information to the metabolic database. The software was then used to search for characteristic peaks in a library by matching the information from the MS and MS/MS mass spectra to the metabolic database. The MS mass error was set to less than 10 ppm, and metabolites were identified based on secondary mass spectrometry matching scores. The main databases are http://www.hmdb.ca/ and https://metlin.scripps.edu/. The total ion chromatograms of the quality control samples in positive and negative ion modes show that the peak shape is acceptable, and the distribution is relatively uniform under this detection condition (Supplementary Figure 3). The PLS-DA model quality parameters and the corresponding permutation test (R2 intercept, 0.8907; Q2 intercept, −0.7653) demonstrate the statistical validity of the analysis and indicate distinct metabolic profiles among the three groups (Supplementary Figure 2).
Principal component analysis (Worley and Powers, 2013) was used to identify the “main” elements and structures in the data to reduce the dimensionality of the high-dimensional data space while minimizing the loss of data information. We also used the PLS-DA (Gromski et al., 2015) method to reduce the dimensionality of the data to better obtain the different information between groups. To prevent overfitting in the PLS-DA, we used the permutation test to determine whether the PLS-DA model is overfitting. The Kruskal-Wallis (H) test was used to compare differential metabolites among multiple groups. The metabolites that were common or unique among the differential metabolites between the two groups were displayed using Venn diagrams.
Association of fecal differential metabolites with fecal microbiota
The Pearson correlation analysis found correlation coefficients between fecal microbiota and metabolites. The correlation between significantly differential fecal microbiota within the genus (P < 0.01) and differential metabolites (P < 0.01) is shown in Figure 6. The clustering algorithm was hierarchical clustering, the distance algorithm was Euclidean, and the hierarchical clustering method was complete (took the distance between the two data points that were the farthest from the two combined data points as the distance between the two combined data points).
Association of fecal differential metabolites and metabolic pathways
Using Pearson correlation analysis, we perform a metabolic pathway study of our metagenomic data and link it to the chemicals identified in the stool samples. The correlation between significantly differential metabolites (P < 0.01) and significantly differential metabolic pathways (P < 0.01) in level 3 of the Kyoto Encyclopedia of Genes and Genomes (KEGG, https://www.kegg.jp/) (Figure 7).
Statistical analysis
Sequencing was performed on the rats' feces (n = 18). The Wilcoxon rank-sum test was used to calculate α-diversity among three groups, and the results were expressed as mean ± standard deviation. P < 0.05 was deemed significant. The Kruskal-Wallis test (H test) was used to compare the differential microbiota among multiple groups, and the Tukey-Kramer procedure was used for post-hoc testing. P < 0.05 was deemed significant. The Kruskal-Wallis test and Scheffe's post-hoc test were also used to find differences in metabolites between more than two groups. P < 0.05 was considered significant (Edwards and Berry, 1987; Lee and Lee, 2018).
Results
H-EEI altered the β-diversity of fecal microbiota
Different concentrations of elemene did not significantly affect the α-diversity of fecal microbiota (Supplementary Table 4). The Venn diagrams showed bacteria that are unique and shared among different groups at the genus level (Figure 1A). There were 45 and 32 genera specific to groups S and L-EEI, respectively, and 60 genera specific to H-EEI. Deeper taxonomic levels, including species, genera, and families, were investigated to learn more about the fecal microbiota of different groups. The relative abundance of the genus level in each group is shown in Figure 1B. The relative abundance of the species and families in each group is shown in Supplementary Figure 1. The NMDS analysis of different groups showed a distinct formation of clusters at the genus level (Figure 1C) and species level (Figure 1D). The differences between L-EEI and group S were less evident than those between H-EEI and group S, which formed quite different clusters. There is a clear visual distinction between group S and the H-EEI (stress = 0.150 for genera and stress = 0.193 for species).
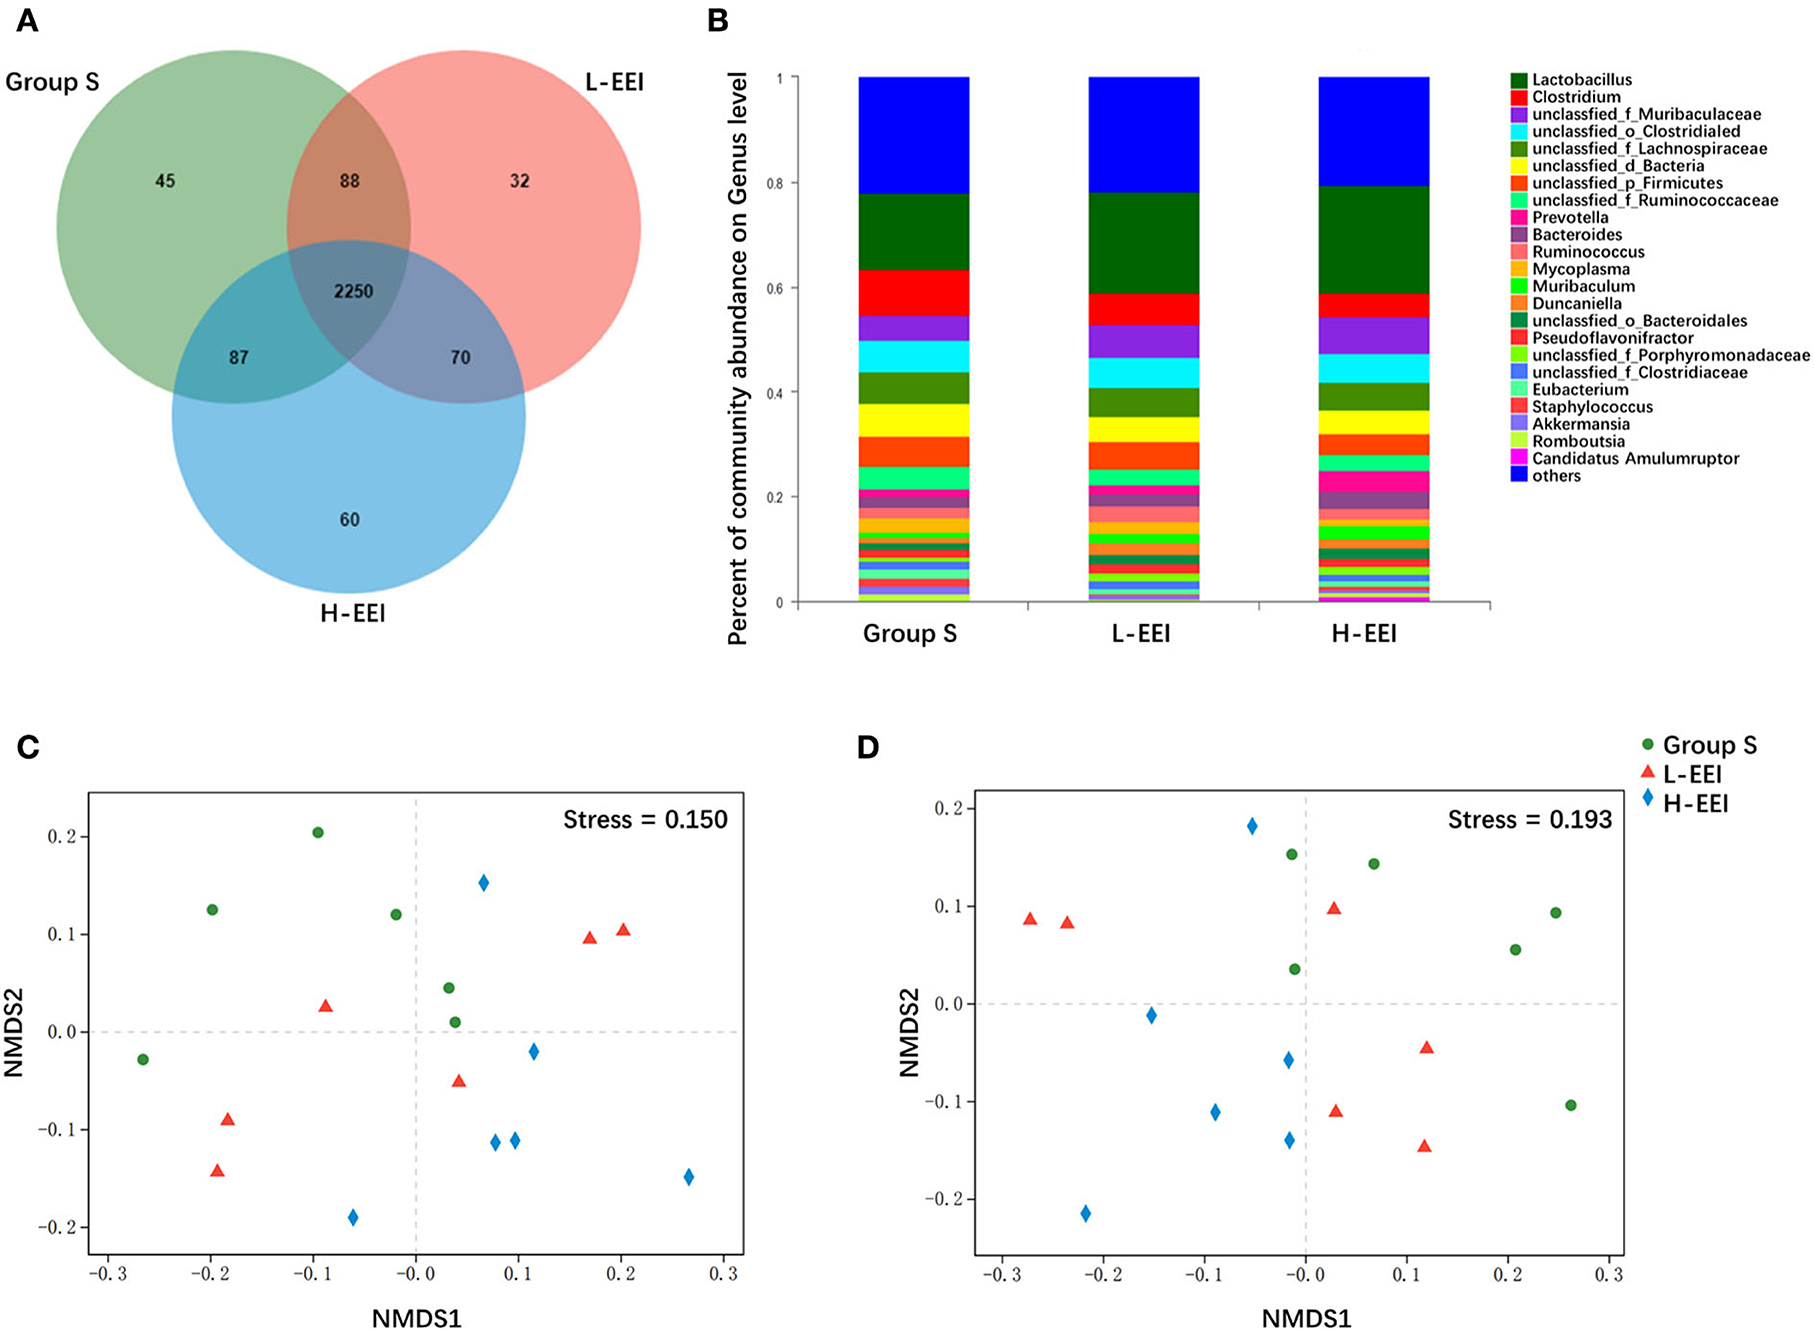
Figure 1. H-EEI altered the β-diversity of fecal microbiota. (A) The Venn diagrams show that bacteria that are unique and shared by different groups at the genus level. The overlapping part represents the bacteria shared by different sample groups, the non-overlapping part represents the bacteria unique to the sample group, and the number represents the corresponding species. There were 45 and 32 genera specific to groups S and L-EEI, respectively, and 60 genera specific to H-EEI. (B) The relative abundance of the genus level in each group is shown. The horizontal axis represents the sample name, and the vertical axis represents the proportion of microbiota in the sample. Colored columns represent different microbiota, and column length represents a proportion of the microbiota. (C,D) The NMDS analysis of different groups shows a distinct formation of clusters at the genus level (C), and according to species level (D), Bray–Curtis. NMDS is a data analysis method that simplifies research objects in multidimensional space into low-dimensional space for positioning, analysis, and classification while retaining the original relationship between objects. The pros and cons of NMDS analysis results are measured by stress. It is generally believed that when stress <0.2, it can be represented by a two-dimensional point graph of NMDS, and this graph has a certain explanatory significance. The distance between the points indicates the degree of difference, and the horizontal and vertical coordinates indicate the relative distance, which has no practical significance. The data used in the analysis were derived from metagenomics sequencing data of fecal mirobiota (n = 6 in each group).
Distinctive sensitivity of fecal microbiota to different concentrations of EEI
We further compared the differences among the three groups to determine the effect of different concentrations of EEI on rat fecal microbiota. Figure 2A shows the abundance of the top 20 bacteria with significant differences at the species level among the three groups (Kruskal–Wallis test; P < 0.05 was considered significant). Following the multiple-group test, we compared the groups using pairwise comparisons (Tukey-Kramer, P < 0.05 was considered significant, Figure 2B). The effects of different EEI concentrations on the top 20 bacteria with significant differences at the species level among the three groups could be roughly divided into three categories: (1) A positive or negative correlation with the concentration of the EEI. The abundance of Ileibacterium Valens increased as the EEI concentration increased, while the abundance of Firmicutes bacterium and Clostridium sp. CAC: 273 decreased. (2) The microbiota showed a tendency to increase first, then decrease or decrease first, and then increase as EEI concentration increased. Compared to group S, the abundance of Prevotella sp. PCHR, Escherichia coli, and Candidatus Amulumruptor caecigallinarius tended to decrease by L-EEI but significantly increased by H-EEI (P < 0.05). Inversely, L-EEI significantly increased the abundance of Ruminococcus bromii (P < 0.01) and Dorea sp. 5–2 (P < 0.05), and then, Oscillibacter sp. 1–3 tended to increase, but H-EEI significantly decreased the abundance of these three microorganisms. (3) Both L-EEI and H-EEI tend to decrease the abundance of the bacteria (Ruminococcaceae bacterium, Romboutsia ilealis, and Staphylococcus xylosus).
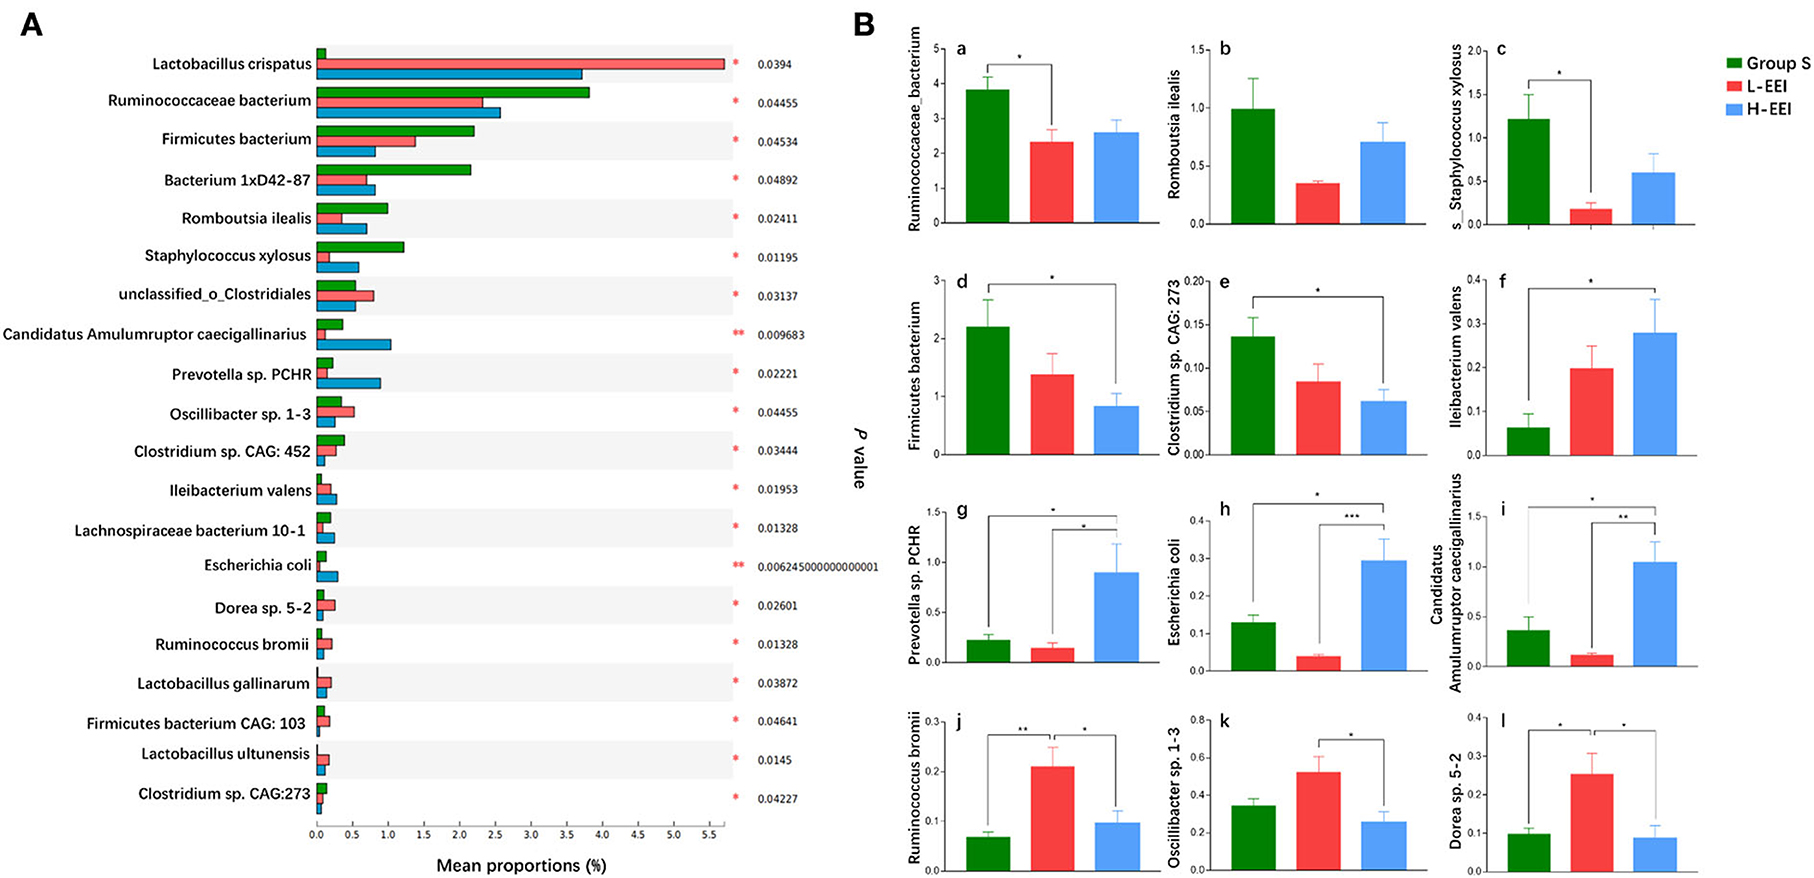
Figure 2. Distinctive sensitivity of fecal microbiota to different concentrations of EEI. (A) The abundance of the top 20 fecal bacteria with significant differences at the species level was determined using fecal metagenomics data (Kruskal–Wallis test, P < 0.05 was considered significant). The vertical axis represents the species names, the horizontal axis represents the percentage value of a species' abundance in the sample, and different colors represent different groups (green to group S, red to L-EEI, and blue to H-EEI). (B) Post-hoc analysis of the top 20 fecal bacteria with significant differences in (A) (Tukey–Kramer, P < 0.05 was considered significant). n = 6 in each group, *P < 0.05, **P < 0.01, ***P < 0.001.
First, the abundance of Firmicutes bacterium and Clostridium sp. CAC: 273 decreased gradually as EEI concentration increased, and the H-EEI was significantly lower than group S (P < 0.05). Ileibacterium Valens abundance increased gradually with the increasing EEI concentration, and the H-EEI was significantly higher than group S (P < 0.05). Second, for Prevotella sp. PCHR, Escherichia coli, and Candidatus Amulumruptor caecigallinarius, the L-EEI tended to decrease the abundance compared to group S, whereas the H-EEI significantly increased the abundance compared to the L-EEI (P < 0.05). Third, for Ruminococcus bromii, Oscillibacter sp. 1–3, and Dorea sp. 5–2, L-EEI tended to increase the abundance compared to group S. In contrast, H-EEI significantly decreased the abundance compared to L-EEI (P < 0.05). Finally, both L-EEI and H-EEI decreased the abundance of the Ruminococcaceae bacterium, Romboutsia ilealis, and Staphylococcus xylosus.
LEfSe analysis was applied to investigate the biomarkers among the three groups. We found 17 differentially abundant taxa among the three groups, all with an LDA score > 3.0 and P < 0.05 (Figures 3A,B). LEfSe analysis identified ten genera with increased abundance in Group S, one genus with increased abundance in the L-EEI, and six genera with increased abundance in the H-EEI.
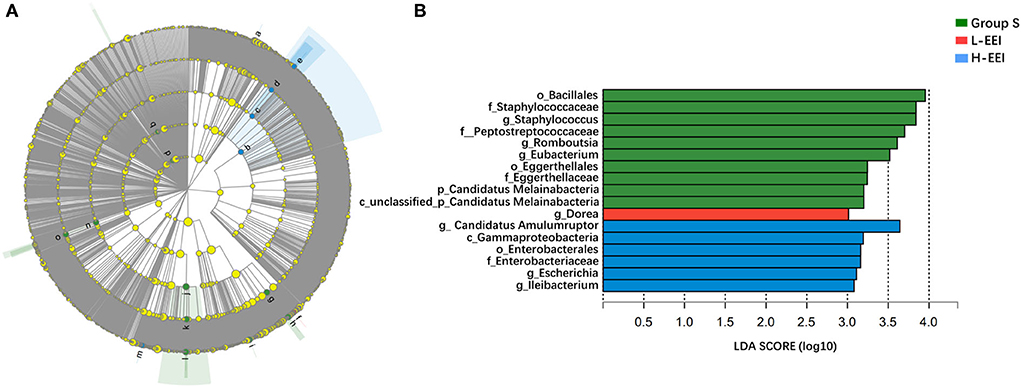
Figure 3. Biomarkers of L-EEI and H-EEI: g_Dorea and g_Candidatus Amulumruptor. (A) The hierarchy of linear discriminant analysis effect size (LEfSe) was based on fecal metagenomics data. Nodes in the figure with different colors represent microbial groups that are significantly enriched in the corresponding group and have a significant effect on the differences among the three groups; light yellow nodes represent microbial groups with no significant difference between groups or have no significant effect on the differences among the three groups. (B) The linear discriminant analysis (LDA) discriminant histogram. The higher the LDA score, the greater the influence of microbiota abundance on the differential effect. P < 0.05, LDA > 3.0.
L-EEI and H-EEI-induced differential fecal metabolites
We used LC-MS to directly test fecal metabolites to find out how different concentrations of EEI affected the metabolites of the fecal microbiota. Fecal metabolomics is the consequence of both host and microbiota interaction. The chemical signatures were identified based on internal standards (Majorbio Bio-Pharm Technology Co. Ltd.), the Kyoto Encyclopedia of Genes and Genomes (KEGG, http://www.genome.jp/kegg/), the Human Metabolome Database (HMDB 5.0, www.hmdb.ca) and METLIN 2019 (http://metlin.scripps.edu). The analysis of fecal metabolites revealed variations in different EEI concentrations. A total of 1,091 metabolites were identified, including vitamins and cofactors, peptides, nucleic acids, hormones and neurotransmitters, steroids, organic acids, lipids, and carbohydrates. A Venn diagram shows the common or unique metabolites found following a pairwise comparison of the three groups (Figure 4A). Figure 4B shows the findings of the PLS-DA model obtained from multivariate statistical comparisons of groups S, L-EEI, and H-EEI.
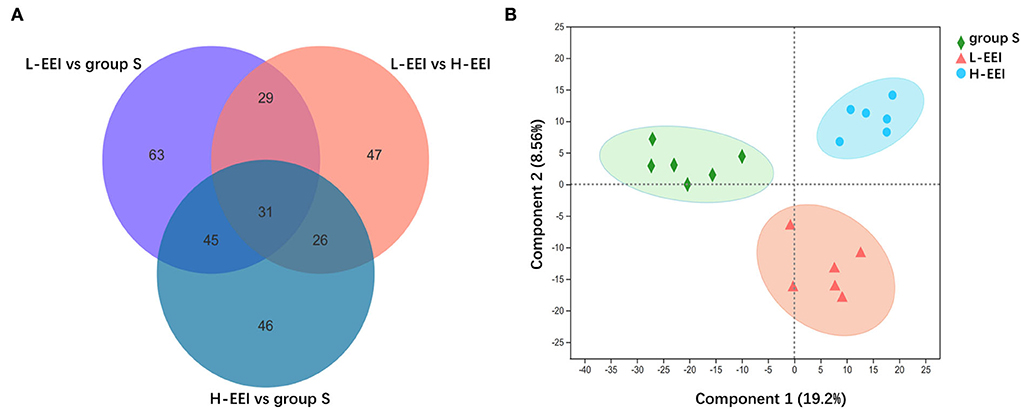
Figure 4. L-EEI and H-EEI induced differential fecal metabolites. (A) The common or unique metabolites are found after a pairwise comparison of three groups. In the figure, the overlapping part represents the number of metabolites shared by multiple metabolic sets, the non-overlapping part represents the number of metabolites unique to the metabolic set, and the number represents the number of corresponding metabolites. (B) PLS-DA score plot. The PLS-DA score map is used to visually represent the classification effect of the model. The greater the degree of separation among the three groups of samples in the figure, the more significant the classification effect. Component 1 is the first principal component explainability, and Component 2 is the second principal component explainability. The data used in the analysis were derived from LC-MS data of feces (n = 6 in each group).
Similar to the fecal microbiota, fecal metabolites differ in their sensitivity to different EEI concentrations. Figure 5 shows the effect of different EEI concentrations on fecal metabolites. A total of 73 metabolites (Supplementary Table 5) showed highly significant (P < 0.01, Kruskal–Wallis test) differences among the three groups. Among the top 20 metabolites in the relative abundance of identified metabolites, two metabolites [Cis-9, 10-epoxystearic acid (HMDB0247617) and (+/–)-enterolactone (HMDB0006101)] show significant differences among the three groups (P < 0.05). To be specific, compared with Group S, L-EEI has no significant effect on the relative abundance of Cis-9, 10-epoxystearic acid, while H-EEI could induce a significant increase compared with L-EEI (P < 0.01); compared with Group S, both L-EEI and H-EEI could decrease the relative abundance of (+/–)-enterolactone significantly (P < 0.05), while there was no significant difference between L-EEI and H-EEI.
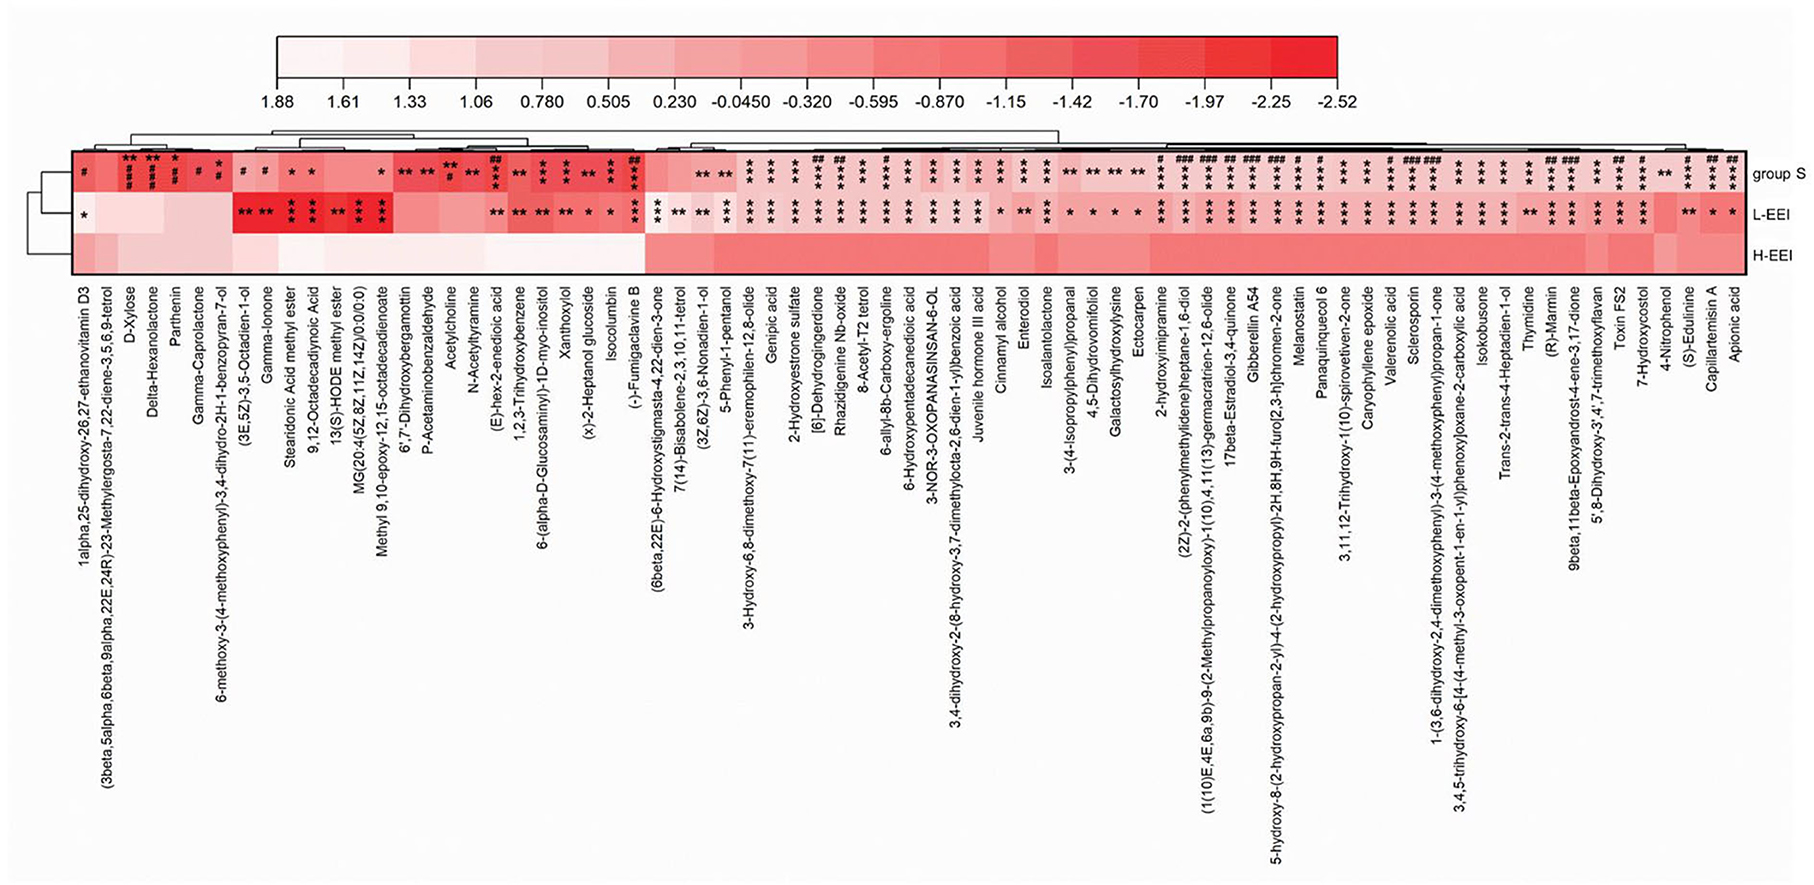
Figure 5. Differential metabolites among the three groups based on LC-MS data of feces. Darker colors indicate lower metabolite abundance, while lighter colors indicate higher metabolite abundance. The Kruskal–Wallis H test compares multiple groups, followed by the Scheffe post-hoc tests for metabolites with P < 0.01. n = 6 in each group, *P < 0.05, **P < 0.01, ***P < 0.001, compared with group S; #P < 0.05, ##P < 0.01, ###P < 0.001, compared with the L-EEI.
Many differentially expressed microorganisms are negatively correlated with metabolites
Fecal microbiota and fecal metabolite alterations are significantly related to EEI concentration. At the genus level, we linked microbiota to metabolites that were significantly different between the three groups (Figure 6). For example, g_Sediminibacillus had a highly significant positive correlation with (3E, 5Z)-3,5-octadien-1-ol and a substantial negative correlation with 3-3-nor-3-oxopanasinsan-6-ol. In general, most bacteria are negatively correlated with metabolites.
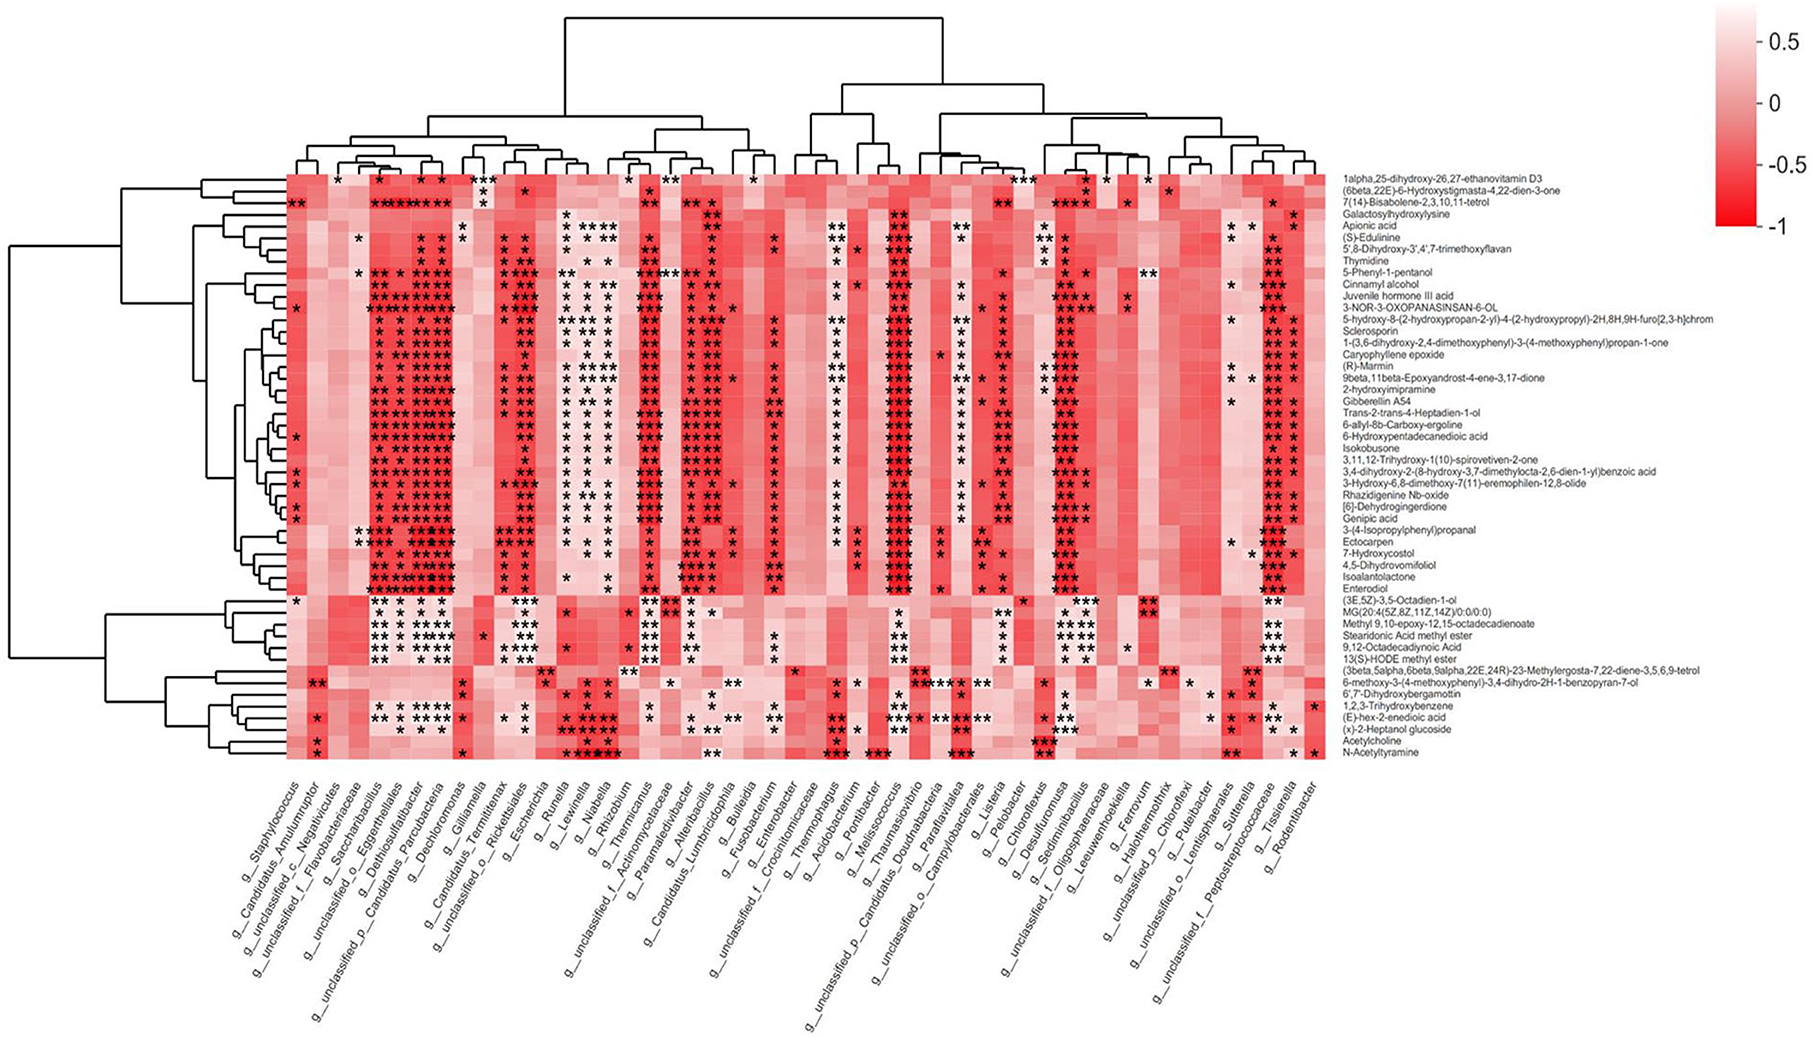
Figure 6. Many bacteria are negatively correlated with metabolites. The bacteria are selected using the Kruskal–Wallis test on a genus level from fecal metagenomics data, and P < 0.01 of them are used. The metabolites are selected using the Kruskal–Wallis test from fecal LC-MS data, and P < 0.01 is used. The gradient colors represent the magnitude of the correlation coefficient; red indicates a negative correlation, and a white indicates positive correlation. *P < 0.05, **P < 0.01, ***P < 0.001.
Many differential metabolites are negatively correlated with metabolic pathways
To conduct more in-depth correlation studies, we performed a metabolic pathway study on our metagenomic data and linked it to the chemicals identified in the stool samples (Figure 7). The results indicate that most differential metabolites (49/73) are negatively related to the following eight signaling pathways significantly: apoptosis (ko04214), carotenoid biosynthesis (ko00906), furfural degradation (ko00365), steroid biosynthesis (ko00100), phospholipase D signaling pathway (ko04072), axon regeneration (ko04361), choline metabolism in cancer (ko05231), and oxytocin signaling pathway (ko04921). Except for the eight signaling pathways, there are another five signaling pathways worth being concerned about: autophagy yeast, flavone and flavonol biosynthesis, MAPK signaling pathways, measles, and toxoplasmosis.
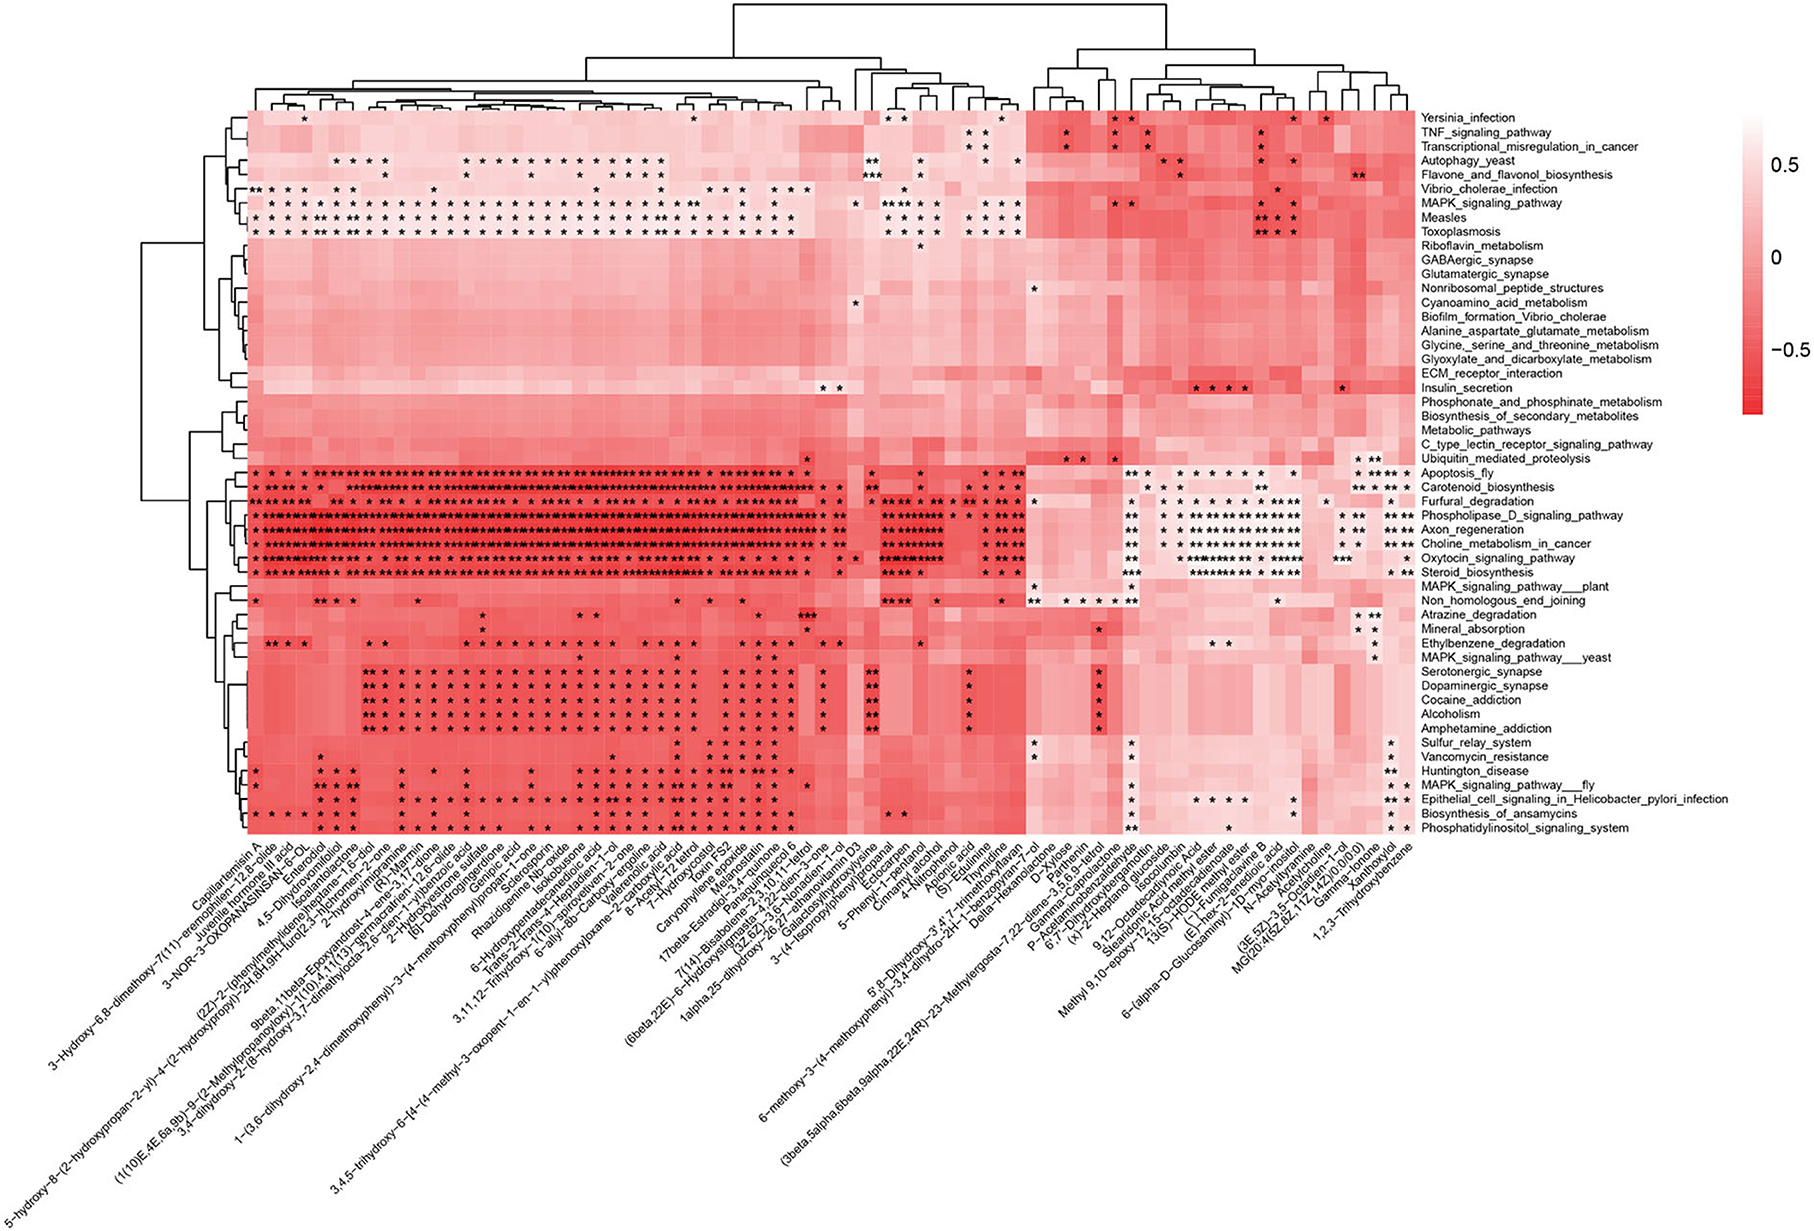
Figure 7. Many differential metabolites are negatively correlated with metabolic pathways. The horizontal axis represents 73 differential metabolites among three groups (P < 0.01) from fecal LC-MS data, and the vertical axis represents differential metabolic pathways (P < 0.01) among the three groups from fecal metagenomics data. The darker the color of the block, the greater the negative correlation. *P < 0.05, **P < 0.01, ***P < 0.001.
Discussion
EEI, a Chinese anti-tumor drug derived from the traditional Chinese medicinal plant Curcuma wenyujin, is primarily composed of β-elemene. The main component, β-elemene, has been shown in isotope labeling studies to penetrate the blood–brain barrier (Wu et al., 2009). Its content is comparable to other tissues, with a low incidence of myelosuppression during the medication process (Chen et al., 2022). EEI has been used clinically to treat cancerous pleural effusion by pleural and cancerous ascites by intraperitoneal perfusion (Luo et al., 2019; Qureshi et al., 2019; Zhai et al., 2019), but few studies have examined its impact on fecal microbiota.
EEI alters the fecal microbiota's β-diversity but not the α-diversity. This indicates that EEI could alter fecal microbiota structure. Following EEI administration, some of the previously dominant microbiota are no longer dominant, and new dominant microbiota emerge. For example, the Candidatus Amulumruptor of Muribaculaceae was the most prominent bacterium in the H-EEI (LEfSe). The function of Candidatus Amulumruptor has not yet been reported. Muribaculaceae members use mucin monosaccharide (Pereira et al., 2020) and are abundant in the mice that had been fed an HFD (Liu et al., 2021).
Ruminococcus bromii and Dorea sp. 5-2 are particularly interesting because L-EEI significantly increased their abundance while H-EEI decreased it. In our previous study, Ruminococcus was the dominant bacterium in the EEI group using 16S rRNA technology (https://www.ncbi.nlm.nih.gov/sra/PRJNA821627), but the impact of Ruminococcus on human health is complex. Its benefits include the following: Ruminococcus albus has an inverse relationship with ulcerative colitis (Li et al., 2020) and protects infants from allergies (Wang et al., 2021). The harmful aspects include the association of Ruminococcus gnavus with Crohn's disease, which has been identified as causing Crohn's symptoms (Henke et al., 2019). In addition, Ruminococcus has been linked to irritable bowel syndrome (Baumgartner et al., 2021). In this study, we used metagenomic technology to confirm that L-EEI (20 mg/kg·d) increased the abundance of Ruminococcus bromii. According to current research, Ruminococcus bromii is a type of bacteria beneficial to humans; this bacterium can produce short-chain fatty acids and thus alleviate type 2 diabetic symptoms (Lordan et al., 2020; Yao et al., 2020). There are currently no reports on the function of Dorea sp. 5-2, and most studies focus on Dorea. The impact of Dorea on human health is unclear, but studies have shown that Dorea is more abundant in patients with Parkinson's (Petrov et al., 2017) and obesity (Jiao et al., 2018). It is unknown why the abundance of Ruminococcus bromii and Dorea sp. 5-2 significantly increased at L-EEI but decreased at H-EEI. This is also one of the future topics we intend to investigate.
Fecal metabolomics is the consequence of both host and microbiota interaction. Figure 5 displays the effect of different concentrations of EEI on metabolites. A total of 73 metabolites had extremely significant statistical differences among the three groups (P < 0.01). In the abundance of the top 20 differential metabolites, two kinds of metabolites [Cis-9,10-Epoxystearic acid and (+/–)-Enterolactone] displayed significant statistical differences among the three groups (P < 0.05). Compared to L-EEI, H-EEI had a higher Cis-9,10-epoxystearic acid content. The effects of Cis-9,10-Epoxystearic acid on humans are unclear. Cis-9,10-Epoxystearic acid dose- and time-dependently increased the number and size of cellular lipid droplets in the human hepatocarcinoma cell line HepG2, decreasing cell viability and causing cell death (Liu et al., 2018; Liu Y. et al., 2020). Compared to group S, both L-EEI and H-EEI could decrease the abundance of (+/–)-enterolactone significantly (P < 0.05). Enterolactone's health implications are debated. Enterolactone, a bioactive phenolic metabolite from dietary lignans, may help protect against different stages of breast, prostate, colon, gastric, and lung cancer (Mali et al., 2019; Senizza et al., 2020). Unfortunately, a case-control study found no association between serum EL levels and breast cancer risk (Kilkkinen et al., 2004). A New York prospective study found comparable outcomes (Zeleniuch-Jacquotte et al., 2004). β-elemene partially corrected HFD-induced alterations in mouse gut bacteria composition and metabolites (Zhou et al., 2021). Because EEI is used clinically for intraperitoneal infusion therapy of cancerous ascites, we examined its effects on rat fecal microbiota and metabolites (Jiang et al., 2012; Zhu et al., 2019).
In addition to fecal microbiota, we used 16S rRNA technology to investigate the effects of different EEI concentrations on colon contents. EEI concentrations, like fecal microbiota, did not affectα-diversity of colonic microbiota (Supplementary Table 6). Genus-level community composition is shown in Supplementary Figure 4B. The NMDS analysis of different groups revealed distinct genus-level clusters. Similar to fecal microbiota, L-EEI and group S differed less than H-EEI, and group S. Group S and H-EEI stood out visually (Supplementary Figure 4D). Unlike the fecal microbiota, the most prominent biomarkers in the colon contents of low and high elemene groups were g_Marvinbryantia and g_norank_f_Erysipelotrichaceae, respectively (Supplementary Figure 5, LEfSe).
IP injection of EEI alters the microbiota and metabolites in rat feces. Since the gut microbiota is linked to several cancers and EEI inhibits the growth of various cancers, we hope to research the effect of EEI on the feces of patients with cancer.
Data availability statement
The datasets presented in this study can be found in online repositories. The names of the repository/repositories and accession number(s) can be found below: https://www.ncbi.nlm.nih.gov/, PRJNA821627 and https://www.ncbi.nlm.nih.gov/sra/PRJNA866381.
Ethics statement
The animal study was reviewed and approved by Animal Care and Use Committee of Air Force Medical University. The approval number is: IACUC-20220522.
Author contributions
JZ, LM, and TL designed the study and approved the final manuscript version. LG and HW performed the experiments and wrote the manuscript. YZ, YJ, and YW analyzed the data and participated in the metagenomic exploration. All authors have read and approved the final manuscript.
Funding
This study was supported by the Science and Technology Innovation Development Fund of the Second Affiliated Hospital of the Air Force Military Medical University (2019LCYJ012 to JZ), Key Clinical Research Projects of the Second Affiliated Hospital of the Air Force Military Medical University (2021LCYJ016 to JZ), the Social Talent Funding Program Project of the Second Affiliated Hospital of the Air Force Military Medical University (2021SHRC068 to HW), and Key Scientific Research Project of TCM Inheritance, Innovation of Qin Medicine Development in 2021 (2021-01-ZZ-006).
Conflict of interest
The authors declare that the research was conducted in the absence of any commercial or financial relationships that could be construed as a potential conflict of interest.
Publisher's note
All claims expressed in this article are solely those of the authors and do not necessarily represent those of their affiliated organizations, or those of the publisher, the editors and the reviewers. Any product that may be evaluated in this article, or claim that may be made by its manufacturer, is not guaranteed or endorsed by the publisher.
Supplementary material
The Supplementary Material for this article can be found online at: https://www.frontiersin.org/articles/10.3389/fmicb.2022.913461/full#supplementary-material
References
Baumgartner, M., Lang, M., Holley, H., Crepaz, D., Hausmann, B., Pjevac, P., et al. (2021). Mucosal biofilms are an endoscopic feature of irritable bowel syndrome and ulcerative colitis. Gastroenterology 161, 1245–56.e20. doi: 10.1053/j.gastro.2021.06.024
Boursi, B., Haynes, K., Mamtani, R., and Yang, Y. X. (2015a). Impact of antibiotic exposure on the risk of colorectal cancer. Pharmacoepidemiol. Drug. Saf. 24, 534–542. doi: 10.1002/pds.3765
Boursi, B., Mamtani, R., Haynes, K., and Yang, Y. X. (2015b). Recurrent antibiotic exposure may promote cancer formation–Another step in understanding the role of the human microbiota? Eur. J. Cancer 51, 2655–2664. doi: 10.1016/j.ejca.2015.08.015
Buchfink, B., Reuter, K., and Drost, H. G. (2021). Sensitive protein alignments at tree-of-life scale using DIAMOND. Nat. Methods. 18, 366–368. doi: 10.1038/s41592-021-01101-x
Buchfink, B., Xie, C., and Huson, D. H. (2015). Fast and sensitive protein alignment using DIAMOND. Nat. Methods. 12, 59–60. doi: 10.1038/nmeth.3176
Cai, S. Z., Xiong, Q. W., Zhao, L. N., Ji, Y. T., Luo, Z. X., and Ma, Z. R. (2021). β-Elemene Triggers ROS-dependent apoptosis in glioblastoma cells through suppressing STAT3 Signaling pathway. Pathol. Oncol. Res. 27, 594299. doi: 10.3389/pore.2021.594299
Chen, D., Wu, J., Jin, D., Wang, B., and Cao, H. (2019). Fecal microbiota transplantation in cancer management: Current status and perspectives. Int. J. Cancer. 145, 2021–2031. doi: 10.1002/ijc.32003
Chen, P., Li, X., Zhang, R., Liu, S., Xiang, Y., Zhang, M., et al. (2020). Combinative treatment of β-elemene and cetuximab is sensitive to KRAS mutant colorectal cancer cells by inducing ferroptosis and inhibiting epithelial-mesenchymal transformation. Theranostics. 10, 5107–5119. doi: 10.7150/thno.44705
Chen, S., Zhou, Y., Chen, Y., and Gu, J. (2018). fastp: an ultra-fast all-in-one FASTQ preprocessor. Bioinformatics. 34, i884–i90. doi: 10.1093/bioinformatics/bty560
Chen, Z. X. L., i,. J., Liu, W. B., Zhang, S. R., and Sun, H. (2022). Elemene-containing hyperthermic intraperitoneal chemotherapy combined with chemotherapy for elderly patients with peritoneal metastatic advanced gastric cancer. World J. Clin. Cases. 10, 1498–1507. doi: 10.12998/wjcc.v10.i5.1498
Dik, V. K., van Oijen, M. G., Smeets, H. M., and Siersema, P. D. (2016). Frequent use of antibiotics is associated with colorectal cancer risk: results of a nested case-control study. Dig. Dis. Sci. 61, 255–264. doi: 10.1007/s10620-015-3828-0
Edgar, R. C. (2013). UPARSE. highly accurate OTU sequences from microbial amplicon reads. Nat. Methods. 10, 996–998. doi: 10.1038/nmeth.2604
Edwards, D., and Berry, J. J. (1987). The efficiency of simulation-based multiple comparisons. Biometrics. 43, 913–928. doi: 10.2307/2531545
Fu, L., Niu, B., Zhu, Z., Wu, S., and Li, W. (2012). CD-HIT. accelerated for clustering the next-generation sequencing data. Bioinformatics. 28, 3150–3152. doi: 10.1093/bioinformatics/bts565
Gentile, C. L., and Weir, T. L. (2018). The gut microbiota at the intersection of diet and human health. Science. 362, 776–780. doi: 10.1126/science.aau5812
Gromski, P. S., Muhamadali, H., Ellis, D. I., Xu, Y., Correa, E., Turner, M. L., et al. (2015). A tutorial review: Metabolomics and partial least squares-discriminant analysis–a marriage of convenience or a shotgun wedding. Anal. Chim. Acta. 879, 10–23. doi: 10.1016/j.aca.2015.02.012
Hashem, S., Nisar, S., Sageena, G., Macha, M. A., Yadav, S. K., Krishnankutty, R., et al. (2021). Therapeutic effects of curcumol in several diseases; an overview. Nutr. Cancer. 73, 181–195. doi: 10.1080/01635581.2020.1749676
Henke, M. T., Kenny, D. J., Cassilly, C. D., Vlamakis, H., Xavier, R. J., Clardy, J., et al. (2019). Ruminococcus gnavus, a member of the human gut microbiome associated with Crohn's disease, produces an inflammatory polysaccharide. Proc. Natl. Acad. Sci. U S A. 116, 12672–12677. doi: 10.1073/pnas.1904099116
Ianiro, G., Tilg, H., and Gasbarrini, A. (2016). Antibiotics as deep modulators of gut microbiota: between good and evil. Gut. 65, 1906–1915. doi: 10.1136/gutjnl-2016-312297
Jiang, Z., Jacob, J. A., Loganathachetti, D. S., Nainangu, P., and Chen, B. (2017). β-elemene: Mechanistic studies on cancer cell interaction and its chemosensitization effect. Front. Pharmacol. 8, 105. doi: 10.3389/fphar.2017.00105
Jiang, Z. Y., Qin, S. K., Yin, X. J., Chen, Y. L., and Zhu, L. (2012). Synergistic effects of Endostar combined with β-elemene on malignant ascites in a mouse model. Exp. Ther. Med. 4, 277–284. doi: 10.3892/etm.2012.583
Jiao, N., Baker, S. S., Nugent, C. A., Tsompana, M., Cai, L., Wang, Y., et al. (2018). Gut microbiome may contribute to insulin resistance and systemic inflammation in obese rodents: a meta-analysis. Physiol. Genomics. 50, 244–254. doi: 10.1152/physiolgenomics.00114.2017
Kelly, B. J., Gross, R., Bittinger, K., Sherrill-Mix, S., Lewis, J. D., Collman, R. G., et al. (2015). Power and sample-size estimation for microbiome studies using pairwise distances and PERMANOVA. Bioinformatics. 31, 2461–2468. doi: 10.1093/bioinformatics/btv183
Kilkkinen, A., Virtamo, J., Vartiainen, E., Sankila, R., Virtanen, M. J., Adlercreutz, H., et al. (2004). Serum enterolactone concentration is not associated with breast cancer risk in a nested case-control study. Int. J. cancer. 108, 277–280. doi: 10.1002/ijc.11519
Lawson, C. E., Wu, S., Bhattacharjee, A. S., Hamilton, J. J., McMahon, K. D., Goel, R., et al. (2017). Metabolic network analysis reveals microbial community interactions in anammox granules. Nat. Commun. 8, 15416. doi: 10.1038/ncomms15416
Lee, S., and Lee, D. K. (2018). What is the proper way to apply the multiple comparison test? Korean J. Anesthesiol. 71, 353–360. doi: 10.4097/kja.d.18.00242
Li, D., Liu, C. M., Luo, R., Sadakane, K., and Lam, T. W. (2015). MEGAHIT. an ultra-fast single-node solution for large and complex metagenomics assembly via succinct de Bruijn graph. Bioinformatics. 31, 1674–1676. doi: 10.1093/bioinformatics/btv033
Li, Q., Ding, X., Liu, K., Marcella, C., Liu, X., Zhang, T., et al. (2020). Fecal microbiota transplantation for ulcerative colitis: the optimum timing and gut microbiota as predictors for long-term clinical outcomes. Clin. Transl. Gastroenterol. 11, e00224. doi: 10.14309/ctg.0000000000000224
Li, R., Yu, C., Li, Y., Lam, T. W., Yiu, S. M., Kristiansen, K., et al. (2009). SOAP2: an improved ultrafast tool for short read alignment. Bioinformatics. 25, 1966–1967. doi: 10.1093/bioinformatics/btp336
Liu, C., Zhao, D., Ma, W., Guo, Y., Wang, A., Wang, Q., et al. (2016). Denitrifying sulfide removal process on high-salinity wastewaters in the presence of Halomonas sp. Appl. Microbiol. Biotechnol. 100, 1421–1426. doi: 10.1007/s00253-015-7039-6
Liu, S., Li, Q., Li, G., Zhang, Q., Zhuo, L., Han, X., et al. (2020). The mechanism of m(6)A methyltransferase METTL3-mediated autophagy in reversing gefitinib resistance in NSCLC cells by β-elemene. Cell Death Dis. 11, 969. doi: 10.1038/s41419-020-03148-8
Liu, Y., Cheng, Y., Li, J., Wang, Y., and Liu, Y. (2018). Epoxy stearic acid, an oxidative product derived from oleic acid, induces cytotoxicity, oxidative stress, and apoptosis in HepG2 cells. J. Agric. Food Chem. 66, 5237–5246. doi: 10.1021/acs.jafc.8b01954
Liu, Y., Li, J., and Liu, Y. (2020). Effects of epoxy stearic acid on lipid metabolism in HepG2 cells. J. Food Sci. 85, 3644–3652. doi: 10.1111/1750-3841.15405
Liu, Y., Yang, K., Jia, Y., Shi, J., Tong, Z., Fang, D., et al. (2021). Gut microbiome alterations in high-fat-diet-fed mice are associated with antibiotic tolerance. Nat. Microbiol. 6, 874–884. doi: 10.1038/s41564-021-00912-0
Lordan, C., Thapa, D., Ross, R. P., and Cotter, P. D. (2020). Potential for enriching next-generation health-promoting gut bacteria through prebiotics and other dietary components. Gut. Microbes. 11, 1–20. doi: 10.1080/19490976.2019.1613124
Luo, H., Vong, C. T., Chen, H., Gao, Y., Lyu, P., Qiu, L., et al. (2019). Naturally occurring anti-cancer compounds: shining from Chinese herbal medicine. Chin. Med. 14, 48. doi: 10.1186/s13020-019-0270-9
Ma, L. T., Bai, Y., Li, J., Qiao, Y., Liu, Y., Zheng, J., et al. (2021). Elemene emulsion injection administration reduces neuropathic pain by inhibiting astrocytic NDRG2 expression within spinal dorsal horn. Chin. J. Integr. Med. 27, 912–918. doi: 10.1007/s11655-021-3438-3
Mago,č, T., and Salzberg, S. L. (2011). FLASH. fast length adjustment of short reads to improve genome assemblies. Bioinformatics. 27, 2957–2963. doi: 10.1093/bioinformatics/btr507
Mali, A. V., Padhye, S. B., Anant, S., Hegde, M. V., and Kadam, S. S. (2019). Anticancer and antimetastatic potential of enterolactone: Clinical, preclinical and mechanistic perspectives. Eur. J. Pharmacol. 852, 107–124. doi: 10.1016/j.ejphar.2019.02.022
Markowiak, P., and Slizewska, K. (2017). Effects of probiotics, prebiotics, and synbiotics on human health. Nutrients 9, 1021. doi: 10.3390/nu9091021
Pereira, F. C., Wasmund, K., Cobankovic, I., Jehmlich, N., Herbold, C. W., Lee, K. S., et al. (2020). Rational design of a microbial consortium of mucosal sugar utilizers reduces Clostridiodes difficile colonization. Nat. Commun. 11, 5104. doi: 10.1038/s41467-020-18928-1
Petrov, V. A., Saltykova, I. V., Zhukova, I. A., Alifirova, V. M., Zhukova, N. G., Dorofeeva, Y. B., et al. (2017). Analysis of gut microbiota in patients with Parkinson's disease. Bull. Exp. Biol. Med. 162, 734–737. doi: 10.1007/s10517-017-3700-7
Qureshi, M. Z., Attar, R., Romero, M. A., Sabitaliyevich, U. Y., Nurmurzayevich, S. B., Ozturk, O., et al. (2019). Regulation of signaling pathways by β-elemene in cancer progression and metastasis. J. Cell Biochem. 120, 12091–12100. doi: 10.1002/jcb.28624
Segata, N., Izard, J., Waldron, L., Gevers, D., Miropolsky, L., Garrett, W. S., et al. (2011). Metagenomic biomarker discovery and explanation. Genome. Biol. 12, R60. doi: 10.1186/gb-2011-12-6-r60
Senizza, A., Rocchetti, G., Mosele, J. I., Patrone, V., Callegari, M. L., Morelli, L., et al. (2020). Lignans and gut microbiota: An interplay revealing potential health implications. Molecules 25, 5709. doi: 10.3390/molecules25235709
Singh, R. K., Chang, H. W., Yan, D., Lee, K. M., Ucmak, D., Wong, K., et al. (2017). Influence of diet on the gut microbiome and implications for human health. J. Transl. Med. 15, 73. doi: 10.1186/s12967-017-1175-y
Smits, L. P., Bouter, K. E., de Vos, W. M., Borody, T. J., and Nieuwdorp, M. (2013). Therapeutic potential of fecal microbiota transplantation. Gastroenterology. 145, 946–953. doi: 10.1053/j.gastro.2013.08.058
Sommer, F., Anderson, J. M., Bharti, R., Raes, J., and Rosenstiel, P. (2017). The resilience of the intestinal microbiota influences health and disease. Nat. Rev. Microbiol. 15, 630–638. doi: 10.1038/nrmicro.2017.58
Sun, W., Kim, D. H., Byon, C. H., Choi, H. I., Park, J. S., Bae, E. H., et al. (2022). β-elemene attenuates renal fibrosis in the unilateral ureteral obstruction model by inhibition of STAT3 and Smad3 signaling via suppressing MyD88 expression. Int. J. Molec. Sci. 23, 5553. doi: 10.3390/ijms23105553
Tong, H., Liu, Y., Jiang, L., and Wang, J. (2020). Multi-targeting by β-elemene and its anticancer properties: A good choice for oncotherapy and radiochemotherapy sensitization. Nutr. Cancer. 72, 554–567. doi: 10.1080/01635581.2019.1648694
Wang, S., Wei, Y., Liu, L., and Li, Z. (2021). Association between breastmilk microbiota and food allergy in infants. Front. Cell Infect. Microbiol. 11, 770913. doi: 10.3389/fcimb.2021.770913
Worley, B., and Powers, R. (2013). Multivariate analysis in metabolomics. Curr. Metabol. 1, 92–107. doi: 10.2174/2213235X11301010092
Wu, Q., Shi, X., Pan, Y., Liao, X., Xu, J., Gu, X., et al. (2022). The chemopreventive role of β-elemene in cholangiocarcinoma by restoring PCDH9 expression. Front. Oncol. 12, 874457. doi: 10.3389/fonc.2022.874457
Wu, X. S., Xie, T., Lin, J., Fan, H. Z., Huang-Fu, H. J., Ni, L. F., et al. (2009). An investigation of the ability of elemene to pass through the blood-brain barrier and its effect on brain carcinomas. J. Pharm. Pharmacol. 61, 1653–1656. doi: 10.1211/jpp.61.12.0010
Yao, Y., Yan, L., Chen, H., Wu, N., Wang, W., Wang, D., et al. (2020). Cyclocarya paliurus polysaccharides alleviate type 2 diabetic symptoms by modulating gut microbiota and short-chain fatty acids. Phytomedicine. 77, 153268. doi: 10.1016/j.phymed.2020.153268
Zeleniuch-Jacquotte, A., Adlercreutz, H., Shore, R. E., Koenig, K. L., Kato, I., Arslan, A. A., et al. (2004). Circulating enterolactone and risk of breast cancer: a prospective study in New York. Br. J. Cancer. 91, 99–105. doi: 10.1038/sj.bjc.6601893
Zhai, B., Zhang, N., Han, X., Li, Q., Zhang, M., Chen, X., et al. (2019). Molecular targets of β-elemene, a herbal extract used in traditional Chinese medicine, and its potential role in cancer therapy: A review. Biomed. Pharmacother. 114, 108812. doi: 10.1016/j.biopha.2019.108812
Zhang, C., Li, S., Yang, L., Huang, P., Li, W., Wang, S., et al. (2013). Structural modulation of gut microbiota in life-long calorie-restricted mice. Nat. Commun. 4, 2163. doi: 10.1038/ncomms3163
Zheng, C., Cai, X., Wu, S., Liu, Z., Shi, Y., Zhou, W., et al. (2014). Enhancing effect of β-elemene emulsion on chemotherapy with harringtonine, aclacinomycin, and Ara-c in treatment of refractory/relapsed acute myeloid leukemia. Pakistan J. Med. Sci. 30, 1270–1272. doi: 10.12669/pjms.306.5207
Zheng, J., Ye, C., Hu, B., Yang, H., Yao, Q., Ma, J., et al. (2021). Bile acid profiles in bile and feces of obese mice by a high-performance liquid chromatography-tandem mass spectrometry. Biotechnol. Appl. Biochem. 68, 1332–1341. doi: 10.1002/bab.2055
Zhihua, Y. U. E. H. L. (2018). Analysis of improvement of national standards of elemene and its preparations. Chin. J. Pharmaceut. 49, 1187–1190. doi: 10.16522/j.cnki.cjph.2018.08.023
Zhou, Y., Qiu, W., Wang, Y., Wang, R., Takano, T., Li, X., et al. (2021). β-Elemene suppresses obesity-induced imbalance in the microbiota-gut-brain axis. Biomedicines 9, 704. doi: 10.3390/biomedicines9070704
Zhu, J., Li, B., Ji, Y., Zhu, L., Zhu, Y., Zhao, H., et al. (2019). β-elemene inhibits the generation of peritoneum effusion in pancreatic cancer via suppression of the HIF1A-VEGFA pathway based on network pharmacology. Oncol. Rep. 42, 2561–2571. doi: 10.3892/or.2019.7360
Keywords: elemene emulsion injection, fecal microbiota, metabolomics, 16S rRNA, metagenome
Citation: Gu L, Wu H, Zhang Y, Wu Y, Jin Y, Li T, Ma L and Zheng J (2022) The effects of elemene emulsion injection on rat fecal microbiota and metabolites: Evidence from metagenomic exploration and liquid chromatography-mass spectrometry. Front. Microbiol. 13:913461. doi: 10.3389/fmicb.2022.913461
Received: 05 April 2022; Accepted: 31 October 2022;
Published: 24 November 2022.
Edited by:
Graciela L. Lorca, University of Florida, United StatesReviewed by:
Dengke Yin, Anhui University of Chinese Medicine, ChinaJiajun Wu, City University of Hong Kong, Hong Kong SAR, China
Copyright © 2022 Gu, Wu, Zhang, Wu, Jin, Li, Ma and Zheng. This is an open-access article distributed under the terms of the Creative Commons Attribution License (CC BY). The use, distribution or reproduction in other forums is permitted, provided the original author(s) and the copyright owner(s) are credited and that the original publication in this journal is cited, in accordance with accepted academic practice. No use, distribution or reproduction is permitted which does not comply with these terms.
*Correspondence: Jin Zheng, empkZGxuQDE2My5jb20=; Litian Ma, bWFsaXRpYW4xMjM0QDE2My5jb20=; Tian Li, Zm1tdWx0QGZveG1haWwuY29t
†These authors have contributed equally to this work and share first authorship