 Lucas A. Krueger
 Lucas R. Koester
 David F. Jones
94% of researchers rate our articles as excellent or good
Learn more about the work of our research integrity team to safeguard the quality of each article we publish.
Find out more
ORIGINAL RESEARCH article
Front. Microbiol., 09 January 2023
Sec. Microbiotechnology
Volume 13 - 2022 | https://doi.org/10.3389/fmicb.2022.1092315
This article is part of the Research TopicExploring the Role of Microorganisms in Silages: Species, Communities, Interactions, and Functional CharacteristicsView all 35 articles
The European Climate Law recently codified the goal for European climate neutrality by 2050, highlighting the need for sustainable farming practices within a robust and transparent carbon dioxide equivalent (CO2e) accounting system. In the present study, a series of equations were proposed for the estimation of CO2e emissions from corn silage fermentation. Systematic review of previous meta-analyses of corn silage fermentation identified the mean and standard deviation statistics for key model inputs of acetic acid, ethanol, lactic acid, ammonia, and volatile-corrected dry matter loss. Estimates of CO2e emissions were determined for a mock dataset comprising 1,000 iterations of randomly-generated values for each metric in accordance with mean and variance statistics of the source data. Estimates for CO2e emissions of corn silage based on meta-analysis review of laboratory experiments were 1.9 ± 5.6% (GWP20) and 0.2 ± 5.5% (GWP100) of silage dry matter. Furthermore, model results demonstrated a precedent for CO2 recycling by silage microorganisms, which was supported by genome annotation of strains belonging to common silage species. Linear model equations for GWP20 and GWP100 with inputs and outputs in mg kg−1 silage dry matter were developed, where inputs are acetic acid (A), ethanol (E), lactic acid (L), and volatile corrected dry matter loss (DV). Linear equations are (for GWP20; Eq. 11):
and for GWP100; Eq. 12:
Recent passage of European Climate Law EU 2021/1119 (European Parliament and the Council of the European Union, 2021) codified the goal for European climate neutrality by 2050 and targeted a 55% reduction in net greenhouse gas emissions from 1990 levels by 2030. Accordingly, national emissions inventories are submitted by participating EU member nations, as well as the United States, to the United Nations Framework Convention on Climate Change. A major focus of such inventories is the emission of carbon dioxide equivalent (CO2e) greenhouse gases. As defined in the U.S. 40 CFR Part 98, Equation A-1, CO2e is the number of metric tons of CO2 emissions with the same global warming potential (GWP) as one metric ton of another greenhouse gas. Pursuant to the European Climate Law and the IPCC Guidelines for National Greenhouse Gas Inventories (Buendia et al., 2019), the agriculture, forestry, and land use sector is noted for its important contribution of CO2 sinks that are essential to the transition to climate neutrality. COM(2020)381 (2020) referred to as the EU Farm to Fork Strategy, describes the incentivization of sustainable farming practices within this important sector, especially those which abide within a robust and transparent carbon accounting system. Undoubtedly, land use and conservation are and will remain under pressure to maximize food and feed yields with tandem adoption of sustainable farming practices.
Methods of silage preservation have not yet been considered for their potential impact on sustainability. Optimal silage preservation improves efficiency of land use, conservation of natural resources by preserving nutrient yields, and farmer profitability, but dry matter losses during ensiling can readily exceed 7% of dry matter mass (Rota et al., 2012). As will be demonstrated in this review, optimal silage preservation further decreases direct CO2 and CO2e emissions to the environment. However, silage preservation is poorly represented in policy-based discussion of sustainable farming practices in deference to pesticide and fertilizer use and efficiency of animal production (COM(2020)381, 2020).
Where international policy encourages farmers to seek out and adopt sustainable farming practices, emissions originating from silage preservation do not have sufficient documentation in the European Union or United States emissions inventories to encourage adoption of good silage preservation practices. In fact, emissions from stored silage are excluded from the European inventory, (European Environment Agency, 2019) whereas many of the factors relating to silage production are inventoried in non-agricultural sectors. For example, although fertilizer use is inventoried with agricultural emissions in the “managed soils” category, agricultural fuel use is inventoried with the energy sector, and cropland is inventoried with the land use, land use change, and forestry (LULUCF) sector. Moreover, the Farm to Fork Strategy (COM(2020)381, 2020) highlighted agricultural emissions as 10.3% of European emissions, but named only improved animal production efficiency, decreased pesticide use, and decreased fertilizer use as key opportunities for ensuring sustainable food production, completely overlooking sustainable silage preservation practices as a viable means to reduce CO2e emissions.
Although the present work is focused solely on emissions from silage fermentation, the outcomes are relevant to broader carbon footprint analysis efforts at the level of animal production and farm operations. Quantitative sustainability and CO2e footprint efforts have been advancing for well over a decade in dairy (Del Prado et al., 2011; Adom et al., 2012; Henriksson et al., 2014) and beef production (Rotz et al., 2013). Holistic farm carbon footprint assessments have not been limited to feedstuffs, but have also considered the roles of feeds, nutrients, and additives on enteric methane emissions (Little et al., 2017; Meller et al., 2019; Bannink et al., 2020). Furthermore, life cycle and carbon footprint assessments of food products consider not only the mass of product produced, but the nutritional value that is produced (Lee et al., 2021).
Recently, the Global Feed LCA Institute (GFLI) developed a leading database of animal feed life-cycle assessments (Martin et al., 2017). The GFLI database adheres to globally accepted FAO and EU standards, especially FAO LEAP guidelines (FAO, 2016; FAO, 2020) and Feed PEFCR (European Commission, 2018). Although the scope of this work comprises neither a life cycle assessment of silage nor a holistic approach to farm carbon footprint modelling, results are anticipated to quantify CO2e emissions from silage that have not been considered previously and that will be made transparent for inclusion in CO2e accounting efforts. In this light, the documentation of silage emissions will enable the testing, validation, and adoption of emissions technologies, thereby creating new value to farmers and the food supply chain.
This study does not aim to quantify the effects of silage preservation methods on emissions, but rather, through systematic review and extension of previous meta-analyses, aims to define a standard by which silage emissions can be estimated. This aim specifically encompasses the derivation of an emissions model from what is known about silage fermentation and sets a precedent for inorganic carbon recycling in well-preserved silage. With such a standard in place, it is expected that methods resulting in more efficient silage preservation, lower direct emissions to the environment, and greater farmer profitability can be further recognized as robust and transparent CO2e emissions reducing technologies. The emissions model described in following sections considers that dry matter loss from silage is the most direct estimate of total emissions by mass, but not all emissions are comprised of CO2. Rather, dry matter loss is considered to encompass three critical fractions: (1) direct CO2 emissions from fermentation metabolism, (2) evaporation of non-CO2 volatile organic compounds (VOC), and (3) CO2 and metabolic water from aerobic respiration. These are equated to CO2e emissions in terms CM, CO, and CR in further sections.
All statistical procedures were carried out using Statistix 10 (Analytical Software, Tallahasse, FL). Linear model terms and differences among means were significant where p < 0.05.
A series of equations is proposed to account for CO2e emissions from silage preservation. In the equations that follow, all terms are scaled to units of mg kg−1 (ppm) values. Terms include concentration of lactic acid, acetic acid, ethanol, ammonia, dry matter loss, volatile-corrected dry matter loss, and the concentration of all minor VOC. Through systematic review and extension of data, the three fractions of dry matter loss stated above are equated to CO2e emissions. Methods stated in this section include minimal discussion of assumptions, with these concepts elaborated thoroughly in Discussion.
The first fraction of dry matter loss to be equated to CO2e emissions is direct CO2 emissions from fermentation metabolisms (CM). Direct CO2 emissions from fermentation specifically comprise CO2 produced from the decarboxylation of pyruvate in fermentation pathways. Fermentation products in silage are known to include lactic acid, acetic acid, ethanol, and numerous other VOC. A previous meta-analysis (Hafner et al., 2013) documented the mean concentration of 32 VOC in silage. This mean reported concentration (MRC) is re-iterated in Table 1. Also stated in Table 1 is the molar CO2 equivalent (MCE), which is the stoichiometric ratio of mol CO2 produced per mol of each fermentation product from a hexose sugar. Direct metabolic production of CO2 (calculated direct metabolic production of CO2 in mg kg−1; CDMP) for each VOC is calculated through Eq. 1:
where variables MRC (mg kg−1), molar mass, and MCE for each compound are presented in Table 1, and constant 44.01 is the molar mass of CO2. Therefore, CDMP (Table 1) is the mass of CO2 released during the metabolism of a hexose sugar to each respective VOC.
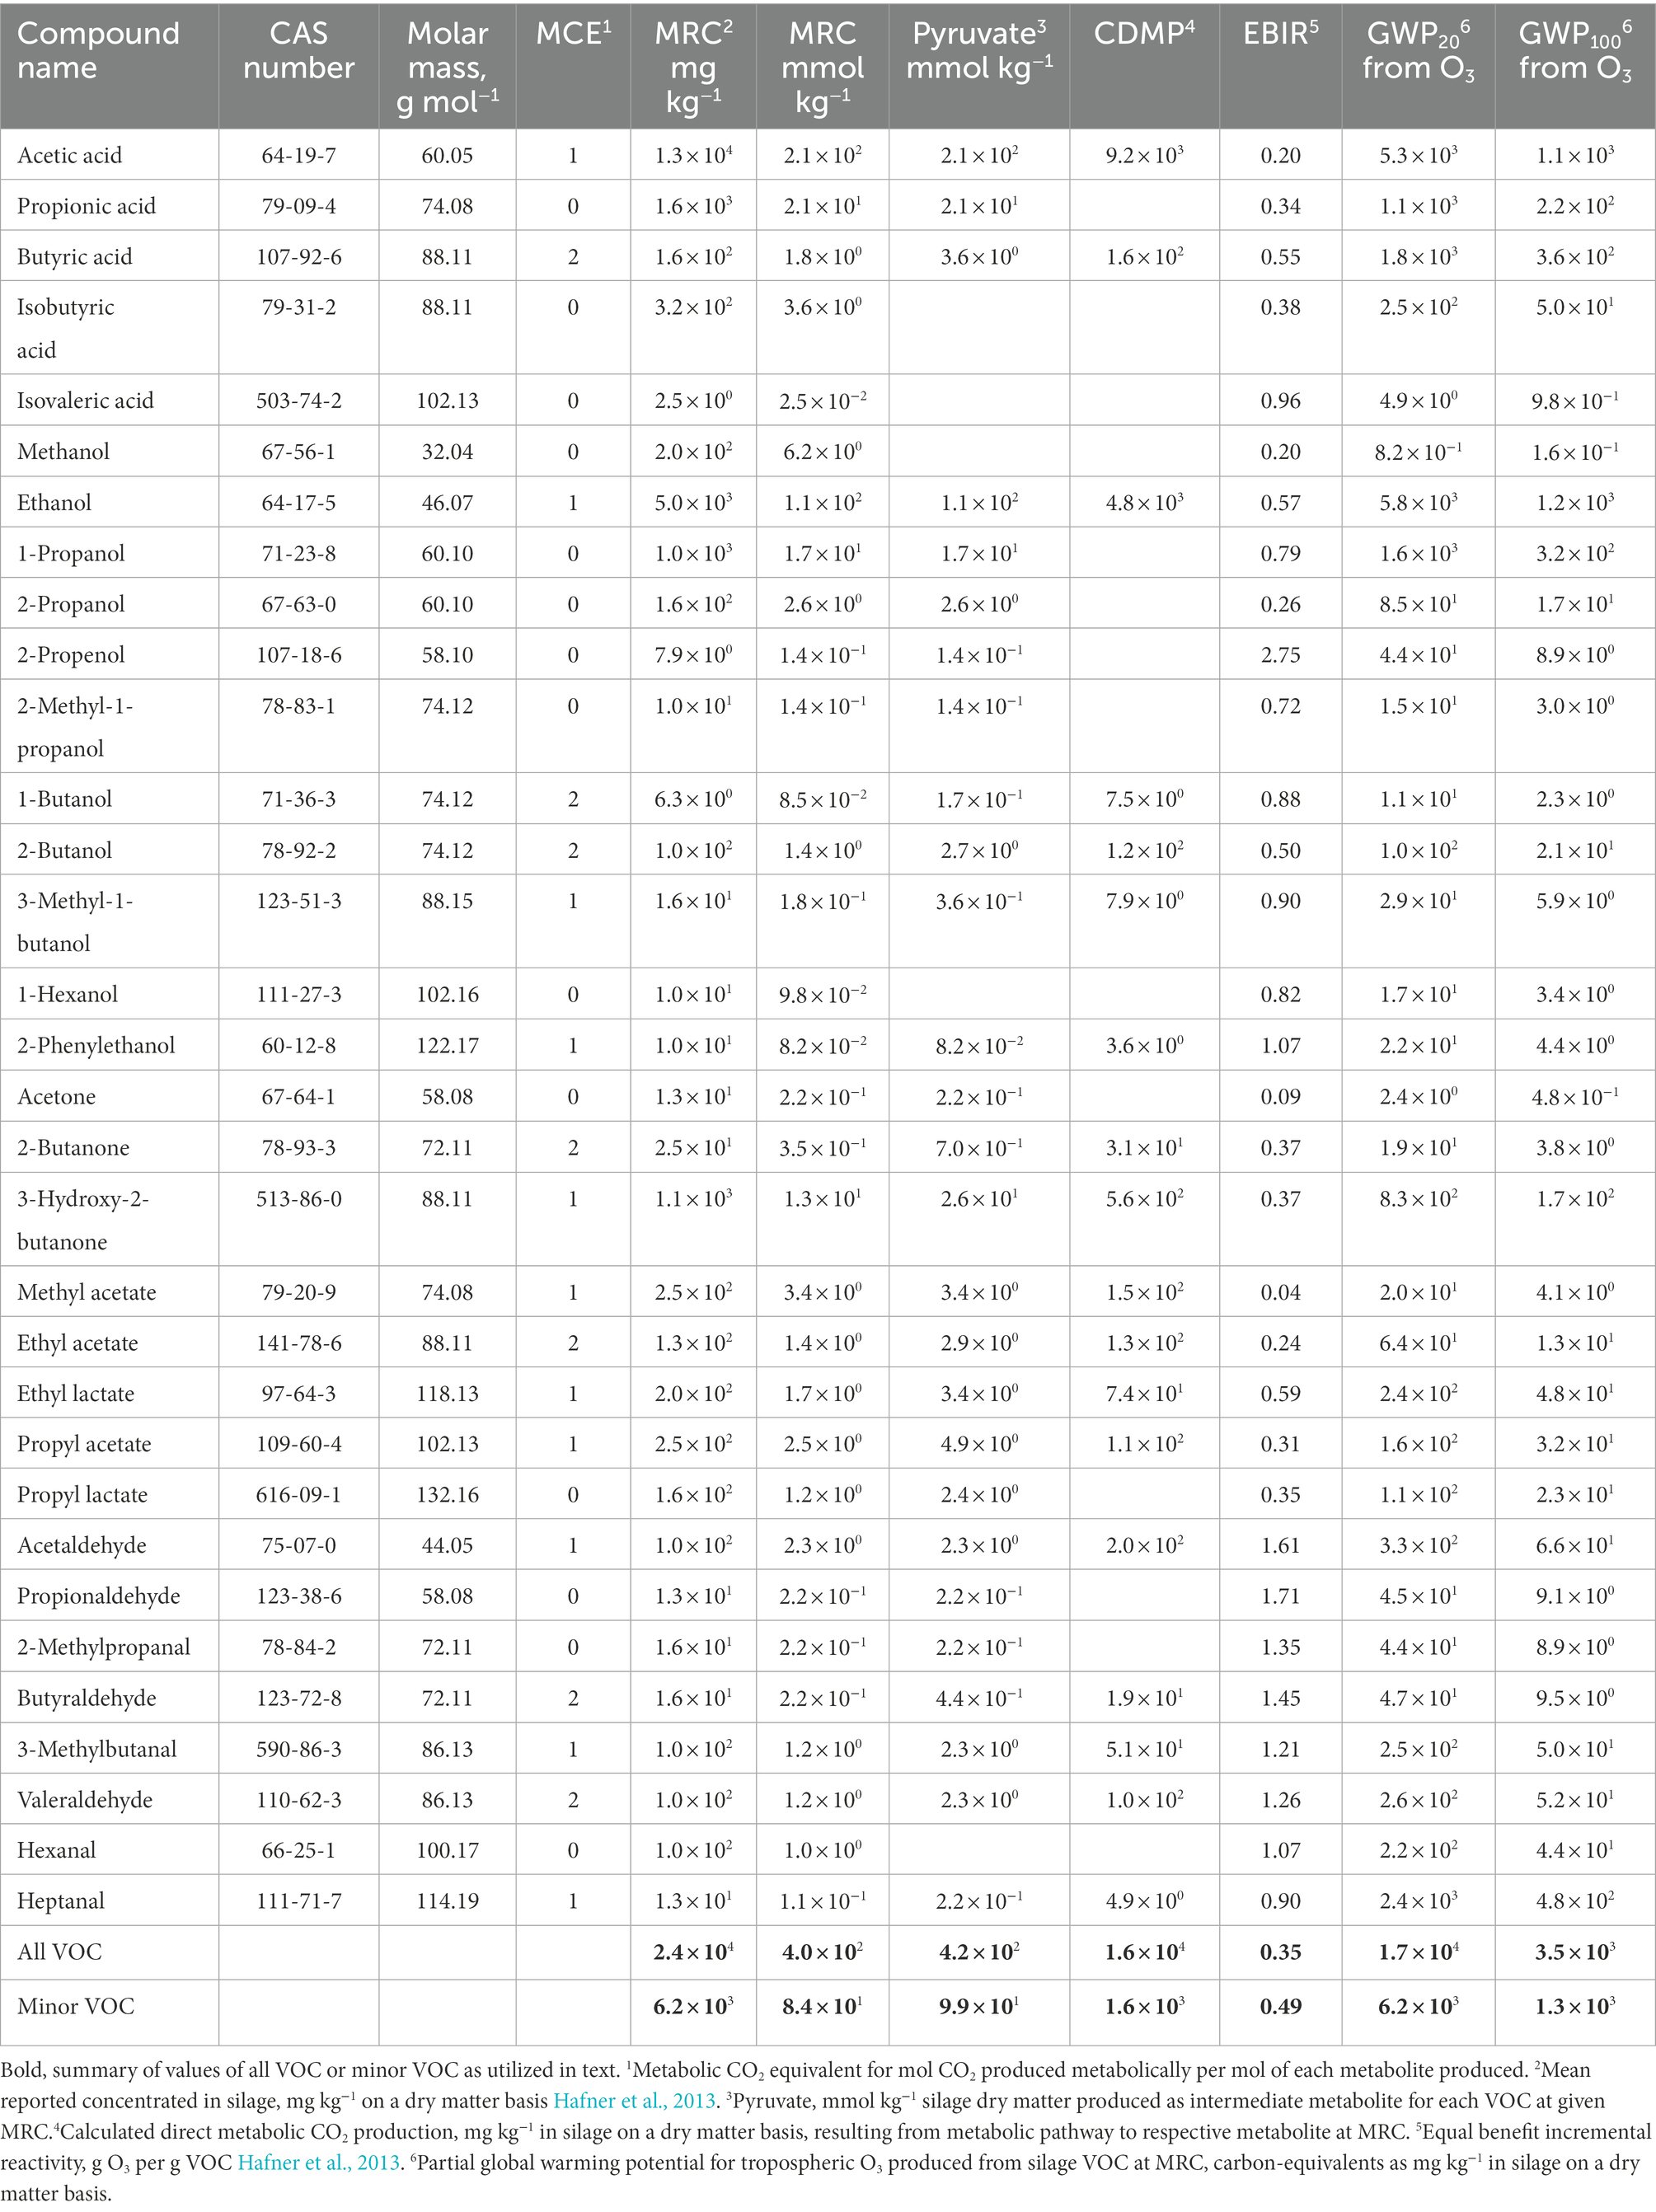
Table 1. Volatile organic compounds in silage and molar equivalent CO2 release for metabolite production.
In equations that follow, hexoses comprise 65% of fermentable sugars and pentoses comprise the remaining 35%. The basis for this assumption is an ad hoc analysis of sugars in fresh, green chop corn silage samples (n = 6) conducted by Analab (Agri-King, Inc., Fulton, IL 61252) according to AOAC method 2018.16. Pentose sugars comprised 35.0 ± 9.6% (mean ± SD) of available sugars by mass.
Eq. 2 estimates total metabolic production of CO2 from the fermentation of sugars to acetic acid, ethanol, and minor VOC. Acetic acid and ethanol are common measures in silage, whereas other minor VOC are not. Therefore, concentration of acetic acid and ethanol are included as variables, whereas concentration of minor VOC is a constant. Table 1 documents that the minor VOC account for approximately 1.6 × 10³ mg CO2 kg−1 silage dry matter. Where acetic acid and ethanol are quantified per kg silage dry matter and minor VOC are estimated at MRC, direct CO2 emission from metabolite production (CM) is calculated by:
where CM is mg CO2, A is mg acetic acid, E is mg ethanol, MA is the molar mass of acetic acid (60.05 g mol−1), ME is the molar mass of ethanol (46.07 g mol−1), MC is the molar mass of carbon dioxide (44.01 g mol−1), constant 1.6 × 10³ is the contribution from minor VOC at MRC, and constant 0.65 represents the portion of hexoses among total sugars from which acetate, ethanol, and minor VOC are derived.
Estimates for CO2e emissions of non-CO2 VOC from silage dry matter comprise the evaporation of acetic acid, ethanol, and the minor VOC coupled with propensity to form low atmospheric (tropospheric) O3. These estimates are scaled as global warming potential (GWP) in CO2e equivalents on a mg kg−1 basis in silage dry matter on 20 year and 100 year horizons and are termed CO-20 and CO-100 (Terms named GWP20 and GWP100 are reserved for cumulative estimates of CO2e emissions).
Evaporation of VOC occurs at ambient temperature over a duration of many hours as silage faces are exposed and silage is further defaced, mixed into feed, and delivered into the feedbunk (Hafner et al., 2013; Robinson et al., 2016). Volatility coefficients of 0.554 and 0.991 (Porter and Murray, 2001) are applied to the concentrations of acetic acid and ethanol, which are variable in Eqs 3 and 4 below. Concentration of minor VOC is assumed constant at MRC, which was reported by Hafner et al. (2013). Estimated O3 formation from emitted VOC is listed as equal benefit incremental reactivity (EBIR) in Table 1 and also is adapted from Hafner et al. (2013). These data are extended in Table 1 to provide weighted mean EBIR for the minor VOC of 0.49.
The CO2e of O3 is stated as 2.04 on a 20 year horizon and 0.41 on a 100 year horizon. These values are derived as an extension of data reported by Ramaswamy et al. (2001), from an estimate of relative normalized radiative forcing (681.0; Table 2) amortized to the atmospheric lifetime of O3. This estimate is elaborated in Discussion. Constants in Eq. 3 and Eq. 4 of 6.2 × 10³ and 1.3 × 10³, respectively, describe the CO2e of the minor VOC based on concentration, EBIR, and GWP of O3. These constants are stated in Table 1. Therefore, the CO2e emissions of VOC through O3 formation are represented on 20 and 100 year horizons as CO20 and CO100 in Eq. 3 and Eq. 4, respectively.
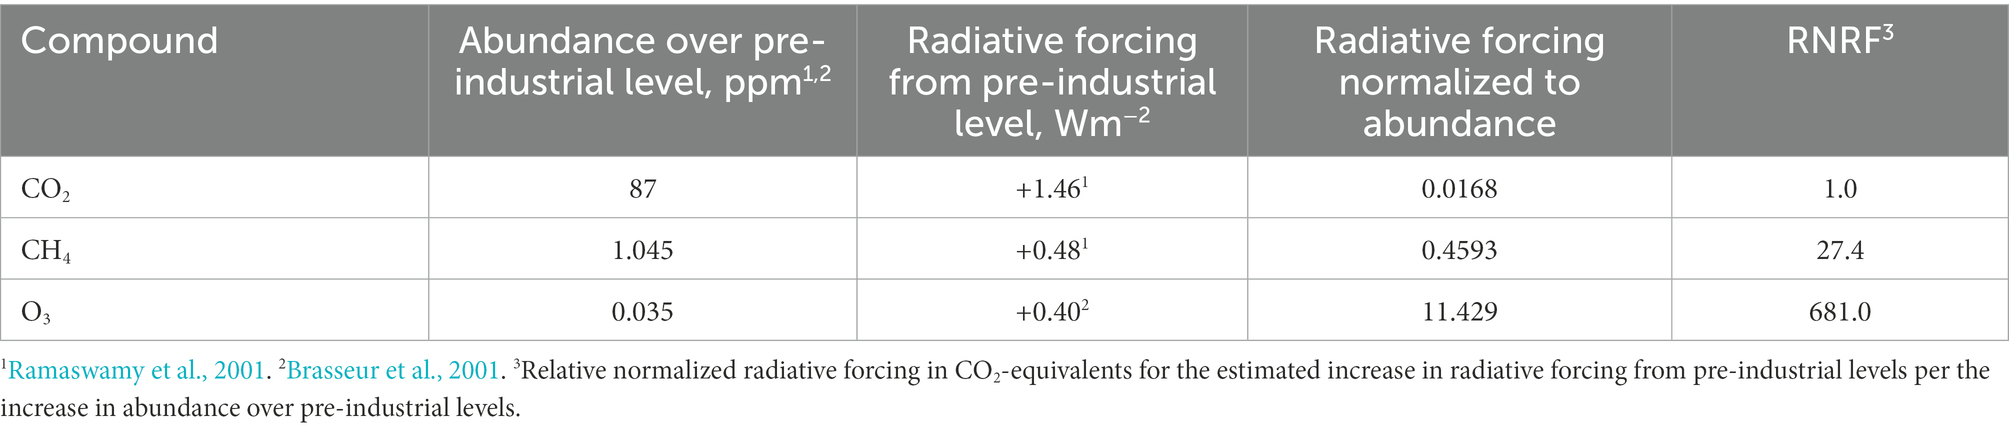
Table 2. Radiative forcing normalized to abundance of atmospheric compounds.
Respired CO2 is estimated from empirically measured dry matter loss after subtracting mass lost through glycolysis and the evaporation of VOC. Respired mass is converted to mass of CO2 through molar ratios.
Eq. 5 determines mass lost to the production of pyruvate through glycolysis. Eq. 5 sums the molar concentration of pyruvate required for the manufacture of lactic acid (L), acetic acid (A), ethanol (E), and minor VOC (constant at 99.2 mmol kg−1). In Eq. 5, L, A, and E are in units of mg kg−1 and ML, MA, and ME the respective molecular weights for each compound. Mass losses from glycolysis to pyruvate are 3 g mol−1 and hexose sugars comprise 65% of fermentable sugars.
Eq. 6 determines the mass of volatiles lost during determination of dry matter loss. Volatility coefficients are from Porter and Murray (2001) for drying at 60°C. In addition to variables A, E, and L stated for Eq. 5, ammonia in mg kg−1 is input as variable N.
Eq. 7 further determines respired CO2 as term CR by subtracting terms P (from Eq. 5), CM (from Eq. 2), and V (from Eq. 6) from dry matter loss determined by oven dry matter. This estimate of respired mass is converted through molar ratios where 1 mol glucose is respired to 6 mol CO2, constant 44.01 is the molar mass of CO2 and constant 180.156 is the molar mass of glucose.
Where volatile corrected dry matter loss (vcDML) is considered in later review and discussion, adapted equations include DV to denote vcDML as a substitute for oven dry matter loss (term D).
Where vcDML is utilized in lieu of oven dry matter loss in Eq. 7, the equation term V (calculated in Eq. 6) should be equal to 6.2 × 10³, to reflect only the evaporation of minor VOC that is assumed to be constant. This is the result of accounting for the evaporation of A, E, L, and N in the determination of vcDML, rather than in Eq. 6. With this modification in practice, vcDML as term DV is substituted for D in Eq. 7. It should again be noted that all equations are scaled to mg kg−1 values. This substituted equation is shown as Eq. 8:
Where oven dry matter loss, lactic acid, acetic acid, ethanol, and ammonia are measured empirically in silage per kg dry matter, and minor VOC are present at MRC, total CO2e emissions are determined by the following equation:
where CM is direct CO2 emissions from the fermentation of sugars to total VOC, CR is direct CO2 emissions from respiration, and COT is either CO20 or CO100 for O3 originating from emitted VOC.
Measures A, E, L, N, and D, which are inputs to Eqs 2 through 8, are known to be variable in fermented silage. Existing meta-analyses were reviewed to define mean and variance estimates for these measures to enable further estimation of mean and variance for GWP of corn silage fermentation.
Five meta-analysis studies were identified in which fermentation outcomes were characterized for untreated whole crop corn (maize) silages. Of these five studies, one analysis (Kasmaei et al., 2013) reviewed observations specifically from the Swedish University of Agricultural Sciences and did not specify observations from studies published in the literature. Three others reviewed the effects of a silage additive. Specifically, Kleinschmit and Kung (2006) reviewed the effects of Lentilactobacillus buchneri (formerly Lactobacillus buchneri; Zheng et al., 2020) compared with control and this analysis was updated and made more comprehensive by Arriola et al. (2021), whereas Da Silva and Kung (2022) reviewed the effects of a chemical additive compared with control. Lastly, Blajman et al. (2018) reviewed 104 published studies that included a control and were reported between calendar years 1980 and 2017.
Of the meta-analysis studies named, those by Arriola et al. (2021) and Blajman et al. (2018) are noted as the most comprehensive. The report by Blajman et al. (2018) failed to specifically cite each of the 104 works included in the analysis, whereas the meta-analysis by Arriola et al. (2021) provided complete citation of studies (Supplementary Table S1; Arriola et al., 2021). This provision of references enabled further examination of data and methods, which was necessary since this report summarized fermentation outcomes from multiple ensiled forage types (62 studies of corn silage out of 158 studies in the meta-analysis). Because of the comprehensive scope and transparency of data, the values and uncertainties reported by Arriola et al. (2021) were considered to be the best available meta-data to describe the fermentation outcomes of corn silage.
Mean and standard deviation for A, E, L, N, and D were summarized for treatment means of control corn silage samples in the meta-analysis by Arriola et al. (2021). Since not all studies reported each metric, the number of studies and the number of treatment means reported were also summarized.
Data summarized by Arriola et al. (2021) were further extended to estimate vcDML. Studies reviewed by Arriola et al. (2021) were examined to determine if dry matter loss was reported directly as vcDML or as oven dry matter loss, as shown in Table 3. Of the 35 studies that reported a dry matter loss value, 4 studies reported vcDML directly, and another 30 studies reported oven dry matter loss with additional data on the concentration of fermentation products such as lactic acid, acetic acid, ethanol, and ammonia. With the aim of summarizing vcDML from these studies in the meta-analysis, a vcDML value was calculated for each treatment mean using coefficients described by Porter and Murray (2001). Namely, where oven dry matter was determined by drying at 60°C, volatility coefficients for lactic acid, acetic acid, ethanol, and ammonia were 0.090, 0.554, 0.991, and 1.003, respectively. Where oven dry matter was determined by drying at 100°C, the same respective coefficients were 0.375, 0.892, 0.975, and 0.987.
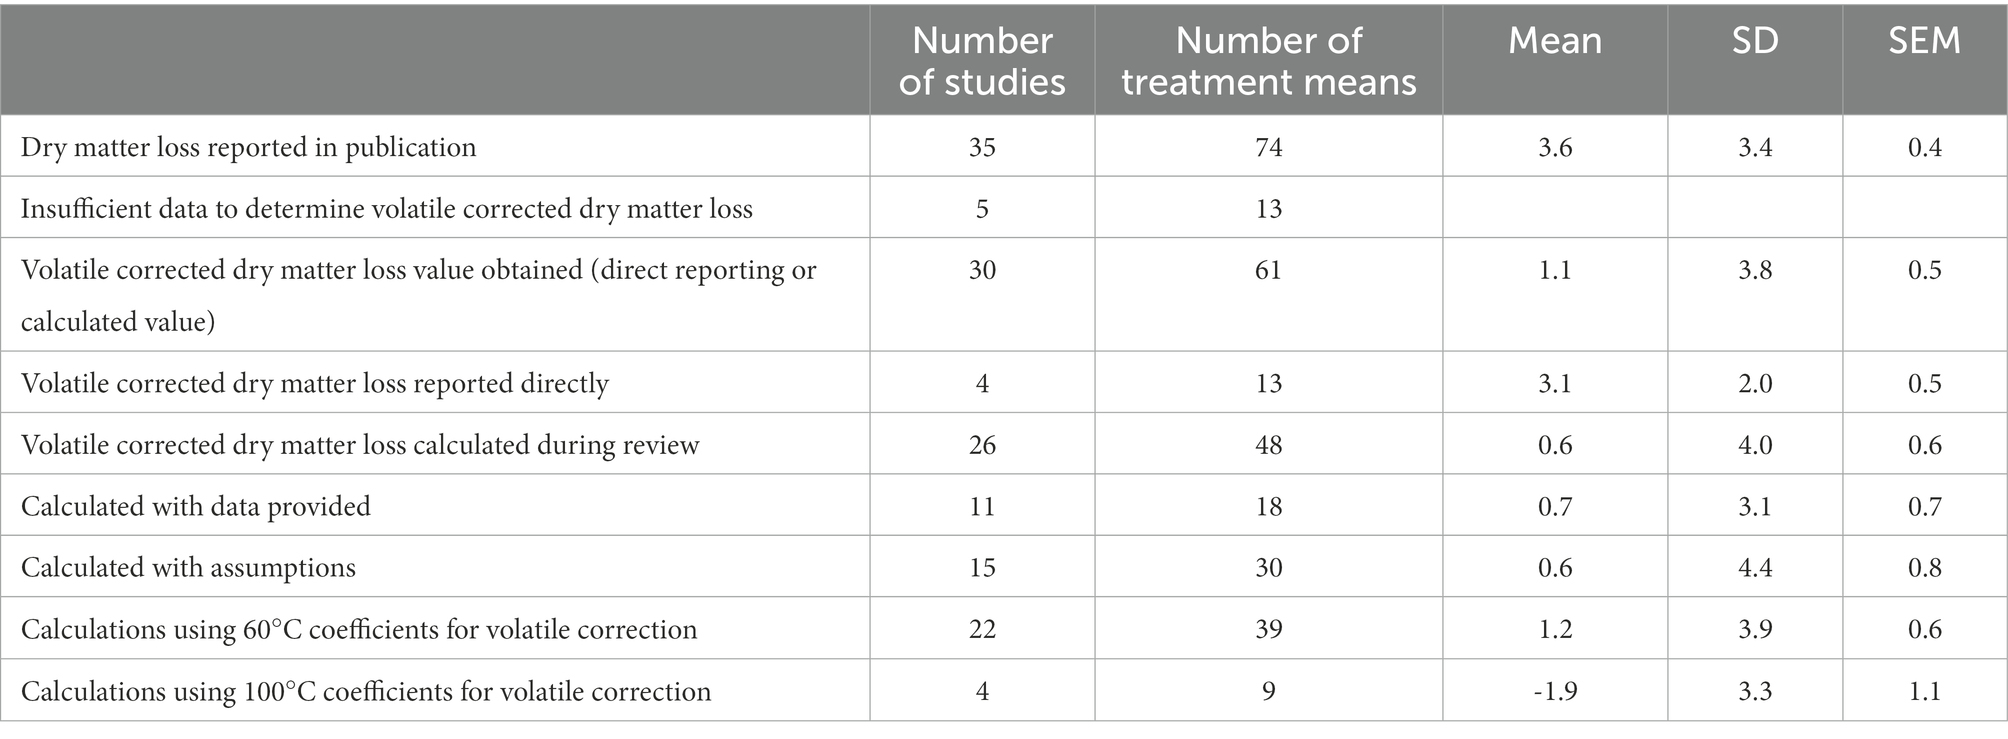
Table 3. Evaluation of dry matter loss in studies summarized by Arriola et al. (2021).
Of the 30 studies and 61 treatment means for which a vcDML value was obtained, approximately half (15 studies, 30 treatment means) provided incomplete data on the concentration of fermentation products. Each of these studies did report lactic and acetic acids, each study omitted ammonia as a % of dry matter, and 8 studies omitted ethanol. Where either ammonia, ethanol, or both values were omitted, calculations for vcDML were populated with the mean ethanol or ammonia value reported in Table 4.
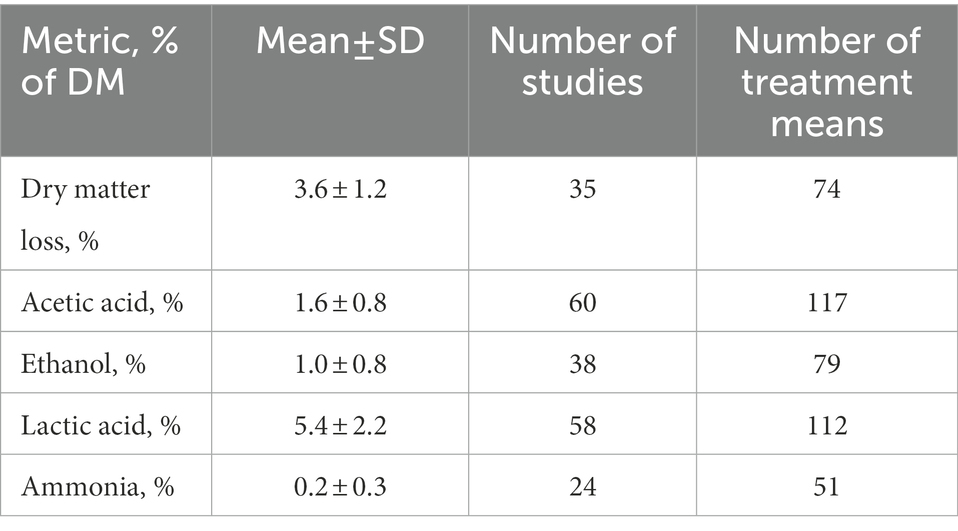
Table 4. Mean fermentation values and uncertainties in corn silage based on meta-analysis by Arriola et al. (2021).
With the aim of providing mean and variance estimates for GWP20 and GWP100 of corn silage fermentation, the mean and standard deviation of A, E, L, N, and DV from Tables 3, 4 guided the generation of random data as a mock dataset with 1,000 iterations of each metric. The mean and SD for each metric determined by Arriola et al. (2021) were used as boundaries in the data generation step and are reiterated in Table 5. Term D was dropped from the analysis in favor of utilizing DV as input for estimates.

Table 5. Parameters for generation of random data.
All source data for each of the metrics in Table 5 were found to be distributed non-normally by Shapiro–Wilk normality test. Since random generation of data with a normal distribution would therefore be incompatible with the source data, values were transformed using a Box-Cox transformation for all metrics except lactic acid, for which a square root transformation was optimal. Box-Cox optimal λ value for each metric was determined by inputting indexed source data into an online tool.1 In order to accomplish the Box-Cox transformation for DV, data were first adjusted by +10 to render all values positive. The Box-Cox transformation function for DV was:
Table 5 further documents the mean and SD of the transformed values. For each metric of A, E, L, N, and DV, transformed mean and standard deviation were used as input values for population mean and variance for the generation of random data (1,000 iterations) with normal distribution via an online tool.2 Randomly generated data were then back-transformed and assembled into a dataset of 1,000 mock silage samples. Then, GWP20 and GWP100 were calculated for each mock sample according to Eqs 2 through 6 and Eqs. 8 and 9. Therefore, each GWP20 and GWP100 estimate was produced from data that abided by the population statistics of the original non-normal source data summarized by Arriola et al. (2021). Values for GWP20, GWP100 and model terms CM, CO20, CO100, and CR were summarized as mean, SD, and SEM for the dataset of 1,000 mock samples (Table 6).
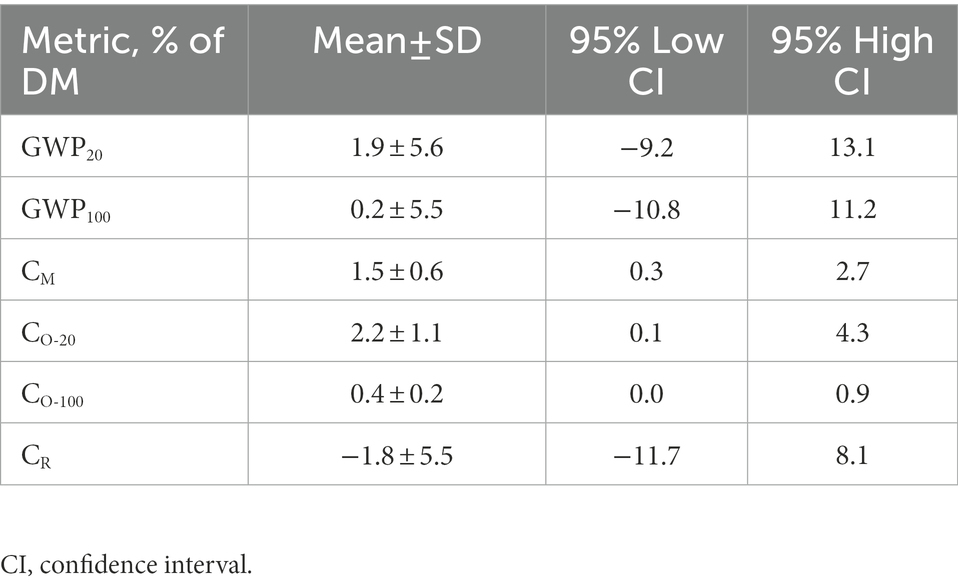
Table 6. Estimates of GWP20 and GWP100 and associated model terms from randomly generated population data.
The authors assert that Eq. 1 through Eq. 9 are cumbersome and prohibitive to the practical application of GWP estimates for silage fermentation. To simplify the set of equations for practical use, the mock dataset was subject to linear regression to derive coefficients for the direct estimation of GWP20 and GWP100 from empirical measurements A, E, L, N, and D, using each as an unforced, independent starting variable. It should be again noted that vcDML as term DV was substituted for D in the mock data, such that term V (calculated in Eq. 6 and input in Eq. 7) was constant at 6.2 × 10³ mg kg−1. Because N is only considered in Eq. 2 through Eq. 7 with regard to dry matter loss, and term DV was inputted to the regression, N was already accounted for by term DV. Therefore N was not anticipated to be a significant model term, although its determination in silage is essential for calculating DV.
Whereas linear model equations were derived from the mock dataset, the model was validated against the original source data. Values for GWP20 and GWP100 were calculated by using Eqs. 2 through 9 and by using respective linear model equations. Identical values between the two methods revealed, as expected, that the linear model accurately condensed Eqs 2 through 9 and was therefore valid.
As will be presented in further sections, model outcomes indicated a strong likelihood for inorganic carbon recycling during corn silage fermentation. To augment review that is presented below, the authors queried publicly available genomes of four common silage organisms to evaluate the presence of 10 known genes, including aquaporin GlpF, carbonic anhydrase, and several carboxylase enzymes known to incorporate bicarbonate ion into organic biomolecules. Query strains were Lactiplantibacillus plantarum SK151, Levilactobacillus brevis NPSQW145, Lentilactobacillus buchneri ATCC4005 (all formerly classified as Lactobacillus, Zheng et al., 2020), and Lactococcus lactis LAC640. Open reading frames from each genome were predicted using Prokka v1.14.6 (Seemann, 2014) and annotated using eggNOG-mapper v2 (Cantalapiedra et al., 2021). Gene matches identified in the annotations were confirmed by BLAST search.
All silage fermentation profile data used to define model constants were generated or adopted from published sources as cited. All genomes of common silage inoculant bacteria are freely available through the National Center for Biotechnology Information GenBank database. GenBank accession numbers for each genome are provided in Supplementary Table S1.
Principal findings of the present work comprise estimates of mean and variance statistics for corn silage fermentation outcomes and estimates of GWP20 and GWP100 based on extension of these primary data.
Review and extension of the data reported by Arriola et al. (2021) resulted in mean and variance estimates for measures A, E, L, N, D, (Table 3) and DV (Table 4). These estimates guided the generation of random data for a mock dataset to inform estimates of GWP20 and GWP100. Specifically, term DV was estimated at 1.1 ± 3.8% of silage dry matter, whereas oven dry matter was reported at 3.6 ± 3.4%. Analysis shown in Table 4 further summarizes this term. Importantly, vcDML for samples dried at 60°C was 1.2 ± 3.9%, but was−1.9 ± 3.3% for samples dried at 100°C. This notable difference was observed despite applying two different sets of volatility coefficients as prescribed by Porter and Murray (2001). The validity and implications of DV < 0 are elaborated in Discussion.
Estimates for GWP20, GWP100 and associated model terms CM, CO-20, CO-100, and CR are recorded in Table 6. Notably, Eqs. 1 through 7 operate in units of mg kg−1, but outcomes were converted to percentage units for display in Table 6. The GWP20 of corn silage fermentation (mean ± SD) was estimated at 1.9 ± 5.6% of silage dry matter, whereas GWP100 was estimated at 0.2 ± 5.5%. Respective mean ± SEM values are 1.9 ± 0.2 for GWP20 and 0.2 ± 0.2 for GWP100. Therefore, GWP20 was significantly greater than zero (analyzed by one-sample t-test), whereas GWP100 was not significantly different from zero (p = 0.267).
Model term CR was estimated at-1.8 ± 5.5% of dry matter (mean ± SD). This value again is significantly differently from zero (mean ± SEM of-1.8 ± 0.2; p < 0.001). The validity and implications of DV < 0 and CR < 0 are elaborated in Discussion.
Linear regression procedures produced a simplified linear model equations for GWP20 and GWP100 to substitute for cumbersome Eqs. 2 through 9. The linear model established by regression for GWP20 was:
where variables A, E, L, and DV are the concentration of acetic acid, ethanol, lactic acid, and volatile corrected dry matter loss on a dry matter basis, respectively, and all values are expressed in mg kg−1. The linear model established by regression for GWP100 was:
where variables and model constraints are as described for Eq. 11. Because the linear equations were derived from a set of mathematical equations (Eq. 2 through Eq. 9), model R2 = 1 and coefficient standard error values were 0.
Genes of interest for their roles in inorganic carbon assimilation are described in Table 7 and their gene copy number within query genomes is shown in Figure 1. As shown in Figure 1, each of the 10 genes of interest for their roles in inorganic carbon assimilation were identified in one or more of the evaluated strains. At least one copy of both aquaporin glpF was present in all of the strains. Carbonic anhydrase (cah) was present in the Lactobacillus and Lactiplantibacillus genomes, but not in Lactococcus lactis. Lactiplantibacillus plantarum was found to harbor all genes of interest and carried a greater number of genes than the other strains. Sequences from query-matched open reading frames are documented in Supplementary Table S2. The results from related BLAST searches are documented in Supplementary Table S3.

Table 7. Genes queried in analysis for inorganic carbon assimilation functions in common silage organisms.
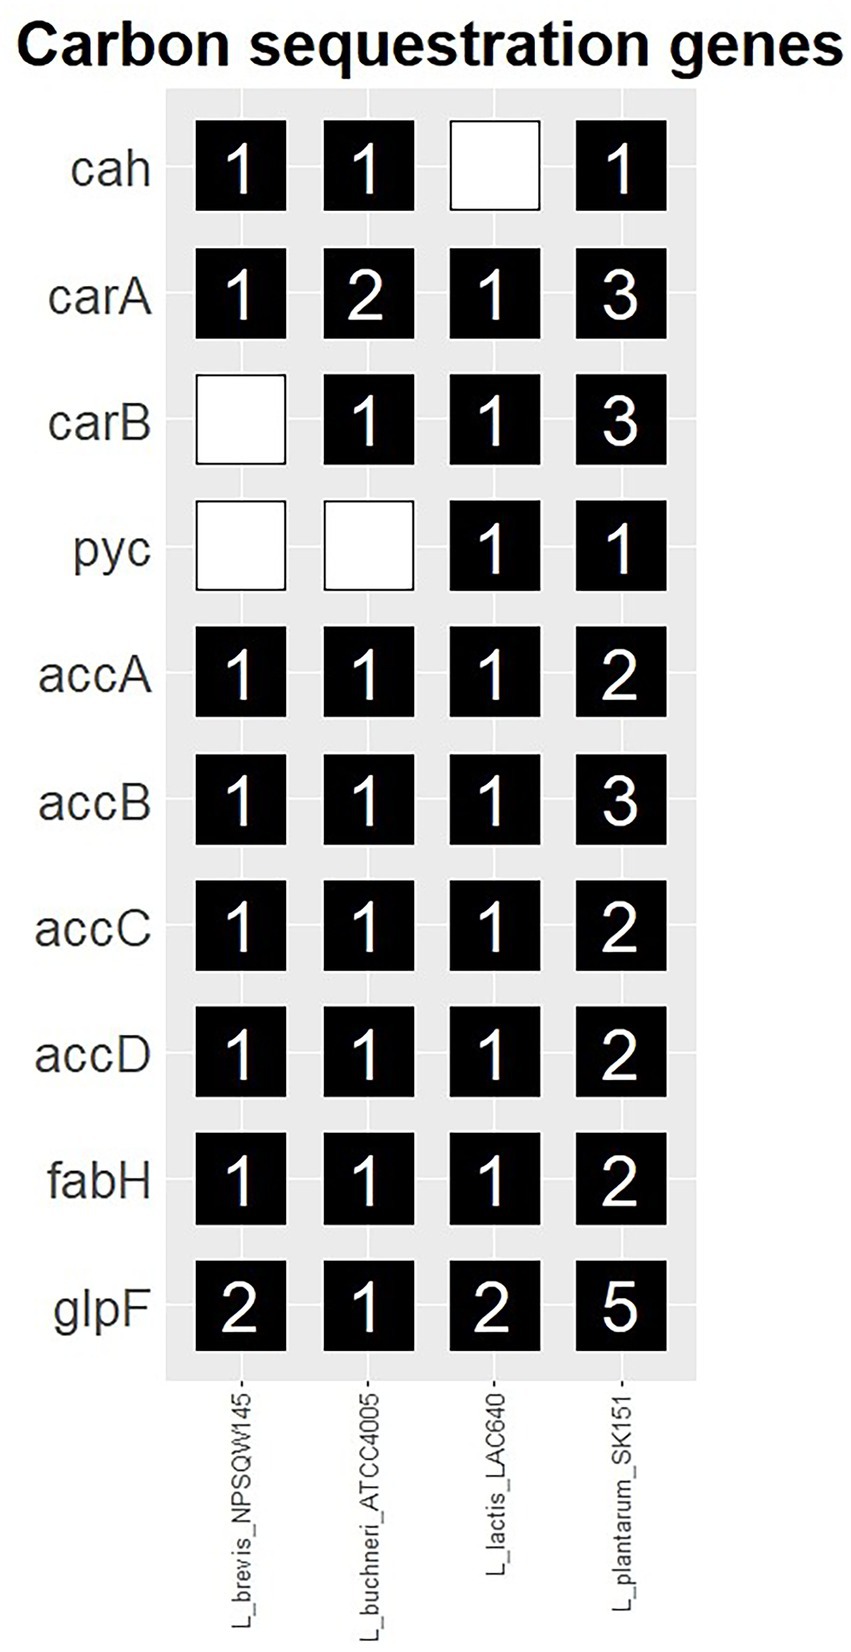
Figure 1. Prevalence of carbonic anhydrase and carboxylase genes, and the aquaglyceroporin glpF identified in common silage species.
Text provided in Materials and Methods was limited to information that was immediately pertinent to CO2e model equations. That information provided sufficient background and logic in most cases, but elaboration on a few critical points is provided here.
The GWP20 and GWP100 for O3 have not been reported previously, so the estimates utilized in model equations comprise a novel extension of data reported by Ramaswamy et al. (2001). Additionally, GWP as CO2e is undefined for the VOC produced in silage. As stated previously, the propensity of each VOC for O3 formation in the low-atmosphere (troposphere) has been described by measure of equal benefit incremental reactivity (EBIR), which is used for estimation of GWP based on the radiative forcing equivalent of tropospheric O3.
Most reports discussing tropospheric O3 do not directly acknowledge a CO2e GWP value and instead document a relative change in atmospheric radiative forcing (Iglesias-Suarez et al., 2018). However, a comparison of reported values for increased atmospheric abundance and radiative forcing for CO2, CH4, and O3 (Table 2), amortized for the atmospheric lifetime of O3, allows for an estimation of GWP. Ramaswamy et al. (2001) reported atmospheric abundance and radiative forcing for CO2 and CH4 in the modern era compared with pre-industrial levels. Where the increase in radiative forcing from the respective compounds is normalized to increased atmospheric abundance, CH4 is found to contribute to radiative forcing at approximately 27.4 times the magnitude of CO2, which agrees with the GWP100 value for methane of 25 that is utilized in the United States greenhouse gas inventory (EPA, 2022). Applying the same calculation to estimates of tropospheric abundance and radiative forcing of O3, tropospheric O3 is found to contribute to radiative forcing at a magnitude of approximately 681.0 times that of CO2. For approximate GWP estimation, this relative radiative forcing equivalent for tropospheric O3 is amortized to the estimated atmospheric lifetime of the compound, where O3 is short-lived with estimated atmospheric lifetime of 22 days (Brasseur et al., 2001; Goldberg et al., 2015). Therefore, estimates for GWP20 (20 year horizon) and GWP100 (100 year horizon) for tropospheric O3 are approximately 2.05 and 0.41 CO2e, respectively. These are the constants that are used in Eqs 3 and 4to estimate the GWP of VOC that result in O3 formation.
A complete understanding of the estimates in literature for vcDML (also term DV) is further critical for comparing the stoichiometric estimates of CO2 production within silage, which are terms CM and CR (Eqs 2 and 8, respectively). Results of model equations demonstrate that vcDML measurements do not agree with stoichiometric projections for CO2 production, as evidenced by the mean negative value for model term CR. Term CR is fundamentally derived from the difference between empirically measured dry matter loss and estimates of other volatilized mass based on fermentation outcomes. Where respiration occurs to a substantial degree, term CR should be a positive value. Where this term is negative, however, less dry matter loss is observed than should be observed if all projected CO2 is emitted from silage, even during the drying process of laboratory analysis. Since term CR is significantly negative, it is hypothesized that the meta-data of Arriola et al. (2021) demonstrate CO2 recycling within silage with microbial metabolism within silage facilitating this CO2 recycling event.
In the estimation of GWP20 and GWP100 for silage fermentation, Eq. 2 through Eq. 9 have established three model terms CM, CO (as CO-20 or CO-100), and CR. As stated previously, term CM estimates true CO2 that is requisitely produced by the decarboxylation of pyruvate to acetyl-CoA during the fermentation of sugars to lactic acid, acetic acid, and minor VOC. This estimation of true carbon dioxide production is compared with an estimate of dry matter loss (or volatile-corrected dry matter loss by substitution of Eq. 6 with a constant) to derive term CR, which is an estimate of CO2 from respiration. Results in Table 6 document a mean negative value (−1.8 ± 5.5; mean ± SD) for term CR, which indicates that less carbon dioxide is produced than the amount estimated by term CM.
There is ample evidence in the literature of respiration during the first phase of ensiling, and this paradigm is not disputed here. As reviewed by McDonald (1981), oxygen in an air-tight silo is depleted by respiring plant material within 30 min of ensiling, long before most microorganisms are known to escape the fermentation lag phase. As further reviewed by Ruxton and McDonald (1973), oxygen infiltration to the silo has long been known to promote the growth of aerobic (respiring) microorganisms and to result in higher silage pH, lower lactic acid concentration, temperature rise, and greater dry matter loss (Ruxton and McDonald, 1973). Oxygen-induced respiration in silage has been further modeled to predict dry matter loss (Pitt, 1986), whereas application of oxygen barrier film covering has been proven effective for decreasing dry matter loss in silage in more recent years (Wilkinson and Fenlon, 2014; Wilkinson and Rinne, 2018). Therefore, the authors assert that the negative value for term CR noted above does not describe an absence of respiration, but rather that the amount of CO2 estimated to be emitted from silage is less than the amount of CO2 that should be derived from the fermentation of sugars to organic acids. This estimation is the mathematical basis for proposed CO2 recycling in silage by silage microorganisms.
The above examples further highlight that observations of silage at commercial scale have driven much of the interest in laboratory scale silage research, where differences between these two scales of work are evident. This primary difference is the magnitude of dry matter loss, which is driven by total oxygen exposure. The results of the present work document that at laboratory scale, vcDML was 1.2 ± 3.9% of dry matter. Laboratory scale conditions are typified by small silos constructed of PVC or air-tight plastic material that is tightly sealed and regarded as impermeable to oxygen. No such presumption of absolute impermeability exists at commercial scale, where bunker silos are generally regarded as oxygen-permeable (Pitt, 1986). Reports of commercial-scale dry matter loss are infrequent in the literature, especially compared with laboratory-scale data, but Rota et al. (2012) noted that dry matter loss at commercial scale readily exceeds 7% of dry matter, whereas Pitt (1986) estimated that typical losses can be approximately 1–3% per month of storage. Bolsen et al. (1993) documented dry matter loss in the top 25 cm of silage stored in bunker silos and demonstrated that even polyethylene-covered silage can succumb to dry matter loss approaching 20% of dry matter, which is nearly triple the magnitude of loss for silage at a depth of 75–100 cm from the bunker surface. These data by Bolsen et al. (1993) do support that silage deep in a bunker is much less permeable to gas diffusion than silage near the bunker surface, which applies both to atmospheric oxygen and also to silage gases such as CO2, which are produced in the silage.
Although this key difference between laboratory and commercial-scale study systems exists, there is no basis for the fundamental nature of metabolic processes to be different between systems. Certainly, the magnitude of respiration is greater at commercial scale than at laboratory scale, just as has been discussed, but pathways for respiration to CO2, or fermentation to organic compounds, abide by the same metabolic course. This fundamental nature of metabolism is captured by Eqs. 2 through 9, which further serve as the basis for linear model Eq. 11 and 12. Therefore, although the metrics of fermentation outcomes and dry matter loss are likely to differ between laboratory and commercial scales, the present model is robust to these differences by means of its basis in the metabolic pathways of fermentation and respiration.
The CO2e emissions footprint of silage fermentation, documented in Table 6, was produced from source data entirely from laboratory-scale experiments. Application of the present model for silage fermentation at commercial scale will be dependent on empirical measurements of commercial silage. The authors propose especially that experiments are needed in commercial bunker silos and bag silos to determine vcDML and other model inputs for the sound estimation of GWP20 and GWP100, as well as for determining the effects of ensiling practices such as packing, covering, use of oxygen barrier film, and application of inoculant.
Just as the physiological basis of fermentation and respiration validate laboratory-scale silage research, term CR in the present modeling effort indicates a mathematical basis for CO2 recycling in silage. Such a mechanism is not without precedent. Over 80 years ago, Krebs (1941) reviewed CO2 assimilation in heterotrophic bacteria. In the preceding decade, carbonic anhydrase, responsible for catalyzing the reversible hydration of CO2 to H2CO3 (and the further dissociated bicarbonate ion) had been discovered by two independent teams, but not evaluated in bacteria (Meldrum and Roughton, 1933; Stadie and O’Brien, 1933). Much later, carbonic anhydrase was isolated and purified from bacterial species and its properties described (Veitch and Blankenship, 1963; Adler et al., 1972; Brundell et al., 1972). Smith and Ferry (2000) reviewed these and further advancements in prokaryotic carbonic anhydrases, including the discovery of two additional classes (β and γ) of the enzyme that were found to be widespread and dominant in bacteria, compared with the well-described α class of eukaryotic cells (Alber and Ferry, 1994; Smith et al., 1999; Smith and Ferry, 1999). Of note, Smith et al. (1999) demonstrated that although α class carbonic anhydrase enzymes were rare throughout archaeal and bacterial domains, the other classes of the enzyme were widespread, especially in chemolithoautotrophs for which CO2 fixation may depend on bicarbonate ion generated from carbonic anhydrase.
Later, Arsène-Ploetze and Bringel (2004) noted that many lactic acid bacteria, including Lactiplantibacillus (formerly Lactobacillus) plantarum, Enterococcus faecalis, and Enterococcus faecium, are stimulated by inorganic carbon and are properly described as capnophillic, encoding not only carbonic anhydrase of the prevalent γ class, but also of the rare α class. Each of these organisms are prevalent among native lactic acid bacteria in silages (Langston and Bouma, 1960; Callieri and Malacalza, 1974; Mcdonald, 1981), with L. plantarum and E. faecium (formerly Streptococcus faecium) also used commonly as silage additives.
Yet other researchers have described the mechanisms of CO2 transport across microbial cell membranes. Michenkova et al. (2021) recently reviewed several factors that contribute to transmembrane CO2 diffusion and permeability. Citing the work of Gutknecht et al. (1977) and Musa-Aziz et al. (2014) alongside new experiments, they demonstrated that intracellular carbonic anhydrase activity could increase the cellular influx of CO2. As CO2 was converted to carbonic acid within the cell, intracellular CO2 decreased. In turn, this increased the CO2 gradient between extracellular and intracellular spaces and increased CO2 permeability.
Additionally, Michenkova et al. (2021) described cell membrane modifications such as aquaporins that could allow for CO2 permeability. Aquaporins are a family of pore proteins that facilitate the selective flux of small molecules across the cell membrane. In Nakhoul et al. (1998) demonstrated that human aquaporin AQP1 acted as a CO2 channel. This was the first demonstration of gas movement through a membrane pore. The bacterial glycerol facilitator uptake protein (glpF) is an aquaglyceroroporin, which is an aquaporin subfamily. Protein glpF is known to export lactic acid from the cytosol and is commonly encoded for in lactic acid bacterial genomes. As with other aquaporins, glpF is known not only to transport CO2, but is less selective and more permeable to CO2 than human AQP1 (Hub and de Groot, 2008). Although these concepts of pure cell physiology have been reviewed extensively in the past (Boron et al., 2011; Endeward et al., 2014; Michenkova et al., 2021), their application to CO2 fixation in silage has never been documented.
The results of genome annotation review by these authors mostly agree with Arsène-Ploetze and Bringel (2004), including the absence of carbonic anhydrase in L. lactis. However, in the present review, no more than one carbonic anhydrase gene was detected in each of the genomes. Notably, L. plantarum was found to have greater carboxylase gene redundancy than the other strains in the analysis.
Higher gene redundancy does not directly translate to higher expression of these genes, but the differences detected in gene presence may indicate the potential for inherent metabolic distinctions between species (Hahn, 2009; Bratlie et al., 2010). Metabolic differences among species of LABs are evident, with L. plantarum and L. lactis classified as homofermenters of carbohydrates to lactic acid and L. buchneri and L. brevis classified as heterofermenters of carbohydrates to lactic acid and acetic acid or ethanol (Gänzle, 2015; Wang et al., 2021). Heterofermentation of glucose produces CO2 into the silage system, which potentially affects the activity of carbonic anhydrase and the expression of carboxylase genes. However, inoculation of corn silage with heterofermentative bacteria has been shown to result in greater dry matter loss than inoculation with homofermentative LABs, suggesting the released CO2 is not entirely recaptured (Tabacco et al., 2011). The observation of carboxylase pathway redundancy in Lactiplantibacillus plantarum, a homofermenter, is therefore striking from both aspects of potentially lower CO2 production from fermentation (CM) and potential CO2 recycling (CR). Both homo-and heterofementing LAB species have been studied as silage inoculants and these metabolic differences have been extensively covered in other literature (Muck et al., 2018).
Only a small subset of silage-relevant LAB species were analyzed in this study, so whether these pathways are widely distributed among species, either inoculated or native to silage, remains to be determined. As there are currently no transcriptomic studies describing bacterial gene expression during the ensiling process, the prevalence and timing of carbonic anhydrase and carboxylase gene expression also is unknown. Future experiments utilizing quantitative gene expression of carbonic anhydrase and carboxylase enzymes, may help to elucidate the prevalence of this mechanism within the silage environment.
Aside from genomic potential, silage conditions are indeed favorable for CO2 recycling pathways. Arsène-Ploetze and Bringel (2004) specifically noted that fermentation environments, especially where association with respiring organisms is prevalent, are rich in inorganic carbon as a substrate for numerous carboxylation reactions in lactic acid bacteria. A possible precedent for a CO2 recycling event has been recorded by Li et al. (2017), who documented negative change in silo headspace pressure and respiratory quotient (RQ) < 1 during the first 5 h of ensiling, albeit net positive change in CO2 concentration in the silo. Li et al. (2017) attributed these results to the dissolution of CO2 in silage water, whereby the greater solubility of CO2 compared with O2 was purported to account for the loss of gaseous mass from the headspace.
In essence, this observation identified that less CO2 was produced in the headspace than what should have been produced if RQ = 1. The outcomes of the present modeling effort also support this notion, but the primary result of the present findings is that model term CR is consistently negative, and this outcome is tied to empirical findings of dry matter loss, which should account for dissolved CO2 in silage water by virtue of the drying process. It is important to note that Li et al. (2017) proposed CO2 dissolution kinetics by means of carbonic acid formation and further dissociation to bicarbonate ion, but there is ample precedent for simple diffusion or channel-mediated transfer of gaseous CO2 in the biological systems, as described above. The purpose of discussing these diffusion kinetics is to further extend that gaseous CO2, if dissolved into silage water, should be accounted for in our estimation of term CR. Therefore, we extend that this discrepancy is not solely accounted for by dissolution kinetics, but rather that it is highly likely for CO2 to be recycled, especially by means of intracellular carbonic anhydrase and carboxylase activities.
In addition to farm-scale work and transcriptomic studies already proposed, future work must aim to quantify the proportion of available CO2 in a silage environment that is recycled by such pathways in silage microorganisms. A likely means for such a study is the use of isotopically-labelled CO2 or substrates in a silage experiment. Theoretically, the value of term CR can be justified by measuring the proportion of CO2 recycled by cells as a proportion of respired CO2 if both respiration and CO2 assimilation can be accounted for. Experiments utilizing isotopic carbon are likely to be fruitful in this regard.
For silage microorganisms with membranes permeable to CO2, the influx of CO2 to the cytosol pushes equilibrium to favor the formation of carbonic acid and the further dissociated bicarbonate ion. As a charged ion, bicarbonate is less permeable to the cell membrane than dissolved CO2. Equilibrium favoring dissociated bicarbonate ion is especially favored in the near-neutral cytosol as the pKa of carbonic acid has been empirically determined at 3.49 ± 0.05 (Pines et al., 2016), a value revised from previous calculations (Tossell, 2005). In fermenting microorganisms, the CO2-rich environment of silage similarly favors CO2 diffusion across the cell membrane to the cytosol, where equilibrium again favors formation of carbonic acid and bicarbonate ion, especially in microorganisms utilizing carboxylase pathways. This proposed mechanism fully agrees with the high prevalence of capnophillic lactic acid bacteria that are commonly observed in silages. Therefore, where GWP estimates of silage fermentation are considered, the documentation of negative values in the statistical uncertainties does not disagree with precedent in the literature for CO2 recycling by silage microorganisms. Manipulation of silage bacteria and the use of optimal ensiling procedures holds great promise for decreasing silage CO2e emissions and perhaps even the sequestration of inorganic carbon.
It was previously noted that silage fermentation is excluded from national emissions inventories that are reported to the UNFCC. The USDA reported 130.3 Mt. of corn silage harvested from United States cropland in 2021 (NASS, USDA, 2022). Arriola et al. (2021) reported mean dry matter of 32.0% (data not shown), for an estimated 41.6 Mt. of corn silage dry matter. With GWP20 of 1.9 ± 5.6% of silage dry matter calculated in the present work, corn silage fermentation is projected to account for 791 kt of CO2e on a 20 year horizon. On a 100 year horizon (GWP100 of 0.2 ± 5.5%), CO2e emissions total approximately 83 kt, although the 95% confidence interval demonstrates that this value is not significantly different from 0. For additional perspective, the CO2e footprint of corn silage production has been estimated at approximately 200 g CO2e per kg dry matter, or approximately 20% by mass (Adom et al., 2012).
The low 95% confidence limit extends the possibility of GWP100 from corn silage fermentation to -10.8% of silage dry matter. In practice, this value does not seem sensible or achievable, considering that respired losses from silage have long been considered inevitable. However, as discussed, silage studied at the laboratory scale clearly demonstrates the possibility for negative vcDML and inorganic carbon recycling. Rather than quantify the value of U.S. corn silage as a potential emissions sink at the extreme low value of the 95% confidence interval, it shall suffice to simply project the value of incrementally improved silage preservation. In Eq. 12 above, a decrease in vcDML of 1 percentage point (i.e., from 2 to 1% vcDML) equates to a 1 percentage point decrease in GWP100 if other fermentation metrics such as organic acids and ethanol remain constant. This magnitude of change is within the bounds of current silage preservation techniques such as packing, covering, and inoculating silage (Goeser et al., 2015; Borreani et al., 2018). At the scale of U.S. corn silage production, one such increment would amount to a reduction of 416 kt CO2e.
In the 2020 U.S. national emissions inventory (EPA, 2022), the agricultural sector accounted for 594.7 Mt. of CO2e emissions. The estimate for GWP100 from corn silage fermentation at national scale (83 kt and not statistically different from zero) is far below any other itemized source and is therefore not a meaningful CO2e source. Optimal silage preservation practices that sink inorganic carbon in silage could be meaningful to the national inventory if a net reduction in CO2e emissions of approximately 1 to 2 Mt., which is the approximate threshold for itemization, can be achieved.
The key conclusions drawn from this work encompass logical consideration of silage fermentation emissions, mean and variance estimates for silage fermentation outcomes, estimates and uncertainties for CO2e emissions from silage, a linear equation for estimating emissions from singular silage samples, and an established precedent for CO2 recycling by silage microorganisms. CO2e emissions from silage are the sum of CO2 produced as the metabolic outcome of pyruvate decarboxylation, O3 resulting from the evaporation of VOC, and respiration. The review by these authors of previously published meta-analyses indicates that mean and variance (SD) estimates for silage fermentation outcomes (% of dry matter) are lactic acid concentration of 5.4 ± 2.2%, acetic acid concentration of 1.6 ± 0.8%, ammonia concentration of 0.2 ± 0.3%, ethanol concentration of 1.0 ± 0.8%, and volatile corrected dry matter loss of 1.1 ± 3.8%. Estimates for CO2e emissions produced from mock data were (for GWP20) 1.9 ± 5.6% (mean ± SD) with 95% confidence limits of-9.2 to 13.1% of dry matter. Similarly, GWP100 was estimated at 0.2 ± 5.5% of dry matter with 95% confidence limits of-10.8 to 11.2% of dry matter. The linear equations for estimating CO2e emissions from silage, where all inputs and outputs are expressed in mg kg−1, were (for GWP20; Eq. 11):
and for GWP100; Eq. 12:
where A is acetic acid, E is ethanol, L is lactic acid, and D is volatile corrected dry matter loss. Finally, where silage microorganisms are capable of recycling CO2, fermented silage as animal feed has significant potential for decreased emissions, even so far as a carbon sink, by the application and manipulation of silage bacteria.
Processed data in this study are deposited in the GitHub repository and are available to the public at github.com/lucasakrueger/doi.10.3389.fmicb.2022.1092315.
LKr conceptualized the study and obtained data pertaining to emissions modelling, performed all calculations and statistics pertaining to the emissions model, and wrote the first draft of the manuscript. LKo obtained and mined genomic information from silage inoculant bacterial strains. LKr, LKo, DJ, and DS were involved in writing and editing successive drafts of the manuscript. All authors contributed to the article and approved the submitted version.
The work was funded by Agri-King, Inc. The funder had the following involvement with the study: study design, data analysis, decision to publish, and preparation of the manuscript.
The authors gratefully acknowledge Marcus Kehrli Jr. for manuscript review and Gene Gengelbach and Tony Grzemski for considerations of silage as a potential source of greenhouse gas emissions.
LKr, LKo, DJ, and DS were employed by Agri-King, Inc., which markets and sells a silage additive under the brand name of Silo-King®.
All claims expressed in this article are solely those of the authors and do not necessarily represent those of their affiliated organizations, or those of the publisher, the editors and the reviewers. Any product that may be evaluated in this article, or claim that may be made by its manufacturer, is not guaranteed or endorsed by the publisher.
The Supplementary material for this article can be found online at: https://www.frontiersin.org/articles/10.3389/fmicb.2022.1092315/full#supplementary-material
1. ^http://www.wessa.net/rwasp_boxcoxnorm.wasp
2. ^https://www.socscistatistics.com/utilities/normaldistribution/default.aspx
Adler, L., Brundell, J., Falkbring, S. O., and Nyman, P. O. (1972). Carbonic anhydrase from Neisseria sicca, strain 6021 I. Bacterial growth and purification of the enzyme. Biochim. Biophys. Acta - Bioenerg. 284, 298–310. doi: 10.1016/0005-2744(72)90068-X
Adom, F., Maes, A., Workman, C., Clayton-Nierderman, Z., Thoma, G., and Shonnard, D. (2012). Regional carbon footprint analysis of dairy feeds for milk production in the USA. Int. J. Life Cycle Assess. 17, 520–534. doi: 10.1007/s11367-012-0386-y
Alber, B. E., and Ferry, J. G. (1994). A carbonic anhydrase from the archaeon Methanosarcina thermophila. Proc. Natl. Acad. Sci. U. S. A. 91, 6909–6913. doi: 10.1073/pnas.91.15.6909
Arriola, K. G., Vyas, D., Kim, D., Agarussi, M. C. N., Silva, V. P., Flores, M., et al. (2021). Effect of Lactobacillus hilgardii, Lactobacillus buchneri, or their combination on the fermentation and nutritive value of sorghum silage and corn silage. J. Dairy Sci. 104, 9664–9675. doi: 10.3168/jds.2020-19512
Arsène-Ploetze, F., and Bringel, F. (2004). Role of inorganic carbon in lactic acid bacteria metabolism. Lait 84, 49–59. doi: 10.1051/lait:2003040
Bannink, A., Zom, R. L. G., Groenestein, K. C., Dijkstra, J., and Sebek, L. B. J. (2020). Applying a mechanistic fermentation and digestion model for dairy cows with emission and nutrient cycling inventory and accounting methodology. Animal 14, s406–s416. doi: 10.1017/S1751731120001482
Blajman, J. E., Paez, R. B., Vinderola, C. G., Lingua, M. S., and Signorini, M. L. (2018). A meta-analysis on the effectiveness of homofermentative and heterofermentative lactic acid bacteria for corn silage. J. Appl. Microbiol. 125, 1655–1669. doi: 10.1111/jam.14084
Bolsen, K. K., Dickerson, J. T., Brent, B. E., Sonon, R. N., Dalke, B. S., Lin, C., et al. (1993). Rate and extent of top spoilage losses in horizontal silos. J. Dairy Sci. 76, 2940–2962. doi: 10.3168/jds.S0022-0302(93)77634-1
Boron, W. F., Endeward, V., Gros, G., Musa-Aziz, R., and Pohl, P. (2011). Intrinsic CO2 permeability of cell membranes and potential biological relevance of CO2 channels. Chem. phys. Chem. 12, 1017–1019.
Borreani, G., Tabacco, E., Schmidt, R. J., Holmes, B. J., and Muck, R. E. (2018). Silage review: factors affecting dry matter and quality losses in silages. J. Dairy Sci. 101, 3952–3979. doi: 10.3168/jds.2017-13837
Brasseur, G. P., Muller, J. F., Tie, X., and Horowitz, L. (2001). Tropospheric ozone and climate: past, present and future. Present and Future of Modeling Global Environmental Change: Toward Integrated Modeling. TERRAPUB, 63–75.
Bratlie, M. S., Johansen, J., Sherman, B. T., Huang, D. W., Lempicki, R. A., and Drabløs, F. (2010). Gene duplications in prokaryotes can be associated with environmental adaptation. BMC Genomics 11, 1–17. doi: 10.1186/1471-2164-11-588
Brundell, J., Falkbring, S. O., and Nyman, P. O. (1972). Carbonic anhydrase from Neisseria sicca, strain 6021. II. Properties of the purified enzyme. Biochim. Biophys. Acta 284, 311–323. doi: 10.1016/0005-2744(72)90069-1
Buendia, E. C., Tanabe, K., Kranjc, A., Jamsranjay, B., Fukuda, M., Ngarize, S., et al. (2019). 2019 Refinement to the 2006 IPCC Guidelines for National Greenhouse gas Inventories. 4. Agriculture, Forestry and Other Land Use. IPCC, Switzerland.
Callieri, D. A., and Malacalza, E. (1974). Biological ensiling of sugarcane tops. VII. Isolation and characteristics of lactic acid bacteria. Folia Microbiol. 19, 164–168. doi: 10.1007/BF02872852
Cantalapiedra, C. P., Hernández-Plaza, A., Letunic, I., Bork, P., and Huerta-Cepas, J. (2021). eggNOG-mapper v2: functional annotation, orthology assignments, and domain prediction at the metagenomic scale. Mol. Biol. Evol. 38, 5825–5829. doi: 10.1093/molbev/msab293
COM(2020)381. (2020). Communication from the Commission to the European Parliament, the Council, the European Economic and Social Committee and the Committee of the Regions. A Farm to Fork Strategy for a Fair, Healthy and Environmentally-Friendly Food System. Directorate-General for Health and Food Safety. Brussels.
Da Silva, B. É., and Kung, L. (2022). A meta-analysis of the effects of a chemical additive on the fermentation and aerobic stability of whole-plant maize silage. Agriculture 12:132. doi: 10.3390/agriculture12020132
Del Prado, A., Misselbrook, T., Chadwick, D., Hopkins, A., Dewhurst, R. J., Davison, P., et al. (2011). SIMSDAIRY: a modelling framework to identify sustainable dairy farms in the UK. Framework description and test for organic systems and N fertiliser optimisation. Sci. Total Environ. 409, 3993–4009. doi: 10.1016/j.scitotenv.2011.05.050
Endeward, V., Al-Samir, S., Itel, F., and Gros, G. (2014). How does carbon dioxide permeate cell membranes? A discussion of concepts, results and methods. Front. Physiol. 4:382. doi: 10.3389/fphys.2013.00382
EPA. (2022). Inventory of U.S. Greenhouse Gas Emissions and Sinks 1990-2020. EPA 430-R-22-003. Available at: https://www.epa.gov/ghgemissions/draft-inventory-us-greenhouse-gas-emissions-and-sinks-1990-2020. (Accessed 21 November, 2022).
European Commission. (2018). PEFCR Feed for Food-Producing Animals. Available at: https://ec.europa.eu/environment/eussd/smgp/pdf/PEFCR_feed.pdf. (Accessed 21 November, 2022).
European Environment Agency. (2019). Annual European Union Greenhouse Gas Inventory 1990-2017 and Inventory Report 2019. EEA/PUBL/2019/051. Available at: https://www.eea.europa.eu/publications/european-union-greenhouse-gas-inventory-2019 (Accessed November 21, 2022).
European Parliament and the Council of the European Union (2021). Regulation (EU) 2021/1119 of the European Parliament and of the Council of 30 June 2021 Establishing the Framework for Achieving Climate Neutrality and Amending Regulations (EC) No 401/2009 and (EU) 2018/1999 (‘European Climate Law). OJEU. L243, 1-17.
FAO. (2016). Environmental Performance of Animal Feeds Supply Chains: Guidelines for Assessment. Livestock Environmental Assessment and Performance Partnership. FAO, Rome, Italy.
FAO. (2020). Environmental performance of feed additives in livestock supply chains: Guidelines for assessment. Livestock Environmental Assessment and Performance Partnership. FAO, Rome, Italy.
Gänzle, M. G. (2015). Lactic acid metabolism revisited: metabolism of lactic acid bacteria in food fermentations and food spoilage. Curr. Opin. Food Sci. 2, 106–117. doi: 10.1016/j.cofs.2015.03.001
Goeser, J. P., Heuer, C. R., and Crump, P. M. (2015). Forage fermentation product measures are related to dry matter loss through meta-analysis. Prof. Animal Sci. 31, 137–145. doi: 10.15232/pas.2014-01356
Goldberg, D. L., Vinciguerra, T. P., Hosley, K. M., Loughner, C. P., Canty, T. P., Salawitch, R. J., et al. (2015). Evidence for an increase in the ozone photochemical lifetime in the eastern United States using a regional air quality model. J. Geophys. Res.-Atmos. 120, 12778–12793. doi: 10.1002/2015JD023930
Gutknecht, J., Bisson, M. A., and Tosteson, F. C. (1977). Diffusion of carbon dioxide through lipid bilayer membranes: effects of carbonic anhydrase, bicarbonate, and unstirred layers. J. Gen. Physiol. 69, 779–794. doi: 10.1085/jgp.69.6.779
Hafner, S. D., Howard, C., Muck, R. E., Franco, R. B., Montes, F., Green, P. G., et al. (2013). Emission of volatile organic compounds from silage: compounds, sources, and implications. Atmos. Environ. 77, 827–839. doi: 10.1016/j.atmosenv.2013.04.076
Hahn, M. W. (2009). Distinguishing among evolutionary models for the maintenance of gene duplicates. J. Hered. 100, 605–617. doi: 10.1093/jhered/esp047
Henriksson, M., Cederberg, C., and Swensson, C. (2014). Carbon footprint and land requirement for dairy herd rations: impacts of feed production practices and regional climate variations. Animal 8, 1329–1338. doi: 10.1017/S1751731114000627
Hub, J. S., and de Groot, B. L. (2008). Mechanism of selectivity in aquaporins and aquaglyceroporins. Proc. Natl. Acad. Sci. U.S.A. 105, 1198–1203.
Iglesias-Suarez, F., Kinnison, D. E., Rap, A., Maycock, A. C., Wild, O., and Young, P. J. (2018). Key drivers of ozone change and its radiative forcing over the 21st century. Atmos. Chem. Phys. 18, 6121–6139. doi: 10.5194/acp-18-6121-2018
Kasmaei, K. M., Rustas, B. O., Spörndly, R., and Udén, P. (2013). Prediction models of silage fermentation products on crop composition under strict anaerobic conditions: a meta-analysis. J. Dairy Sci. 96, 6644–6649. doi: 10.3168/jds.2013-6858
Kleinschmit, D. H., and Kung, L. (2006). A meta-analysis of the effects of Lactobacillus buchneri on the fermentation and aerobic stability of corn and grass and small-grain silages. J. Dairy Sci. 89, 4005–4013. doi: 10.3168/jds.S0022-0302(06)72444-4
Krebs, H. A. (1941). Carbon dioxide assimilation in heterotrophic organisms. Nature 147, 560–563. doi: 10.1038/147560a0
Langston, C. W., and Bouma, C. (1960). A study of the microorganisms from grass silage. I. The Cocci. Appl Microbiol. 8, 212–222. doi: 10.1128/am.8.4.212-222.1960
Lee, M. R. F., McAuliffe, G. A., Tweed, J. K. S., Griffith, B. A., Morgan, S. A., Rivero, M. J., et al. (2021). Nutritional value of suckler beef from temperate pasture systems. Animal 15:100257. doi: 10.1016/j.animal.2021.100257
Li, M., Shan, G., Zhou, H., Buescher, W., Maack, C., Jungbluth, K. H., et al. (2017). CO2 production, dissolution and pressure dynamics during silage production: multi-sensor-based insight into parameter interactions. Sci. Rep. 7:14721. doi: 10.1038/s41598-017-14187-1
Little, S. M., Benchaar, C., Janzen, H. H., Kröbel, R., Mcgeough, E. J., and Beauchemin, K. A. (2017). Demonstrating the effect of forage source on the carbon footprint of a Canadian dairy farm using whole-systems analysis and the Holos model: alfalfa silage vs. corn silage. Climate 5:87. doi: 10.3390/cli5040087
Martin, N., Durlinger, B., Blonk, H., and Mitloehner, F. (2017). Towards the Global Reference for Feed LCA Data: The Global Feed LCA Institute. Available at: https://globalfeedlca.org/wp-content/uploads/2017/03/full-paper-GFLI-food-LCA-2016-final.pdf (Accessed November 21, 2022).
Meldrum, N. U., and Roughton, F. J. W. (1933). Carbonic anhydrase. Its preparation and properties. J Physiol. 80, 113–142.
Meller, R. A., Wenner, B. A., Ashworth, J., Gehman, A. M., Lakritz, J., and Firkins, J. L. (2019). Potential roles of nitrate and live yeast culture in suppressing methane emission and influencing ruminal fermentation, digestibility, and milk production in lactating Jersey cows. J. Dairy Sci. 102, 6144–6156. doi: 10.3168/jds.2018-16008
Michenkova, M., Taki, S., Blosser, M. C., Hwang, H. J., Kowatz, T., Moss, F. J., et al. (2021). Carbon dioxide transport across membranes. Interface Focus 11:20200090. doi: 10.1098/rsfs.2020.0090
Muck, R. E., Nadeau, E. M. G., McAllister, T. A., Contreras-Govea, F. E., Santos, M. C., and Kung, L. (2018). Silage review: recent advances and future uses of silage additives. J. Dairy Sci. 101, 3980–4000. doi: 10.3168/jds.2017-13839
Musa-Aziz, R., Occhipinti, R., and Boron, W. F. (2014). Evidence from simultaneous intracellular-and surface-pH transients that carbonic anhydrase II enhances CO2 fluxes across Xenopus oocyte plasma membranes. Am. J. Physiol. Cell Physiol. 307, C791–C813. doi: 10.1152/ajpcell.00051.2014
Nakhoul, N. L., Davis, B. A., Romero, M. F., and Boron, W. F. (1998). Effect of expressing the water channel aquaporin-1 on the CO2 permeability of Xenopus oocytes. Am. J. Phys. 274, C543–C548. doi: 10.1152/ajpcell.1998.274.2.C543
Pines, D., Ditkovich, J., Mukra, T., Miller, Y., Kiefer, P. M., Daschakraborty, S., et al. (2016). How acidic is carbonic acid? J. Phys. Chem. B 120, 2440–2451. doi: 10.1021/acs.jpcb.5b12428
Pitt, R. E. (1986). Dry matter losses due to oxygen infiltration in silos. J. Agric. Eng. Res. 35, 193–205. doi: 10.1016/S0021-8634(86)80056-7
Porter, M. G., and Murray, R. S. (2001). The volatility of components of grass silage on oven drying and the inter-relationship between dry-matter content estimated by different analytical methods. Grass Forage Sci. 56, 405–411. doi: 10.1046/j.1365-2494.2001.00292.x
Ramaswamy, V., Boucher, O., Haigh, J., Hauglustaine, D., Haywood, J., Myhre, G., et al. (2001). “6. Radiative forcing of climate change” in Climate Change 2001: The Scientific Basis. eds. J. T. Houghton and Y. Ding (Geneva: IPCC)
Robinson, P. H., Swanepoel, N., Heguy, J. M., Price, T., and Meyer, D. M. (2016). Shrink losses in commercially sized corn silage piles: quantifying total losses and where they occur. Sci. Total Environ. 542, 530–539. doi: 10.1016/j.scitotenv.2015.10.090
Rota, C., Pirondini, M., Malagutti, L., and Rapetti, L. (2012). Evaluation of Fermentative Parameters, Aerobic Stability and In vitro Gas Production of Whole Crop Maize Silage Treated with a Microbial Inoculant Containing Pediococcus pentosaceus and Lactobacillus plantarum. Proceedings of International Silage Conference XVI. Hameenlinna, Finland. p. 212
Rotz, C. A., Isenberg, B. J., Stackhouse-Lawson, K. R., and Pollak, E. J. (2013). A simulation-based approach for evaluating and comparing the environmental footprints of beef production systems. J. Anim. Sci. 91, 5427–5437. doi: 10.2527/jas.2013-6506
Ruxton, I. B., and Mcdonald, P. (1973). The influence of oxygen on ensilage. 1. Laboratory studies. J. Sci. Food Agric. 25, 107–115.
Seemann, T. (2014). Prokka: rapid prokaryotic genome annotation. Bioinformatics 30, 2068–2069. doi: 10.1093/bioinformatics/btu153
Smith, K. S., and Ferry, J. G. (1999). A plant-type (beta-class) carbonic anhydrase in the thermophilic methanoarchaeon Methanobacterium thermoautotrophicum. J. Bacteriol. 181, 6247–6253. doi: 10.1128/JB.181.20.6247-6253.1999
Smith, K. S., and Ferry, J. G. (2000). Prokaryotic carbonic anhydrases. FEMS Microbiol. Rev. 24, 335–366.
Smith, K. S., Jakubzick, C., Whittam, T. S., and Ferry, J. G. (1999). Carbonic anhydrase is an ancient enzyme widespread in prokaryotes. Proc. Natl. Acad. Sci. U. S. A. 96, 15184–15189. doi: 10.1073/pnas.96.26.15184
Stadie, W. C., and O’Brien, H. (1933). The catalysis of the hydration of carbon dioxide and dehydration of carbonic acid by an enzyme isolated from red blood cells. J. Biol. Chem. 103, 521–529. doi: 10.1016/S0021-9258(18)75831-6
Tabacco, E., Righi, F., Quarantelli, A., and Borreani, G. (2011). Dry matter and nutritional losses during aerobic deterioration of corn and sorghum silages as influenced by different lactic acid bacteria inocula. J. Dairy Sci. 94, 1409–1419. doi: 10.3168/jds.2010-3538
Tossell, J. A. (2005). Boric acid, carbonic acid, and N-containing oxyacids in aqueous solution: Ab initio studies of structure, pKa, NMR shifts, and isotopic fractionations. Geochim. Cosmochim. Acta 69, 5647–5658. doi: 10.1016/j.gca.2005.08.004
Veitch, F. P., and Blankenship, L. C. (1963). Carbonic anhydrase in bacteria. Nature 197, 76–77. doi: 10.1038/197076a0
Wang, Y., Wu, J., Lv, M., Shao, Z., Hungwe, M., Wang, J., et al. (2021). Metabolism characteristics of lactic acid bacteria and the expanding applications in food industry. Front. Bioeng. Biotechnol. 9:378. doi: 10.3389/fbioe.2021.612285
Wilkinson, J. M., and Fenlon, J. S. (2014). A meta-analysis comparing standard polyethylene and oxygen barrier film in terms of losses during storage and aerobic stability of silage. Grass Forage Sci. 69, 385–392. doi: 10.1111/gfs.12087
Wilkinson, J. M., and Rinne, M. (2018). Highlights of progress in silage conservation and future perspectives. Grass Forage Sci. 73, 40–52. doi: 10.1111/gfs.12327
Zheng, J., Wittouck, S., Salvetti, E., Franz, C. M., Harris, H. M., Mattarelli, P., et al. (2020). A taxonomic note on the genus lactobacillus: description of 23 novel genera, emended description of the genus lactobacillus Beijerinck 1901, and union of Lactobacillaceae and Leuconostocaceae. Int. J. Syst. Evol. Microbiol. 70, 2782–2858. doi: 10.1099/ijsem.0.004107
Keywords: silage, greenhouse gases, fermentation, carbon dioxide equivalent emissions, sustainability, carbonic anhydrase, lactic acid bacteria
Citation: Krueger LA, Koester LR, Jones DF and Spangler DA (2023) Carbon dioxide equivalent emissions from corn silage fermentation. Front. Microbiol. 13:1092315. doi: 10.3389/fmicb.2022.1092315
Edited by:
Siran Wang, Nanjing Agricultural University, ChinaCopyright © 2023 Krueger, Koester, Jones and Spangler. This is an open-access article distributed under the terms of the Creative Commons Attribution License (CC BY). The use, distribution or reproduction in other forums is permitted, provided the original author(s) and the copyright owner(s) are credited and that the original publication in this journal is cited, in accordance with accepted academic practice. No use, distribution or reproduction is permitted which does not comply with these terms.
*Correspondence: Lucas A. Krueger, THVjYXMuS3J1ZWdlckBhZ3Jpa2luZy5jb20=
†These authors have contributed equally to this work and share senior authorship
Disclaimer: All claims expressed in this article are solely those of the authors and do not necessarily represent those of their affiliated organizations, or those of the publisher, the editors and the reviewers. Any product that may be evaluated in this article or claim that may be made by its manufacturer is not guaranteed or endorsed by the publisher.
Research integrity at Frontiers
Learn more about the work of our research integrity team to safeguard the quality of each article we publish.