 Zheng Bian1
 Junhua Jin
 Yanling Hao
 Linshu Jiang
 Yuanhong Xie
94% of researchers rate our articles as excellent or good
Learn more about the work of our research integrity team to safeguard the quality of each article we publish.
Find out more
ORIGINAL RESEARCH article
Front. Microbiol., 24 November 2022
Sec. Food Microbiology
Volume 13 - 2022 | https://doi.org/10.3389/fmicb.2022.1071351
Introduction: Plantaricin BM-1 is a class IIa bacteriocin produced by Lactobacillus plantarum BM-1 that exerts significant antibacterial activity against many foodborne bacteria. Studies have shown that class IIa bacteriocins inhibit Gram-positive bacteria via the mannose phosphotransferase system; however, their mechanism of action against Gram-negative bacteria remains unknown. In this study, we explored the mechanism through which the Rcs phosphorelay affects the sensitivity of Escherichia coli K12 cells to plantaricin BM-1.
Methods and Results: The minimum inhibitory concentrations of plantaricin BM-1 against E. coli K12, E. coli JW5917 (rcsC mutant), E. coli JW2204 (rcsD mutant), and E. coli JW2205 (rcsB mutant) were 1.25, 0.59, 1.31, and 1.22 mg/ml, respectively. Growth curves showed that E. coli JW5917 sensitivity to plantaricin BM-1 increased to the same level as that of E. coli K12 after complementation. Meanwhile, scanning electron microscopy and transmission electron microscopy revealed that, under the action of plantaricin BM-1, the appearance of E. coli JW5917 cells did not significantly differ from that of E. coli K12 cells; however, cell contents were significantly reduced and plasmolysis and shrinkage were observed at both ends. Crystal violet staining and laser scanning confocal microscopy showed that biofilm formation was significantly reduced after rcsC mutation, while proteomic analysis identified 382 upregulated and 260 downregulated proteins in E. coli JW5917. In particular, rcsC mutation was found to affect the expression of proteins related to biofilm formation, with growth curve assays showing that the deletion of these proteins increased E. coli sensitivity to plantaricin BM-1.
Discussion: Consequently, we speculated that the Rcs phosphorelay may regulate the sensitivity of E. coli to plantaricin BM-1 by affecting biofilm formation. This finding of class IIa bacteriocin against Gram-negative bacteria mechanism provides new insights.
Bacteriocins are a class of peptides or proteins that are synthesized by ribosomes and usually exert bactericidal activity against species which are closely related to the producer bacterium (Klaenhammer, 1988; Simons et al., 2020). In recent years, an increasing number of bacteriocins have been used for food production and storage, and several bacteriocins from lactic acid bacteria (LAB) have shown good bacteriostatic activity against foodborne bacteria (Zhang et al., 2022). Pediocin PA-1 is a bacteriocin produced by LAB that exhibits extremely strong bacteriostatic activity against Listeria monocytogenes and is considered to be a natural food biological preservative due to its high bacteriostatic activity and low toxicity (Rodriguez et al., 2002).
Known bacteriocins can be divided into three main categories according to their heat resistance and size: class I, class II, and class III (Alvarez-Sieiro et al., 2016). Class II bacteriocins are small, thermostable, non-modified, and less than 10 kDa in size. Class IIa bacteriocins are broad-spectrum antibacterial agents of 36–49 amino acids in length that are particularly effective against L. monocytogenes and typically consist of two domains (Fregeau Gallagher et al., 1997). The first domain contains a highly conserved cationic N-terminal region of cations, with the amino acid sequence, YGNGV/L, whereas the second domain includes the poorly conserved C-terminal region with a hairpin or functionally equivalent helix-hinge-helix structures (Kjos et al., 2011). Previous studies have suggested that the class IIa bacteriocins target receptor in Gram-positive bacteria is the sugar transporter mannose phosphotransferase system (Man-PTS), which is comprised four components: IIA, IIB, IIC, and IID. Studies have demonstrated that only the IIC and IID membrane localization components are required for bacteriocin sensitivity (Diep et al., 2007). However, it has also been reported that class IIa bacteriocins do not target Man-PTS in Gram-negative bacteria. Therefore, the role of class IIa bacteriocin in Gram-negative bacteria mechanism requires further exploration.
Two-component systems (TCS) is versatile transmembrane signaling solutions that typically consist of a membrane-embedded sensor histidine kinase (HK) and a cytoplasmic response regulator (RR; Delhaye et al., 2019). The sensor HK responds to environmental signals and converts external stimuli into adaptive signals through the autophosphorylation of conserved histidine residues. The phosphate group bound by the HK histidine residue is subsequently transferred to a specific aspartate residue on the cognate RR for activation via a phosphotransfer reaction during which unphosphorylated HK acts as a phosphatase by removing phosphoryl groups from RR, thus maintaining a balance between active and inactive states (West and Stock, 2001; Logre et al., 2020). The His-Asp-His-Asp phosphorelay is a more complicated version of two-component (West and Stock, 2001). Unlike a typical HK-RR two-component system, the Rcs phosphorelay has three core components: RcsC (HK), RcsB (RR), and RcsD (an intermediate inner membrane phosphorelay protein; Cho et al., 2014). The Rcs phosphorelay controls the expression of several genes, including periplasmic quality control, biofilm formation, toxicity, and motility (Majdalani and Gottesman, 2005; Clarke, 2010), and has been reported to protect Escherichia coli from TseH toxicity by regulating mechanisms such as capsular synthesis (Hersch et al., 2020).
Lactobacillus plantarum BM-1 isolated from traditionally fermented Chinese meat products can produce plantaricin BM-1, a novel class IIa bacteriocin that exerts significant bacteriostatic activity against many foodborne bacteria (Zhang et al., 2013). Previously, we found that the loss of the BasS/BasR TCS affects the sensitivity of E. coli K12 to plantaricin BM-1 and this loss affects the PhoQ-PhoP, BasS-BasR, and Rcs phosphorelay regulatory networks (Liu et al., 2022). However, the effects of Rcs phosphorelay in the sensitivity of E. coli to bacteriocins remain unknown. Here, we investigated the regulatory role of the Rcs phosphorelay in the sensitivity of E. coli to plantaricin BM-1.
Plantaricin BM-1 was prepared as described previously (Zhang et al., 2013). Lactobacillus plantarum BM-1 was cultured in de Man, Rogosa, and Sharpe (MRS) broth at 37°C for 12 h. The supernatant was collected by centrifugation (4°C, 10,000 rpm) and stirred overnight at 4°C for ammonium sulfate precipitation. After the precipitate had been solubilized, plantaricin BM-1 was purified using dialysis, desalting, and cation exchange before being freeze-dried. The freeze-dried powder was redissolved in 0.22 μm filtration membrane and stored at −80°C.
The bacterial strains used in this study are listed in Table 1. Escherichia coli strains and L. plantarum BM-1 were cultured at 37°C with aeration at 180 rpm, Luria-Bertani (LB) broth and MRS broth were used, respectively.
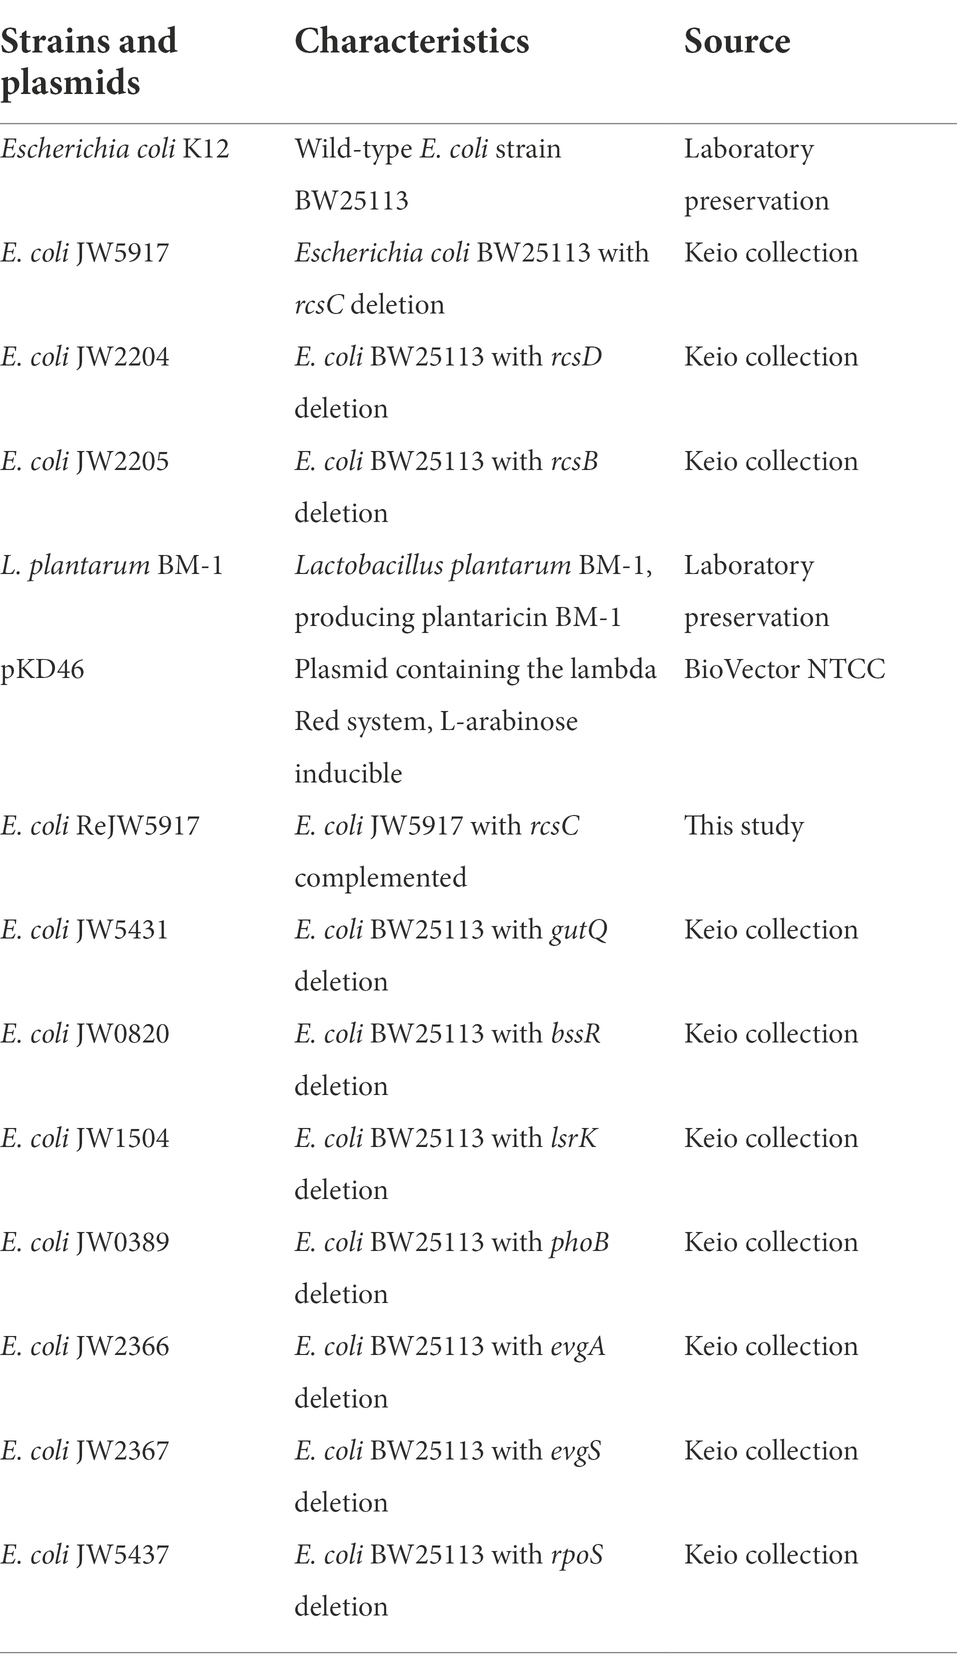
Table 1. Strains used in this study.
Minimal inhibitory concentration (MIC) values were determined as described previously, with some modifications (Chen et al., 2021). Briefly, E. coli K12 was pre-cultured in LB broth for 12 h until log phase, diluted to 104 CFU/ml, and added to 96-well plates at 100 μl per well. Plantaricin BM-1 was quantified using a NanoDrop 2000 (Thermo Fisher Scientific, Shanghai, China), diluted two-fold, and added to a 96-well plate containing 100 μl of E. coli K12 per well. After mixing, the 96-well plate was incubated at 37°C for 12 h and the optical density (OD) at 600 nm (OD600) was measured using an enzyme-linked immunosorbent assay (ELISA) plate reader (ELX808, BioTek, VT, United States). The lowest concentration of plantaricin BM-1 able to inhibit the growth of E. coli K12, JW5917, JW2204, and JW2205 (i.e., no increase in OD600) was recorded as the MIC. Each experiment was performed in triplicate.
Complementary rcsC mutants of E. coli JW5917 were performed according to the method of Juhas and Ajioka (2016). Briefly, pKD46 plasmids were transformed into competent E. coli JW5917 using 0.1 mol/ml cold CaCl2 and homologous recombinase expression was induced by incubation with 0.50 mg/ml L-arabinose in LB broth at 30°C. The following primers were used to amplify rcsC gene fragment from E. coli K12: rcsC-F (5′-3′) TGA GGC GGA GCT TCG CCC CTG TTA GTG CTC TGG CTG TTG and rcsC-R (5′-3′) CGC ATT TGC GGA ATA GGC AGA ATC TGC GAT GAT GAA GC (homology underlined). After transfection into competent E. coli JW5917 cells, the cells were incubated in 900 μl of LB broth at 37°C for 2 h, diluted with saline, plated on LB agar, and incubated at 37°C for 12 h. Single recombinant ReJW5917 colonies were verified using rcsC-F/R primers.
Wild-type E. coli K12, JW5917, JW2204, JW2205, and ReJW5917 (3.00 log10 CFU/mL) were cultured in LB broth with or without plantaricin BM-1 (2× MIC of E. coli K12) at 37°C for 12 h. Bacterial suspensions were collected every 2 h, cells were performed using plate colony counting method (Masuda and Tomioka, 1978), and the average results of the three experiments were plotted. All experiments consisted of three replications.
Wild-type E. coli K12 and JW5917 (3.00 log10 CFU/mL) were cultured in LB broth at 37°C for 12 h with or without plantaricin BM-1 (2× MIC of E. coli K12). The sample processing method has been modified based on the method of Luo et al. (2021). The bacterial suspension was then centrifuged at 6,000 ×g for 10 min. After the supernatant was removed, the cells were cleaned three times with 0.10 M phosphate-buffered brine (PBS) buffer (pH 7.2) to remove the residual BM-1, fixation solution (2.50% glutaraldehyde) was added, and the cells were fixed overnight. After washing with PBS for 4 times within 20 min, the cells were gradually dehydrated with different concentrations of ethanol, and then replaced in replacement solution (100% acetone) for 20 min. Then washed with 100% tert-butanol for 3 times and freeze-dried for 2 h. Finally, the cells were electrically treated and sprayed with 80 nm gold powder, and imaged using Scanning electron microscopy (SEM; SU8100, Hitachi, Japan).
Prior to Transmission electron microscopy (TEM), cell strains were pretreated using the same methods as for SEM. Cell samples embedded in white resin capsules were then cut into ultra-thin slices (50–90 nm). The sections were then fixed on copper mesh and stained with lead citrate and uranyl acetate, respectively. After drying, the sections were observed by TEM HT7800 (Hitachi, Japan).
To determine the regulatory mechanism of rcsC mutants on plantaricin BM-1 and biofilm formation, the experimental method of crystal violet staining is modified on the experimental method of Luo et al. (2021). E. coli K12, JW5917, and ReJW5917 were grown to log phase in LB broth, cells were centrifuged at 4,000 ×g for 15 min at 4°C and serially diluted to 3.00 log10 CFU/ml. A 100 μl aliquot of the bacterial suspension was added to a 96-well plate with fresh LB broth as a negative control. After incubation at 37°C for 24 h, the unadsorbed E. coli was discarded and the 96-well plates were rinsed with PBS for 3 times. Next, 200 μl of methanol solution was added to each well to fix the biofilm for 15 min at room temperature and the methanol was carefully aspirated. After the plate had been dried at room temperature, added 200 μl of 0.1% crystal violet and incubated for 15 min at room temperature, then excess crystal violet was removed by washing the cells with PBS. After the plate had been dried at room temperature, added 200 μl aliquot of 33% glacial acetic acid and incubated at 37°C for 30 min. The absorbance at 590 nm was measured using an ELISA plate reader (ELX808, BioTek, VT, United States). The experiments were repeated three times, with five replicates per group.
To verify the results of the crystal violet experiments and confirm the effects of RcsC mutation on biofilm formation, Laser scanning confocal microscopy (LSCM) experiments were performed. E. coli K12, JW5917, and ReJW5917 were grown to log phase in LB broth and serially diluted to 3.00 log10 CFU/ml. After the strains had been cultured in LB broth for 24 h on confocal dishes, they were gently washed with PBS three times and stained with 4′,6-diamidino-2-phenylindole (DAPI) at a final concentration of 0.20 μg/ml. Excess dye was removed by washing with PBS after shaking at room temperature for 30 min. Cells were observed using a LSM880 Airyscan (Carl Zeiss, Oberkochen, Germany).
To screen for differentially expressed proteins between wild-type E. coli K12 and mutant strains, quantitative proteomic analysis was performed using a 4D label-free. E. coli K12 and E. coli JW5917 (3.00 log10 CFU/ml) were incubated in LB broth at 37°C for 12 h without plantaricin BM-1. After centrifuge, bacterial samples were collected and frozen in liquid nitrogen. The samples were placed on ice in the frozen state and treated with protein cracking buffer (8 M urea, 1% sodium dodecyl sulfate, protease inhibitor). The supernatant of the protein was obtained by ultrasound on the ice for 2 min, cracking for 30 min, and centrifugation for 30 min at 12,000 ×g. The concentration of the extracted protein was determined using the Pierce BCA protein assay kit (No.23225, Thermo Fisher Scientific, MA, United States) and verified using Sodium dodecyl sulfate-polyacrylamide gel electrophoresis (SDS-PAGE). Iodoacetamide was used for reductive alkylation of protein samples that met the standard, and an equal amount of protein was taken from each sample for Trypsin/P trypsin digestion. Each sample was separated using a ultra-performance liquid chromatography (UPLC) NanoElute system (Bruker Corporation, MA, United States) with a nanoliter flow rate of buffer A (0.10% formic acid aqueous solution) and buffer B (0.10% formate acetonitrile solution). Nanoscale high-performance liquid chromatography (HPLC)-separated samples were subjected to data-dependent acquisition (DDA) mass spectrometry using a timsTOF Pro mass spectrometer (Bruker Corporation). Three biological replicates were used per sample. Liquid chromatography–tandem mass spectrometry data were matched using MaxQuant 2.0.3.1 software and the UniProt-taxonomy E. coli (strain K12) [83333] unique.fasta database with the results filtering parameter was Peptide FDR ≤ 0.01. Only contains at least one unique peptide protein were quantified. Differentially expressed proteins were identified based on a fold change of >1.20 or <0.83 between treatments and p < 0.05. Gene ontology (GO) and Kyoto Encyclopedia of Genes and Genomes (KEGG) pathway enrichment analyses were used to identify the functional subclasses and metabolic pathways related to the differentially expressed proteins.
Escherichia coli JW5431, JW0820, JW1504, JW0389, JW5689, JW0665, and JW5437 strains with an initial concentration of 3.00 log10 CFU/ml were grown in LB broth at 37°C for 12 h with or without plantaricin BM-1 (2 × MIC for E. coli K12). Bacterial suspensions were collected every 2 h, cells were performed using plate colony counting method, and the average results of the three experiments were plotted. All experiments consisted of three replications.
The statistical analysis method was consistent with that used in previous studies of our laboratory. All experiments were performed in triplicate, data were presented as the mean ± SD, and the analysis of variance was used to compare viable cell counts between the growth curves of E. coli treated with and without plantaricin BM-1 at a significance level of 0.05 (Liu et al., 2022).
We determined the MIC of plantaricin BM-1 in different E. coli strains by culturing the strains with different concentrations of plantaricin BM-1 at 37°C for 12 h and measuring the OD600. The MIC values of plantaricin BM-1 against E. coli K12, JW5917, JW2204, and JW2205 were 1.25, 0.59, 1.31, and 1.22 mg/ml, respectively. We found that E. coli JW5917 (rcsC mutant) were significantly less sensitive to plantaricin BM-1 than wild-type E. coli.
To construct an rcsC-complementary E. coli JW5917 strain, a 3,076 bp rcsC gene fragment was amplified from the E. coli K12 genome using PCR with the rcsC-F/R primer pair and then the kanamycin resistance gene in E. coli JW5917 was replaced by red homologous recombination. Successful complementation was confirmed through PCR analysis of genomic DNA extracted from E. coli K12, E. coli JW5917, and the complementary E. coli ReJW5917 strain using rcsC-F/R primers. A 3,076 bp product was amplified from both E. coli K12 and the complementary ReJW5917 strain, but no amplified band was detected in E. coli JW5917 (Figure 1). Sequencing results revealed that the same rcsC gene fragment was amplified from E. coli ReJW5917 and E. coli K12, proving that E. coli ReJW5917 had been constructed successfully.
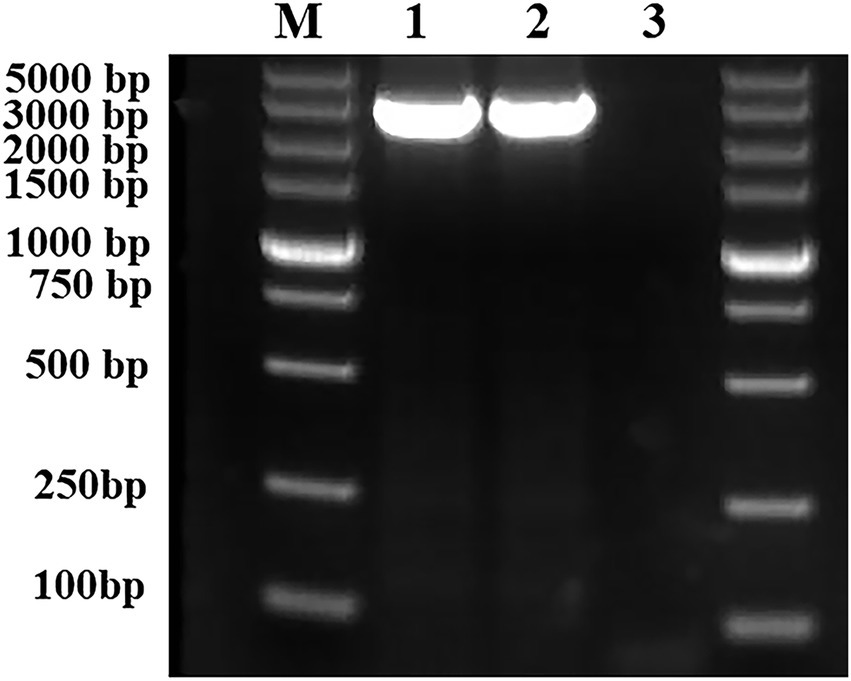
Figure 1. Validation of the structure of Escherichia coli ReJW5917. PCR products were detected using 2% agarose gel electrophoresis. Lane M represents the 5,000 bp DNA marker. Lane 1 contains the PCR product from E. coli K12. Lane 2 contains the PCR product from E. coli ReJW5917. Lane 3 contains the PCR product from E. coli JW5917.
To determine the effect of plantaricin BM-1 on E. coli K12, JW5917, JW2204, JW2205, and ReJW5917 strains growth, growth curves were measured with and without plantaricin BM-1 treatment (Figure 2). No significant differences in growth rate were observed for E. coli K12, JW5917, JW2204, and JW2205, which reached similar growth levels of 9.36, 9.38, 9.30, and 9.19 log10 CFU/ml, respectively, within 12 h. After plantaricin BM-1 was treated, all strains showed slow growth, and the number of viable bacteria decreased at 12 h. The viable count of wild-type E. coli K12 at 12 h was 7.88 log10 CFU/ml, indicating relatively low sensitivity to plantaricin BM-1. Although E. coli JW5917 and K12 had the same growth rates at 0–2 h, E. coli JW5917 had a significantly lower growth rate after 2 h and the number of viable bacteria after 12 h was only 6.33 log10 CFU/ml, which was significantly lower than that of E. coli K12 (p < 0.05), indicating relatively high sensitivity to plantaricin BM-1. E. coli JW2204 and JW2205 had slightly lower growth rates than E. coli K12, but their viable counts at 12 h did not differ significantly compared to E. coli K12 (7.46 and 7.48 log10 CFU/ml, respectively). The growth curves of E. coli ReJW5917 and E. coli K12 were closely resembled, indicating that their susceptibility had recovered to the same level as wild-type strains. Together, these findings indicate that only the RcsC mutation in the Rcs phosphorelay affects the sensitivity of E. coli to plantaricin BM-1.
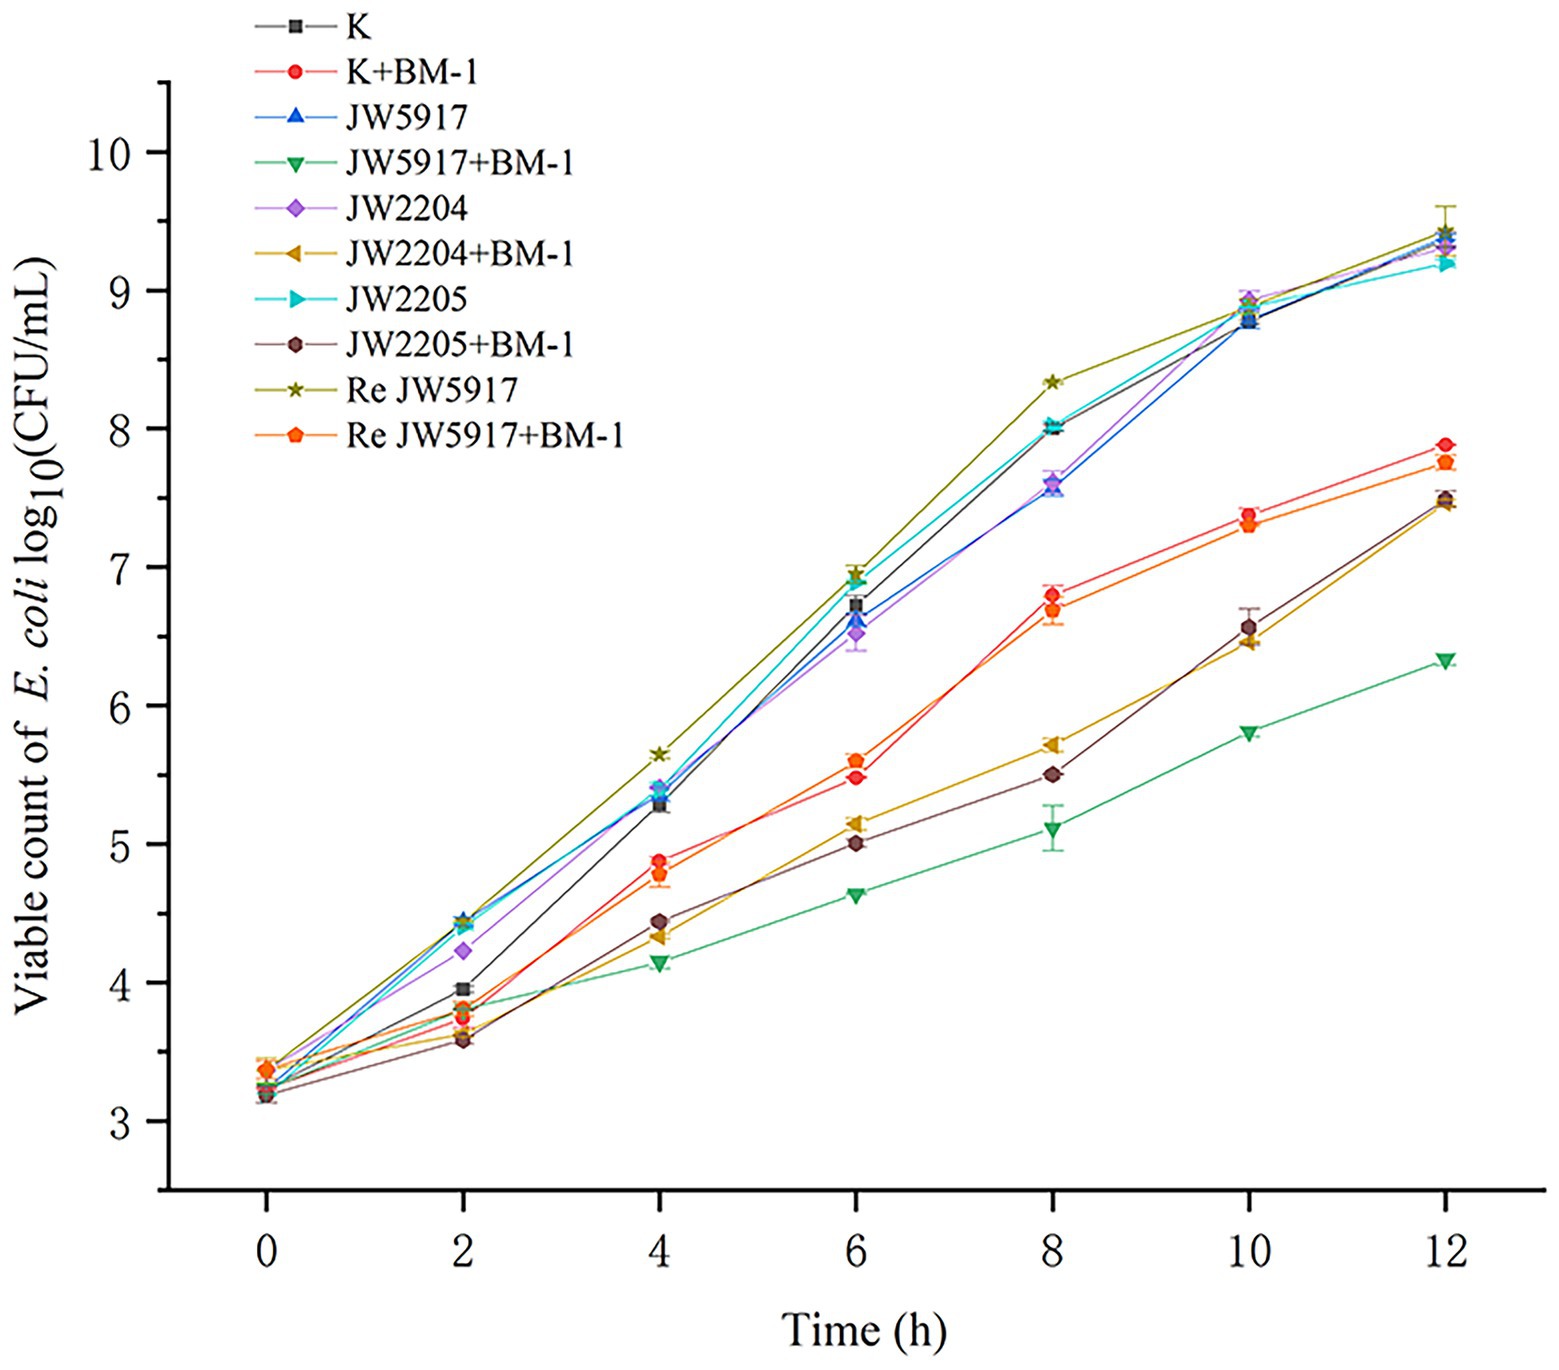
Figure 2. Effects of plantaricin BM-1 on the growth of wild-type E. coli K12 and mutant E. coli JW5917, JW2204, JW2205, and ReJW5917 (p < 0.05).
The morphological changes of E. coli K12 and JW5917 before and after treatment with plantaricin BM-1 were observed by SEM (Figure 3) and TEM (Figure 4). In the absence of plantaricin BM-1, SEM revealed no significant differences in morphology between E. coli JW5917 and K12, which both had short, rod-shaped cells with smooth surfaces (Figures 3A,B). After treatment with plantaricin BM-1, both E. coli JW5917 and K12 showed some small changes, with individual cells becoming more folded and concave at both ends, but with no significant difference in cell morphology between the two strains (Figures 3C,D). TEM showed that in the absence of plantaricin BM-1, E. coli K12 cells were uniform and full, whereas E. coli JW5917 cell content was slightly decreased (Figures 4A,B). After plantaricin BM-1 was treated, the content of E. coli K12 cells did not change significantly, but individual cells showed slight shrinkage at both ends, whereas the content of E. coli JW5917 cells was significantly reduced and cells displayed obvious plasmolysis and shrinkage at both ends (Figures 4C,D). Therefore, the deletion of rcsC gene can reduce the resistance of E. coli K12 to plantaricin BM-1.
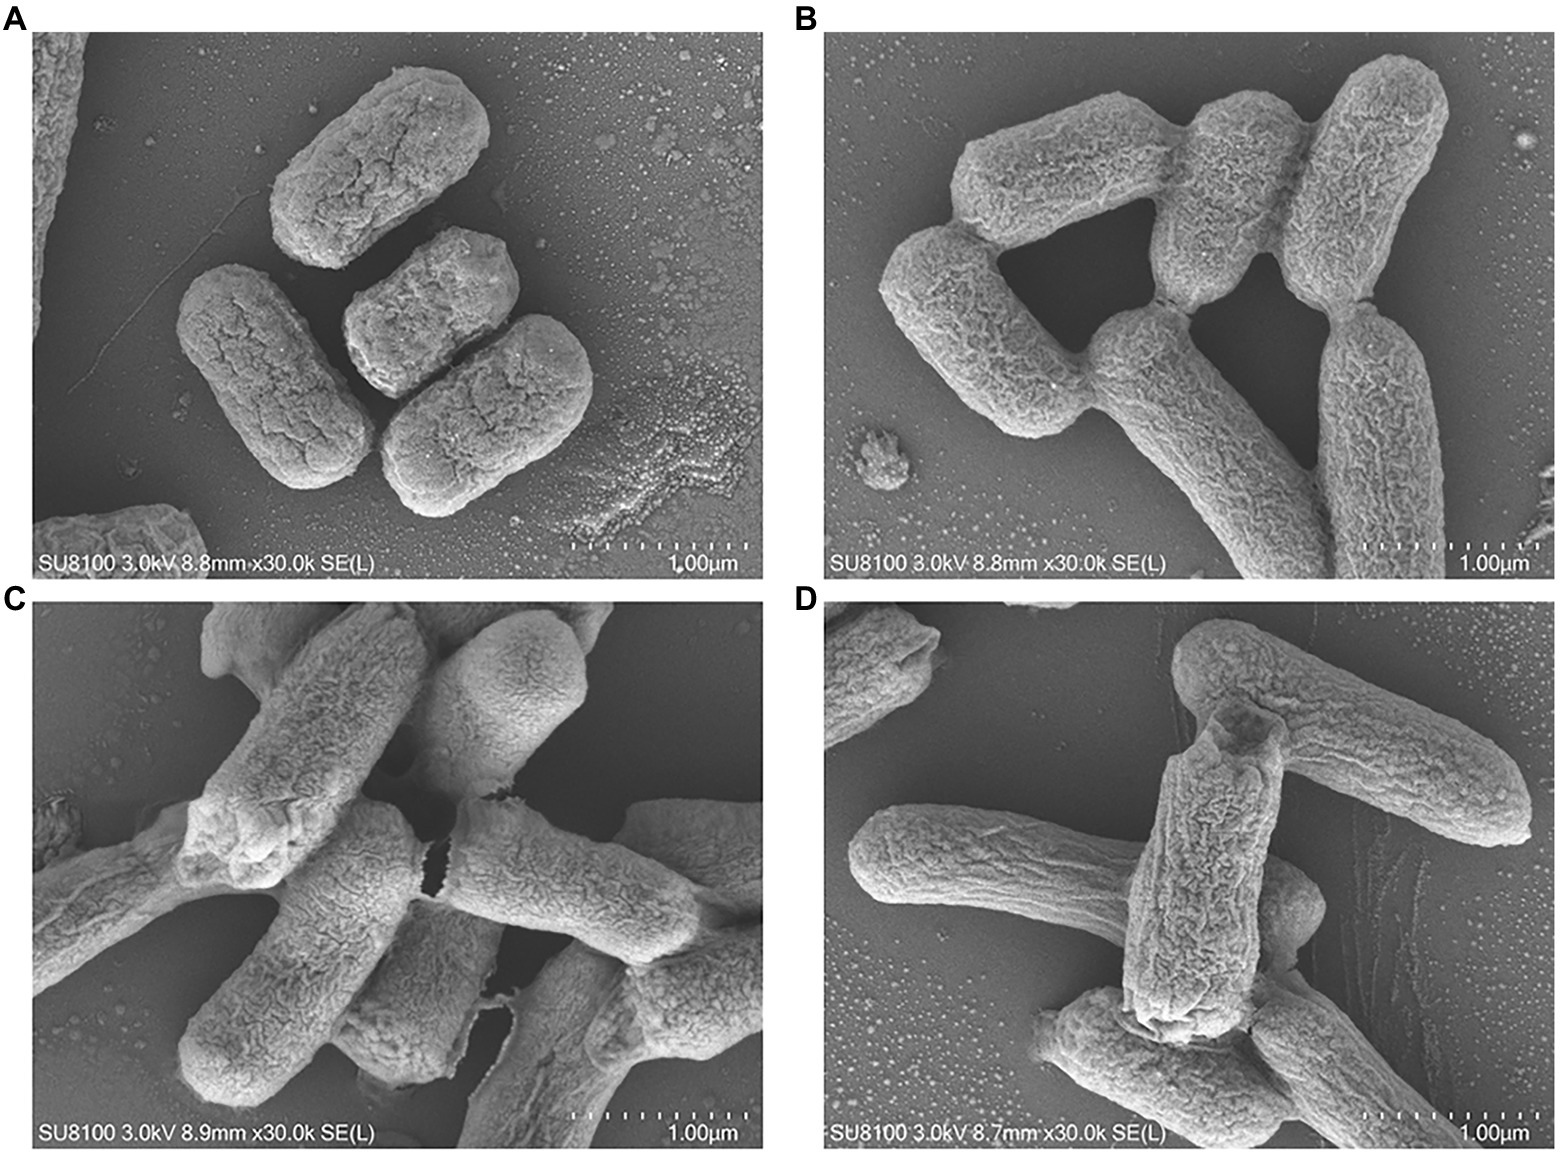
Figure 3. SEM images of Escherichia coli K12 and JW5917 strains treated with (C,D) and without (A,B) plantaricin BM-1 (magnification: 30,000×).
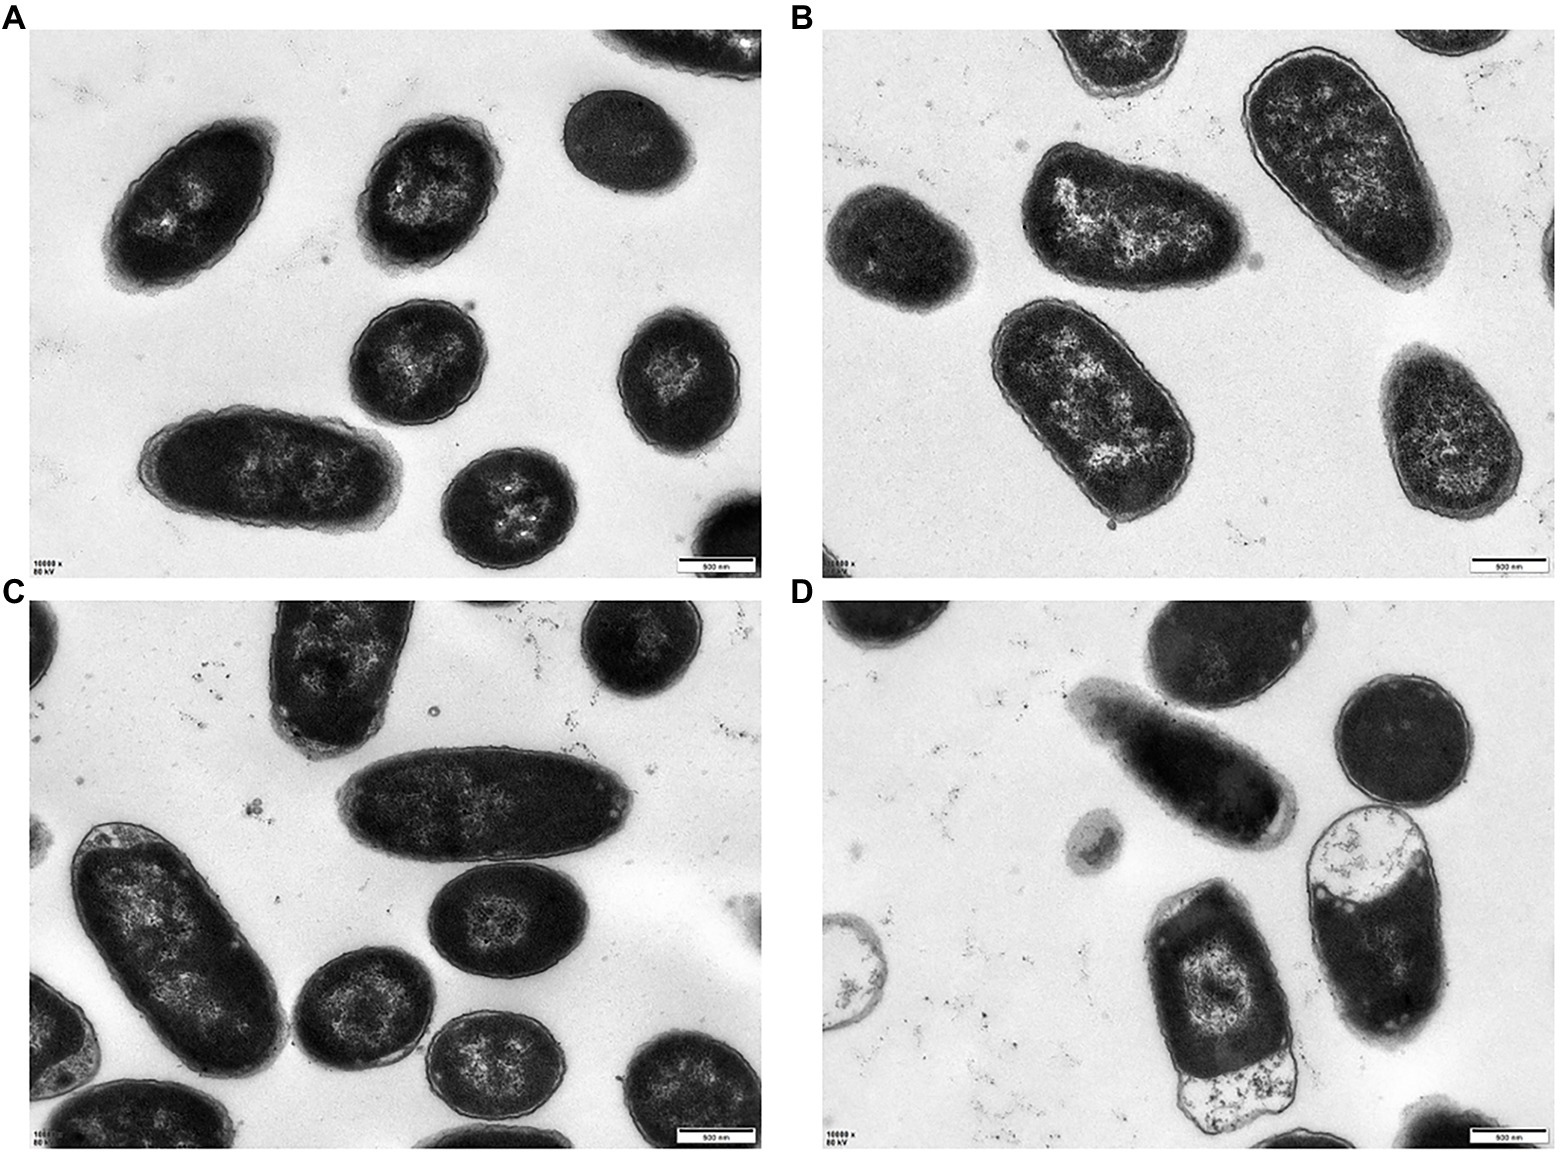
Figure 4. TEM images of Escherichia coli K12 and JW5917 treated with (C,D) and without (A,B) plantaricin BM-1 (magnification: 10,000×).
To evaluate the effect of the rcsC mutant on E. coli biofilm formation, we performed crystal violet staining. As shown in Figure 5, biofilm formation was significantly reduced in E. coli JW5917 by over 50%, whereas biofilm formation in E. coli ReJW5917 recovered to the same level as in E. coli K12. These findings were confirmed using LSCM (Figure 6), which verified that the biofilm content of E. coli JW5917 was significantly lower than that of E. coli K12 and ReJW5917.
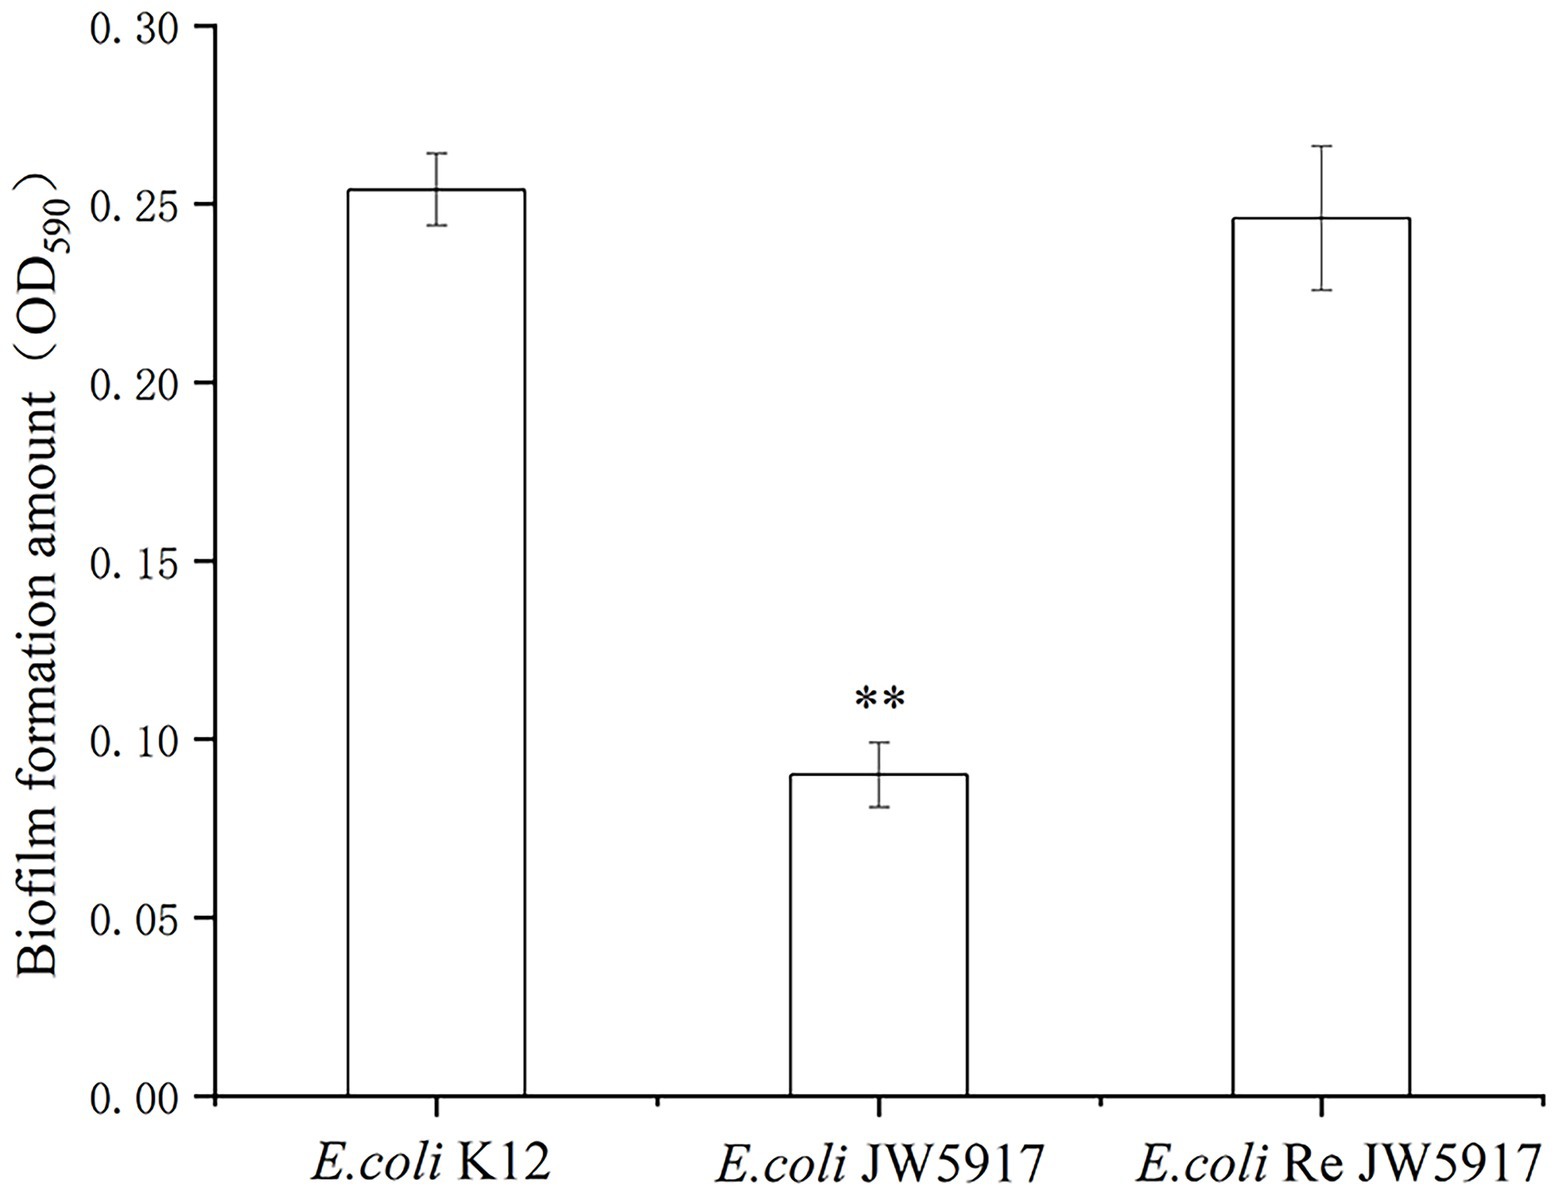
Figure 5. Escherichia coli K12, E. coli JW5917, and E. coli ReJW5917 biofilm formation. Biofilm formation detected by absorbance at 590 nm using crystal violet staining. **, significance at p ≤ 0.01.
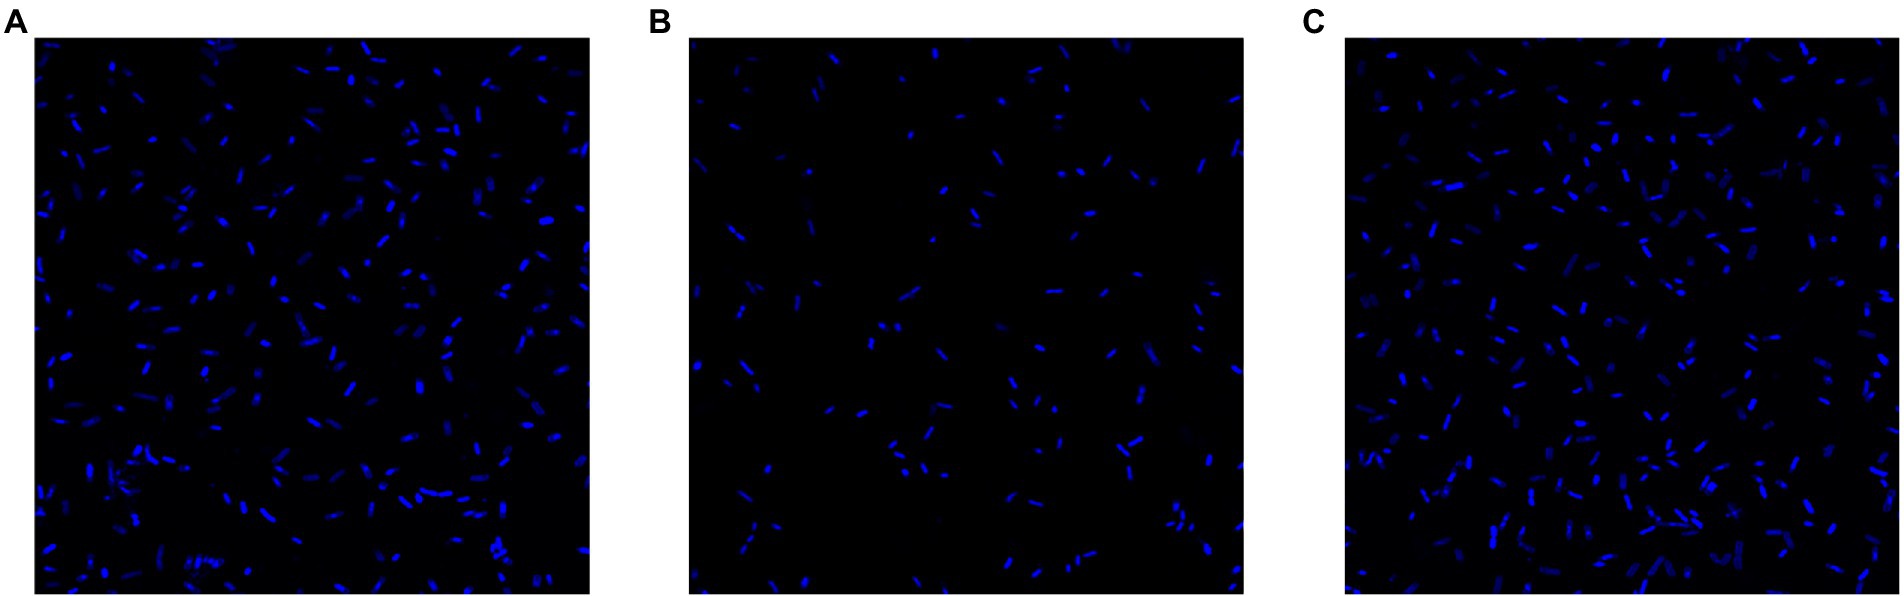
Figure 6. LSCM of Escherichia coli K12, E. coli JW5917, and E. coli ReJW5917. (A–C) represent E. coli K12, E. coli JW5917, and E. coli ReJW5917, respectively.
To determine the potential mechanisms through which rcsC deletion affects plantaricin BM-1 sensitivity in E. coli, we detected differentially expressed proteins in different strains. When the changed protein expression fold was 1.20, 2,260 differential proteins were identified (p < 0.05, Figure 7). The expression of 642 proteins was altered between E. coli JW5917 and K12, including 382 upregulated and 260 downregulated proteins (p < 0.05). Subcellular localization analysis of differentially expressed proteins revealed that 94.03% were located in the cytoplasm, with plasma membrane proteins accounting for just 5.13% of all differentially expressed proteins, and extracellular proteins accounting for just 0.84%.
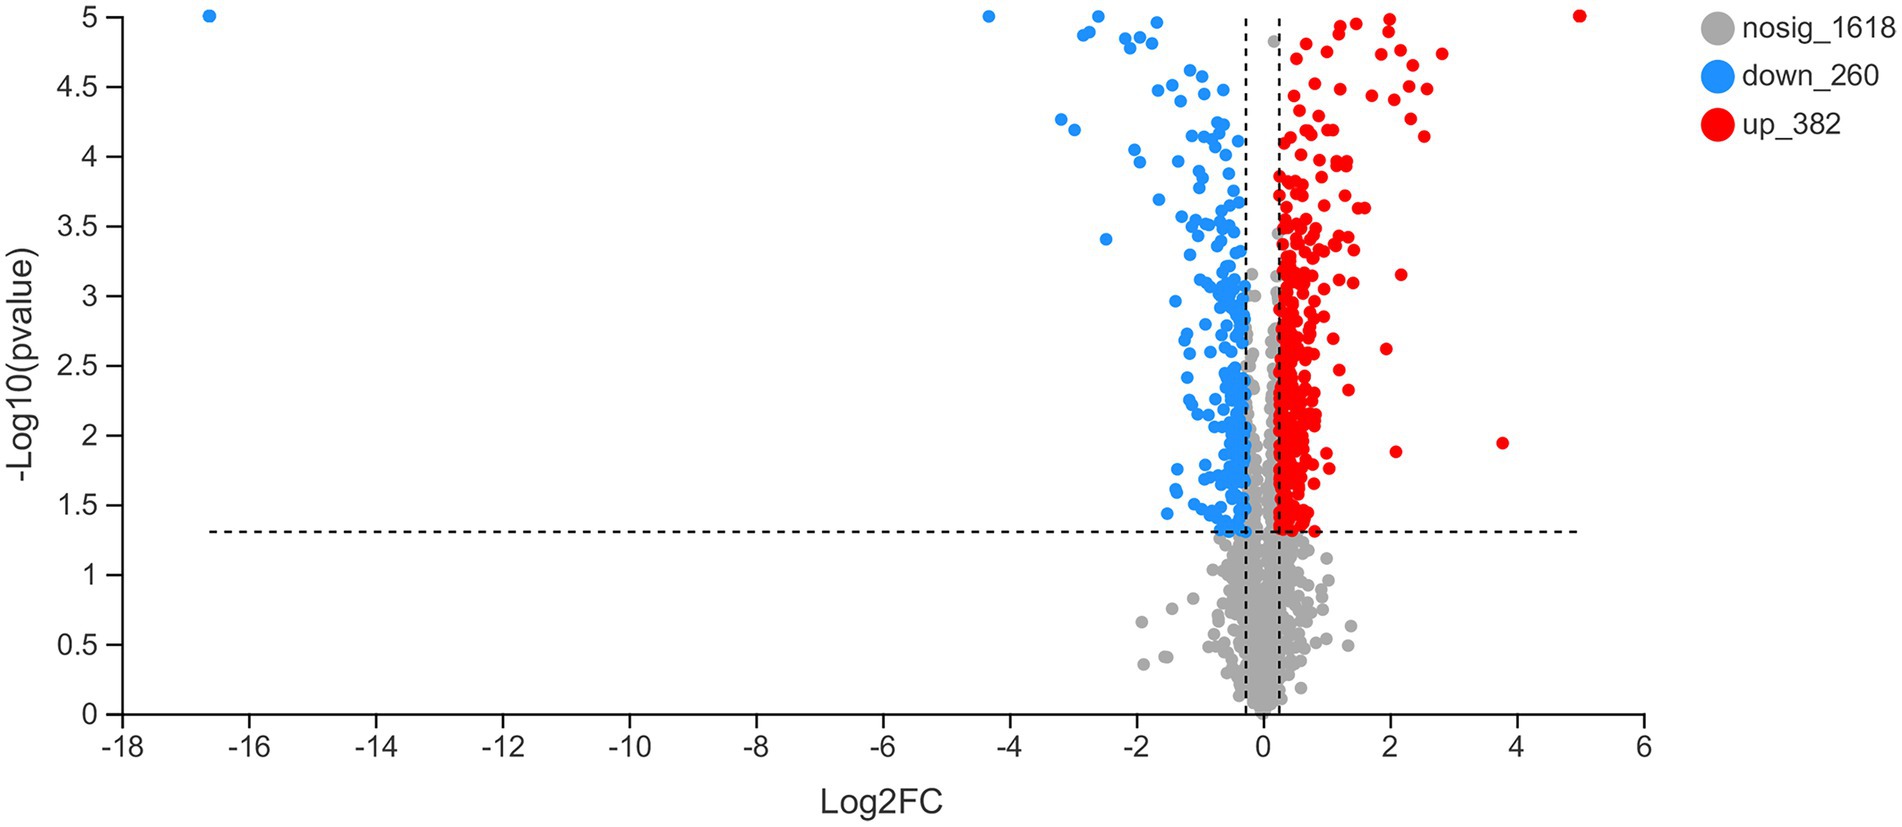
Figure 7. Changes in the proteome of Escherichia coli K12 following RcsC deletion. Volcano plots of the 2,260 identified proteins are shown. Red dots represent proteins with fold change values > 1.20. Blue dots represent proteins with fold change values < 0.83 (p < 0.05).
GO functional annotation statistics for differential proteins clarifies the biological processes, cellular components, and molecular functions that proteins are involved in at the functional level. GO functional annotation of the differentially expressed proteins revealed that 539 were labeled as biological processes (BP), among which 82.56% were related to cellular processes and 69.39% were related to metabolic processes (Table 2). In particular, these differentially expressed proteins were significantly enriched for metabolic processes (GO:0008152), cellular processes (GO:0009987), responses to stimuli (GO:0050896), biological regulation (GO:0065007), and localization (GO:0051179). In terms of cellular components (CC), proteins were significantly enriched for protein-containing complexes (GO:0032991) and cellular anatomical entities (GO:0110165). Proteins related to molecular function (MF) were significantly enriched for transporter activity (GO:0005215), catalytic activity (GO:0003824), and binding (GO:0005488).
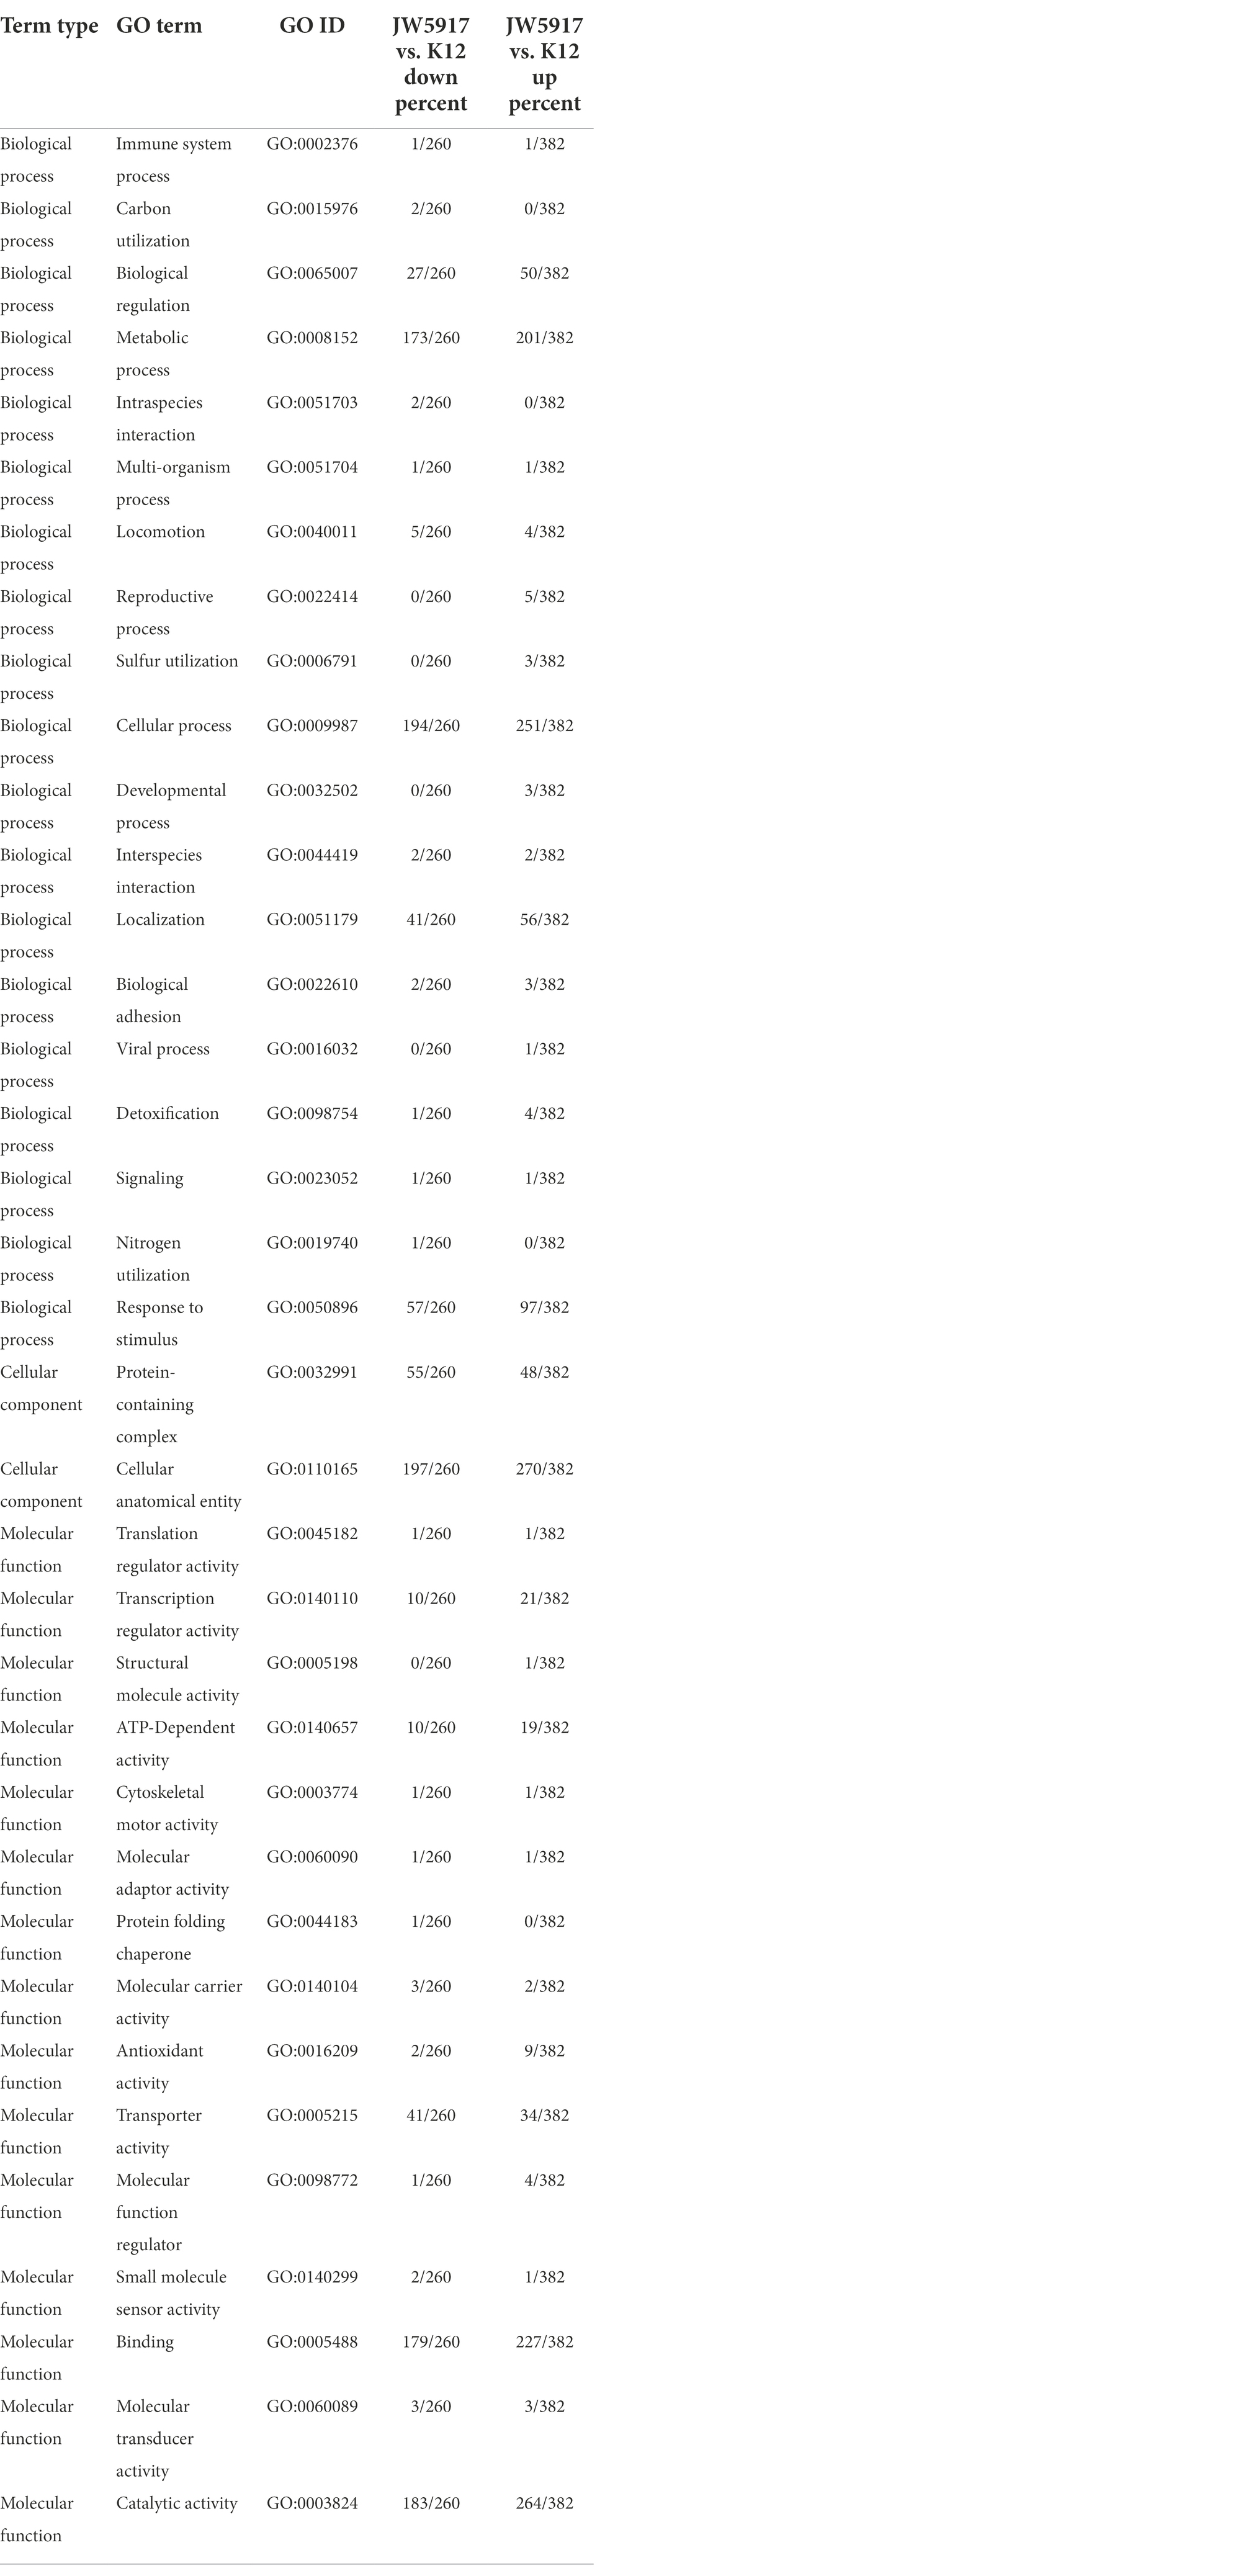
Table 2. GO categories of differentially expressed proteins in Escherichia coli JW5917.
Next, we performed KEGG functional annotation to verify the functional classification of pathways and the functional roles of the differentially expressed proteins. Crystal violet staining and LSCM revealed that the biofilm content was significantly reduced in E. coli JW5917. KEGG and GO analyses screened 17 proteins related to biofilm formation, including 10 downregulated and 7 upregulated proteins (Table 3). In particular, arabinose 5-phosphate isomerase (GutQ), biofilm regulator (BssR), phosphate regulon transcriptional regulatory protein (PhoB), and autoinducer-2 kinase (LsrK) are directly related to biofilm formation, while the N-acetylglucosamine-specific EIICBA component (NagE), maltodextrin phosphorylase (MalP), and RNA polymerase sigma factor (RpoS) can indirectly regulate biofilm formation through pathway regulation or signal responses.
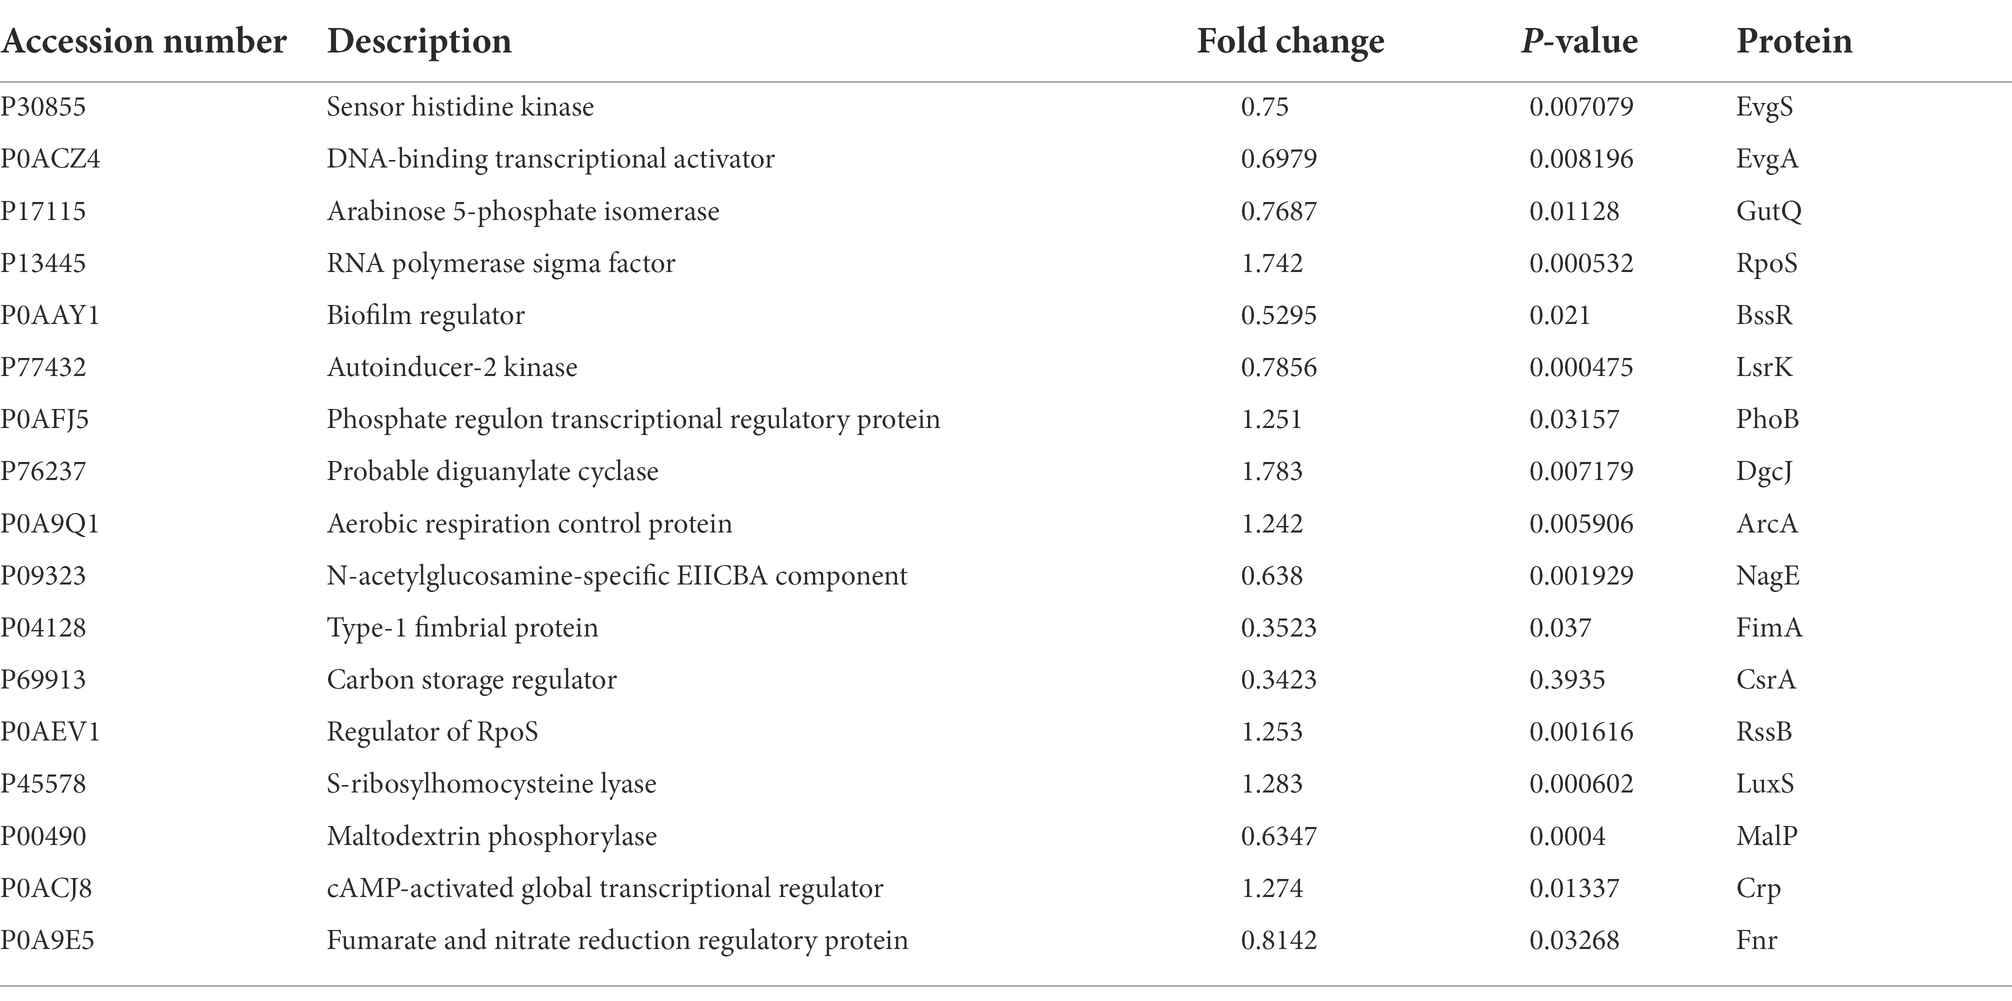
Table 3. Differentially expressed proteins related to biofilm formation in Escherichia coli JW5917.
The effect of plantaricin BM-1 on the growth of gutQ, bssR, phoB, lsrK, nagE, malP, and rpoS E. coli mutants was assessed by generating standard growth curves (Figure 8). The number of viable E. coli JW5431 cells was slightly lower (p > 0.05) than that of other mutants, possibly due to a decrease in activity caused by long-term storage. Under the treatment of plantaricin BM-1, E. coli JW5431, JW0820, JW0389, JW1504, and JW5437 grew slowly for the first 12 h and the viable cell count only reached 5.00 log10 or 6.00 log10 CFU/ml, which was significantly lower than that of E. coli K12 (p < 0.05). However, the sensitivity of E. coli JW5689 and JW0665 to plantaricin BM-1 did not differ significantly compared to E. coli K12, possibly because not all the proteins associated with biofilm synthesis are associated with sensitivity to plantaricin BM-1. Taken together, these findings suggest that the Rcs phosphorelay could affect the sensitivity of E. coli to plantaricin BM-1 by regulating the expression of GutQ, BssR, PhoB, LsrK, and RpoS.
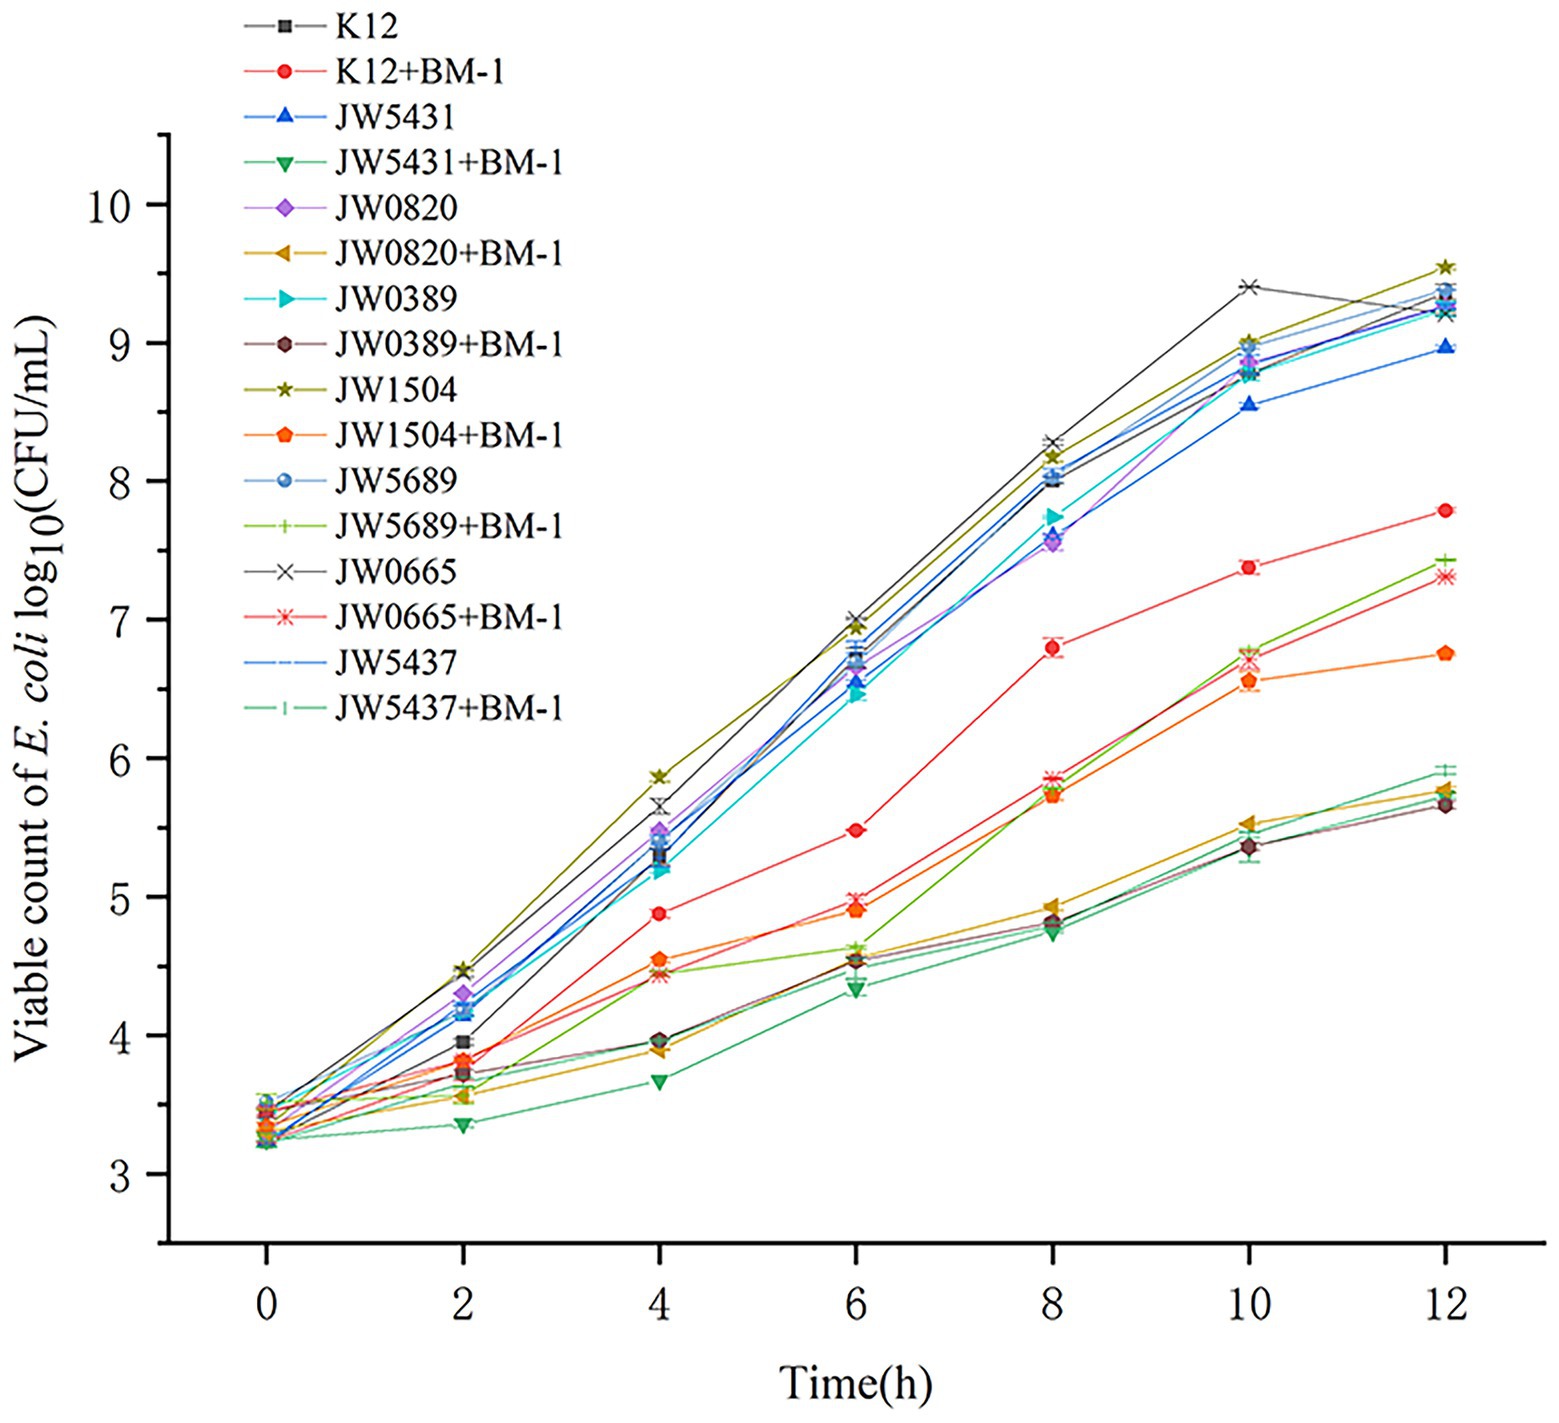
Figure 8. Effects of plantaricin BM-1 on the growth of wild-type Escherichia coli K12, mutant E. coli JW5431, JW0820, JW0389, JW1504, JW5689, JW0665, and JW5437 strains (p < 0.05).
The Rcs phosphorelay is one of the most complex TCSs in E. coli K12, with three core components: RcsC, RcsB, and RcsD. This system was originally described as a regulator of colanic acid synthesis (Gottesman and Stout, 1991); however, recent research has shown that the Rcs phosphorelay system also plays a role in acid resistance, cell division, motility, and biofilm formation. The Rcs phosphorelay can be activated by several conditions, including osmotic and acid shock, desiccation, and the perturbation of cell envelope integrity (Francez-Charlot et al., 2003; Clarke, 2010; Wall et al., 2018). In addition, studies have shown that the sensitivity of the Rcs phosphorelay system to lysozyme increases when it is blocked genetically and that the Rcs phosphorelay system can be induced by lysozyme, and encodes two lysozyme inhibitors, Ivy and MliC. The sensitivity of lysozyme can be alleviated by complementation with Ivy and MliC (Callewaert et al., 2009). Previously, we found that approximately 80% of the genes identified as members of the ampicillin regulon in E. coli treated with bactericidal levels of ampicillin are also regulated by the Rcs phosphorelay (Kaldalu et al., 2004; Huang et al., 2006). We also found that the deletion of the BasS/R TCS markedly increased sensitivity to plantaricin BM-1. TCSs, such as BasS/R, the Rcs phosphorelay, and PhoQ/P, are often thought to be related to the synthesis and modification of cell surface polysaccharides. Indeed, the absence of BasS/R has been shown to cause abnormal changes in the regulatory networks that exist between these systems (Liu et al., 2022 and our unpublished observations). Although the deletion of RcsC in the Rcs phosphorelay significantly increases the sensitivity of E. coli to plantaricin BM-1, the mechanism is unclear. In this study, we found that biofilm formation was significantly reduced in E. coli JW5917 compared to E. coli K12, with proteomic analysis further revealing that the differentially expressed proteins between these strains were mainly distributed in the cytoplasm and were directly or indirectly involved in biofilm formation. Moreover, we found that the deletion of genes encoding GutQ, BssR, PhoB, LsrK, and RpoS significantly increased the sensitivity of E. coli K12 to plantaricin BM-1.
Biofilms are organized bacterial populations encapsulated in a bacterial extracellular polymeric substance (EPS) matrix that can adhere to each other on biotic or abiotic surfaces (Rather et al., 2021). EPS mainly consists of polysaccharides, but other biomolecules like proteins, lipids, and nucleic acids are also present in EPS (Cortes et al., 2011; Gupta et al., 2016). Studies have shown that biofilm formation contributes toward the development of antibiotic resistance and the formation of persistent cells that are responsible for untreatable microbial infections (Pang et al., 2019; Rather et al., 2021). Previous studies have found that TCSs can achieve antibiotic resistance by regulating biofilm formation. For instance, the GacS/A TCS can participate in the formation of P. aeruginosa biofilms and confer resistance to aminoglycosides, such as amikacin and gentamicin (Brinkman et al., 2001). In addition, GacS/A is active in biofilms formed by Staphylococcus aureus and confers resistance to antibiotics such as vancomycin (Fridman et al., 2013). In this study, we found that arabinose 5-phosphate isomerase (GutQ), a precursor of the cell envelope lipopolysaccharide component 2-keto-3-deoxy-octulosonate (KDO) (Lim and Cohen, 1966), was downregulated by 0.76-fold in the rcsC mutant. It has been reported that GutQ is involved in biofilm formation, with mutants lacking gutQ showing a marked reduction in biofilm formation and increased gutQ expression increasing biofilm formation (Herzberg et al., 2006). GutQ expression also correlates negatively with the expression of YdgG, which can affect resistance to various antimicrobials, including crystal violet and streptomycin (Herzberg et al., 2006). BssR is a biofilm regulator that is transcribed during biofilm formation and can regulate biofilm formation through signal secretion (Ren et al., 2004). LsrK, a kinase that can phosphorylate the quorum-sensing auto-inducible molecule AI-2, was also downregulated by 0.78-fold in the rcsC mutant. Interestingly, the lsrK mutant had a different biofilm structure compared to the wild-type and LsrK has been reported to regulate the expression of biofilm-related genes (Li et al., 2007). Studies have also shown that LsrK may be a potential drug target for solving antibiotic resistance (Linciano et al., 2020); therefore, our findings may provide insights into the use of plantaricin BM-1 as a target in Gram-negative bacteria. Similarly, phosphate regulon transcriptional regulatory protein (PhoB), a dual transcriptional regulator that activates the expression of Pho regulators in response to environmental phosphate, was upregulated by 1.25-fold in our proteomics analysis. Studies have shown that E. coli PhoB can be activated under unrestricted phosphate conditions to inhibit biofilm formation (Grillo-Puertas et al., 2016). As the passive response regulator of the PhoR/B TCS, PhoB remains active by default and requires the interference of environmental signals to shut down the system. However, our proteomic analyses revealed no significant changes in PhoR expression. RNA polymerase factor sigma (RpoS) is an RNA polymerase subunit that acts as a master regulator of the general stress response in E. coli (Hengge-Aronis, 2002; Weber et al., 2005) and is regulated at the levels of protein degradation, transcription, translation, and activity. Studies have shown that rpoS regulates the formation of E. coli cell membranes (Adnan et al., 2010) and that high rpoS expression inhibits E. coli biofilm formation (Corona-Izquierdo and Membrillo-Hernandez, 2002). Moreover, it has been reported that rpoS is significantly upregulated after treatment with ampicillin and mitomycin C (Dapa et al., 2017; Mohiuddin et al., 2022), consistent with our findings after treatment with plantaricin BM-1.
In summary, our study demonstrates that decreased Rcs phosphorelay expression can increase the sensitivity of E. coli K12 to plantaricin BM-1. However, we found that the sensitivity of E. coli K12 to plantaricin BM-1 was not altered after RcsB and RcsD deletion, which may indicate that biofilm formation is only reduced after rcsC mutation. Thus, RcsC may can control the effect of the Rcs phosphorelay on biofilm formation. Another possibility is that because RcsC itself contains both His and Asp., the mechanism regulating the sensitivity of E. coli K12 to plantaricin BM-1 may be completed through this His-Asp process (Wall et al., 2018). In conclusion, mutations in the Rcs phosphorelay resulted in significantly reduced biofilm formation in E. coli, resulting in reduced cell resistance to stress and affecting the sensitivity of E. coli K12 to plantaricin BM-1. In future studies, we will attempt to construct an rcsCDB three-gene mutant to further verify the mechanism through which the Rcs phosphorelay regulates the sensitivity of E. coli K12 to plantaricin BM-1.
The datasets presented in this study can be found in online repositories. The names of the repository/repositories and accession number(s) can be found at: http://www.proteomexchange.org/, PXD037354.
ZB conceived and designed the experiments, performed the experiments, and analyzed the data. WL analyzed the data. JJ, LJ, and YH contributed materials. HZ conceptualization and methodology. YX conceived and designed the experiments. All authors contributed to the article and approved the submitted version.
This work was supported by the Research project of Beijing Municipal Commission of Education (KM201810020016).
We would like to thank Editage (www.editage.cn) for English language editing.
The authors declare that the research was conducted in the absence of any commercial or financial relationships that could be construed as a potential conflict of interest.
All claims expressed in this article are solely those of the authors and do not necessarily represent those of their affiliated organizations, or those of the publisher, the editors and the reviewers. Any product that may be evaluated in this article, or claim that may be made by its manufacturer, is not guaranteed or endorsed by the publisher.
Adnan, M., Morton, G., Singh, J., and Hadi, S. (2010). Contribution of rpoS and bolA genes in biofilm formation in Escherichia coli K-12 MG1655. Mol. Cell. Biochem. 342, 207–213. doi: 10.1007/s11010-010-0485-7
Alvarez-Sieiro, P., Montalban-Lopez, M., Mu, D., and Kuipers, O. P. (2016). Bacteriocins of lactic acid bacteria: extending the family. Appl. Microbiol. Biotechnol. 100, 2939–2951. doi: 10.1007/s00253-016-7343-9
Brinkman, F. S., Macfarlane, E. L., Warrener, P., and Hancock, R. E. (2001). Evolutionary relationships among virulence-associated histidine kinases. Infect. Immun. 69, 5207–5211. doi: 10.1128/IAI.69.8.5207-5211.2001
Callewaert, L., Vanoirbeek, K. G., Lurquin, I., Michiels, C. W., and Aertsen, A. (2009). The Rcs two-component system regulates expression of lysozyme inhibitors and is induced by exposure to lysozyme. J. Bacteriol. 191, 1979–1981. doi: 10.1128/JB.01549-08
Chen, X., Liu, Y., Jin, J., Liu, H., Hao, Y., Zhang, H., et al. (2021). YbfA regulates the sensitivity of Escherichia coli K12 to Plantaricin BM-1 via the BasS/BasR two-component regulatory system. Front. Microbiol. 12:659198. doi: 10.3389/fmicb.2021.659198
Cho, S. H., Szewczyk, J., Pesavento, C., Zietek, M., Banzhaf, M., Roszczenko, P., et al. (2014). Detecting envelope stress by monitoring beta-barrel assembly. Cell 159, 1652–1664. doi: 10.1016/j.cell.2014.11.045
Clarke, D. J. (2010). The Rcs phosphorelay: more than just a two-component pathway. Future Microbiol. 5, 1173–1184. doi: 10.2217/fmb.10.83
Corona-Izquierdo, F. P., and Membrillo-Hernandez, J. (2002). A mutation in rpoS enhances biofilm formation in Escherichia coli during exponential phase of growth. FEMS Microbiol. Lett. 211, 105–110. doi: 10.1111/j.1574-6968.2002.tb11210.x
Cortes, M. E., Bonilla, C. J., and Sinisterra, R. D. (2011). Biofilm formation, control and novel strategies for eradication. Sci. Against Microbiol. Pathog. Commun. Curr. Res. Technol. Adv. 2, 896–905.
Dapa, T., Fleurier, S., Bredeche, M. F., and Matic, I. (2017). The SOS and RpoS regulons contribute to bacterial cell robustness to genotoxic stress by synergistically regulating DNA polymerase pol II. Genetics 206, 1349–1360. doi: 10.1534/genetics.116.199471
Delhaye, A., Collet, J. F., and Laloux, G. (2019). A Fly on the Wall: how stress response systems can sense and respond to damage to peptidoglycan. Front. Cell. Infect. Microbiol. 9:380. doi: 10.3389/fcimb.2019.00380
Diep, D. B., Skaugen, M., Salehian, Z., Holo, H., and Nes, I. F. (2007). Common mechanisms of target cell recognition and immunity for class II bacteriocins. Proc. Natl. Acad. Sci. U. S. A. 104, 2384–2389. doi: 10.1073/pnas.0608775104
Francez-Charlot, A., Laugel, B., Van Gemert, A., Dubarry, N., Wiorowski, F., Castanie-Cornet, M. P., et al. (2003). RcsCDB his-asp phosphorelay system negatively regulates the flhDC operon in Escherichia coli. Mol. Microbiol. 49, 823–832. doi: 10.1046/j.1365-2958.2003.03601.x
Fregeau Gallagher, N. L., Sailer, M., Niemczura, W. P., Nakashima, T. T., Stiles, M. E., and Vederas, J. C. (1997). Three-dimensional structure of leucocin a in trifluoroethanol and dodecylphosphocholine micelles: spatial location of residues critical for biological activity in type IIa bacteriocins from lactic acid bacteria. Biochemistry 36, 15062–15072. doi: 10.1021/bi971263h
Fridman, M., Williams, G. D., Muzamal, U., Hunter, H., Siu, K. W., and Golemi-Kotra, D. (2013). Two unique phosphorylation-driven signaling pathways crosstalk in Staphylococcus aureus to modulate the cell-wall charge: Stk1/Stp1 meets GraSR. Biochemistry 52, 7975–7986. doi: 10.1021/bi401177n
Gottesman, S., and Stout, V. (1991). Regulation of capsular polysaccharide synthesis in Escherichia coli K12. Mol. Microbiol. 5, 1599–1606. doi: 10.1111/j.1365-2958.1991.tb01906.x
Grillo-Puertas, M., Rintoul, M. R., and Rapisarda, V. A. (2016). PhoB activation in non-limiting phosphate condition by the maintenance of high polyphosphate levels in the stationary phase inhibits biofilm formation in Escherichia coli. Microbiology 162, 1000–1008. doi: 10.1099/mic.0.000281
Gupta, P., Sarkar, S., Das, B., Bhattacharjee, S., and Tribedi, P. (2016). Biofilm, pathogenesis and prevention--a journey to break the wall: a review. Arch. Microbiol. 198, 1–15. doi: 10.1007/s00203-015-1148-6
Hengge-Aronis, R. (2002). Signal transduction and regulatory mechanisms involved in control of the sigma(S) (RpoS) subunit of RNA polymerase. Microbiol. Mol. Biol. Rev. 66, 373–395. doi: 10.1128/MMBR.66.3.373-395.2002
Hersch, S. J., Watanabe, N., Stietz, M. S., Manera, K., Kamal, F., Burkinshaw, B., et al. (2020). Envelope stress responses defend against type six secretion system attacks independently of immunity proteins. Nat. Microbiol. 5, 706–714. doi: 10.1038/s41564-020-0672-6
Herzberg, M., Kaye, I. K., Peti, W., and Wood, T. K. (2006). YdgG (TqsA) controls biofilm formation in Escherichia coli K-12 through autoinducer 2 transport. J. Bacteriol. 188, 587–598. doi: 10.1128/JB.188.2.587-598.2006
Huang, Y. H., Ferrieres, L., and Clarke, D. J. (2006). The role of the Rcs phosphorelay in Enterobacteriaceae. Res. Microbiol. 157, 206–212. doi: 10.1016/j.resmic.2005.11.005
Juhas, M., and Ajioka, J. W. (2016). Lambda red recombinase-mediated integration of the high molecular weight DNA into the Escherichia coli chromosome. Microb. Cell Fact. 15:172. doi: 10.1186/s12934-016-0571-y
Kaldalu, N., Mei, R., and Lewis, K. (2004). Killing by ampicillin and ofloxacin induces overlapping changes in Escherichia coli transcription profile. Antimicrob. Agents Chemother. 48, 890–896. doi: 10.1128/AAC.48.3.890-896.2004
Kjos, M., Borrero, J., Opsata, M., Birri, D. J., Holo, H., Cintas, L. M., et al. (2011). Target recognition, resistance, immunity and genome mining of class II bacteriocins from gram-positive bacteria. Microbiology 157, 3256–3267. doi: 10.1099/mic.0.052571-0
Klaenhammer, T. R. (1988). Bacteriocins of lactic acid bacteria. Biochimie 70, 337–349. doi: 10.1016/0300-9084(88)90206-4
Li, J., Attila, C., Wang, L., Wood, T. K., Valdes, J. J., and Bentley, W. E. (2007). Quorum sensing in Escherichia coli is signaled by AI-2/LsrR: effects on small RNA and biofilm architecture. J. Bacteriol. 189, 6011–6020. doi: 10.1128/JB.00014-07
Lim, R., and Cohen, S. S. (1966). D-Phosphoarabinoisomerase and d-Ribulokinase in Escherichia coli. J. Biol. Chem. 241, 4304–4315. doi: 10.1016/s0021-9258(18)99723-1
Linciano, P., Cavalloro, V., Martino, E., Kirchmair, J., Listro, R., Rossi, D., et al. (2020). Tackling antimicrobial resistance with small molecules targeting LsrK: challenges and opportunities. J. Med. Chem. 63, 15243–15257. doi: 10.1021/acs.jmedchem.0c01282
Liu, Y., Wang, Y., Chen, X., Jin, J., Liu, H., Hao, Y., et al. (2022). BasS/BasR two-component system affects the sensitivity of Escherichia coli to Plantaricin BM-1 by regulating the tricarboxylic acid cycle. Front. Microbiol. 13:874789. doi: 10.3389/fmicb.2022.874789
Logre, E., Denamur, E., and Mammeri, H. (2020). Contribution to Carbapenem resistance and fitness cost of DcuS/DcuR, RcsC/RcsB, and YehU/YehT two-component systems in CTX-M-15-producing Escherichia coli. Microb. Drug Resist. 26, 349–352. doi: 10.1089/mdr.2019.0027
Luo, L., Yi, L., Chen, J., Liu, B., and Lü, X. (2021). Antibacterial mechanisms of bacteriocin BM1157 against Escherichia coli and Cronobacter sakazakii. Food Control 123:107730. doi: 10.1016/j.foodcont.2020.107730
Majdalani, N., and Gottesman, S. (2005). The Rcs phosphorelay: a complex signal transduction system. Annu. Rev. Microbiol. 59, 379–405. doi: 10.1146/annurev.micro.59.050405.101230
Masuda, G., and Tomioka, S. (1978). Quantitative assessment of bactericidal activities of beta-lactam antibiotics by agar plate method. Antimicrob. Agents Chemother. 14, 587–595. doi: 10.1128/AAC.14.4.587
Mohiuddin, S. G., Massahi, A., and Orman, M. A. (2022). High-throughput screening of a promoter library reveals new Persister mechanisms in Escherichia Coli. Microbiol. Spectr. 10:e0225321. doi: 10.1128/spectrum.02253-21
Pang, Z., Raudonis, R., Glick, B. R., Lin, T. J., and Cheng, Z. (2019). Antibiotic resistance in Pseudomonas aeruginosa: mechanisms and alternative therapeutic strategies. Biotechnol. Adv. 37, 177–192. doi: 10.1016/j.biotechadv.2018.11.013
Rather, M. A., Gupta, K., and Mandal, M. (2021). Microbial biofilm: formation, architecture, antibiotic resistance, and control strategies. Braz. J. Microbiol. 52, 1701–1718. doi: 10.1007/s42770-021-00624-x
Ren, D., Bedzyk, L. A., Thomas, S. M., Ye, R. W., and Wood, T. K. (2004). Gene expression in Escherichia coli biofilms. Appl. Microbiol. Biotechnol. 64, 515–524. doi: 10.1007/s00253-003-1517-y
Rodriguez, J. M., Martinez, M. I., and Kok, J. (2002). Pediocin PA-1, a wide-spectrum bacteriocin from lactic acid bacteria. Crit. Rev. Food Sci. Nutr. 42, 91–121. doi: 10.1080/10408690290825475
Simons, A., Alhanout, K., and Duval, R. E. (2020). Bacteriocins, antimicrobial peptides from bacterial origin: overview of their biology and their impact against multidrug-resistant bacteria. Microorganisms 8:639. doi: 10.3390/microorganisms8050639
Wall, E., Majdalani, N., and Gottesman, S. (2018). The complex Rcs regulatory Cascade. Annu. Rev. Microbiol. 72, 111–139. doi: 10.1146/annurev-micro-090817-062640
Weber, H., Polen, T., Heuveling, J., Wendisch, V. F., and Hengge, R. (2005). Genome-wide analysis of the general stress response network in Escherichia coli: sigmaS-dependent genes, promoters, and sigma factor selectivity. J. Bacteriol. 187, 1591–1603. doi: 10.1128/JB.187.5.1591-1603.2005
West, A. H., and Stock, A. M. (2001). Histidine kinases and response regulator proteins in two-component signaling systems. Trends Biochem. Sci. 26, 369–376. doi: 10.1016/s0968-0004(01)01852-7
Zhang, Y. M., Jiang, Y. H., Li, H. W., Li, X. Z., and Zhang, Q. L. (2022). Purification and characterization of lactobacillus plantarum-derived bacteriocin with activity against Staphylococcus argenteus planktonic cells and biofilm. J. Food Sci. 87, 2718–2731. doi: 10.1111/1750-3841.16148
Keywords: bacteriocins, Rcs Phosphorelay, proteome, biofilm, Escherichia coli
Citation: Bian Z, Liu W, Jin J, Hao Y, Jiang L, Xie Y and Zhang H (2022) Rcs phosphorelay affects the sensitivity of Escherichia coli to plantaricin BM-1 by regulating biofilm formation. Front. Microbiol. 13:1071351. doi: 10.3389/fmicb.2022.1071351
Edited by:
Huaxi Yi, Ocean University of China, ChinaReviewed by:
Ping Li, Zhejiang Gongshang University, ChinaCopyright © 2022 Bian, Liu, Jin, Hao, Jiang, Xie and Zhang. This is an open-access article distributed under the terms of the Creative Commons Attribution License (CC BY). The use, distribution or reproduction in other forums is permitted, provided the original author(s) and the copyright owner(s) are credited and that the original publication in this journal is cited, in accordance with accepted academic practice. No use, distribution or reproduction is permitted which does not comply with these terms.
*Correspondence: Yuanhong Xie, eGlleXVhbmhAMTYzLmNvbQ==; Hongxing Zhang, aHh6aGFuZzUxQDE2My5jb20=
Disclaimer: All claims expressed in this article are solely those of the authors and do not necessarily represent those of their affiliated organizations, or those of the publisher, the editors and the reviewers. Any product that may be evaluated in this article or claim that may be made by its manufacturer is not guaranteed or endorsed by the publisher.
Research integrity at Frontiers
Learn more about the work of our research integrity team to safeguard the quality of each article we publish.