 Wanzhu Li
 Baoli Wang
 Meiling Yang
 Sheng Xu
94% of researchers rate our articles as excellent or good
Learn more about the work of our research integrity team to safeguard the quality of each article we publish.
Find out more
ORIGINAL RESEARCH article
Front. Microbiol. , 02 November 2022
Sec. Aquatic Microbiology
Volume 13 - 2022 | https://doi.org/10.3389/fmicb.2022.1008606
Phytoplankton cell size is well known as an essential functional trait, but its control factors are still unclear. Considering light provides the necessary energy for phytoplankton survival, we hypothesized that photosynthetic light energy utilization could influence phytoplankton cell size control. Several scenarios were conducted to understand the relationship between Fv/Fm and cell size for phytoplankton interspecies, and metatranscriptome in the field and transcriptome in the laboratory were used to understand relevant molecular mechanisms. The results indicated that there was a universal significant positive relationship between Fv/Fm and cell volume in general. The molecular evidence demonstrated that light utilization by phytoplankton regulates their cell size by harmonizing the generation and allocation of chemical energy and fixed carbon in the cell. Phytoplankton cell size would cease to enlarge once the increased light energy conversion and subsequent fixed carbon could no longer satisfy the increasing demand of size enlargement. This unity of energy and matter in shaping phytoplankton size results in cell size being an important functional trait. This study is the first to discover the above molecular mechanisms and is helpful to deepen the understanding on the cell size control of phytoplankton.
Phytoplankton are primary producers and play an important role in aquatic ecosystems (Karlusich et al., 2020). Phytoplankton cell size, varying widely from less than 1 to 109 μm3 (Beardall et al., 2009), is well known as an essential functional trait determining the performance at species and community levels (Maranon, 2015; Hillebrand et al., 2022a). As such, phytoplankton cell size has an allometric relationship with the functional performance, including cellular rates of carbon fixation, respiration, and exudation as well as resource uptake and content (Maranon et al., 2013; Hillebrand et al., 2022b). On the other hand, phytoplankton cell size can be influenced by grazing and environmental stress such as nutrient limitation and warming (Kiørboe, 1993; Maranon et al., 2013). However, when referring to the problem of what determines cell size of phytoplankton, it remains unclear.
Photosynthesis, an essential performance of phytoplankton, converts light energy into chemical energy, later driving cellular metabolism (Blankenship, 2014). Light provides the necessary energy for phytoplankton survival and could constrain their cell size. Current studies in molecular biology demonstrate that cytoskeleton plays an important role in cell size control (Fletcher and Mullins, 2010; Marshall et al., 2012). Carbon is a major component of the above organelle (Ochs et al., 2014; Finkel et al., 2016) and as material source, should involve in the size control. Therefore, we hypothesized that photosynthetic light energy utilization could affect phytoplankton cell size control by regulating cellular carbon demand.
The capture of light energy in a phytoplankton cell occurs mainly in Photosystem II (PS II) (Fischer et al., 2016). The maximum quantum yield of PS II (i.e., Fv/Fm) is the maximal efficiency by which PS II turns energy in absorbed photons into electron flow and is widely used to indicate photosynthetic light energy utilization (Malerba et al., 2018; Yan et al., 2018; Tan et al., 2019). Several scenarios were designed to verify the proposed hypothesis. In the laboratory, to understand the relationship between Fv/Fm and cell size among phytoplankton interspecies, twenty-three algal species were cultured under normal condition, and the published data of Fv/Fm in other experimental phytoplankton (including freshwater and seawater species) were collected and integrated. In addition, Chlamydomonas reinhardtii FACHB-479 (C. reinhardtii) was used as a representative to understand how photosynthetic light energy utilization regulates the cell size by analyzing its transcriptome, and significant difference in Fv/Fm of C. reinhardtii was artificially created by nutrient limitation. In the field, seven reservoirs in Tianjin, North China, were investigated to understand the Fv/Fm and mean cell size of phytoplankton assemblage and related environmental factors, and metatranscriptome analyses were conducted to understand the relevant molecular regulation at community level. In addition, seasonal survey of three reservoirs on the Wujiang River, Southwest China, were conducted to understand the relationship between Fv/Fm and mean cell size for phytoplankton assemblage. The main aim of this study was to understand whether there is a universal relationship between Fv/Fm and cell size for phytoplankton and the molecular regulation mechanisms that light energy utilization regulates cell size. This study is helpful to deepen the understanding on the cell size control of phytoplankton.
Twenty-three algal species from eight phyla were selected for the normal culture experiment (Table 1). They were cultured in replete nutrients and suitable conditions by the Freshwater Algae Culture Collection of the Institute of Hydrobiology, Chinese Academy of Sciences. The media are listed in Supplementary Table 1, and their detailed components can be found on the website:1 Algae were collected at their exponential phases. The photosynthetic parameters were measured by a Phyto-PAM fluorometer (Phyto-PAM, ED, Walz, Germany) with Phyto-Win software (Version 2.11), and other relevant physiological parameters of algae were analyzed by CytoSense (CytoBuoy b.v., the Netherlands).
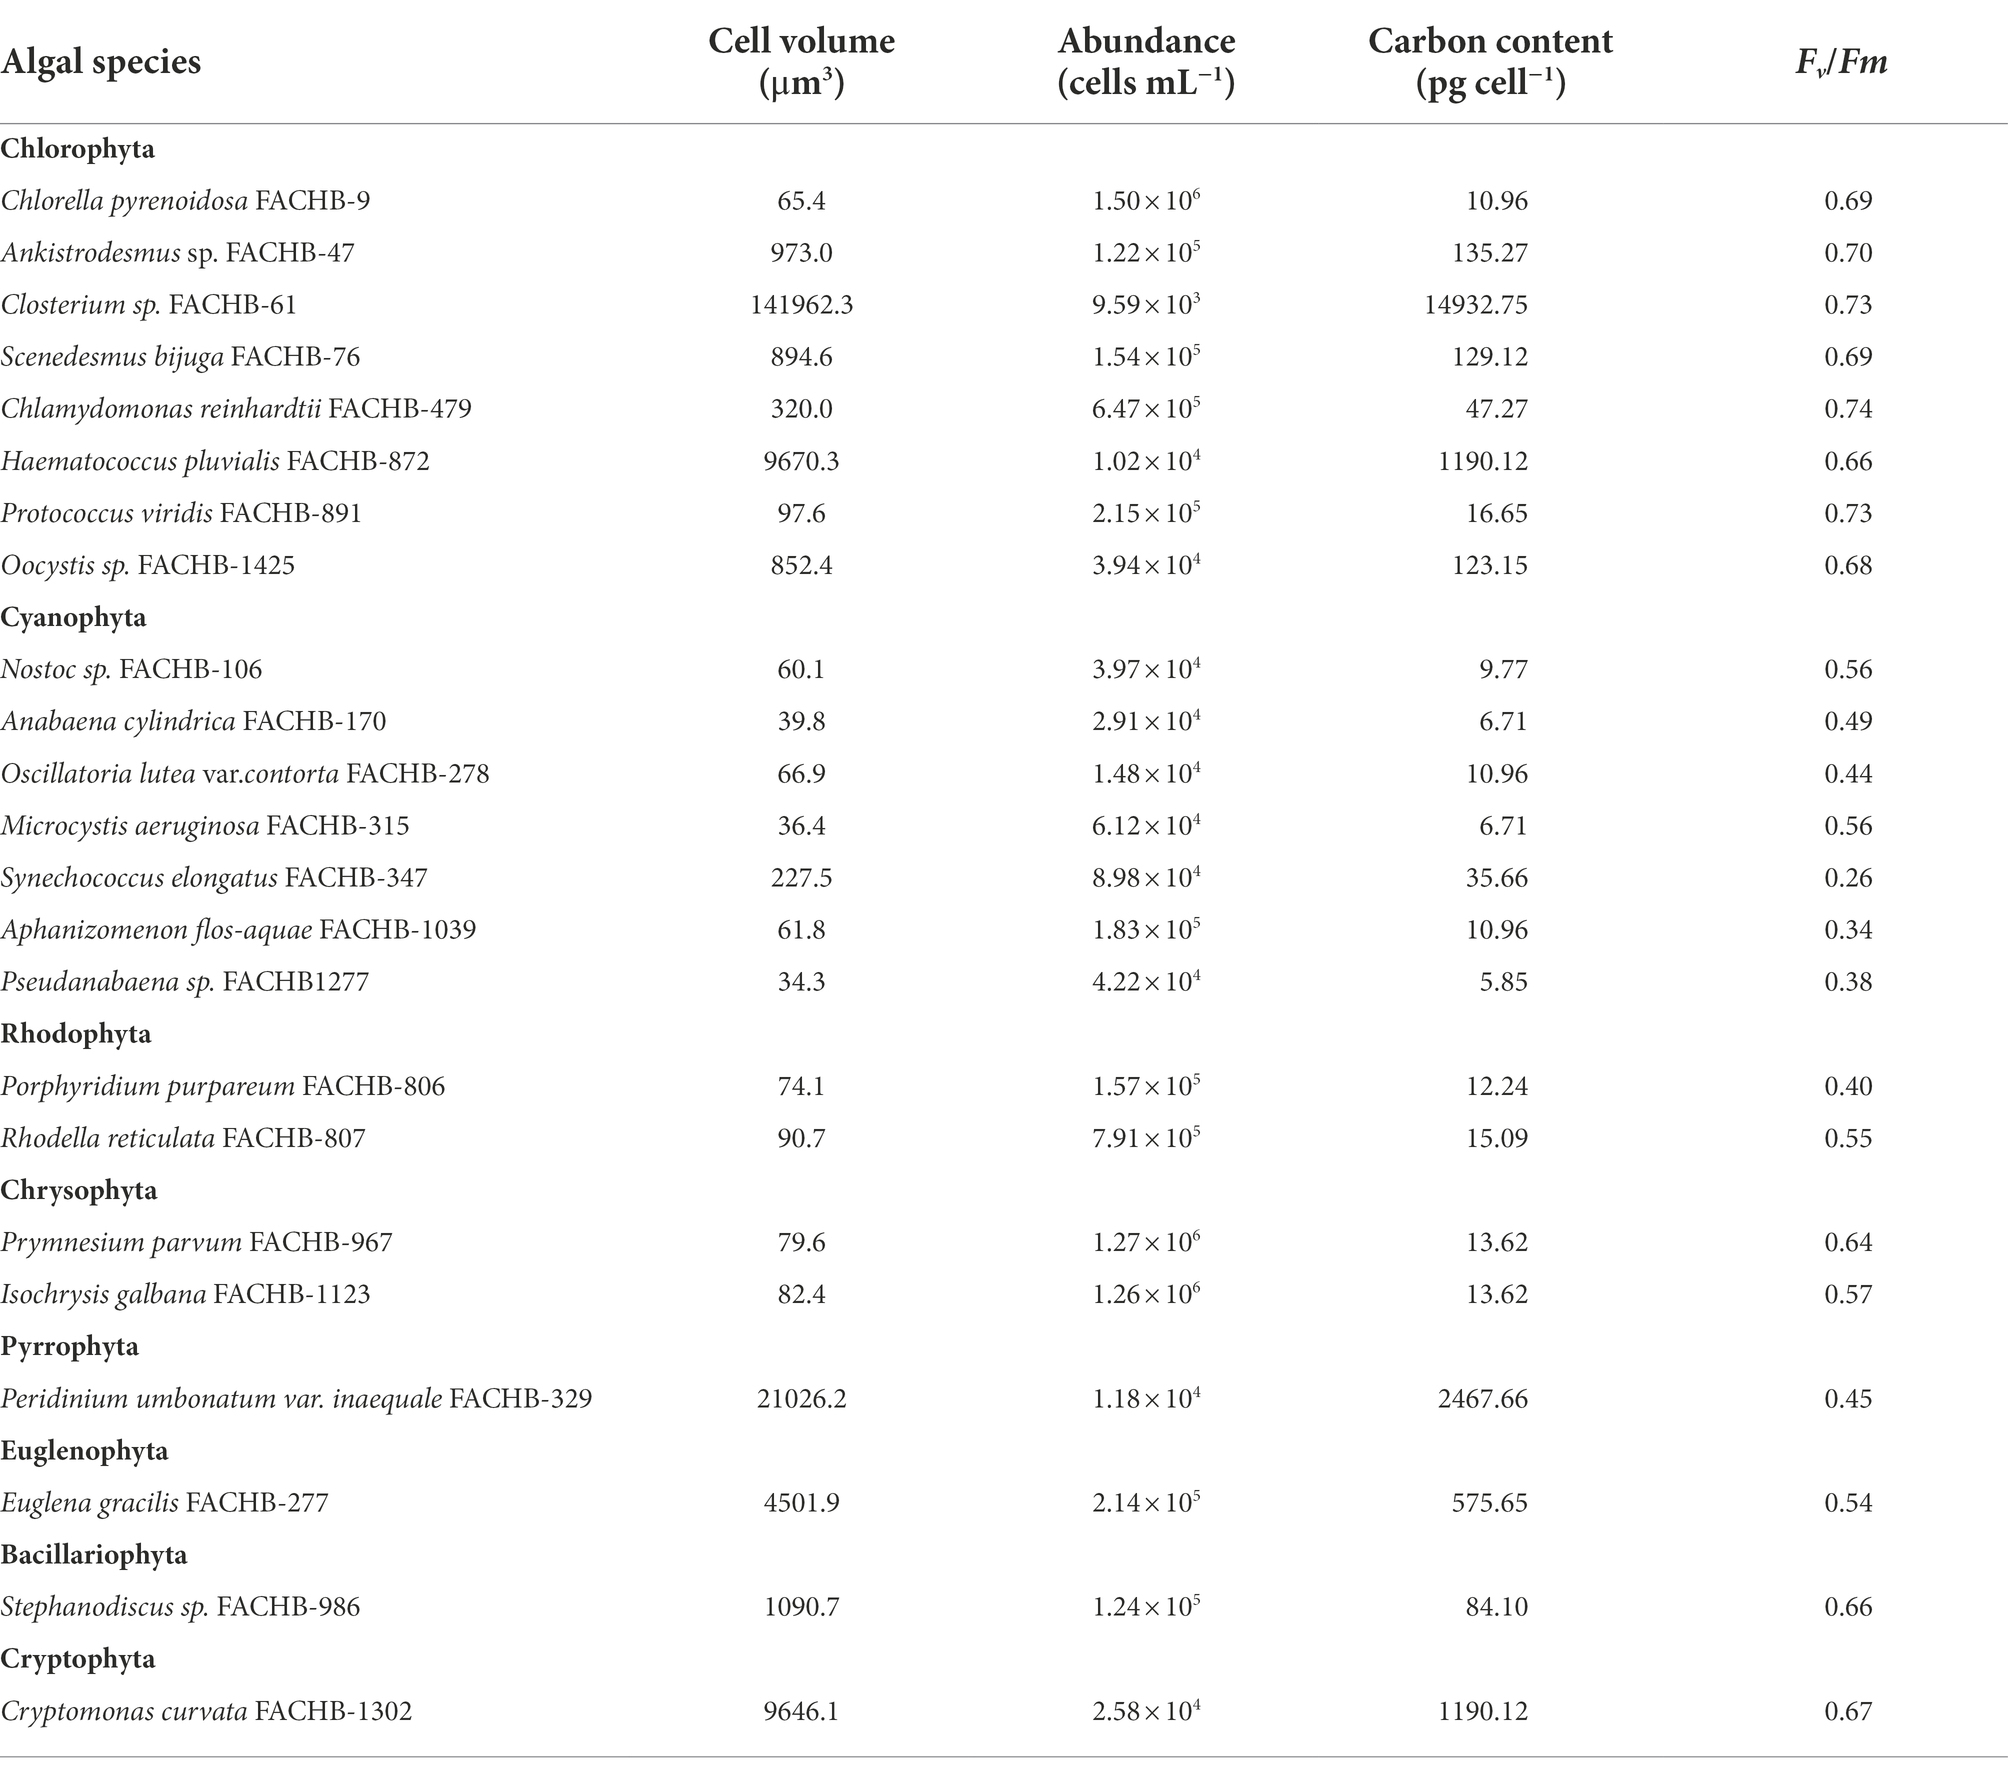
Table 1. Physiological parameters for 23 algal species at the exponential growth phase in normal culture experiment in this study.
In addition, C. reinhardtii was taken as a representative for culturing under different initial CO2 or nitrate concentrations. NaHCO3 and NaOH were used to adjust the initial CO2 concentrations to 3, 14, 52, 175, 497 and 804 μmol L−1, of which initial CO2 concentrations of 3 and 14 μmol L−1 were considered as CO2 limitation according to the saturation value of water CO2 under standard atmospheric pressure and present temperature (Li et al., 2022). NaNO3 was used as the only nitrogen source to adjust the initial nitrate concentrations of SE medium to 25, 50, 250, 500 and 2,941 μmol L−1, of which initial nitrates of 25 and 50 μmol L−1 were considered as nitrate limitation based on the decreased algal biomass and increased algal C:N ratio (Li et al., 2022). The detailed sampling and measurement methods of algal photosynthetic parameters, transcriptome sequencing, and nutrient concentrations of the medium are referred to Li et al. (2022).
The phytoplankton assemblages and related environmental factors of the Pingzhai, Puding, and Yingzidu reservoirs on the Sancha River tributary of the Wujiang River, Southwest China, were investigated. Water samples were collected in July and October 2017 and January and April 2018 at different depths in different reservoirs (Supplementary Table 2). The Yuqiao (YQ), Chaobaihe (CBH), Bolonghu (BLH), Donglihu (DLH), Haihe (HH), Tuanbowa (TBW), and Yongdinghe (YDH) reservoirs and two inflowing waters from the CBH and TBW reservoirs (CBH1 and TBW1, respectively) were investigated in Tianjin, North China. Their surface water samples were collected in September 2020 (Supplementary Table 2). Detailed information about the sites is referred to Xiao et al. (2021) and Li et al. (2022).
In the field, water temperature, dissolved oxygen (DO), and pH were measured in situ with an automated multiparameter profiler (model YSI EXO, United States) with precorrection. The photosynthetic parameters of the samples were measured by the Phyto-PAM fluorometer within 12 h after sampling. 1.5 l water samples were kept still for more than 24 h and were concentrated to final volumes of 50 ml for the analyses of phytoplankton total abundance (TA) and biovolume. The particulate matter was collected by a Whatman GF/F membrane (450°C, 8 h) to measure the organic C content. Water samples were filtered by vacuum filter with 0.45 μm Millipore cellulose acetate membranes, and the filtered waters were prepared to measure nutrient concentrations. The sample for metatranscriptomic sequencing at each field site in Tianjin was collected by a 0.7 μm Whatman GF/F membrane and then stored in liquid nitrogen immediately.
Phytoplankton photosynthetic parameters, including chlorophyll a concentration (Chl a), maximum quantum yield (Fv/Fm), effective quantum yield (yield), light use efficiency (Alpha), maximum electron transfer rate (ETRmax), and half-saturation light intensity (Ik), were determined by the Phyto-PAM fluorometer. The sample was subjected to dark adaptation for 15 min. The minimal fluorescence F0 was determined by turning on the measuring light, and the maximal fluorescence Fm was obtained by the saturation light pulse of 4,000 μmol m−2 s−1. Fv/Fm was calculated, where Fv was variable fluorescence equal to Fm–F0. Without dark acclimation, the rapid light curve (RLC) was constructed by exposing the sample to 16, 32, 64, 164, 264, 364, 464, 564, 646 and 764 μmol m−2 s−1 actinic light, and the irradiation time per level was 20 s. Alpha is the initial slope of the RLC.
The fluorescence parameters of cultured algae were analyzed by the CytoSense. The instrument was equipped with a solid-state laser (488 nm, 15 mW) to detect the passing cells, and the forward scatter (FWS) was collected by a PIN photodiode. Sideward scatter (SWS), red fluorescence (668–734 nm, FLR), orange fluorescence (601–668 nm, FLO), and yellow fluorescence (536–601 nm, FLY) were separated by a concave holographic grating and collected on a hybrid photomultiplier. Data recording was triggered by FWS. The peristaltic pump controlled the flow rate within 80 ~ 120 μl min−1, and the injection time of each sample was approximately 5 min. Cytoclus software (CytoClus3, CytoBuoy, b.v., the Netherlands) was used to analyze the data measured by CytoSense. The fluorescence and size parameters of phytoplankton were determined by the amplitude and shape of multiple signals (FWS, SWS, FLR, FLO and FLY).
Algal species and number were determined by hemocytometer measurement using an Olympus CX31 microscope (Lund et al., 1958), and the biovolume of each species was geometrically calculated (Hillebrand et al., 1999). In the normal culture experiment, the cellular C contents were calculated by the following formulas (Verity et al., 1992; Menden-Deuer and Lessard, 2000):
log pg. C cell−1 = −0.665 + 0.939 (log V) (μm3) (excluding Bacillariophyta).
log pg. C cell−1 = −0.541 + 0.811 (log V) (μm3) (Bacillariophyta).
where the log base is 10, C is the cellular C content, and V is the cell volume.
In the field, the mean cell volume of the phytoplankton assemblage (Vol) was calculated by the following formula:
where Vi is the cell volume of the ith species, Ai is the abundance of the ith species, and n is the number of species encountered.
The Shannon–Wiener index (H՛) of phytoplankton was calculated according to the equation:
where Pi is the ratio of ith species number to total number, and n is the number of species encountered.
The carbon density was the ratio of cellular carbon content to cellular volume for the single species in the laboratory or mean carbon content to mean biovolume for the phytoplankton assemblage in the field, whereas the Chl a density was the ratio of Chl a concentration to total biovolume of either single species in the laboratory or phytoplankton assemblage in the field. The other relevant parameters, including water alkalinity (Alk), dissolved inorganic nitrogen (DIN, sum of ammonium nitrogen, nitrate nitrogen, and nitrite nitrogen), phosphate phosphorus (PO43−-P), dissolved silicon (DSi), and particulate organic carbon (POC), were also determined, and the detailed analytical methods were referred to Xiao et al. (2021) and Li et al. (2022).
Transcriptome and metatranscriptomic sequencing were conducted by commercial services (Biomarker Technologies Co., Ltd., Beijing, China and Allwegene Technologies Co., Ltd., Beijing, China). The raw data of transcriptome sequencing were deposited in the NCBI SRA database with accession number PRJNA688010, and those of metatranscriptomic sequencing were deposited in the NCBI SRA database with accession number PRJNA798457.
Clean reads were obtained from raw reads by removing reads containing adapters and low-quality reads. All downstream analyses were based on high-quality clean reads. Gene expression levels were estimated by fragments per kilobase of transcription per million fragments mapped (FPKM). In transcriptome analyses, fold change (FC) represents the ratio of FPKMs between the nutrient limitation group and the normal control group. The p value was calculated using Benjamini and Hochberg’s approach for controlling the false discovery rate (FDR), and this rate was the key index of differentially expressed gene (DEG) screening. |Log2 FC| ≥ 1 and FDR < 0.01 were used as criteria for screening genes for further analyses, and |Log2 FC| < 1 and FDR > 0.01 were considered as insignificant difference in gene expression levels between the different groups. In metatranscriptome analyses, average gene expression levels (AGELs) of proteins involved in PS II, energy synthesis (i.e., the synthesis of ATP and NADPH in photosynthesis), carbon fixation, cytoskeleton, and cell wall were calculated from their respective FPKMs. Volume-specific AGEL was the ratio of AGEL in a certain pathway to Vol.
The cell volume and Fv/Fm of different algal species in the exponential growth phase under normal culture conditions were obtained from the published literature, and for those studies without cell volumes, they were calculated according to Hillebrand et al. (1999). The details are presented in Supplementary Table 3. The size of cell volume was divided into “small” (<102 μm3), “intermediate” (102–104 μm3), and “large” (>104 μm3) (Maranon et al., 2013; Maranon, 2015; Montes-Pérez et al., 2020).
Data plotting were conducted using Origin2017. One-way analysis of variance (ANOVA) and T-test were used to determine the significant differences within the 95% confidence interval between different groups using IBM SPSS statistics 24. Pearson correlation analysis was conducted by R software (version 3.4.2).
The cell abundance in the exponential growth phase of 23 algal species ranged from 103 to 107 cells ml−1, with an average of 5.7 × 10⁵ cells ml−1, and the cell volume ranged from 10 to 105 μm3, with an average of 8.3 × 103 μm3. There was a significant logarithmic negative correlation between cell abundance and cell volume for the eukaryotic algae (Figure 1A). The calculated C density ranged from 0.08 to 0.17 pg. μm−3, with an average of 0.15 pg. μm−3. Algal Fv/Fm showed an average of 0.57 and displayed obvious species specificity. The maximum was 0.74 for C. reinhardtii, and the minimum was 0.26 for Synechococcus elongatus (Table 1). There was small differentiated Fv/Fm among the eukaryotic algae, but these Fv/Fm was significantly different from that of the Cyanophyta (T-test, p < 0.001; Table 2). In addition, Fv/Fm was significantly positively correlated, respectively, with yield (r = 0.54, p < 0.01), Alpha (r = 0.86, p < 0.01), and ETRmax (r = 0.47, p < 0.05), indicating it can be a representative among photosynthetic parameters. The FLR (representing the content of chlorophyll) and FWS (representing the cell size) were species specific, and two clusters were found as prokaryotic algae (i.e., Cyanophyta) and eukaryotic algae in Figure 1B. The FLR of Cyanophyta was notably lower than that of eukaryotic algae, and the FLR was significantly positively correlated with FWS either among eukaryotic algae or within Cyanophyta (Figure 1B). In addition, the Fv/Fm from published literature of different algal phyla showed similar value to that of the culture experiment (T-test, p = 0.426; Table 2). The integrated Fv/Fm from published data and culture experiment was positively logarithmically correlated with Vol and negatively logarithmically correlated with carbon density (Figure 2; Table 3). The increasing trend of Fv/Fm became less apparent when the cells were intermediate and large (Figure 3A).
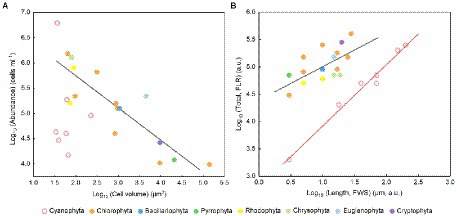
Figure 1. (A) Algal cell volume versus abundance in the normal culture experiment. The regression for algae except Cyanophyta: y = −0.64x + 7.02, adjusted r2 = 0.74, p < 0.01. (B) FLR area per cell versus FWS length per cell. FLR, red fluorescence; FWS, forward scatter. The regression for eukaryotic algae (black line): y = 0.59x + 4.43, adjusted r2 = 0.35, p < 0.01; the regression for Cyanophyta (red line): y = 1.12x + 2.80, adjusted r2 = 0.98, p < 0.001.
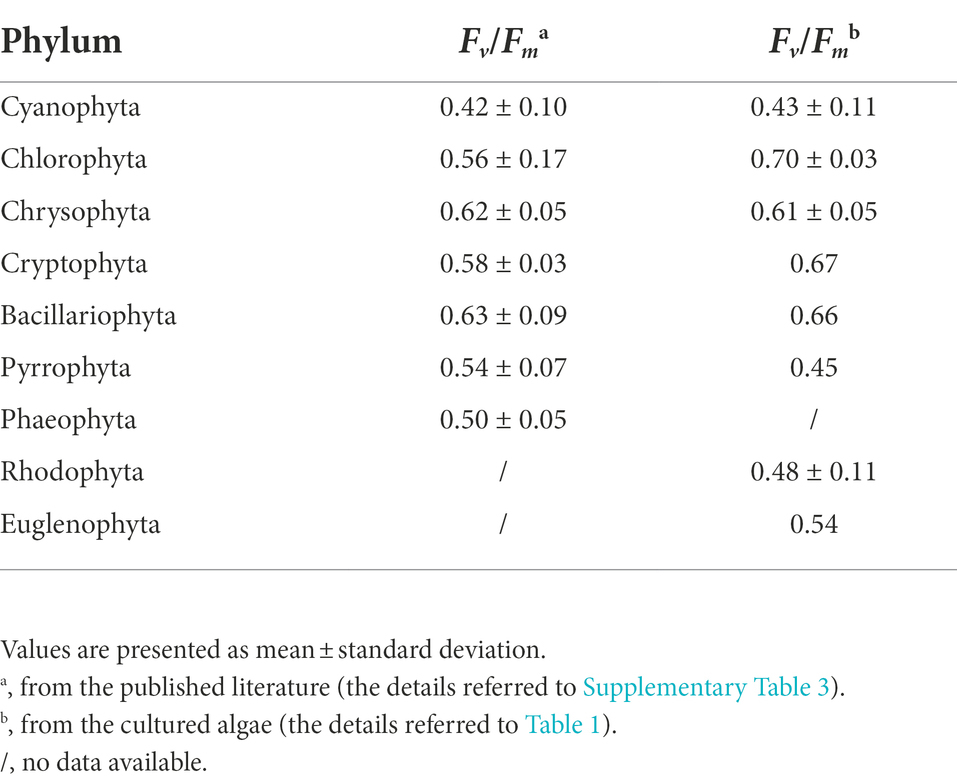
Table 2. Fv/Fm of different algal phyla.
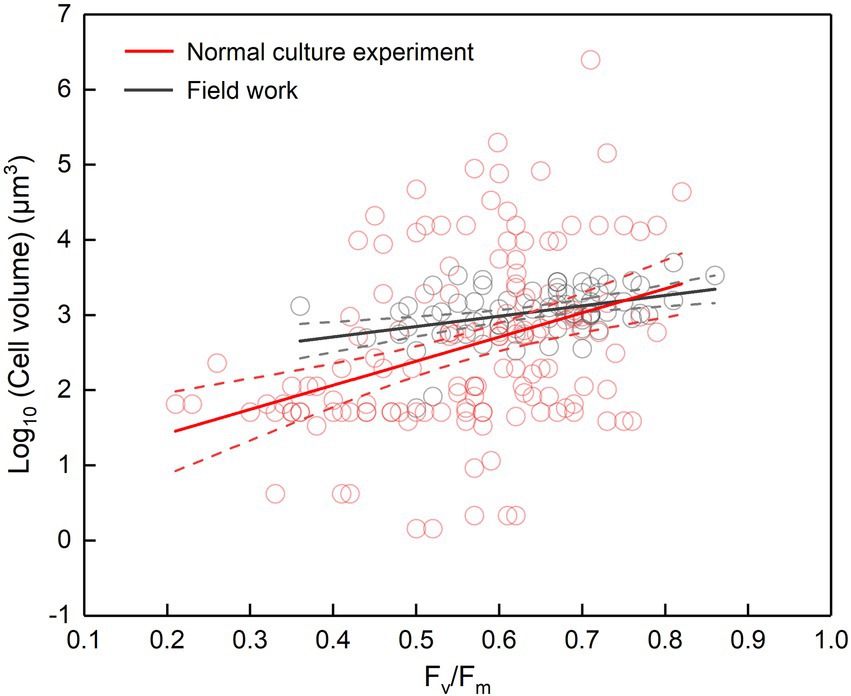
Figure 2. Fv/Fm versus cell volume. Cell volume is either the cell volume of certain species in the normal culture experiment (including the collected data) or the mean cell volume of phytoplankton assemblage in the field work. The regression for normal culture experiment: y = 3.21x + 0.77, adjusted r2 = 0.12, p < 0.001; the regression for field work: y = 1.38x + 2.15, adjusted r2 = 0.15, p < 0.001; the dotted lines represent the 95% confidence intervals.
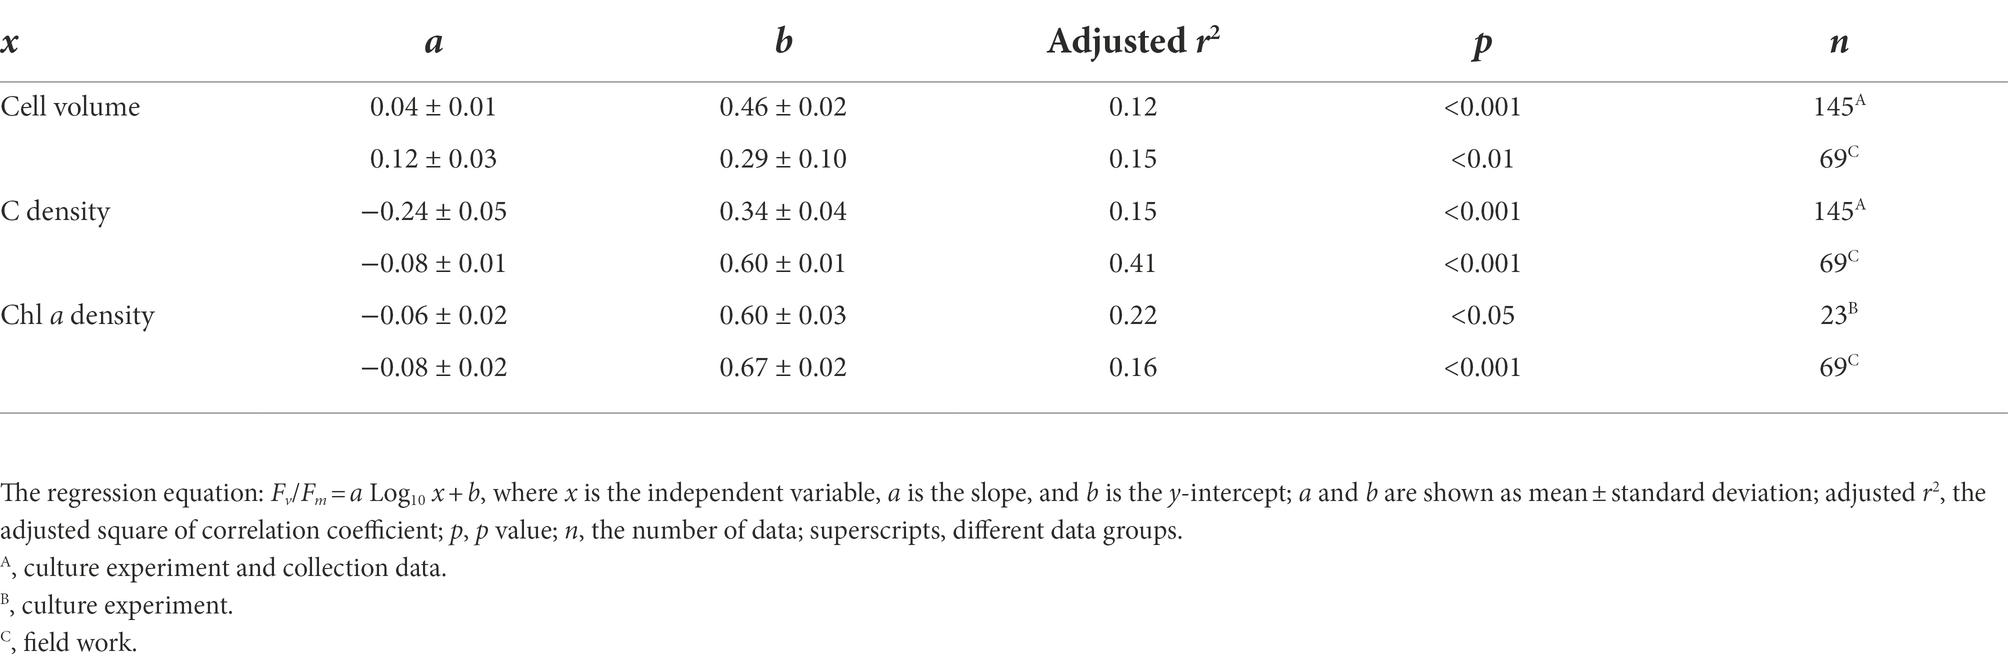
Table 3. Linear regression of Fv/Fm and each Log10 transformed physiological parameter (i.e., cell volume, C density, and Chl a density).
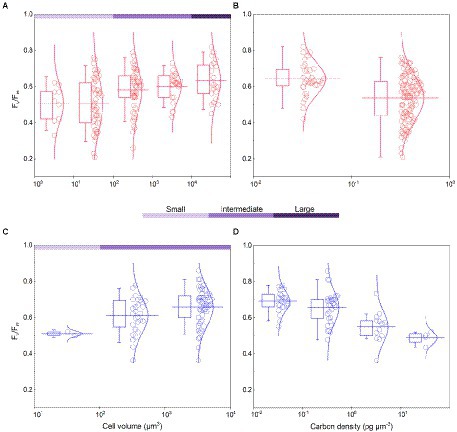
Figure 3. Algal Fv/Fm and carbon density in the normal culture experiment [(A,B), including the collected data] and field work (C,D). The classification of cell volume is referred to the text, and carbon density is nominally distributed on a scale of 10. The curve represents the normal distribution of data. The box encompasses the 25–75th percentiles, and whiskers and midline are the standard deviation and mean, respectively.
In the culture experiment for C. reinhardtii, Fv/Fm ranged from 0.73 to 0.77, with an average of 0.76, and cell volume ranged from 204 to 248 μm3, with an average of 221 μm3, in the CO2-gradient experiments. Compared with the CO2-replete condition, cell volume and Fv/Fm were not significantly lower under CO2 limitation (Figure 4A); the average expression levels of proteins involved in PS II, energy synthesis, cytoskeleton, and cell wall also showed insignificant change, whereas that of carbon fixation was significant down-regulated (Figure 4B; Supplementary Table 4). The Log2 FC of proteins involved in PS II was −1.05, and its average expression level was thus considered as an insignificant downregulation in this study. In the nitrate gradient experiments, Fv/Fm ranged from 0.68 to 0.78, with an average of 0.74, and cell volume ranged from 321 to 421 μm3, with an average of 369 μm3. Compared with the nitrate-replete condition, both cell volume and Fv/Fm were significantly lower under nitrate limitation (Figure 4C); average expression levels of proteins involved in PS II, carbon fixation, cytoskeleton, and cell wall were significantly downregulated, but that of energy synthesis was not (Figure 4D; Supplementary Table 5).

Figure 4. (A) Fv/Fm and cell volume of Chlamydomonas reinhardtii under different CO2 concentration conditions. (B) The fold change of gene expression of proteins involved in Photosystem II (PS II), energy synthesis (energy synth), carbon fixation (C fixation), cytoskeleton, and cell wall under CO2 limitation in comparison with CO2 repletion. (C) Fv/Fm and cell volume of Chlamydomonas reinhardtii under different nitrate concentration conditions. (D) The fold change of gene expression of proteins involved in PS II, energy synth, C fixation, cytoskeleton, and cell wall under nitrate limitation in comparison with nitrate repletion. The box encompasses the 25th-75th percentiles, and whiskers and midline are the standard deviation and mean, respectively. The lowercase letters represent the significance of the difference in Fv/Fm (p < 0.05) between different conditions. **represents the significant difference in cell volume at the 0.01 level between different conditions.
The Fv/Fm of phytoplankton assemblage ranged from 0.36 to 0.86, with an average of 0.66. The Fv/Fm was significantly positively correlated with TA (p < 0.01) and negatively correlated with H՛ (p < 0.05; Supplementary Figure 1). The Vol ranged from 58 to 6,879 μm3, with an average of 1,316 μm3, dominated by small and intermediate cells (Figure 3C). The Vol was significantly positively correlated with Alpha, Chl a, DIN, and DO (Supplementary Figure 1). The Fv/Fm was significantly positively correlated with Vol and negatively correlated either with C density or Chl a density (Figure 2; Table 3). In the metatranscriptome analyses, the maximum AGEL of proteins involved in PS II was 967 in YDH, and the minimum was 315 in YQ (Supplementary Table 6). The maximum AGEL of energy synthesis was 500 in TBW1, and the minimum was 50 in CBH (Supplementary Table 6). For the AGEL of C fixation, the maximum was 5,274 in YDH, and the minimum was 133 in CBH (Supplementary Table 6). The AGELs of proteins involved in PS II, energy synthesis, and C fixation were significantly positively correlated with each other (Supplementary Figure 2). For the AGELs of cytoskeleton and cell wall, they showed obvious different among the sampling sites (Supplementary Table 6). The Fv/Fm was negatively correlated with volume-specific AGELs of proteins involved in PS II, cytoskeleton, and cell wall, respectively (Figure 5; Table 3). The Chl a density was positively correlated with carbon density and volume-specific AGEL of PS II proteins, respectively (Figure 5B and Supplementary Figure 3). The ratio of Fv/Fm to PS II protein AGEL had a significant relationship with the ratio of Vol to carbon-fixation AGEL, independent of phytoplankton community structure (Figure 6 and Supplementary Figure 4).
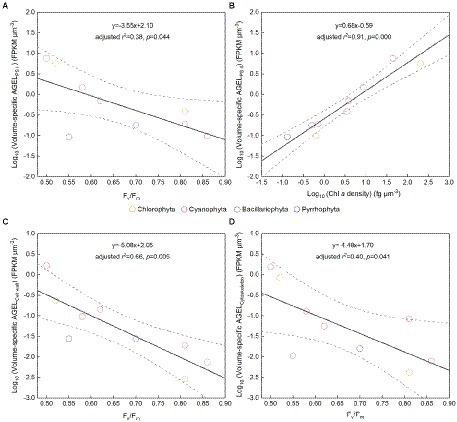
Figure 5. (A) Fv/Fm versus volume-specific average gene expression level (AGEL) of Photosystem II (PS II) proteins; (B) Chlorophyll a (Chl a) density versus volume-specific AGEL of PS II proteins; (C) Fv/Fm versus volume-specific AGEL of proteins involved in cell wall; (D) Fv/Fm versus volume-specific AGEL of proteins involved in cytoskeleton; all for the phytoplankton assemblage in Tianjin’s reservoirs. Different color point represents different dominant algal group in each sampling site. The dotted lines represent the 95% confidence intervals.
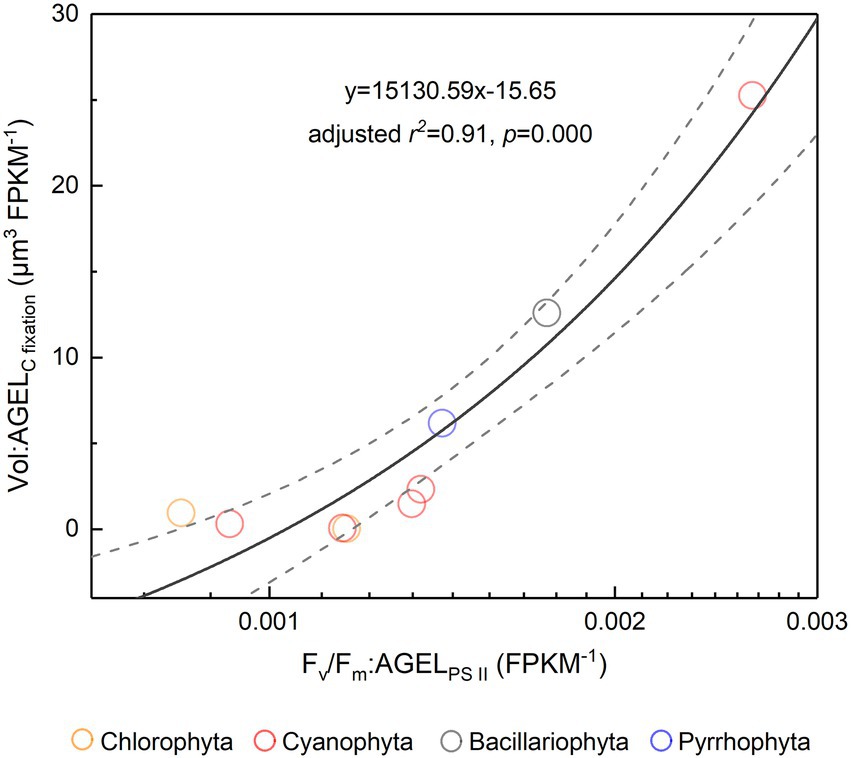
Figure 6. The ratio of Fv/Fm to PS II protein AGEL versus the ratio of Vol to C-fixed protein AGEL for the phytoplankton assemblage in Tianjin’s reservoirs. PS II, Photosystem II; C, carbon; AGEL, average gene expression level; Vol, mean cell volume of phytoplankton assemblage. Different color point represents different dominant algal group in each sampling site. The dotted lines represent the 95% confidence intervals.
It seems to be universal that Fv/Fm has a positive relationship with cell size although the slope of regression curve was different between the laboratory and the field (Figure 2). In the normal culture experiment, Fv/Fm and cell size can exhibit the phytoplankton genetic performance with their growth freeing from environmental stress and species competition. The integrated data of Fv/Fm included a large number of algal species, and thus the corresponding cell size ranged widely. However, in the field, the number of dominant species was much smaller than that of all integrated algal species, and thus the cell size had a narrower distribution. In addition, the evolving larger cell of Dunaliella teriolecta by an artificial selection displayed higher Fv/Fm in a previous experimental study (Malerba et al., 2018), and in the conditional culture experiment, cell size of C. reinhardtii decreased with the decreasing Fv/Fm under nitrate limitation (Figure 4C).
Fv/Fm is the quantum yield when all active centers of light-harvesting system PS II are open (Consalvey et al., 2005) and is thus directly determined by the types of pigment-protein complexes in PS II (Stanier and Cohen-Bazire, 1977). The differences in structure and amounts of pigment-protein complexes could be the primary cause leading to a large difference in Fv/Fm between cyanobacteria and eukaryotic algae. For example, Cyanophyta has a phycobilisome allowing absorption and unidirectional transfer of light to chlorophyll a, whereas Chlorophyta and Euglenophyta have complexes combining chlorophyll a and b (Grossman et al., 1995). In addition, the chlorophyll content of Cyanophyta was notably lower than that of eukaryotic algae (Figure 1B), and the phycobiliproteins of cyanobacteria contributing fluorescence overlap with the spectrum of PS II chlorophyll emission (Campbell et al., 1998) and enhance the minimal fluorescence yield F0, finally reducing the Fv/Fm of cyanobacteria. The differences in Fv/Fm among eukaryotic algae are probably mainly due to the differences in amounts rather than structure of pigment-protein complexes. In the field, the variation in Fv/Fm of phytoplankton assemblage could be attributed to the different phytoplankton community structure among the reservoirs (Supplementary Figure 1). It has reported that taxonomic diversity of phytoplankton is a function of cell size (Ryabov et al., 2021), implying that there should be a link between Fv/Fm and cell size among the interspecies.
For the relation of Fv/Fm to cell size within the intraspecies, the package effect could give a theoretical explanation. The package effect is that the absorption of pigments in cells decreases in comparison with the absorption potential for same amount of pigment in solution (Raven, 1984; Stuart et al., 1998). For microalga Dunaliella teriolecta, volume-specific photosynthetic pigments has been reported to increase with an increase in cell size (Malerba et al., 2018), as large cells might reduce the influence of increasing cellular package effect by improving photosynthetic performance.
Environmental factors can influence phytoplankton Fv/Fm and cell size. This study demonstrated that nitrate limitation resulted in a significant decrease of Fv/Fm and cell size (Figure 4C), and other studies also reported that nutrient availability and warming can trigger a change of phytoplankton cell size (Maranon et al., 2013; Hillebrand et al., 2022a,b). In addition, environmental stress such as ultraviolet radiation and heavy metals can affect Fv/Fm by damaging the structure and metabolism of pigment-protein complexes in phytoplankton cells (Kolber et al., 1994; Beecraft et al., 2019), and in a response, the Fv/Fm and cell size are both changed (Tan et al., 2019; Hillebrand et al., 2022a).
In a word, the difference in light-harvesting systems among the interspecies, the cellular package effect, the nutrient availability, water temperature, and other environmental stresses can cause the difference in photosynthetic light energy utilization for phytoplankton, which could ultimately affect phytoplankton cell size through feedback of cell metabolism to current ambient changes or long-term evolution. Therefore, phytoplankton Fv/Fm positively correlates with cell size, and it is highlighted on the intrinsic cause relationship between photosynthetic light energy utilization and phytoplankton cell size control in this study.
Light energy is a prerequisite for the survival of phytoplankton. In the cellular thylakoid membrane, PS II harvests light and produces electrons and H+, which drive the formation of ATP and NADPH that release to the stroma for carbon fixation (Figure 7A). A part of fixed carbon is used to structure cytoskeleton and cell wall (or cell wall-like such as a glycocalyx), and the rest enters the other metabolism such as lipid synthesis. Based on the metatranscriptome analyses from Tianjin’s reservoirs, for the proteins involved in PS II, energy synthesis, and carbon fixation, their gene expression changed synchronously, accompanying with the varying cell size among phytoplankton interspecies (Supplementary Figure 2). Therefore, the molecular evidence supported that there will be a relationship between Fv/Fm and cell size. Cellular gene expression responds to the present environmental variations including nutrient limitation and/or species competition (Hockin et al., 2012; Narwani et al., 2017). For phytoplankton assemblage, the ratio of Fv/Fm to PS II protein AGEL is specific Fv/Fm normalized by AGEL of PS II proteins under different environmental conditions, and the ratio of biovolume to carbon-fixed protein AGEL is also a similar meaning. They were significantly correlated each other (Figure 6), verifying that there is a universal relationship between light energy utilization and cell size, and phytoplankton cells are the unity of light energy conversion and matter metabolism.
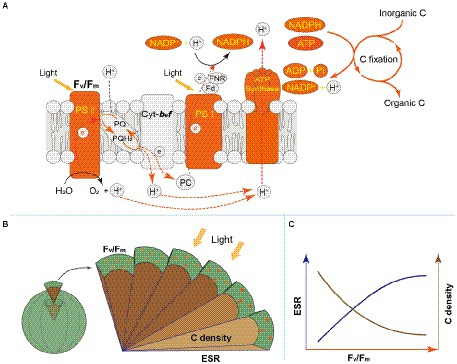
Figure 7. (A) Schematic diagram for photosynthesis and carbon fixation in phytoplankton cells. The orange marks represent the regulation pathways that is highlighted in this study. (B) Schematic diagram for regulation of light energy utilization on cell size of phytoplankton. The circles on the surface: the chlorophyll molecules. Fv/Fm: the maximum quantum yield of Photosystem II, marked by orange; ESR: equivalent spherical radius, marked by dark blue; C density: carbon density, marked by brown. A gradual increase in color indicates higher values of Fv/Fm and C density; with the increasing ESR, Fv/Fm increases, but C density decreases. (C) Schematic diagram for the relationship between Fv/Fm and ESR (or C density) for phytoplankton interspecies.
Nitrate limitation can substantially decrease the synthesis of nitrogenous macromolecules such as pigment-protein complexes (Osborne and Geider, 1986; Mock and Kroon, 2002), and the gene expression of PS II proteins was thus significant downregulated, causing a decrease of Fv/Fm in the conditional experiment (Figures 4C,D). This effect was passed on the gene expression of the proteins involved in carbon fixation, cytoskeleton, and cell wall in turn, finally resulting in a decrease of cell size (Figures 4C,D). CO2 limitation showed less impact on C. reinhardtii than nitrate limitation because the cell operated CO2-concentrating mechanisms to offset the lack of CO2 (Wang et al., 2013; Maberly and Gontero, 2017; Li et al., 2022). As such, gene expression of carbon-fixed proteins was significant downregulated (Figure 4B) because CO2-concentrating mechanisms are energy-dependent and compete for the energy (e.g., ATP) required for carbon fixation (Wang et al., 2015). However, algal light energy utilization was not seriously affected, neither did the cellular gene expression of proteins involved in PS II, cytoskeleton, and cell wall (Figure 4B). Accordingly, there was no significant change in cell size. All the molecular evidence demonstrated that photosynthetic light energy utilization regulates phytoplankton cell size by harmonizing the generation and allocation of cellular chemical energy and fixed carbon in the cell. This finding not only provides an explanation on that environmental stress (e.g., nutrient limitation) influencing phytoplankton light conversion can usually decrease their cell size (Kolber et al., 1994; Li et al., 2022) but also interprets why phytoplankton cell size can be an important functional trait.
Accompanying with the formation of species diversity, phytoplankton evolve their own cell size diversity (Acevedo-Trejos et al., 2018). However, in the long-term evolution, phytoplankton could not enlarge their cell size infinitely. The first evidence is a decrease of volume-specific Chl a with an increase in cell volume for phytoplankton interspecies (Figure 7B; Tetsuichi and Satoru, 2002). In this study, the nonlinear relationship between Fv/Fm and cell size (Figure 2) and the nonlinear decrease of volume-specific PS II protein AGEL with the increase in Fv/Fm supported that with the increasing Fv/Fm, the increase in cell size was fast when Fv/Fm was small but became slow when Fv/Fm was large (Figures 5A, 7C). In addition, the volume-specific carbon (i.e., carbon density) decreased with the increasing Fv/Fm (Figures 3B,D, 7C), implying that the contribution of nascent fixed carbon will decrease with an increase in cell size. The volume-specific AGELs of proteins involved in cytoskeleton and cell wall showed similar behaviors (Figures 5C,D), indicating that phytoplankton cells may sense their own growth and give negative feedback to persistent cell enlargement. Therefore, it can be inferred that phytoplankton cell size ceases to enlarge once the increased light energy conversion and subsequent fixed carbon could no longer satisfy the increasing demand of volume enlargement.
Phytoplankton cell size, as an important functional trait, is closely related to their Fv/Fm, and this relationship was usually considered as the results of the former constraining the latter. Here, we interpret this relationship from a reverse angle and regard the utilization of photosynthetic light energy as the reason for the size control, based on the fact that phytoplankton are the unity of material and energy, but the acquisition of light energy is the premise of their survival. Phytoplankton cell size, to some degree, is the results of cell responding to ambient changes and then balancing internal metabolism. Many environmental factors can shape phytoplankton cell size by influencing the utilization of light energy. It should be noted, however, that cell size is a relatively robust variable, while Fv/Fm is much more active, with relatively large variation and fast response to environmental changes that can work on a time scale of seconds to hours. Therefore, when analyzing the relationship from the perspective of using photosynthetic light energy as the cause of cell size, the Fv/Fm had better be determined after the total adaptation to ambient conditions for phytoplankton cells, whether at normal conditions or at environmental stresses.
There was a universal significant positive relationship between Fv/Fm and cell volume in general. The molecular evidence demonstrated that photosynthetic light energy utilization regulates phytoplankton cell size by harmonizing the generation and allocation of chemical energy and fixed carbon in the cell. Phytoplankton cell size would cease to enlarge once the increased light energy conversion and subsequent fixed carbon could no longer satisfy the increasing demand of size enlargement. Cell size control of phytoplankton is a complex process, and more elaborate regulation mechanisms are worthy of further studies for refreshing our knowledge.
The data presented in the study are deposited in the NCBI SRA repository, accession number PRJNA688010 and PRJNA798457.
BW developed the idea. BW, SX, and C-QL optimized study. WL, MY, and JX performed the experiment and field work. WL and BW produced the first draft. All authors contributed to the article and approved the submitted version.
This work was financially supported by the National Natural Science Foundation of China (U1612441) and the National Key Research and Development Program of China (2016YFA0601001).
The authors are grateful to the colleagues for their help in the field and the reviewers for their valuable comments.
The authors declare that the research was conducted in the absence of any commercial or financial relationships that could be construed as a potential conflict of interest.
All claims expressed in this article are solely those of the authors and do not necessarily represent those of their affiliated organizations, or those of the publisher, the editors and the reviewers. Any product that may be evaluated in this article, or claim that may be made by its manufacturer, is not guaranteed or endorsed by the publisher.
The Supplementary material for this article can be found online at: https://www.frontiersin.org/articles/10.3389/fmicb.2022.1008606/full#supplementary-material
Acevedo-Trejos, E., Marañón, E., and Merico, A. (2018). Phytoplankton size diversity and ecosystem function relationships across oceanic regions. Proc. Royal Soc. B 285:20180621. doi: 10.1098/rspb.2018.0621
Beardall, J., Allen, D., Bragg, J., Finkel, Z. V., Flynn, K. J., Quigg, A., et al. ar, colonial and multicellular phytoplankton. New Phytol. 181, 295–309. doi: 10.1111/j.1469-8137.2008.02660.x
Beecraft, L., Watson, S. B., and Smith, R. E. H. (2019). Innate resistance of PSII efficiency to sunlight stress is not an advantage for cyanobacteria compared to eukaryotic phytoplankton. Aquatic Ecol. 53, 347–364. doi: 10.1007/s10452-019-09694-4
Blankenship, R. E. (2014). Molecular Mechanisms of Photosynthesis. 2nd ed.. Chichester, UK: Wiley-Blackwell
Campbell, D., Hurry, V., and Clarke, A. K. (1998). Chlorophyll fluorescence analysis of cyanobacterial photosynthesis and acclimation. Microbiol. Mol. Biol. Rev. 62, 667–683. doi: 10.1128/MMBR.62.3.667-683.1998
Consalvey, M., Perkins, R. G., Paterson, D. M., and Underwood, G. J. C. (2005). Pam fluorescence: a beginners guide for benthic diatomists. Diatom Res. 20, 1–22. doi: 10.1080/0269249X.2005.9705619
Finkel, Z. V., Follows, M. J., Liefer, J. D., Brown, C. M., Benner, I., and Irwin, A. J. (2016). Phylogenetic diversity in the macromolecular composition of microalgae. PLoS One 11:e0155977. doi: 10.1371/journal.pone.0155977
Fischer, W. W., Hemp, J., and Johnson, J. E. (2016). Evolution of oxygenic photosynthesis. Annu. Rev. Earth Planet. Sci. 44, 647–683. doi: 10.1146/annurev-earth-060313-054810
Fletcher, D. A., and Mullins, R. D. (2010). Cell mechanics and the cytoskeleton. Nature 463, 485–492. doi: 10.1038/nature08908
Grossman, A. R., Bhaya, D., Apt, K. E., and Kehoe, D. M. (1995). Light-harvesting complexes in oxygenic photosynthesis: diversity, control, and evolution. Annu. Rev. Genet. 29, 231–288. doi: 10.1146/annurev.ge.29.120195.001311
Hillebrand, H., Acevedo-Trejos, E., Moorthi, S. D., Ryabov, A., Striebel, M., Thomas, P. K., et al. (2022a). Cell size as driver and sentinel of phytoplankton community structure and functioning. Funct. Ecol. 36, 276–293. doi: 10.1111/1365-2435.13986
Hillebrand, H., Antonucci Di Carvalho, J., Dajka, J. C., Dürselen, C. D., Kerimoglu, O., Kuczynski, L., et al. (2022b). Temporal declines in Wadden Sea phytoplankton cell volumes observed within and across species. Limnol. Oceanogr. 67, 468–481. doi: 10.1002/lno.12005
Hillebrand, H., Dürselen, C. D., Kirschtel, D., Pollingher, U., and Zohary, T. (1999). Biovolume calculation for pelagic and benthic microalgae. J. Phycol. 35, 403–424. doi: 10.1046/j.1529-8817.1999.3520403.x
Hockin, N. L., Mock, T., Mulholland, F., Kopriva, S., and Malin, G. (2012). The response of diatom central carbon metabolism to nitrogen starvation is different from that of green algae and higher plants. Plant Physiol. 158, 299–312. doi: 10.1104/pp.111.184333
Karlusich, J. J. P., Ibarbalz, F. M., and Bowler, C. (2020). Phytoplankton in the Tara Ocean. Annu. Rev. Mar. Sci. 12, 233–265. doi: 10.1146/annurev-marine-010419-010706
Kiørboe, T. (1993). Turbulence, phytoplankton cell size, and the structure of pelagic food webs. Adv. Mar. Biol. 29, 1–72. doi: 10.1016/S0065-2881(08)60129-7
Kolber, Z. S., Barber, R. T., Coale, K. H., Fitzwateri, S. E., Greene, R. M., Johnson, K. S., et al. (1994). Iron limitation of phytoplankton photosynthesis in the equatorial Pacific Ocean. Nature 371, 145–149. doi: 10.1038/371145a0
Li, W., Yang, M., Wang, B., and Liu, C. Q. (2022). Regulation strategy for nutrient-dependent carbon and nitrogen stoichiometric homeostasis in freshwater phytoplankton. Sci. Total Environ. 823:153797. doi: 10.1016/j.scitotenv.2022.153797
Lund, J. W. G., Kipling, C., and Le Cren, E. D. (1958). The inverted microscope method of estimating algal numbers and the statistical basis of estimations by counting. Hydrobiologia 11, 143–170. doi: 10.1007/BF00007865
Maberly, S. C., and Gontero, B. (2017). Ecological imperatives for aquatic carbon dioxide-concentrating mechanisms. J. Exp. Bot. 68, 3797–3814. doi: 10.1093/jxb/erx201
Malerba, M. E., Palacios, M. M., Palacios Delgado, Y. M., Beardall, J., and Marshall, D. J. (2018). Cell size, photosynthesis and the package effect: an artificial selection approach. New Phytol. 219, 449–461. doi: 10.1111/nph.15163
Maranon, E. (2015). Cell size as a key determinant of phytoplankton metabolism and community structure. Annu. Rev. Mar. Sci. 7, 241–264. doi: 10.1146/annurev-marine-010814-015955
Maranon, E., Cermeno, P., Lopez-Sandoval, D. C., Rodriguez-Ramos, T., Sobrino, C., Huete-Ortega, M., et al. (2013). Unimodal size scaling of phytoplankton growth and the size dependence of nutrient uptake and use. Ecol. Lett. 16, 371–379. doi: 10.1111/ele.12052
Marshall, W. F., Young, K. D., Swaffer, M., Wood, E., Nurse, P., Kimura, A., et al. (2012). What determines cell size? BMC Biol. 10:101. doi: 10.1186/1741-7007-10-101
Menden-Deuer, S., and Lessard, E. J. (2000). Carbon to volume relationships for dinoflagellates, diatoms, and other protist plankton. Limnol. Oceanogr. 45, 569–579. doi: 10.4319/lo.2000.45.3.0569
Mock, T., and Kroon, B. (2002). Photosynthetic energy conversion under extreme conditions—I: important role of lipids as structural modulators and energy sink under n-limited growth in Antarctic Sea ice diatoms. Phytochemistry 61, 41–51. doi: 10.1016/S0031-9422(02)00216-9
Montes-Pérez, J. J., Moreno-Ostos, E., Marañón, E., Blanco, J. M., Rodríguez, V., and Rodríguez, J. (2020). Intermediate-size cell dominance in the phytoplankton community of an eutrophic, estuarine ecosystem (Guadalhorce River, southern Spain). Hydrobiologia 847, 2241–2254. doi: 10.1007/s10750-020-04251-9
Narwani, A., Bentlage, B., Alexandrou, M. A., Fritschie, K. J., Delwiche, C., Oakley, T. H., et al. (2017). Ecological interactions and coexistence are predicted by gene expression similarity in freshwater green algae. J. Ecol. 105, 580–591. doi: 10.1111/1365-2745.12759
Ochs, J., LaRue, T., Tinaz, B., Yongue, C., and Domozych, D. S. (2014). The cortical cytoskeletal network and cell-wall dynamics in the unicellular charophycean green alga Penium margaritaceum. Ann. Bot. 114, 1237–1249. doi: 10.1093/aob/mcu013
Osborne, B. A., and Geider, R. J. (1986). Effect of nitrate-nitrogen limitation on photosynthesis of the diatom Phaeodactylum tricornutum Bohlin (Bacillariophyceae). Plant Cell Environ. 9, 617–625. doi: 10.1111/j.1365-3040.1986.tb01619.x
Raven, J. A. (1984). A cost–benefit analysis of photon absorption by photosynthetic unicells. New Phytol. 98, 593–625. doi: 10.1111/j.1469-8137.1984.tb04152.x
Ryabov, A., Kerimoglu, O., Litchman, E., Olenina, I., Roselli, L., Basset, A., et al. (2021). Shape matters: the relationship between cell geometry and diversity in phytoplankton. Ecol. Lett. 24, 847–861. doi: 10.1111/ele.13680
Stanier, R. Y., and Cohen-Bazire, G. (1977). Phototrophic prokaryotes: the cyanobacteria. Annu. Rev. Microbiol. 31, 225–274. doi: 10.1146/annurev.mi.31.100177.001301
Stuart, V., Sathyendranath, S., Platt, T., Maass, H., and Irwin, B. D. (1998). Pigments and species composition of natural phytoplankton populations: effect on the absorption spectra. J. Plankton Res. 20, 187–217. doi: 10.1093/plankt/20.2.187
Tan, L., Xu, W., He, X., and Wang, J. (2019). The feasibility of Fv/Fm on judging nutrient limitation of marine algae through indoor simulation and in situ experiment. Estuar. Coast. Shelf Sci. 229:106411. doi: 10.1016/j.ecss.2019.106411
Tetsuichi, F., and Satoru, T. (2002). Variability in chlorophyll a specific absorption coefficient in marine phytoplankton as a function of cell size and irradiance. J. Plankton Res. 24, 859–874. doi: 10.1093/plankt/24.9.859
Verity, P. G., Robertson, C. Y., Tronzo, C. R., Andrews, M. G., Nelson, J. R., and Sieracki, M. E. (1992). Relationships between cell volume and the carbon and nitrogen content of marine photosynthetic nanoplankton. Limnol. Oceanogr. 37, 1434–1446. doi: 10.4319/lo.1992.37.7.1434
Wang, B., Liu, C. Q., Peng, X., and Wang, F. (2013). Mechanisms controlling the carbon stable isotope composition of phytoplankton in karst reservoirs. J. Limnol. 72, 11–139. doi: 10.4081/jlimnol.2013.e11
Wang, Y., Stessman, D. J., and Spalding, M. H. (2015). The CO2 concentrating mechanism and photosynthetic carbon assimilation in limiting CO2: how Chlamydomonas works against the gradient. Plant J. 82, 429–448. doi: 10.1111/tpj.12829
Xiao, J., Wang, B., Qiu, X. L., Yang, M., and Liu, C. Q. (2021). Interaction between carbon cycling and phytoplankton community succession in hydropower reservoirs: evidence from stable carbon isotope analysis. Sci. Total Environ. 774:145141. doi: 10.1016/j.scitotenv.2021.145141
Keywords: cell size, light energy conversion, metatranscriptome, molecular regulatory mechanism, phytoplankton, transcriptome
Citation: Li W, Wang B, Xiao J, Yang M, Xu S and Liu C-Q (2022) Phytoplankton cell size control can be affected by photosynthetic light energy utilization. Front. Microbiol. 13:1008606. doi: 10.3389/fmicb.2022.1008606
Edited by:
Susana Agusti, King Abdullah University of Science and Technology, Saudi ArabiaReviewed by:
Xin Liu, Xiamen University, ChinaCopyright © 2022 Li, Wang, Xiao, Yang, Xu and Liu. This is an open-access article distributed under the terms of the Creative Commons Attribution License (CC BY). The use, distribution or reproduction in other forums is permitted, provided the original author(s) and the copyright owner(s) are credited and that the original publication in this journal is cited, in accordance with accepted academic practice. No use, distribution or reproduction is permitted which does not comply with these terms.
*Correspondence: Baoli Wang, YmFvbGkud2FuZ0B0anUuZWR1LmNu
Disclaimer: All claims expressed in this article are solely those of the authors and do not necessarily represent those of their affiliated organizations, or those of the publisher, the editors and the reviewers. Any product that may be evaluated in this article or claim that may be made by its manufacturer is not guaranteed or endorsed by the publisher.
Research integrity at Frontiers
Learn more about the work of our research integrity team to safeguard the quality of each article we publish.