 Andrei V. Gannesen1*
 Rustam H. Ziganshin2
 Evelina L. Zdorovenko3
 Alena I. Klimko4Elena A. Ianutsevich1Olga A. Danilova1Vera M. Tereshina1Maxim V. Gorbachevskii5Maria A. Ovcharova1Ekaterina D. Nevolina1Sergey V. Martyanov1Alexander S. Shashkov3Andrey S. Dmitrenok3
 Andrei A. Novikov5
 Marina V. Zhurina1
 Ekaterina A. Botchkova1,5Philipp V. Toukach3
 Vladimir K. Plakunov1
- 1Winogradsky Institute of Microbiology, Federal Research Center “Fundamentals of Biotechnology” of Russian Academy of Sciences, Moscow, Russia
- 2Shemyakin and Ovchinnikov Institute of Bioorganic Chemistry, Russian Academy of Sciences, Moscow, Russia
- 3N.D. Zelinsky Institute of Organic Chemistry, Russian Academy of Sciences, Moscow, Russia
- 4Faculty of Biology, Lomonosov Moscow State University, Moscow, Russia
- 5Faculty of Chemical and Environmental Engineering, Gubkin University, Moscow, Russia
The importance of the impact of human hormones on commensal microbiota and microbial biofilms is established in lots of studies. In the present investigation, we continued and extended the research of epinephrine effects on the skin commensal Micrococcus luteus C01 and its biofilms, and also the matrix changes during the biofilm growth. Epinephrine in concentration 4.9 × 10⁻⁹ M which is close to normal blood plasma level increased the amount of polysaccharides and extracellular DNA in the matrix, changed extensively its protein, lipid and polysaccharide composition. The Ef-Tu factor was one of the most abundant proteins in the matrix and its amount increased in the presence of the hormone. One of the glucose-mannose polysaccharide was absent in the matrix in presence of epinephrine after 24 h of incubation. The matrix phospholipids were also eradicated by the addition of the hormone. Hence, epinephrine has a great impact on the M. luteus biofilms and their matrix composition, and this fact opens wide perspectives for the future research.
Introduction
Biofilms are considered as a common mode of existence for bacteria and other microorganisms; they are encountered in most natural and artificial environments, including the human body and particularly the skin. The extracellular matrix is an integral part of the biofilm and plays a key role in its growth, metabolism, and maintenance (Singh et al., 2021). Recently, the term “matrixome” was introduced to define the chemical composition of the matrix and highlight its importance for biofilm maintenance (Karygianni et al., 2020). Micrococcus luteus, as a regular part of the skin microbiota, can also form biofilms in different microniches of the skin (Lange-Asschenfeldt et al., 2011), where it interacts with other microbes in a commensal community and participates in the maintenance of skin homeostasis (Clabaut et al., 2021; Mart’yanov et al., 2021; Ovcharova et al., 2021; Diuvenji et al., 2022; Kiseleva et al., 2022; Scardaci et al., 2022).
Recently, a great deal of evidence has been obtained regarding the impact of hormones on the commensal bacteria found on the skin. Catecholamines (Borrel et al., 2019), neuropeptides (N’Diaye et al., 2016), steroids (Clabaut et al., 2021; Kiseleva et al., 2022) and natriuretic peptides (Gannesen et al., 2018a) seem to act as effectors on the skin and mucosal microbial community. It has been shown that the effect of some hormones is based on interactions with receptor analogs (as was suggested for C-type natriuretic peptide and Pseudomonas aeruginosa by Rosay et al., 2015) or with whole-signal systems (as was described for Escherichia coli and catecholamines by Reading et al., 2007). Hence, the effect of human humoral regulators on bacteria seems to be multitargeted and complex, since they can potentially alter bacterial metabolism via different signaling pathways. These results are supported by recent studies showing the dose-dependent effect of natriuretic peptides (Gannesen et al., 2018b; Ovcharova et al., 2021) and catecholamines (Gannesen et al., 2021; Mart’yanov et al., 2021) on the skin commensals Staphylococcus epidermidis, Cutibacterium acnes, Staphylococcus aureus, and M. luteus. These effects could potentially alter matrix composition.
Recently, it was found that epinephrine impacts the growth of the biofilm of M. luteus C01, isolated from human skin (Danilova et al., 2020; Gannesen et al., 2021), at concentrations close to the physiological norm in human blood plasma (4.9 × 10⁻⁹ M; Boyanova, 2017). The effect was complex and included shifts in the expression of several genes; it was suggested that alterations in the biofilm matrix were potentially key effects. To prove this, we decided to analyze potential matrix changes using the methods employed in our recent study (Gannesen et al., 2019). The biofilm matrix of M. luteus has not been studied in depth. It is known that it consists of mostly exopolysaccharides and proteins (Mauclaire and Egli, 2010), which are common components in the vast majority of bacteria. Thus, the present study aimed first to investigate the composition of the matrix itself and second to determine if the presence of 4.9 × 10⁻⁹ M epinephrine could change that composition.
Materials and methods
Preparation of cultures and biofilm growth
The M. luteus C01 strain was isolated from the skin of a healthy volunteer and characterized using 16S rRNA sequencing (Zhurina et al., 2017). It was stored at room temperature in glass tubes with 5 ml of semi-liquid lysogeny broth (LB) with 0.4% agar and covered with sterile mineral oil. For the experiments, a portion of biomass from a tube was plated on a Petri dish with 1.5% agarized reinforced clostridial medium (RCM). The RCM liquid was composed of (in g/L) yeast extract (Dia-M, Russia) 13; peptone (Dia-M, Russia) 10; glucose (Dia-M, Russia) 5; sodium chloride (Dia-M, Russia) 5; sodium acetate (Dia-M, Russia) 3; starch (Dia-M, Russia) 1; cysteine hydrochloride (BD, United States) 0.5; pH 7.0. After incubation at 33°C (the temperature of the skin microniche inhabited by M. luteus) for 48 h, a colony was inoculated in 15 ml of liquid LB in a 50 ml conical flask and cultivated overnight at 33°C.
For biofilm growth, 20 ml of RCM with 1.5% agar and 4.9 × 10⁻⁹ M (4.9 nM) epinephrine (physiological blood plasma concentration; Boyanova, 2017) were added to Petri dishes; controls without the hormone were also prepared. A 90 mm circle cellulose filter was placed onto the agar surface, and 0.5 ml of the overnight culture with an OD540 value adjusted to 0.5 was inoculated onto the filter and spread with a sterile glass spatula. Afterward, the biofilms were grown for 24 h or 72 h to obtain young and mature biofilms, respectively. After incubation, the biomass was collected into a 50 ml conical centrifuge tube (Falcon, United States) and the wet biomass was weighed to adjust the for the matrix amounts in subsequent experiments.
Matrix isolation
After weighing, the biofilm biomass was transferred into 50 ml conical tubes (Corning, United States) and resuspended in distilled water. Then, the samples were placed into an ice bath and sonicated for 10 min with a Sonyprep 105 Plus (MSE, GB) using the appropriate titanium horn (rod or exponential, depending on the sample volume) at an amplitude of 7.3 or 10.1 μm, respectively. After sonication, the samples were transferred into polypropylene ultracentrifuge tubes (Beckman, United States) and layered onto the CsCl gradient solution. The CsCl gradient was prepared as described previously (Gannesen et al., 2019). Briefly, four CsCl solutions (46%, 28%, 14%, and 7%) were layered, and the sample was added to the top of the tube. The samples were centrifuged in an Avanti-J30I (Beckman, United States) ultracentrifuge at 100,000 × g and RT for 1 h. After, to avoid the contamination of the matrix with cells, the supernatant was transferred into new conical tubes, and any cells carried over during the supernatant transfer were additionally removed by centrifugation at 3,800 × g and RT for 20 min. Before analysis, the matrix samples were dialyzed in bags with a pore size of 0.1- to 0.5 kDa (Spectrum Repligen, United States) to remove CsCl.
Complementary biofilm extraction test
To ensure that the matrix isolation was successful and that no cells were destroyed and lysed during the isolation process, an LDH test was performed using a standard LDH assay kit (Vital, Russia). This assay was chosen because LDH is a mostly intracellular enzyme that is also found in M. luteus (the data were deposited with links to BioProject accession number PRJNA564862 in the NCBI BioProject database1). The LDH reaction used in this study can be quantified based on a decrease in the OD340 of the samples in the presence of the substrate. A greater decrease indicates a more active reaction, and thus more LDH in the sample, which denotes a higher level of cell disruption. The cell suspensions were adjusted to have the same OD340 value as the matrix, and a standard protocol was used to compare the resulting OD values in a 96-well plate.
Quantification of total organic carbon in the Micrococcus luteus C01 biofilm matrix
The total organic carbon content of the matrix was measured using the wet mineralization method based on the classic method described previously (Walkley, 1947; Gannesen et al., 2019). Briefly, 14.71 g of potassium dichromate (Reachim, Russia) was dissolved in 150 ml of MQ water and 100 ml of 96% sulfuric acid (SA, Reachim, Russia) was added. The matrix samples were diluted 10 times, and 1 ml of each diluted sample was mixed with 3 ml of reagent mix and incubated in a boiling water bath (100°C). In parallel, a series of glucose solutions of various concentrations (10–2,000 μg/ml in MQ water) were prepared to make calibration curves. After boiling for 90 min, the samples were cooled and their OD590 values were measured. The total organic carbon content was quantified on the basis of a carbon mass proportion of 40% in glucose (the molecular mass of glucose is 180 g/mol, of which carbon is 72 g/mol).
Quantification of reducing sugars and proteins in the matrix
The concentration of reducing sugars, as a marker of total carbohydrates, was measured using the anthrone method, as described previously (Dreywood, 1946; Gannesen et al., 2019). Briefly, 0.2 g of anthrone (Sigma, United States) was dissolved in 100 ml of 96% SA (Reachim, Russia) to prepare the anthrone reagent. Standard glucose solutions were prepared for calibration curves. One gram of glucose (Dia-M, Russia) was dissolved in 100 ml of a benzoic acid solution made by dissolving 2.5 g of benzoic acid in 1 L of MQ water. The standard glucose solutions were stored at 4°C in the dark. The matrix samples were diluted 10-fold in MQ water. A double volume of the reagent was added to each sample, and the samples were mixed and heated at 100°C for 16 min. In parallel, the same reaction was performed using a series of glucose solutions (made from a standard solution) with concentrations ranging from 5 to 50 μg/ml. MQ water was used as a negative control. After incubation, the tubes were cooled to RT and the OD625 values were estimated. Finally, the concentration of reducing sugars was calculated using the calibration curve.
Proteins were quantified using the Bradford method as described in Bradford (1976). Standard Bradford reagent (Sigma) and bovine serum albumin (BSA, Sigma) were used.
Detection of DNA concentration in the matrix
The DNA concentration in the matrix was estimated using the Dische method (Dische, 1930). This method is based on the reaction of desoxyribose with diphenylamine in acetic acid. When heated, levulinic aldehyde is produced, which then condenses with diphenylamine to form a colored compound. Briefly, the diphenylamine solution was prepared by dissolving 1 g of diphenylamine (Sigma) in 100 ml of pure acetic acid (Sigma, United States). Then, 2.75 ml of 96% SA was added. A calibration series of standard DNA solutions (50–500 μg/ml) was then prepared using herring sperm DNA (Sigma), and the matrix samples were prepared for analysis. All samples (2 ml) were distributed into glass tubes. Then, a double amount of Dische reagent (4 ml) was added, and the samples were heated for 15 min at 100°C in a water bath. The OD595 values were measured after cooling. MQ water was used as a control.
Extraction of lipids from the biofilm cells and matrix
A sample of wet biomass was homogenized in isopropanol (Rushim, Russia) and incubated at 70°C for 30 min (Nichols, 1963). After decanting the supernatant, the pellet was extracted twice at 70°C with an isopropanol–chloroform mixture (1:1, and once with 1:2). The total final extract was evaporated in a rotary evaporator, and the residue was dissolved in 9 ml of chloroform–methanol (Rushim, Russia) mixture (1:1) with the addition of 12 ml 2.5% NaCl for the removal of water-soluble compounds. After phase separation, the chloroform layer was dried by passing through water-free sodium sulfate, evaporated, and desiccated with a vacuum pump. The residue was dissolved in a chloroform–methanol mixture (2:1) and stored at −21°C.
To extract lipids from the matrix, 20 ml of matrix suspension was mixed with 20 ml of the chloroform–methanol mixture (2:1). The mixture was vortexed for 30 s and left for 30 min at room temperature for phase separation. The lower chloroform phase was isolated after the aqueous phase was extracted twice by the addition of 10 ml of chloroform in the same conditions. Fifty milliliters of 2.5% NaCl was added to the total extract, and the mixture was kept overnight at 4°C for the removal of water-soluble compounds and phase separation. After, the chloroform layer was dried by passing through water-free sodium sulfate, evaporated, and desiccated with a vacuum pump. The residue was dissolved in the chloroform–methanol mixture (2:1) and stored at −21°C.
The separation of polar lipids was conducted using two-dimensional thin-layer chromatography on silica gel 60 glass plates (Merck) in the following systems: chloroform–methanol–water (65:25:4) in the first direction and chloroform–acetone–methanol–acetic acid–water (50:20:10:10:5) in the second direction (Benning et al., 1995). A total of 200–250 μg of lipids was applied to a plate. Neutral lipids were analyzed using one-dimensional thin-layer ascending chromatography on 10 × 10 cm silica gel 60 glass plates (Merck, Germany). For lipid separation, a hexane–diethyl ether–acetic acid (77:23:1) solvent system was used. A total of 125 μg of lipids was applied to a glass plate.
To determine the general composition of polar and neutral lipids, components were visualized by spraying the plates with 5% H2SO4 (Rushim) in ethanol (v/v) followed by heating for 15 min at 180°C. For the identification of polar lipids, individual standard compounds were used and reactions with molybdene blue dye were conducted according to the modified Dittmer and Lester method (Vaskovsky et al., 1975) for phospholipids. Additionally, a reaction with ninhydrin was performed to identify aminolipids, an α-naphthol test was used for glycolipids, and Dragendorff’s reagent was used to detect choline (Kates, 1972). The individual phospholipid standards used were phosphatidylethanolamines, phosphatidylcholines, phosphatidylglycerols, and diphosphatidylglycerols (Larodan, Sweden). Neutral lipids were identified using individual markers for sterols; mono-, di-, and triacylglycerols; and free fatty acids (Sigma, United States).
Orbitrap mass spectrometry investigation of the Micrococcus luteus C01 matrix proteome
Protein samples from the matrix were prepared for Orbitrap mass spectrometry (MS). First, the matrix samples were dialyzed in bags with a pore size of 0.1- to 0.5 kDa (Spectrum Repligen, United States) to remove CsCl. Then, the samples were mixed with acetone (4 × volume) and incubated for 10 min at RT to precipitate the proteins. After precipitation, the samples were centrifuged at RT and 15,000 × g for 30 min to collect the proteins. The liquid supernatant was removed, and the samples were transferred into sterile microcentrifuge tubes (Eppendorf, Germany) and air-dried at room temperature. For the MS experiments, the samples were loaded to a homemade trap column (20 × 0.1 mm) packed with Inertsil ODS3 3 m sorbent (GL Sciences, Japan) in loading buffer (2% acetonitrile, 98% H2O, and 0.1% trifluoroacetic acid) at 10 μl/min flow and separated at RT in a homemade (Kovalchuk et al., 2019) fused-silica column (300 × 0.1 mm) packed with Reprosil PUR C18AQ 1.9 (Dr. Maisch, Germany) into an emitter prepared with a P2000 Laser Puller (Sutter, United States). Reverse-phase chromatography was performed using an Ultimate 3000 Nano LC System (ThermoFisher, United States), which was coupled to a Q Exactive Plus Orbitrap mass spectrometer (ThermoFisher, United States) via a nanoelectrospray source (ThermoFisher, United States). The peptides were loaded in a loading solution [98% 0.1% (v/v) formic acid and 2% (v/v) acetonitrile] and eluted with a linear gradient as follows: 3–35% solution B [0.1% (v/v) formic acid and 80% (v/v) acetonitrile] for 105 min; 35–55% B for 18 min; 55–99% B for 0.1 min; 99% B for 10 min; and 99–2% B for 0.1 min at a flow rate of 500 nl/min. After each gradient, the column was re-equilibrated with solution A [0.1% (v/v) formic acid and 2% (v/v) acetonitrile] for 10 min. The MS1 parameters were as follows: resolution of 70K, scan range of 350–2000, max injection time of 30 ms, and AGC target of 3 × 10⁶. Ions were isolated with 1.4 m/z window via preferred peptide match and isotope exclusion. Dynamic exclusion was set to 30 s. MS2 fragmentation was carried out in HCD mode at a resolution of 17,5K, HCD collision energy of 29%, max injection time of 80 ms, and AGC target of 1 × 10⁵. The charge exclusion was unassigned (1, >7).
Raw spectra were processed using the MaxQuant 1.6.6.0 (MQ) (Tyanova et al., 2016a) and Perseus (Tyanova et al., 2016b) software. The data were searched against the Micrococcus luteus UniProt Tremble database, which contains canonical and isoform proteins (version from 15.03.2021).
A MaxQuant search was performed using the default parameter settings, including trypsin/p protease specificity, maximum two missed cleavages, Met oxidation, protein N-term acetylation, and NQ deamidation, as variable modifications and carbamidomethyl Cys as a fixed modification, with a maximum of five modifications per peptide, 1% PSM, and protein FDR. The following options were selected: second peptide, maxLFQ, and match between runs. All runs were analyzed as independent experiments and processed in Perseus (Tyanova et al., 2016a,b).
Using the Perseus software, protein groups were filtered for contaminants, i.e., reverse and “identified only by site” proteins. Only the proteins with maxLFQ values in at least three out of seven LC-MS runs were used. The missing values were imputed from a normal distribution with an intensity distribution sigma width of 0.3 and an intensity distribution center downshift of 1.8. A two-sample t-test with a permutation-based FDR of 5% was applied to search for significantly changed proteins.
A gene ontology analysis was also performed using the UniProt online resources.
Data are available via ProteomeXchange with identifier PXD035739.
Surface-enhanced Raman spectroscopy of the Micrococcus luteus C01 matrix
Surface-enhanced Raman spectroscopy is a powerful method for the non-destructive study of organic samples, particularly bacterial biofilms (Chao and Zhang, 2012). With suitable active substrates and near-infrared excitation, it is possible to register the Raman signals of characteristic bacterial substances [nicotinamide adenine dinucleotide (NAD)-like redox complexes, proteins, etc.] (Efrima and Zeiri, 2009) and discriminate between bacteria, at least at the genus level (Kopitsyn et al., 2019). Surface-enhanced Raman scattering (SERS) substrates were prepared as described elsewhere (Gorbachevskii et al., 2018; Kopitsyn et al., 2019).
Surface-enhanced Raman scattering was used in this study to obtain the spectra of M. luteus C01 biofilms and verify successful matrix extraction. The intact biomass of the biofilms, cell biomass after matrix extraction, and isolated biofilm matrix of M. luteus C01 were used for SERS analysis. The biomass (intact and after matrix extraction) of M. luteus C01 was washed three times with acetone and dried at RT. Before SERS analysis, dry samples were washed twice with a 0.9% NaCl solution. The pellets were resuspended, centrifuged at 3,000 × g, and kept at RT for 10 min before analysis.
Nanoparticles were characterized using transmission electron microscopy (TEM) and scanning electron microscopy (SEM). For TEM, 5 μL of a nanoparticle suspension was placed on a TEM grid (Ted Pella, Redding, CA, United States) and dried at RT. TEM images were obtained using a JEM-2100 microscope (Jeol) with an acceleration voltage of 200 kV. SEM images were obtained using a JIB-4501 microscope (Jeol).
Surface-enhanced Raman scattering spectra were registered using a BWS415 spectrophotometer (BWTEK). Samples were placed on an XYZ stage, and the laser position was controlled via a USB-connected Mikmed-2000R microscope (Micromed). Various substrates based on gold nanomaterials were tested to register the SERS signals.
Isolation of matrix polysaccharides
The matrix of M. luteus C01 was dialyzed against distilled water in small-pore bags. After dialysis, an aliquot of trichloroacetic acid was added to the matrix sample to establish a final pH of 2.0 for nucleic acid and protein sedimentation.
The polysaccharide preparations were fractionated using anion-exchange chromatography on a column (20 × 1 cm) of DEAE-Trisacryl M with a stepwise gradient of 0.005, 0.1, and 0.5 M hydrogen sodium phosphate, pH 6.3. As result, two fractions were obtained: one eluted in 0.5 M buffer and the other eluted in 0.1 M buffer.
Chemical methods
Hydrolysis was performed with 2 M CF3CO2H (120°C, 2 h). The monosaccharides were analyzed using GLC as alditol acetates (Sawardeker et al., 1965) on a Maestro 7820 GC instrument (Interlab, Russia) equipped with an HP-5 ms column with the following temperature program: 160°C (1 min) to 290°C at 7°C per min. The absolute configurations of the monosaccharides were determined via GLC of the acetylated (S)-2-octyl glycosides as described previously (Leontein and Lönngren, 1993).
Nuclear magnetic resonance spectroscopy
Nuclear magnetic resonance (NMR) spectra were recorded for the solutions in 99.9% D2O after deuterium exchange by freeze-drying from 99.9% D2O. A ROESY experiment was also carried out in a 9:1 D2O/H2O mixture. Spectra were measured with Bruker DRX-500 and Bruker Avance II 600 spectrometers with a 5 mm broadband inverse probehead at 30°C. Sodium 3-(trimethylsilyl)propanoate-2,2,3,3-d4 (δH 0.0, δC -1.6) was used as an internal standard for chemical shift reference. Two-dimensional NMR experiments were performed using the standard Bruker pulse programs. The 2D TOCSY and ROESY spectra were recorded with a 60 ms duration of MLEV 17 spinlock and a 150 ms mixing time. The gradient-selected 1H,13C HMBC spectrum was recorded with a 60 ms delay for the evolution of long-range spin couplings.
Smith degradation
A PS sample (14 mg) was oxidized with 0.1 M NaIO4 in the dark at 20°C for 48 h. After the addition of an excess of ethylene glycol, the products were reduced with NaBH4, desalted with GPC on a column (80 × 1.6 cm) of TSK HW-40 (S) in water monitored using a differential refractometer (Knauer, Germany), and hydrolyzed with aq 2% AcOH at 100°C for 2 h. The products were fractionated using GPC on a column of TSK HW-40 (S) as above to produce PS III (2 mg).
The 13C NMR chemical shifts were analyzed and compared to published values using GODDESS (Kapaev and Toukach, 2016) and GRASS NMR (Kapaev and Toukach, 2018) simulation, and structure elucidation web services from the Carbohydrate Structure Database platform were also implemented (Toukach and Egorova, 2016).
Statistics
All the experiments were conducted at least in triplicate. In the tables, where applicable, an average value is presented with standard deviations. A t-test was used for statistical evaluation.
Results
Biofilm matrix isolation and complementary extraction test
After centrifugation, the M. luteus C01 biofilm matrix solution consisted of two parts, which were conditionally labeled as the “upper phase” and “lower phase” (Figure 1 and Supplementary Figure 1). Generally, the visual appearance of the matrix was similar to that observed in a previous study (Gannesen et al., 2019). Figure 1 depicts a scheme of the mature 72 h biofilms. In case of the 24 h immature biofilms, the scheme was the same with slight changes in the proportions of biomass added (less volume of biomass and the lower phase). In addition, in the 24 h supernatants, the lower phase was more colored (Supplementary Figure 1B). The additional centrifugation of the lower phase allowed for the decantation of the turbid suspension; thus, this observation could be due a fraction of smaller cell aggregates or single cells that were unable to pass through the dense CsCl solution due to their relatively low mass.
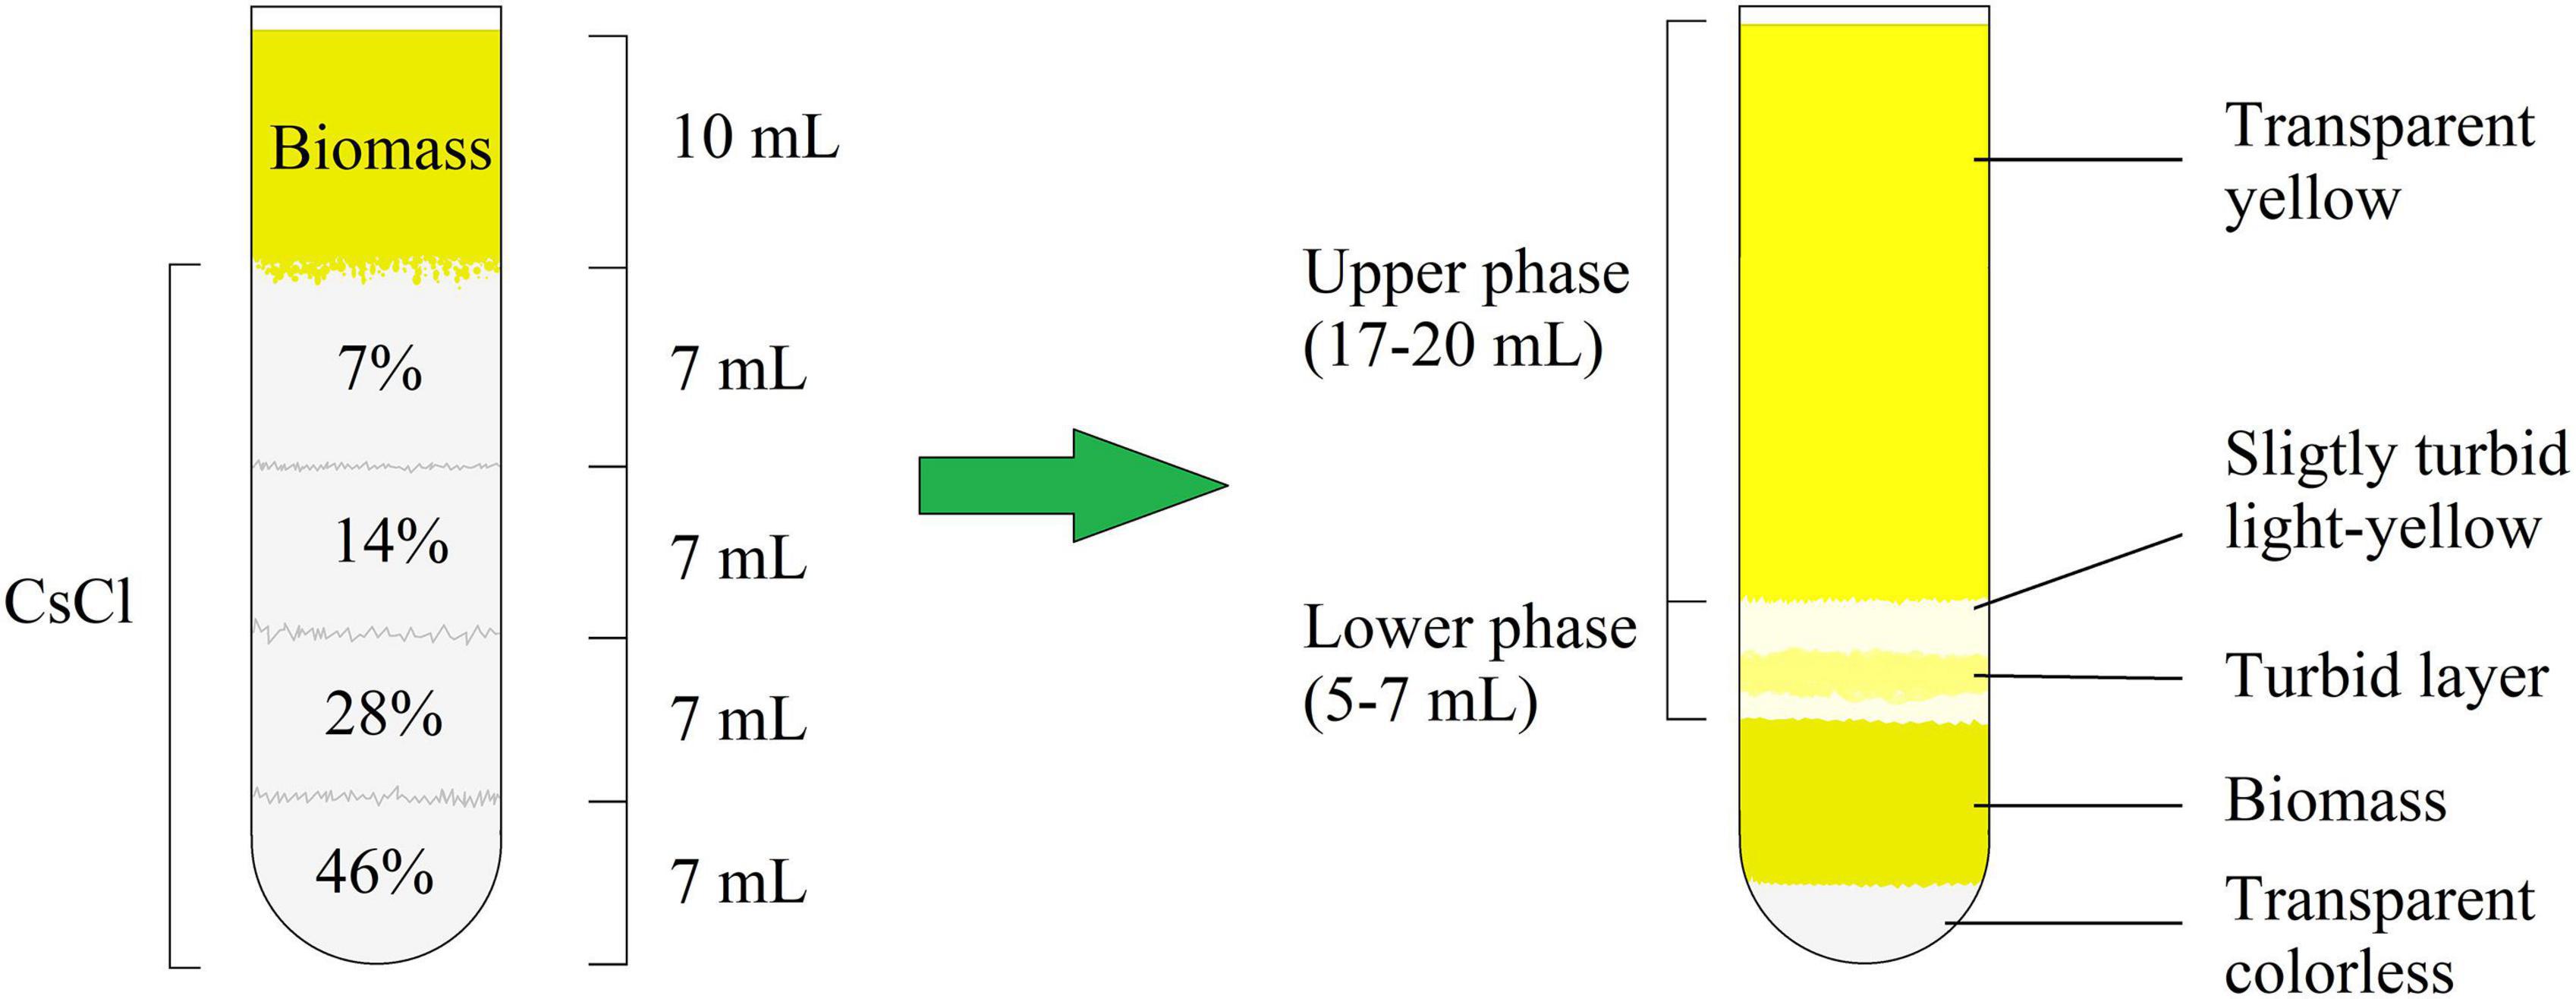
Figure 1. CsCl gradient formation and biofilm matrix following extraction after 72 h of incubation.
The LDH test demonstrated a rather weak reaction in the samples (Figure 2). Nevertheless, the differences between the cell suspensions and matrix samples were well established. After 24 h of incubation, the cell biomass samples, both the control and in the presence of epinephrine, showed a higher rate of the reaction (Figure 2A), while the matrix samples were inactive or had a much slower rate. After 72 h of incubation (Figure 2B), the reaction results were same, except the control cell biomass exhibited a slower rate than in the 24 h samples. This potentially could be explained by the metabolic activity ratio of the biofilm cells. Since the matrix samples had a reaction rate different from that of the cell biomass samples, it was established that the pure matrix fraction was obtained in all our experiments.
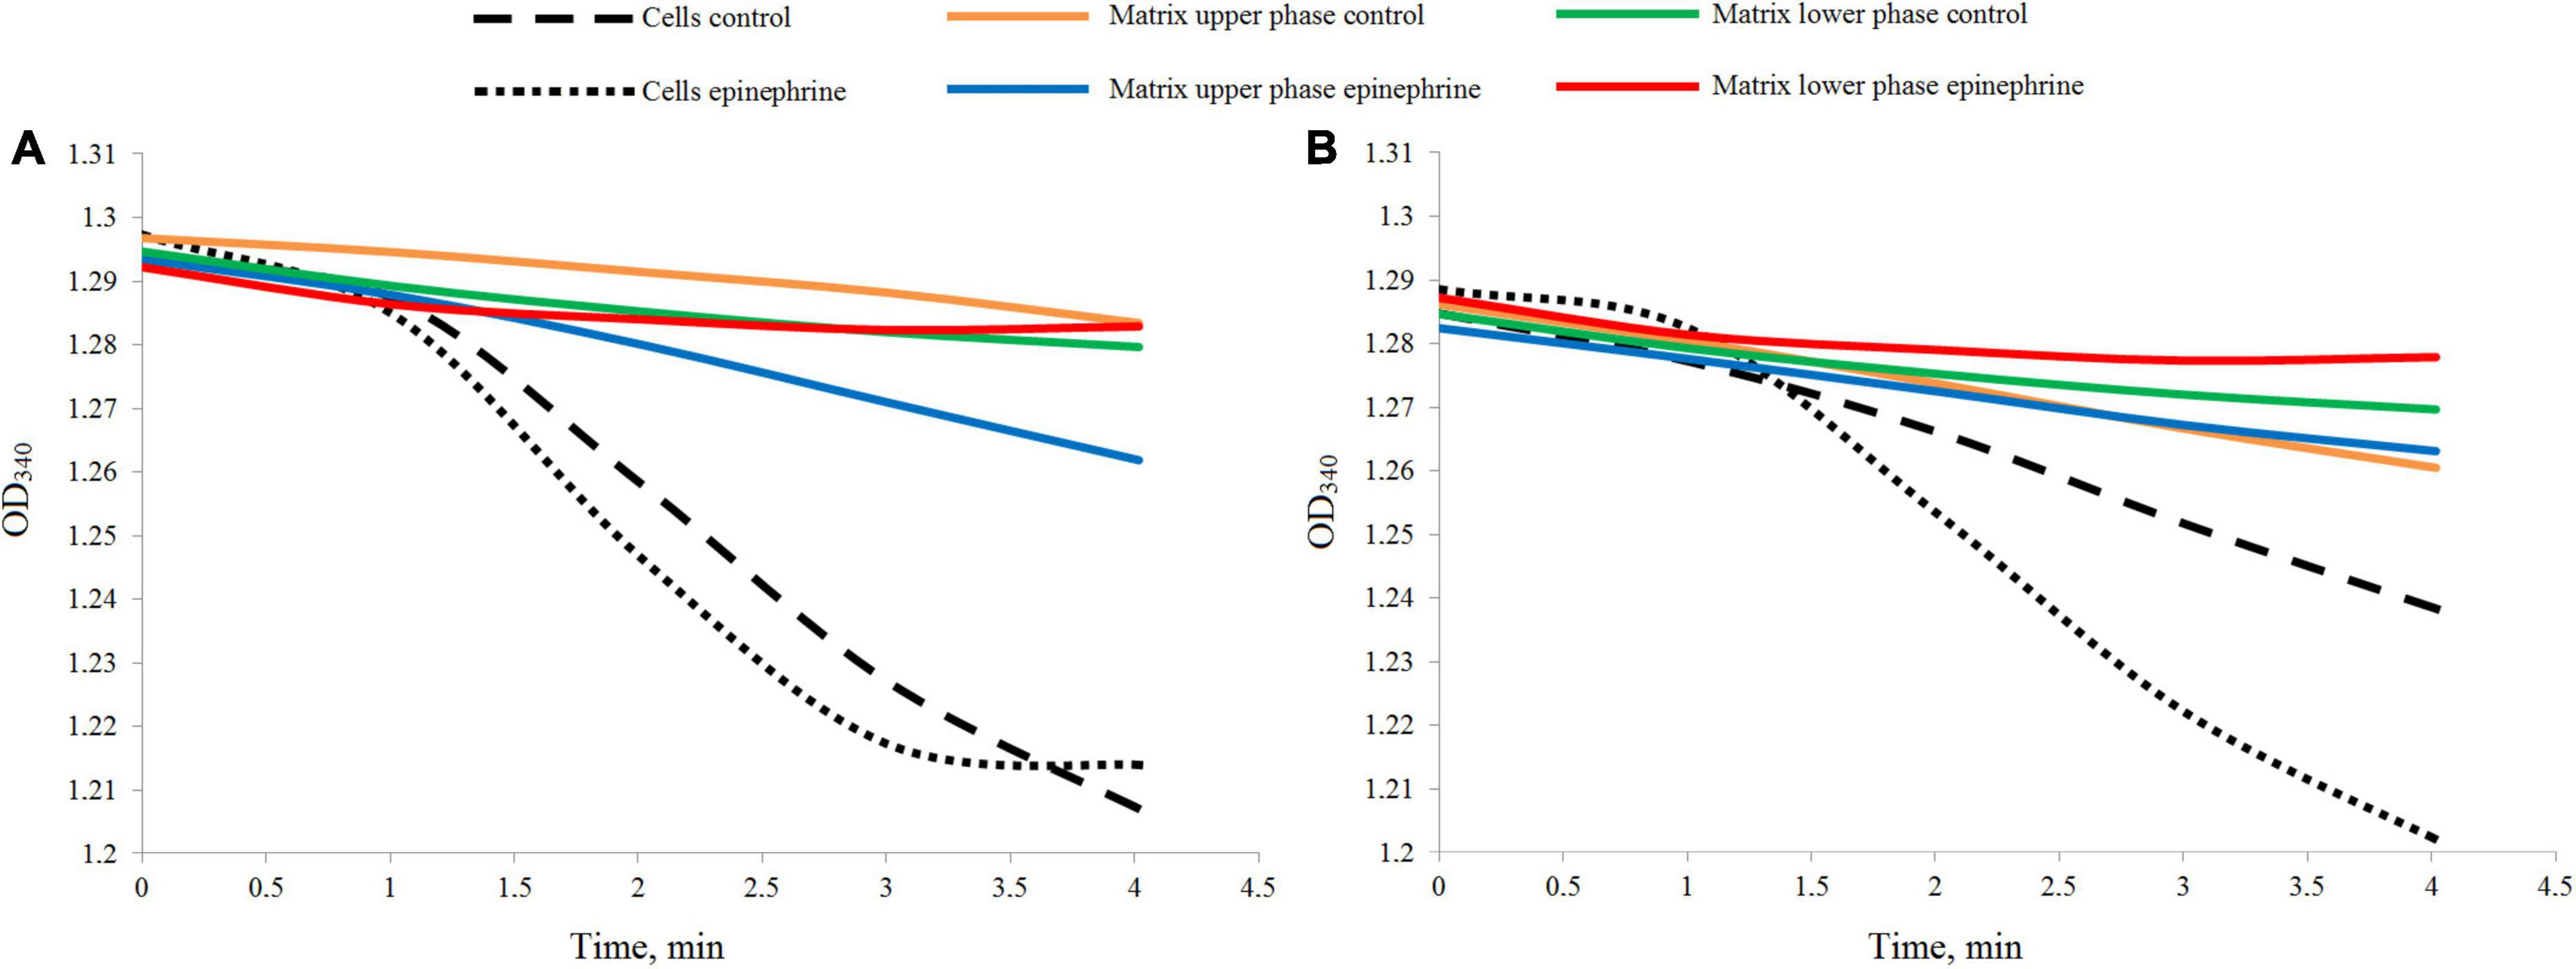
Figure 2. Differences in the dynamics of the LDH reaction measured in the biofilm cell biomass and matrix samples. (A) Samples after 24 h of incubation. (B) Samples after 72 h of incubation.
Additionally, we carried out a microscopy study of cell disruption after sonication and matrix isolation (Supplementary Figure 2). We found that after sonication, there was no visible cell disruption, and even cell aggregates remained intact (Supplementary Figure 2B); however, there were more single cells that were stained with less intensity (Supplementary Figure 2C). This could be a result of partial matrix removal from the cell aggregates’ surface. After centrifugation, M. luteus C01 cells were also found in a turbid layer above the cell biomass (Supplementary Figure 2D).
General biochemical composition of the Micrococcus luteus C01 matrix
The results of the quantitative biochemical tests (DNA, proteins, sugars, total organic carbon) demonstrated that the matrix consists of all the main polymer types (Table 1). The most abundant component was a polysaccharide compartment of the matrix, the second were proteins and finally DNA. All the components varied depending on the matrix phase, incubation time and the presence of epinephrine. Interesting that epinephrine increased the absolute amount of total organic carbon (TOC) and lower molecular weight sugars in mature biofilm. Despite that, the percentage of those compounds did not change probably due to the high amount of other organics (especially pigments), because of less than a half of a total organic mass of the matrix were sugars, DNA and proteins. Nevertheless, the previous hypothesis of matrix synthesis stimulation (Gannesen et al., 2021) was approved. If calculate approximately, the amount of dry matrix in experiments oscillated from 20 to 50 mg after the dialysis.
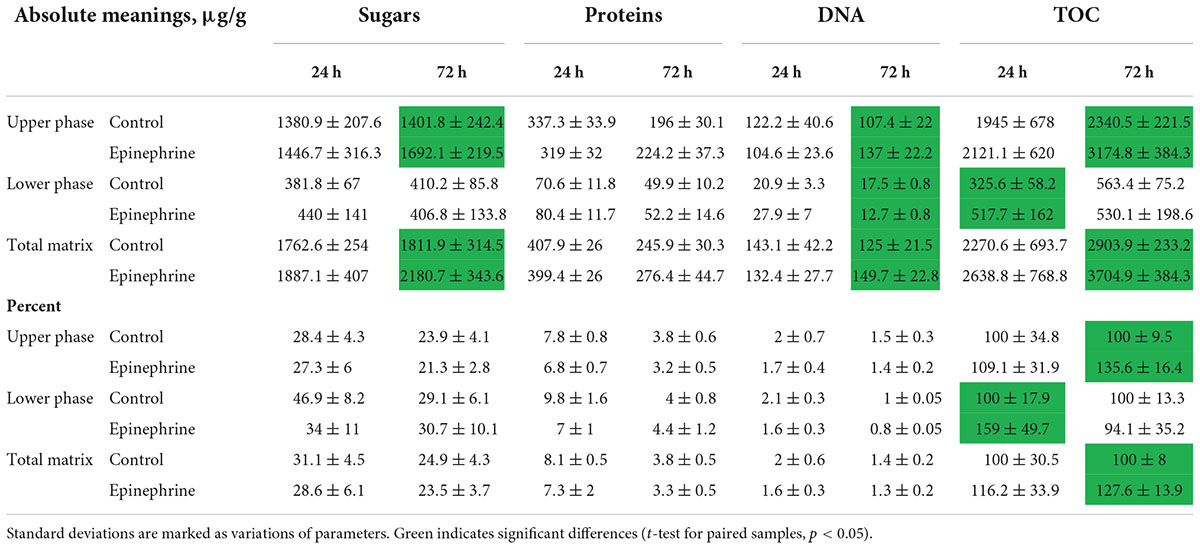
Table 1. Biochemical composition of M. luteus C01 matrix in the presence of epinephrine and in control samples.
Proteomic analysis of Micrococcus luteus C01 biofilm matrix
In total, 727 proteins were identified in the biofilm matrix of M. luteus C01 under the different conditions. Four dominating groups of proteins were identified according to the gene ontology analysis: catalytic, binding, cell anatomy, and metabolic compartment. Hence, the addition of epinephrine had an impact mostly on these protein groups. Catalytic compartment proteins include those with oxidoreductase, transferase, and hydrolase activities. In this study, ion-binding proteins were the largest group in the catalytic compartment. Membrane proteins were considerably more well-represented than cytoplasm proteins (277 and 59, respectively), and proteins involved in different metabolic pathways were the least represented group. Interestingly, that alpha and beta subunits of ATP synthase, the UPF0182 protein (predicted protein export machinery, Vergara et al., 2020), and succinate dehydrogenase were the most abundant proteins in the matrix (Supplementary Table 1). The elongation factor EF-Tu was one of the most abundant proteins (Supplementary Table 1), and it is worth noting that its concentration increased significantly during the incubation with epinephrine (Supplementary Table 2). A comparison of protein lists in different conditions showed that the increase in EF-Tu was caused by the addition of epinephrine and was not associated with biofilm maturation. In the total proteome, 94 proteins—frequently associated with membranes—were uncharacterized. The maturation of M. luteus C01 biofilms led to an increase in the concentration of the chaperone DnaK in the matrix; this increase was not affected by epinephrine (Supplementary Table 3). DnaK was a member of the top 100 matrix proteins of M. luteus. To the contrary, the concentration of the chaperone DnaJ increased in presence of epinephrine, and the same trend was observed for the chaperone PqqD, chaperonin 10 kDa, chaperonin 60 kDa, and copper chaperones. However, the last four proteins were also stimulated during maturation without epinephrine administration; thus, they were potentially not affected by the hormone administration. Peptidoglycan-binding proteins were also among the most common proteins in the matrix (Supplementary Table 1).
After 24 of incubation in the presence of epinephrine, the concentrations of 53 proteins were altered (Table 2), where 22 were increased and 31 were decreased. In mature biofilms, the administration of epinephrine led to changes in the concentrations of only in eight proteins (Table 3). Many proteins are found in the membranes and cytoplasm of cells, and their presence in a matrix can be a result of cell autolysis. Hence, we analyzed both the matrix and—at least partially—cell proteomes. We concluded that (i) the impact of epinephrine was greater in the initial stages of biofilm growth and (ii) epinephrine potentially triggered some signal processes that led to significant changes both in the cellular proteome and in the matrix proteome. Despite the insignificant alterations in total protein amounts measured using the Bradford test, the changes in proteomes potentially led to adjustments in the matrix structure (i.e., DNA-binding proteins, peptidoglycan-binding proteins, chaperones). This could explain why the amount of matrix increased when measured using dichromate combustion. Interestingly, in presence of epinephrine in 72 h mature biofilms, there was a decrease in histidine kinase concentration (accession A0A5E8QFN5). Histidine kinase is an intracellular enzyme that is potentially involved in signaling. Thus, a decrease in the amount of histidine kinase after the autolysis of cells could potentially be a result of changes in signaling pathways and hence in matrix composition.
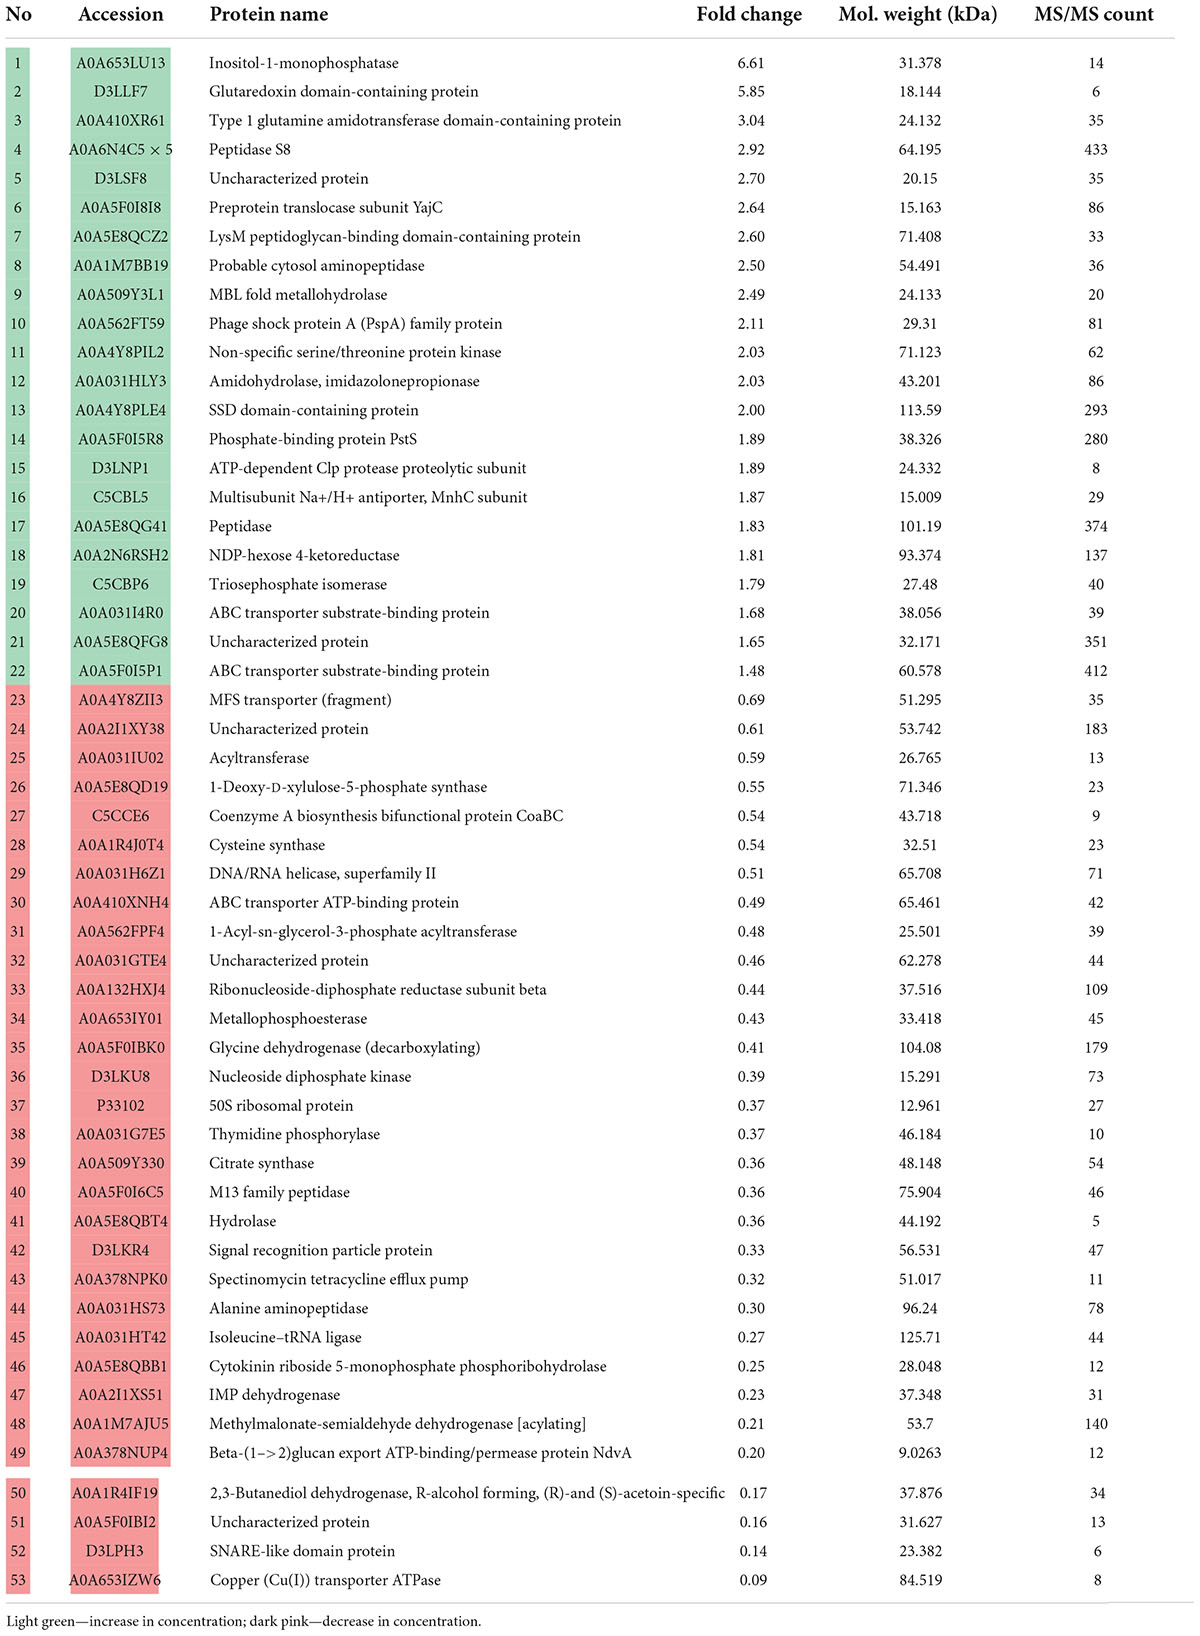
Table 2. Changes in M. luteus C01 biofilm matrix protein concentrations in the presence of 4.9 × 10⁻⁹ M epinephrine after 24 h of incubation in comparison with control.
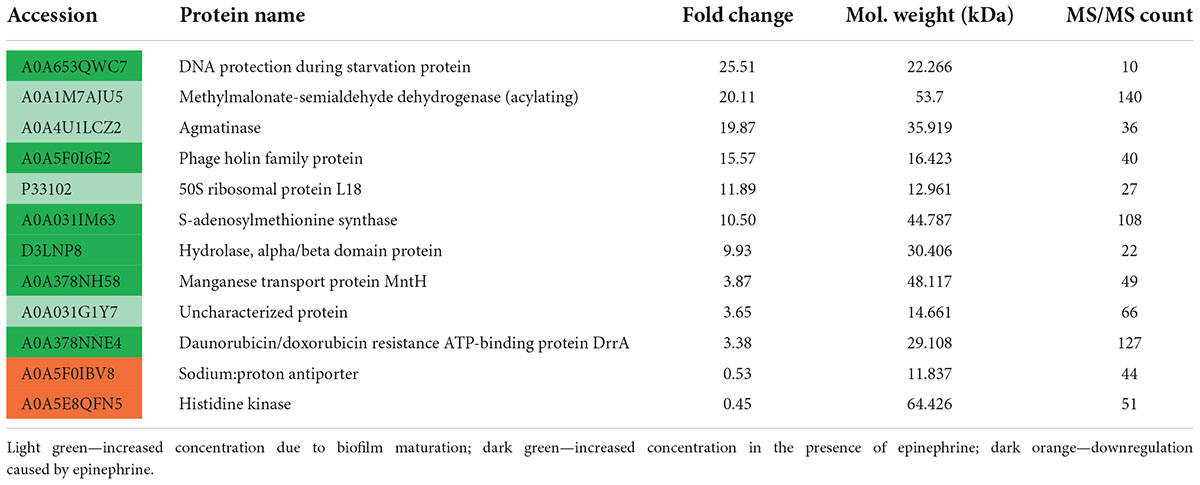
Table 3. Changes in M. luteus C01 biofilm matrix protein concentrations in the presence of 4.9 × 10⁻⁹ M epinephrine after 72 h of incubation in comparison with control.
Lipids in the Micrococcus luteus C01 biofilm cells and matrix
The lipids found in the matrix were previously shown to be normal components of the cellular membranes and excretomes of M. luteus (Peterson et al., 1975; de Bony et al., 1989; Beuling et al., 1996; Pakkiri et al., 2004). The data are presented in Table 4 and in the Supplementary Figures 3, 4.
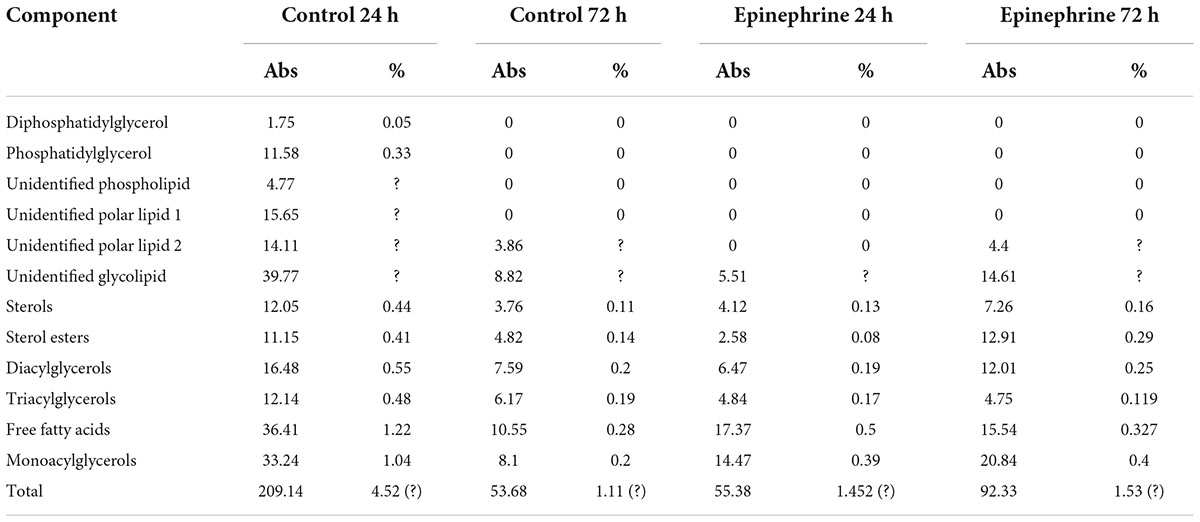
Table 4. Lipids detected in M. luteus C01 biofilm matrix.
The membrane lipids of biofilm cells were mainly represented by a number of glycolipids, sterols, DPG, PG, and PC (Supplementary Figures 3, 4). The storage lipids included mono-, di-, and triacylglycerols; FFA; and SE. The main lipid components of the biofilm matrix in all variants were glycolipids; sterols; mono-, di-, and triacylglycerols; FFA; and SE (Supplementary Figures 3, 4).
In terms of the matrix, the 24 h control samples contained more lipids than the rest of the samples (Table 4). Diphosphatidylglycerols and phosphatidylglycerols were found only in the 24 h control sample, in addition to the two unidentified phospholipids. The total amount of lipids was about 210 μg/g of the wet biomass, which was 4.5% of the total organics. In presence of epinephrine and after 24 h of incubation, the amount of lipids was decreased by four times. In the 72 h epinephrine samples, the amount of lipids was increased in comparison to the 72 h control; however, it was still lower than in the immature biofilms grown on medium without epinephrine additions. Changes occurred in all lipid classes. Interestingly, phospholipids were present only in the 24 h control samples. After biofilm maturation and after epinephrine addition in the 24 h samples, phospholipids were absent.
Thus, epinephrine caused changes in the concentrations of lipids in the matrix; the observed decrease in immature and increase in mature biofilms suggests that the differences lie in the basis of these processes. In addition, the hormone affected the synthesis of phospholipids. We were unable to calculate the amounts of some lipids due to the unknown nature of the compounds. Despite this, we concluded that the total amount of lipids in the 24 h control samples was no more than 7.5% of the total organic matter in the biofilm matrix. In other samples, it was determined to be no more than 2%; thus, the lipid fraction was a minor fraction of the organic compounds in the matrix.
Thus, epinephrine caused changes in all classes of organic compounds. We concluded that the general composition of the M. luteus matrix was (in order of amount): polysaccharides, proteins, lipids, and DNA. These compounds comprised about a half of all the organic material in matrix. The rest were pigments [potentially sarcinaxantin (Netzer et al., 2010)] and different metabolites with low molecular weights.
Surface-enhanced Raman scattering spectroscopy of Micrococcus luteus C01 biofilms
The spectra obtained show the differences in matrix composition in comparison to the biomass after matrix isolation (Figure 3). Here, most of the peaks were found in the samples from matrix phases and intact biomass (Figures 3A–C), which additionally verifies the isolation of the matrix and a cell suspension. The results from the PCA analysis of the differences in the samples are depicted in the Supplementary Figure 5.
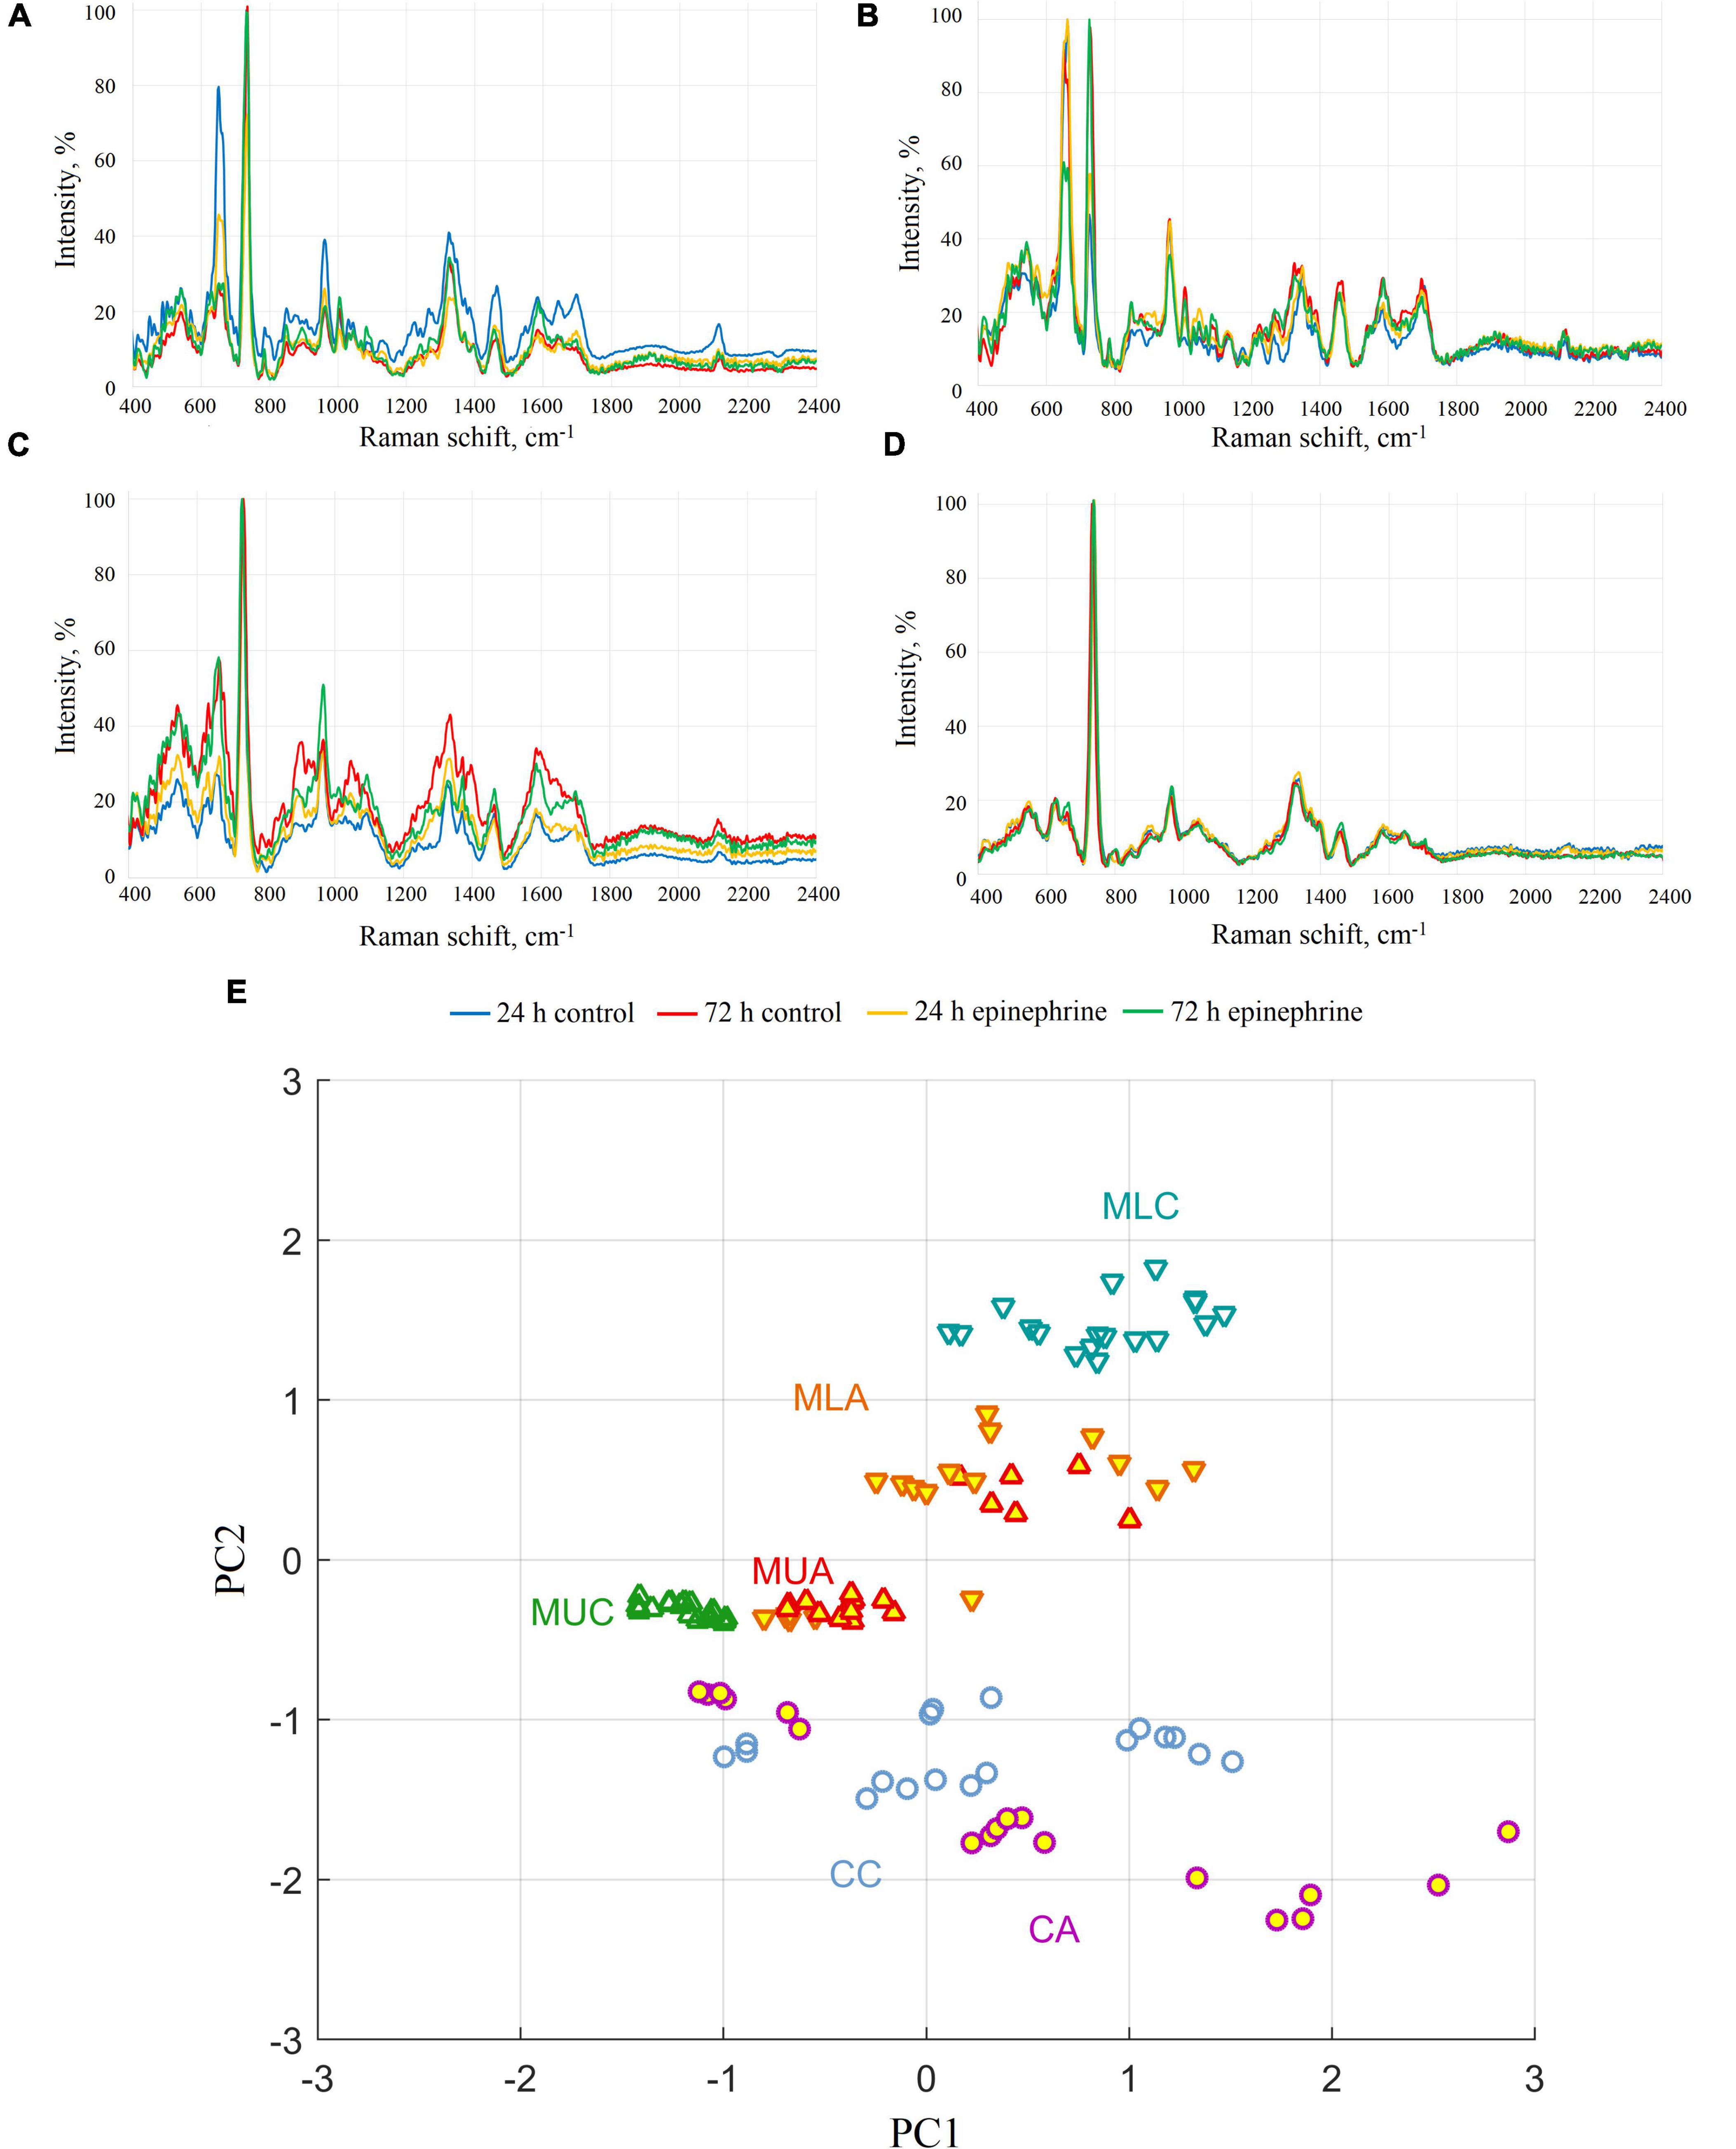
Figure 3. SERS spectra of M. luteus C01 biofilms. (A) Upper phase of the matrix. (B) Lower phase of the matrix. (C) Intact biomass. (D) Biomass after matrix extraction. (E) Principal component analysis of SERS spectra for 72 h samples (CC, control cells; CA, epinephrine-treated cells; MUC, control upper phase of the matrix; MUA, epinephrine-treated upper phase of the matrix; MLC, control lower phase of the matrix; MLA, epinephrine-treated lower phase of the matrix).
The analysis of the samples revealed that the spectra of the biomass after matrix extraction practically did not differ from each other. In only the 72 h epinephrine-treated biomass samples after matrix extraction, the peak at 662 cm–1 was slightly higher than in the other biomass samples (Figure 3D). This peak indicates guanine and proteins, which is in agreement with the results of the Dische method. In the group of intact biomass samples, differences were observed in the peak at 905 cm–1; however, in the control intact 24 h biomass samples, the difference was much less pronounced (Figure 3C). This peak is related to AMP/proteins. In the upper phase matrix samples (Figure 3A), the main difference was observed in the peaks at 650–660 cm–1 (two overlapping peaks). These peaks refer to guanine/xanthine/proteins. The intensity of the peak fell from 24 h to 72 h of incubation in the control samples and epinephrine samples. In the lower phase matrix samples (Figure 3B), we observed a change in the ratio between the 650–660 cm–1 group and the peaks at 725 cm–1 (stretching vibrations of the adenosine ring) in the control and epinephrine samples. The spectra of the epinephrine samples were otherwise similar, although there was still a slight difference in the region of 1330–1340 cm–1; however, it was also present in the control. In the 72 h samples, the peak was slightly shifted to the left. In the control samples from the lower phase of the 72 h biofilm matrix, a peak at ∼1000 cm–1 related to the respiratory vibration of the phenylalanine ring (Willets, 2009) appeared to be significantly increased. The principal component analysis of the SERS spectra (Figure 3E) showed that cells, upper phase of the matrix, and lower phase of the matrix are discernible by SERS spectra (mostly by PC2 component). In terms of spectra similarity, cells are closer to the upper phase of the matrix, than to the lower phase. The treatment with epinephrine shifts the SERS spectra and eliminates differences between lower and upper phases of the matrix, but cells remain discernible, nevertheless. See also the principal component analysis in the Supplementary Figure 5.
Polysaccharides in the Micrococcus luteus C01 biofilm matrix
Polysaccharides were isolated from the 24 h (control), 24 h (epinephrine), 72 h (control), and 72 h (epinephrine) M. luteus C01 matrix groups and purified via GPC on a TSK HW-40 (S) column. The sugar analysis of the alditol acetates performed using GLC revealed a similar composition in all samples studied, which comprised mannose, glucose, and GlcNAc (Supplementary Figure 6). The D configuration of the monosaccharides was determined by GLC of the acetylated (S)-2-octyl glycosides (Leontein and Lönngren, 1993).
The NMR spectra (Figures 4, 5 and Supplementary Figures 7–20) suggested that all matrix samples were mixtures of polysaccharides; thus, the polysaccharides were partially separated using anion-exchange chromatography with DEAE-Trisacryl M and a stepwise gradient of 0.005 to 0.5 M hydrogen sodium phosphate buffer (pH 6.3). As result, two fractions were obtained from matrix 24 h (control) samples: one eluted in 0.1 M phosphate buffer and the other eluted in 0.5 M phosphate buffer. Both fractions were studied using 1D and 2D NMR spectroscopy.
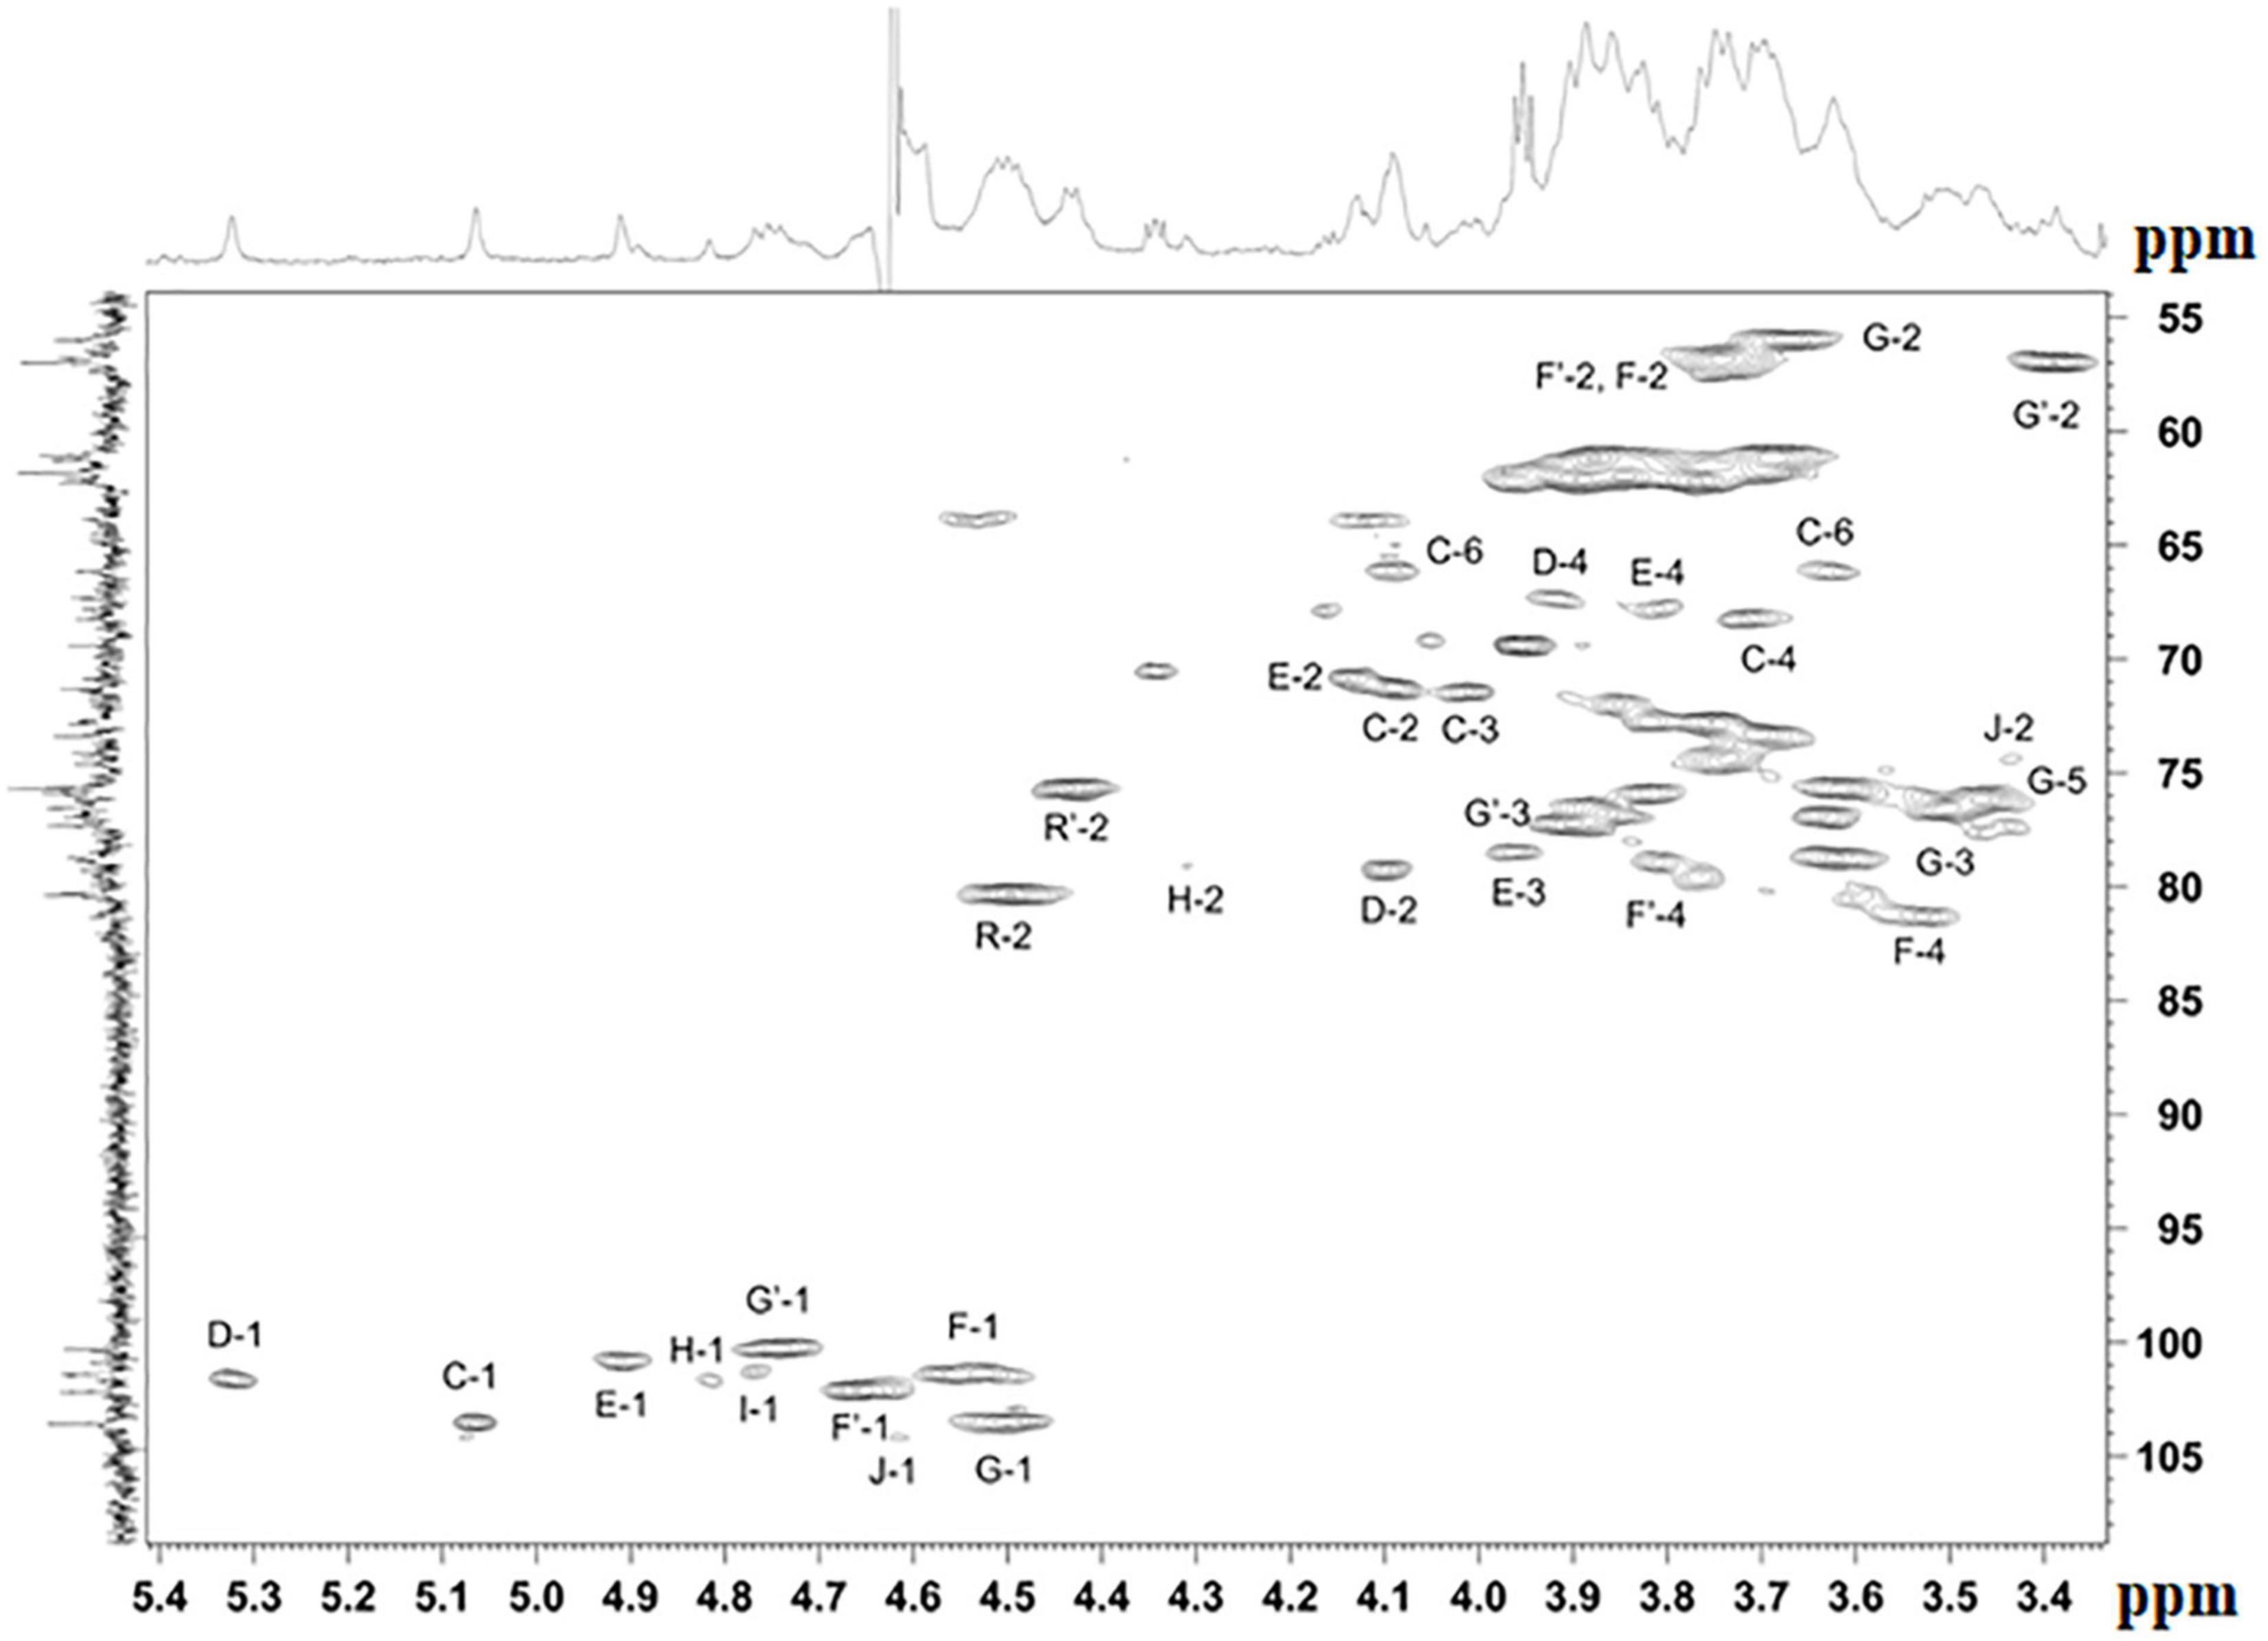
Figure 4. Parts of the 2D 1H,13C edHSQC spectrum of M. luteus C01 matrix polysaccharides [24 h (control)] eluted in 0.1 M phosphate buffer. The corresponding parts of the 1H and 13C NMR spectra are shown along the horizontal and vertical axes, respectively. Numbers refer to protons and carbons of sugar units designated by the letters shown in Table 5.
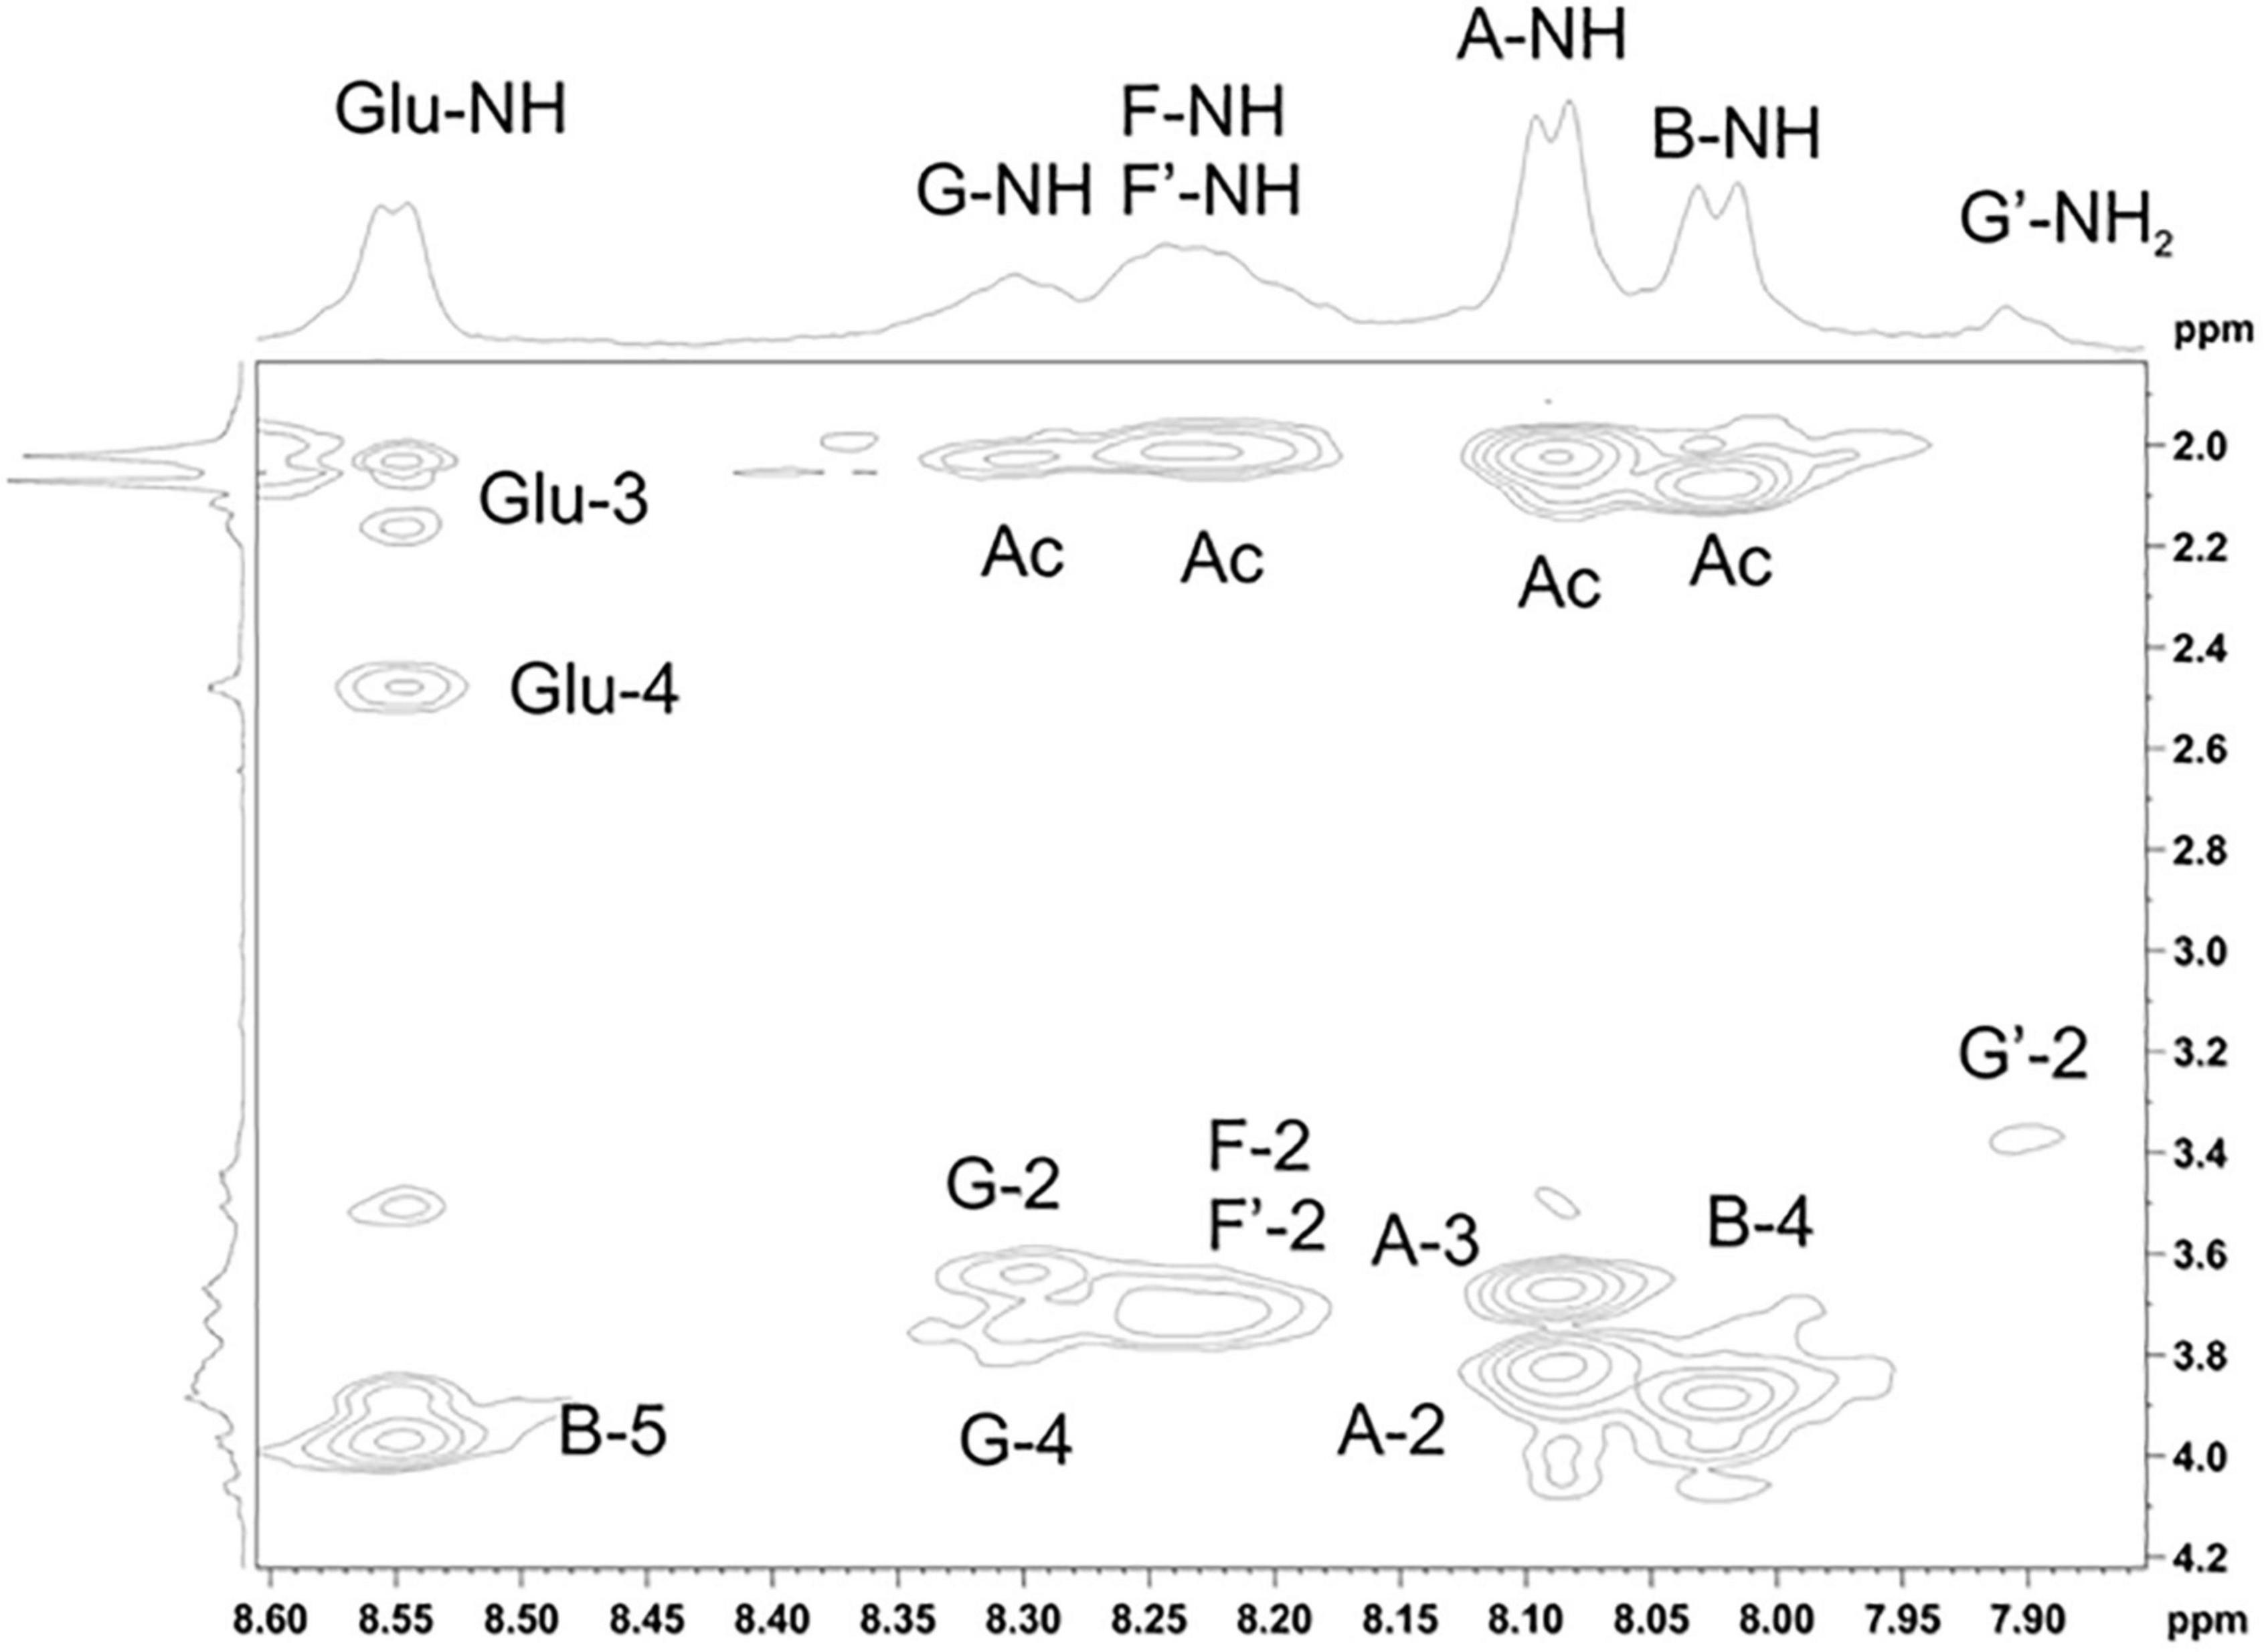
Figure 5. Parts of the 2D ROESY spectrum of M. luteus C01 matrix polysaccharides [24 h (control)] eluted in 0.1 M phosphate buffer measured in a 9: 1 H2O/D2O mixture. The corresponding parts of the 1H NMR spectra are shown along the horizontal and vertical axes, respectively. Numbers refer to the protons and carbons of sugar units designated by the letters shown in Table 5.
Fraction eluted in 0.5 M phosphate buffer [matrix 24 h (control) 0.5 M]
The 1D and 2D NMR spectra of the 24 h (control) 0.5 M matrix sample showed signals for anomeric atoms at δH 4.86–5.36 and δC 98.3–101.5 (Supplementary Figure 7). COSY, TOCSY, and HSQC experiments allowed us to determine all direct correlations between carbons and protons and complete the assignment of cross-peaks to each of the sugars (Table 5) and spin systems. GlcNAc (A), ManNAcA (B), and Glu (glutamic acid) were identified by their characteristic proton–proton couplings and carbon chemical shifts when compared to the data averaged and stored in the GODDESS carbohydrate NMR database (Kapaev and Toukach, 2016). The L configuration of glutamic acid was determined by GLC of the acetylated (S) 2,5-di-octyl glutaminic ester. The assignment within each spin system was performed using COSY, and the relative configurations of the monosaccharides were determined based on 3JH,H coupling constants. The 1H and 13C NMR chemical shift data combined with data from linkage and sequence analyses using ROESY and 1H,13C HMBC experiments (Table 6) revealed the following structure of PSI (Figure 6). This structure was established earlier as the cell wall polysaccharide of M. luteus C01 (Zdorovenko et al., 2021).
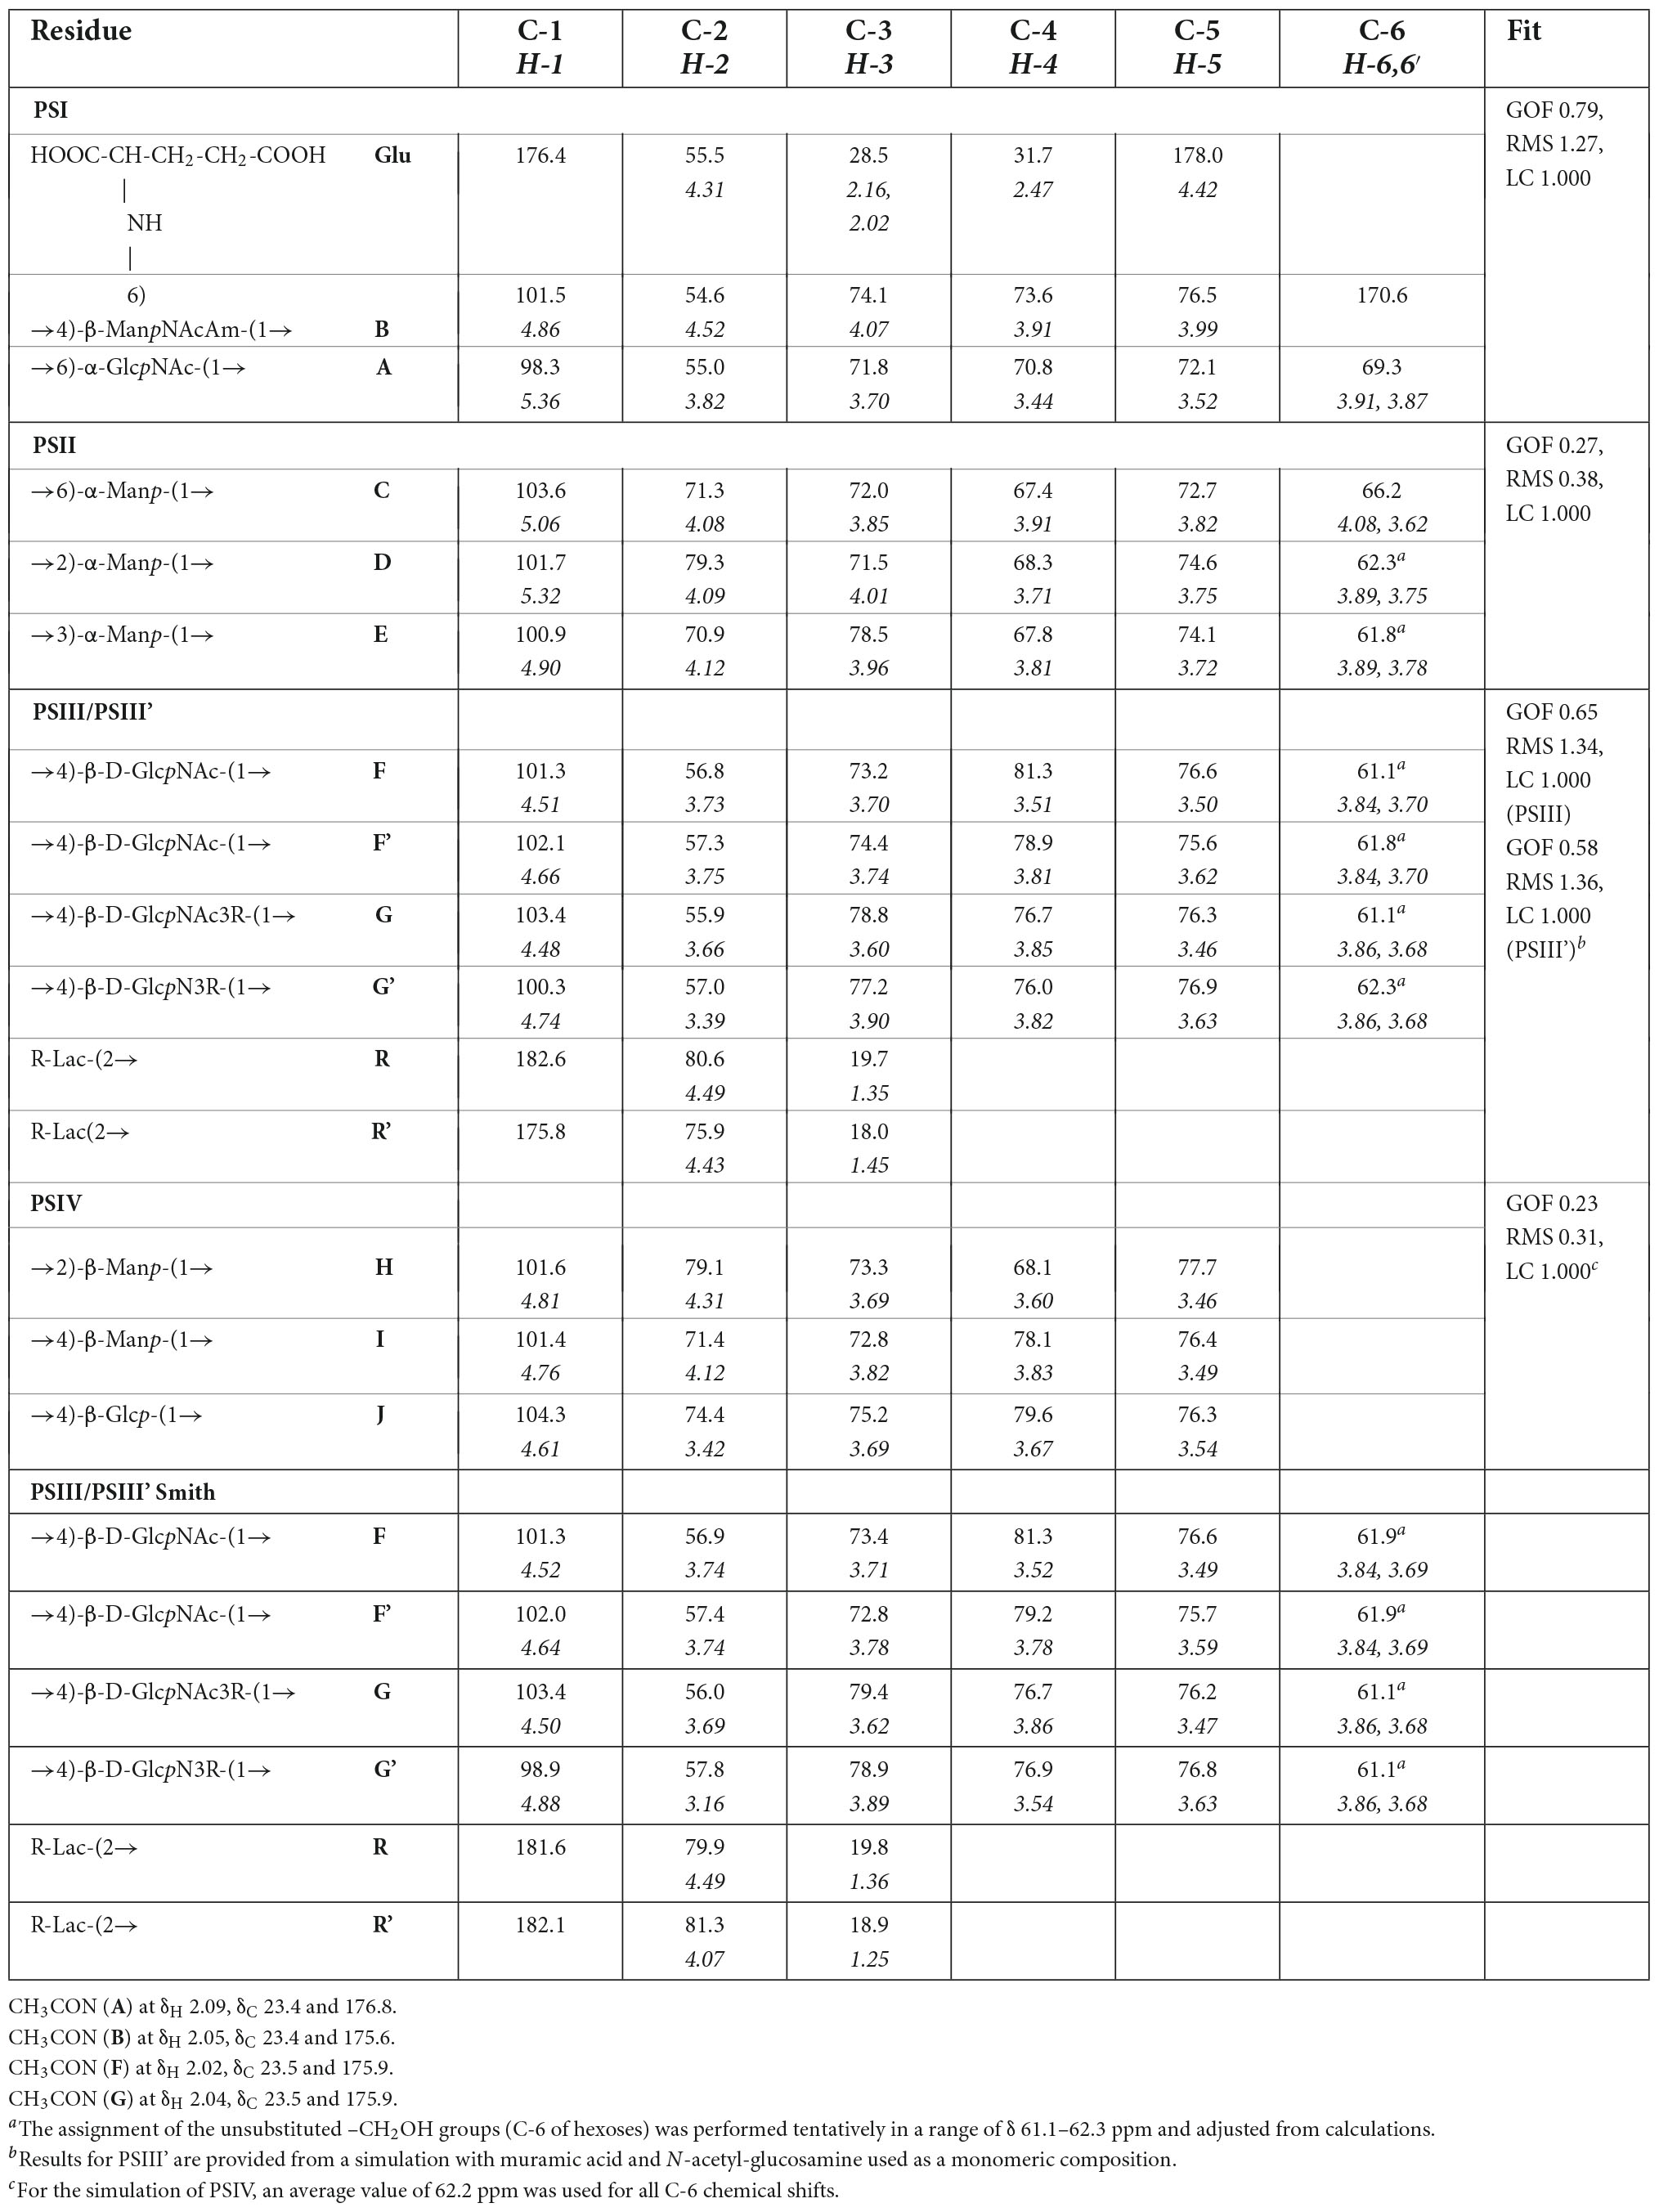
Table 5. 1H and 13C NMR chemical shifts in cell wall polysaccharides of M. luteus C01 (δ, ppm).
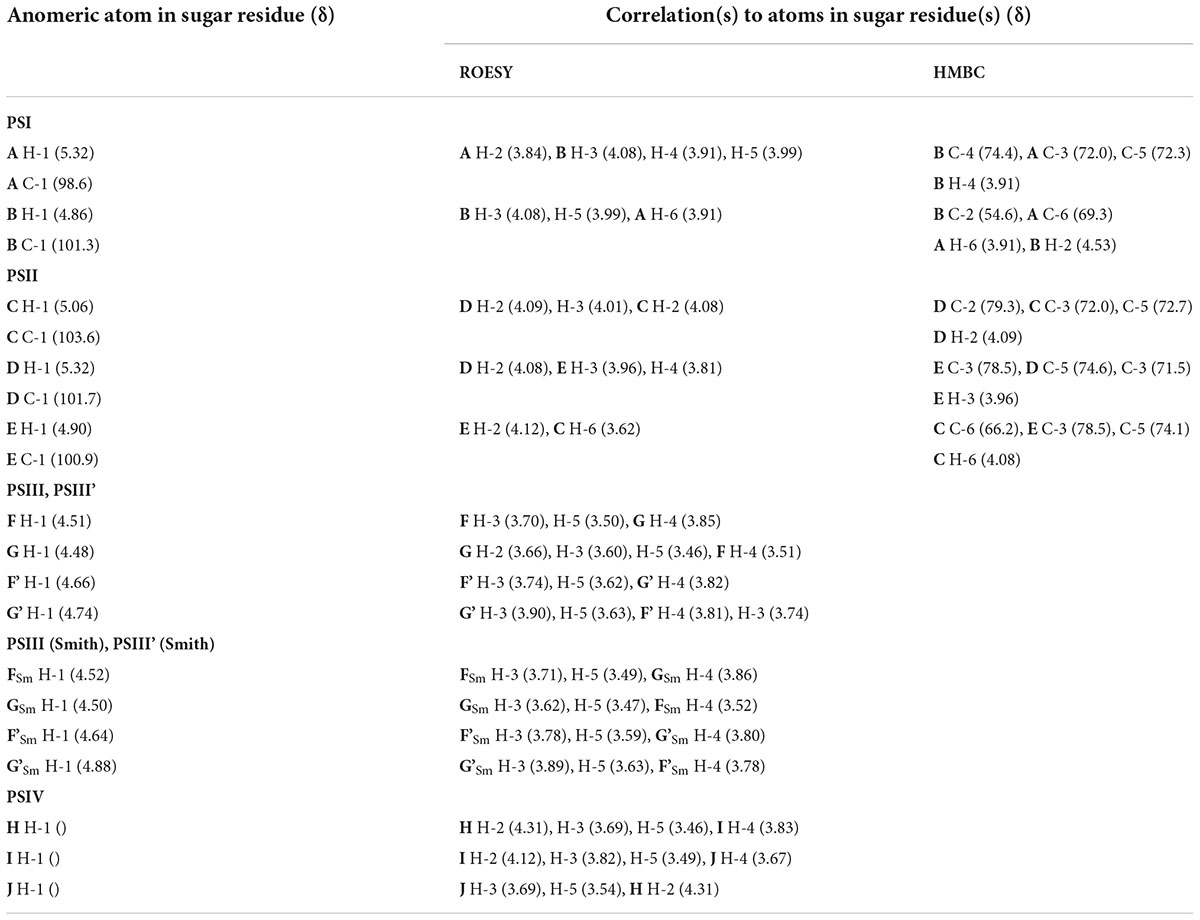
Table 6. Correlations for H-1 and C-1 in the 2D ROESY and 1H,13C HMBC spectra of the 24 h (control) matrix polysaccharides of M. luteus C01.
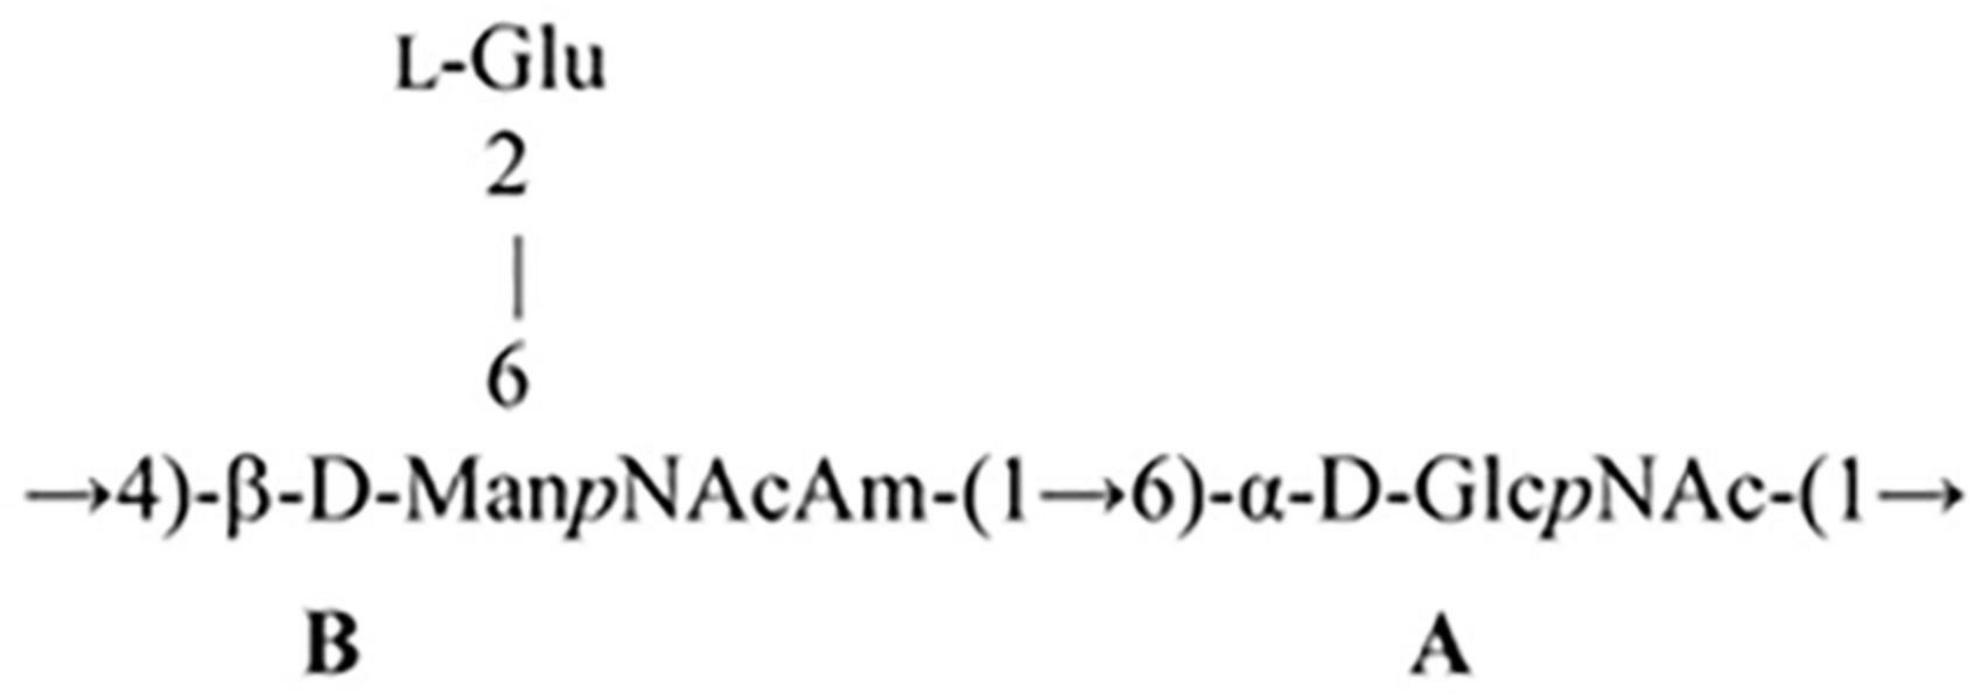
Figure 6. Structure of M. luteus C01 cell wall polysaccharide.
Fraction eluted in 0.1 M phosphate buffer [matrix 24 h (control) 0.1 M]
The NMR spectra of the fraction eluted in 0.1 M buffer [matrix 24h (control) 0.1M] showed signals of varying intensities, indicating structural heterogeneity (Figure 4 and Supplementary Figures 7–20). The 1H NMR spectrum contained signals for anomeric protons at δ 4.50–5.32, a CH3-C group (H-3 of lactic acid) at δ 1.35, other sugar ring protons at δ 3.39–4.50, N-acetyl groups at δ 2.02–2.09, and CH3-groups at δ 1.36–1.44. The 13C NMR spectrum contained signals for anomeric carbons at δ 100.3–103.6, a number of OCH2 groups at δ 61.06–66.2, nitrogen-bearing carbons at δ 56.0–57.3, methyl groups at δ 19.8 (C-3 of lactic acid), one COOH group (C-1 of lactic acid) at δ 182.1, other sugar ring carbons at δ 64.7–78.1, and N-acetyl groups at δ 23.5 (CH3) and 175.9 (CO).
The spectra were assigned using 1H,1H COSY, TOCSY, ROESY, 1H,13C HSQC, HSQC-TOCSY, and HMBC experiments (Table 5 and Figure 4). It was found that the sample contained five mannose (C, D, E, H, I), four glucosamine (F, F’, G, G’), and one glucose (J) residue. The α-linkage (C, D, E) and β-linkages of Man (H, I), GlcpN (F, G), and Glc (J) were established using characteristic C-5 chemical shifts (Table 5) and the presence of H-1/H-2 cross-peaks for units C, D, and E and H-1/H-5 cross-peaks for units F-J in the ROESY spectrum (Table 6). In this way, the β-configuration of the mannose residues (H and I), GlcNAc (F and G) and glucose (J) was inferred by a comparison of the C-5 chemical shifts at 76.4–77.7 with the published values of δ 73.3 and 77.0 for α- and β-Manp, 72.5 and 76.8 for α- and β-GlcNAc, and 72.4 and 76.8 for α- and β-Glc, respectively (Lipkind et al., 1988), as averaged and stored in the GODDESS carbohydrate NMR database (Kapaev and Toukach, 2016).
The spin systems of amino sugars were distinguished by correlations between protons at nitrogen-bearing carbons (H-2) and the corresponding carbons (C-2) with a characteristic chemical shift. The spin systems of four acetylated and free GlcN (F, F’, G, G’) and Glc (J) were identified via the correlations of H-1 with H-2 to H-5 in the TOCSY experiment. The assignment of mannose residues was based on the correlations of H-1 to H-2 and H-2 to H-6 in the TOCSY spectrum.
Downfield displacements were observed for the C-3 and C-4 signals of GlcNAc (G, G’), C-4 of GlcNAc (F, F’), C-4 of Man (I), C-4 of Glc (J), C-2 of Man (H, D), C-3 of Man (E), and C-6 of Man (C) (Table 5), when compared to their positions in the corresponding non-substituted compounds (Lipkind et al., 1988; Kapaev and Toukach, 2016). These data defined the linkage pattern of the monosaccharide units.
The sequence of the monosaccharides was determined by correlations between the anomeric protons and protons or carbons at linkage positions in the ROESY and HMBC spectra, respectively (Table 6).
A strong cross-peak between H-2 of the lactic acid residue and H-3 of GlcNAc (G, G’) at δ 4.49/3.60 and 4.43/3.90, respectively, indicated the location of an ether linkage at position 3, which was verified by a relatively lowfield position of the signal for GlcNAc (G, G’) C-3 at δ 78.8 and 77.3 (compared to δ 73.2 for non-substituted GlcNAc C-3), thus confirming the presence of the GlcN3Lac residue.
The 1H NMR spectrum of the matrix polysaccharides measured in a 9: 1 H2O/D2O mixture showed signals for NH protons. Using COSY, TOCSY, and ROESY experiments, three of these signals were assigned to the NH groups of units A and B and glutamic acid from PSI; the others were assigned to the NH/NH2 groups of units G, G’, F, and F’. The ROESY spectrum (Figure 5) showed correlations with the acetyl groups, thus indicating the N-acetylation of all sugar residues at position 2. An exception was the signal of the NH proton at δ 7.91. This signal correlated with H-2 of the G′ residue and lacked correlations with any acetyl groups in the ROESY and HMBC spectra. Thus, residue G′ was not N-acetylated at position 2.
The α-glycosylation effects on C-1 of GlcNAc3RLac (G) and C4 of D-GlcNAc (F) and the β-glycosylation effect on C-3 of D-GlcNAc F (+7.55, +10.24, and −2.01 ppm, respectively) indicated the same absolute configuration of the linked monosaccharide residues, i.e., the D-configuration of a sugar moiety of GlcNAc3RLac [as compared with published data (Shashkov et al., 1988) for the same and different absolute configurations].
Thus, the fraction eluted in 0.1 M buffer contained several polysaccharides with the following structures:
→6)-α-D-Manp-(1→2)-α-D-Manp-(1→3)-α-D-Manp-(1→ PSII
C D E
G F
→4)-β-D-GlcpNR-(1→4)-β-D-GlcpNAc-(1→ PSIII
R-Lac(2→⌋3
→2)-β-D-Manp-(1→4)-β-D-Manp-(1→4)-β-D-Glcp-(1→ PSIV
H I J
where R is Ac (PSIII) or H (PSIII’)
To further confirm the polysaccharide structures, the polysaccharides from the fraction eluted in 0.1 M buffer were subjected to Smith degradation, and the products from the mild acid hydrolysis of the degraded polymers were fractionated via GPC on a TSK HW-40 column. As a result, the polysaccharides PSIII and PSIII’ and oligosaccharides were isolated. They were studied using 1D and 2D NMR spectroscopy, including ROESY, as described above for the polysaccharides (for the assignment of the 1H and 13C NMR signals, see Table 5). As a result, the structures of PSIII and PSIII’ were confirmed (Tables 5, 6).
In addition to the major signals tabulated in Table 5, the NMR spectra showed a number of minor signals, which were not assigned owing to their low intensities.
The assignment of all spectra was confirmed with the GODDESS carbohydrate NMR simulator (Kapaev et al., 2014). The unassigned 13C NMR spectra and the monomeric composition were fed to the GRASS module (Kapaev and Toukach, 2018) of the Carbohydrate Structure Database (Toukach and Egorova, 2016) to predict the structure topology, anomeric configurations, cycle sizes, linkage pattern, and the sequence of residues. For PSI, an additional HMBC-based restriction was applied to filter out all glutamic acid esters from the results, leaving only its amides with a uronic acid. In all cases, the elucidated structure coincided with the structure predicted as a best match by GRASS. The goodness of fit [explained elsewhere (Kapaev and Toukach, 2018)], root-mean-square deviation, and linear correlation coefficient are provided for every polysaccharide in the rightmost column of Table 5. The difference in goodness of fit between the best match and the second-ranked structure varied from 0.1 to 0.5, confirming the trustworthiness of the ranking, except for PSII, where this difference was not significant (0.03). For all structures, the signal assignments corresponded to those obtained from the interpretation of the NMR spectra. The prediction logs and ranked lists of candidate structures are available at http://csdb.glycoscience.ru/grass.html, under the job name mask mluteusC02_PS.
PSII is structurally close to a mannan of the cell wall polysaccharide of M. luteus C01 (Zdorovenko et al., 2021).
PSIII is not unique among bacterial polysaccharides. It was found in P. alcalifaciens O45, O3, O24, and O38 (Ovchinnikova et al., 2012). PSIII and PSIII’ were found in the endospore peptidoglycan of Bacillus subtilis 168 (Atrih et al., 1996). PSIII is a carbohydrate base of a classical peptidoglycan that was earlier found to be a cell wall component of Gram-positive bacteria (Knirel and Valvano, 2013). According to a search in the Carbohydrate Structure Database (Toukach and Egorova, 2016), the structure of PSIV is unique among the known polysaccharides of any microorganisms, although a related structural fragment where both mannoses are 1,4-linked had 28 occurrences in a prokaryotic glycome.
In the matrix 24 h (control), the polysaccharides were found in a PSI:PSII:PSIII:PSIII’:PSIV ratio of ∼3.3:1.0:3.0:2.3:0.4. This was determined by a comparison of the integral signal intensities in the 1H NMR spectrum.
A comparative study of the NMR spectra of polysaccharides from the matrix 24 h (epinephrine) and matrix 24 h (control) samples showed the presence of the polysaccharides PSI, PSII, PSIII, and PSIII′ in a ratio of ∼3.8:1.0:4.2:2.5. PSIV was not found in matrix 24 h with epinephrine samples.
A comparative study of the NMR spectra of polysaccharides from the matrix 72 h (control) and matrix 72 h (epinephrine) samples with matrix 24 h (control) showed the presence of the polysaccharides PSI, PSII, and PSIII in ratios of ∼1.9:1:3 and ∼4:1:4.5, respectively. PSIII’ and PSIV were not found in the 72 h (control) and 72 h (epinephrine) matrices.
Discussion
It has been known for decades that prokaryotic and eukaryotic cells are extremely complex systems containing tightly interrelated molecular machineries and processes. As such, any internal or external impact may shift the balance and provoke a cascade of reactions, which are sometimes difficult to trace fully. Human hormones seem to trigger global physiological changes in cells and in biofilms. Recently, the complex effect of a number of hormones on monospecies biofilms and mixed-species communities of some human commensal bacteria has been shown (Clabaut et al., 2021; Mart’yanov et al., 2021; Ovcharova et al., 2021; Diuvenji et al., 2022; Kiseleva et al., 2022; Scardaci et al., 2022). Our work on M. luteus C01 showed changes in the expression of seven genes in biofilms in the presence of 4.9 nM epinephrine (Gannesen et al., 2021). Some Fe-S cluster genes were upregulated, while genes for the lysin transporter LysE, chaperone GroES, short-chain alcohol dehydrogenase, and the potential c-di-GMP phosphotransferase were downregulated. Despite the fact that very few genes with differences in expression were revealed using RNAseq and qPCR earlier, the changes in the matrix proteome were much more extensive especially after 24 h of incubation in immature biofilms. Hence, we propose that hormones act as regulators of some reaction cascades that are triggered either by some posttranslational modifications of regulatory proteins or by some unknown signal system. Potentially, the c-di-GMP phosphotransferase-like protein described earlier (Gannesen et al., 2021) may be a key player in the epinephrine sensitivity of M. luteus C01. The analysis of the proteome revealed changes in numerous matrix proteins, most of which had catalytic activity. There are certain points that should be given attention. First, in the 24 h immature biofilm matrix, there was a higher amount of proteins with the ability to bind to polysaccharides (some ABC family proteins, peptidoglycan-binding protein A0A5E8QCZ2). This could be one reason for the stabilization of the matrix in the immature biofilms and the resulting higher matrix amount after 72 h of incubation. Second, similar to the matrix of C. acnes (Gannesen et al., 2019), there were hundreds of proteins in the micrococcal matrix that seemed to be present due to cell autolysis during biofilm maturation. For instance, as in C. acnes, we found EF-Tu in the matrix of M. luteus C01. These proteins could also be a part of a catalytic matrix compartment; however, their actual functions (for instance, in the case of ribosomal proteins) are still a matter of further investigations. Nevertheless, such an extensive shift in the amount of catalytic proteins, which are responsible for different intracellular processes, demonstrates the substantial changes inside the cells in presence of the hormone, verifying the multitargeted and global effect of epinephrine on M. luteus and potentially providing evidence of such an effect of all hormones on human commensal bacteria.
The changes in the biofilm matrix lipidome in the presence of epinephrine are also worth noting. After 24 h of incubation, there was a significant decrease in the amount of lipids in the presence of epinephrine; in mature biofilms, the hormone slightly increased the lipid concentration. However, in general, the maturation of biofilms led to a decrease in lipid amounts in M. luteus biofilms. Moreover, the phospholipid compartment of the lipidome was absent in the presence of epinephrine after 24 h of incubation and in all 72 h samples. Hence, the hormone either significantly affected lipid synthesis in M. luteus cells (especially the synthesis of phospholipids) or stimulated lipid consumption by the cells. The last explanation may be based on the possible intensification of M. luteus C01 metabolism in the presence of the hormone (Gannesen et al., 2021).
As was demonstrated in the present research, the changes in biofilm matrix composition in the presence of epinephrine were rather extensive. First, our hypothesis about the role of extracellular DNA in the stabilization of the matrix in M. luteus C01 was verified experimentally. The amount of DNA in the matrix of mature 72 h biofilms was higher than in the control according to the Dische method results and SERS analysis. In our previous work, the treatment of mature 72 h biofilms with DNAse I resulted in the removal of the epinephrine stimulatory effect (Gannesen et al., 2021). Here, we showed that in the presence of epinephrine, there were more sugars and DNA in the mature biofilm matrix, and eDNA seemed to be an essential component for matrix stability in M. luteus C01. Interestingly, an increased amount of the protein A0A653QWC7, which is responsible for DNA protection during starvation, could also be a reason for the increased DNA amount. After such a long incubation period, the biofilms of M. luteus came into a late life cycle phase, and the model system did not allow them to disperse into a liquid medium. Hence, the starvation processes could start at this stage, and additional DNA protection is a reasonable way to protect the matrix. In addition, it is worth noting that the total amount of proteins was not changed in the mature or immature biofilms in the presence of epinephrine. Moreover, there were less proteins in mature biofilms when compared to the immature biofilms. Thus, the structure of the matrix either allowed proteins to diffuse better in the 72 h biofilms or the cells started to use the proteins as an additional nutrient source (this is an additional point to the starvation hypothesis).
The first in-depth investigation of polysaccharides in the M. luteus C01 matrix revealed five types of polymers that contained mannose, glucose, glucose amine, and N-acetylglucose amine. Interestingly, the hormone affected the synthesis of PSIV—the only minor polymer containing glucose in its chain alongside mannose. Thus, it could be proposed that epinephrine somehow affected the synthesis of at least some glucose-containing polysaccharides in M. luteus, which could be related to the downregulation of an unknown protein with EAL domains—a potential c-di-GMP phosphotransferase (Gannesen et al., 2021). This hypothesis still must be approved or denied in future.
Taken together, our results establish that the effect of epinephrine at a concentration of 4.9 nM, which is close to the physiological blood plasma level, on M. luteus C01 biofilms is a complex phenomenon. Despite the fact that only seven genes were found to have changed expression patterns in the presence of the hormone, the resulting effect was extensive and based on intricate relationships between cell components. Although we found some proteins with changed concentrations (especially interesting was histidine kinase A0A5E8QFN5 in mature biofilms), it is very difficult to propose the key epinephrine targets and reaction cascades inside cells that could result in such extensive changes. However, we suggest the main directions of epinephrine impact are as follows: (i) cell metabolism intensification; (ii) glucose-mannose polymer synthesis; and (iii) eDNA-based matrix stabilization. Due to changes in the DNA-polysaccharide matrix structure, the intensification of cell metabolism (potentially via the stimulation of enzymes with Fe-S clusters), and intracellular protein assembly processes, the proteome of the matrix could be changed. Thus, a focus of future investigations should be searching for epinephrine targets and sensors in M. luteus cells and distinguishing the reaction cascades in the presence of the hormone. Nevertheless, the effect of epinephrine on M. luteus C01 biofilms seems to be global, and we suggest that each hormone has an effect to the same extent on bacterial cells and biofilms.
Data availability statement
The mass spectrometry proteomics data have been deposited to the ProteomeXchange Consortium via the PRIDE (Perez-Riverol et al., 2022) partner repository with the dataset identifier PXD035739.
Author contributions
AG contributed to the conceptualization, methodology design, matrix isolation, quantitative biochemistry tests, LDH tests, general data analysis, article writing, and project administration. RZ contributed to the proteomic samples preparation, proteomic data obtaining, data analysis, and proteomic part writing. EZ contributed to the polysaccharides research, NMR research, NMR data analysis, and NMR part writing. AK contributed to the biofilm growth, matrix isolation, quantitative biochemistry tests, and article writing. El and OD contributed to the lipid research, lipid chromatography studies. VT contributed to the lipid research, lipid chromatography studies, and lipid part writing. MG and AN contributed to the SERS investigation, SERS data analysis, and SERS part writing. MO and EN contributed to the biofilm growth, matrix isolation, and quantitative biochemistry tests. SM and EB contributed to the data analysis and article writing. AS and AD contributed to the polysaccharides research, NMR research, and NMR part writing. MZ contributed to the biofilm growth, matrix isolation, and data analysis. PT contributed to the NMR research, NMR data analysis, and NMR part writing. VP contributed to the conceptualization, article writing, and project administration. All authors contributed to the article and approved the submitted version.
Funding
This work was supported by the Russian Science Foundation (Grant No. 19-74-10071P). Software-assisted NMR structure elucidation was supported by the Russian Science Foundation (Grant No. 18-14-00098P). SERS spectra acquisition and analysis in Gubkin University was supported by the Russian Science Foundation (Grant No. 19-79-30091). The work of VP was supported by the Ministry of Science and Higher Education of the Russian Federation.
Acknowledgments
We are grateful to the team of the Laboratory of Microbial Viruses of the Federal Research Center “Fundamentals of Biotechnology” (RAS) and especially to Dr. Eugeny E. Kulikov for their kind assistance in matrix centrifugation and help with ultracentrifuges.
Conflict of interest
The authors declare that the research was conducted in the absence of any commercial or financial relationships that could be construed as a potential conflict of interest.
Publisher’s note
All claims expressed in this article are solely those of the authors and do not necessarily represent those of their affiliated organizations, or those of the publisher, the editors and the reviewers. Any product that may be evaluated in this article, or claim that may be made by its manufacturer, is not guaranteed or endorsed by the publisher.
Supplementary material
The Supplementary Material for this article can be found online at: https://www.frontiersin.org/articles/10.3389/fmicb.2022.1003942/full#supplementary-material
Footnotes
References
Atrih, A., Zöllner, P., Allmaier, G., and Foster, S. J. (1996). Structural analysis of Bacillus subtilis 168 endospore peptidoglycan and its role during differentiation. J. Bacteriol. 178, 6173–6183. doi: 10.1128/jb.178.21.6173-6183.1996
Benning, C., Huang, Z. H., and Gage, D. A. (1995). Accumulation of a novel glycolipid and a betaine lipid in cells of Rhodobacter sphaeroides grown under phosphate limitation. Arch. Biochem. Biophys. 317, 103–111. doi: 10.1006/abbi.1995.1141
Beuling, E. E., Van den Heuvel, J. C., and Ottengraf, S. P. (1996). “Determination of biofilm diffusion coefficients using micro-electrodes,” in Immobilized cells: Basics and applications, eds R. H. Wijfels, R. M. Buitelaar, C. Bucke, and J. Tramper (Amsterdam: Elsevier Science B.V), 31.
Borrel, V., Thomas, P., Catovic, C., Racine, P. J., Konto-Ghiorghi, Y., Lefeuvre, et al. (2019). Acne and stress: Impact of catecholamines on Cutibacterium acnes. Front. Med. 6:155. doi: 10.3389/fmed.2019.00155
Boyanova, L. (2017). Stress hormone epinephrine (adrenaline) and norepinephrine (noradrenaline) effects on the anaerobic bacteria. Anaerobe 44, 13–19.
Bradford, M. M. (1976). A rapid and sensitive method for the quantitation of microgram quantities of protein utilizing the principle of protein-dye binding. Anal. Biochem. 72, 248–254.
Chao, Y., and Zhang, T. (2012). Surface-enhanced Raman scattering (SERS) revealing chemical variation during biofilm formation: From initial attachment to mature biofilm. Anal. Bioanal. Chem. 404, 1465–1475. doi: 10.1007/s00216-012-6225-y
Clabaut, M., Suet, A., Racine, P. J., Tahrioui, A., Verdon, J., Barreau, M., et al. (2021). Effect of 17β-estradiol on a human vaginal Lactobacillus crispatus strain. Sci. Rep. 11, 1–16.
Danilova, N. D., Solovyeva, T. V., Mart’Yanov, S. V., Zhurina, M. V., and Gannesen, A. V. (2020). Stimulatory effect of epinephrine on biofilms of Micrococcus luteus C01. Microbiology 89, 493–497.
de Bony, J., Lopez, A., Gilleron, M., Welby, M., Lanéelle, G., Rousseau, B., et al. (1989). Transverse and lateral distribution of phospholipids and glycolipids in the membrane of the bacterium Micrococcus luteus. Biochemistry 28, 3728–3737. doi: 10.1021/bi00435a016
Dische, Z. (1930). Some new characteristic color tests for thymonucleic acid and a microchemical method for determining the same in animal organs by means of these tests. Mikrochemie 8:824.
Diuvenji, E. V., Nevolina, E. D., Mart’yanov, S. V., Zhurina, M. V., Kalmantaeva, O. V., Makarova, M. A., et al. (2022). Binary biofilms of Staphylococcus aureus 209P and Kytococcus schroeteri H01: Dualistic role of kytococci and cell adhesion alterations in the presence of the A-type natriuretic peptide. Microbiology 91, 568–581. doi: 10.1134/S002626172260118X
Dreywood, R. (1946). Qualitative test for carbohydrate material. Ind. Eng. Chem., Anal. Ed. 18, 499–499.
Efrima, S., and Zeiri, L. (2009). Understanding SERS of bacteria. J. Raman Spectrosc. 40, 277–288. doi: 10.1002/jrs.2121
Gannesen, A. V., Lesouhaitier, O., Racine, P. J., Barreau, M., Netrusov, A. I., Plakunov, V. K., et al. (2018a). Regulation of monospecies and mixed biofilms formation of skin Staphylococcus aureus and Cutibacterium acnes by human natriuretic peptides. Front. Microbiol. 9:2912. doi: 10.3389/fmicb.2018.02912
Gannesen, A. V., Lesouhaitier, O., Netrusov, A. I., Plakunov, V. K., and Feuilloley, M. G. J. (2018b). Regulation of formation of monospecies and binary biofilms by human skin microbiota components, Staphylococcus epidermidis and Staphylococcus aureus, by human natriuretic peptides. Microbiology 87, 597–609.
Gannesen, A. V., Schelkunov, M. I., Geras’ kina, O. V., Makarova, N. E., Sukhacheva, M. V., Danilova, N. D., et al. (2021). Epinephrine affects gene expression levels and has a complex effect on biofilm formation in Micrococcus luteus strain C01 isolated from human skin. Biofilm 3:100058. doi: 10.1016/j.bioflm.2021.100058
Gannesen, A. V., Zdorovenko, E. L., Botchkova, E. A., Hardouin, J., Massier, S., Kopitsyn, D. S., et al. (2019). Composition of the biofilm matrix of Cutibacterium acnes acneic strain RT5. Front. Microbiol. 10:1284. doi: 10.3389/fmicb.2019.01284
Gorbachevskii, M. V., Kopitsyn, D. S., Kotelev, M. S., Ivanov, E. V., Vinokurov, V. A., and Novikov, A. A. (2018). Amplification of surface-enhanced Raman scattering by the oxidation of capping agents on gold nanoparticles. RSC Adv. 8, 19051–19057. doi: 10.1039/C8RA00417J
Kapaev, R. R., and Toukach, P. V. (2016). Simulation of 2D NMR spectra of carbohydrates using GODESS software. J. Chem. Inf. Model. 56, 1100–1104. doi: 10.1021/acs.jcim.6b00083
Kapaev, R. R., and Toukach, P. V. (2018). GRASS: Semi-automated NMR-based structure elucidation of saccharides. Bioinformatics 34, 957–963. doi: 10.1093/bioinformatics/btx696
Kapaev, R. R., Egorova, K. S., and Toukach, P. V. (2014). Carbohydrate structure generalization scheme for database-driven simulation of experimental observables, such as NMR chemical shifts. J. Chem. Inf. Model. 54, 2594–2611. doi: 10.1021/ci500267u
Karygianni, L., Ren, Z., Koo, H., and Thurnheer, T. (2020). Biofilm matrixome: Extracellular components in structured microbial communities. Trends Microbiol. 28, 668–681. doi: 10.1016/j.tim.2020.03.016
Kates, M. (1972). “Techniques in lipidology,” in Laboratory techniques in biochemistry and molecular biology, Vol. 3, eds T. S. Work and E. Work (Amsterdam: Elsevier/North-Holland), 267–610.
Kiseleva, A. A., Solovyeva, T. V., Ovcharova, M. A., Geras’ kina, O. V., Mart’yanov, S. V., Cherdyntseva, T. A., et al. (2022). Effect of β-estradiol on mono-and mixed-species biofilms of human commensal bacteria Lactobacillus paracasei AK508 and Micrococcus luteus C01 on different model surfaces. Coatings 12:436.
Knirel, Y. A., and Valvano, M. A. (2013). “Bacterial polysaccharide structure and biosynthesis,” in Encyclopedia of biophysics, ed. G. C. K. Roberts (Berlin: Springer), 62–168.
Kopitsyn, D. S., Gorbachevskii, M. V., Botchkova, E. A., Bychenko, M. A., and Novikov, A. A. (2019). Identification of bacteria by surface-enhanced Raman spectra after peroxide treatment. Appl. Biochem. Microbiol. 55, 78–82. doi: 10.1134/S0003683819010095
Kovalchuk, S. I., Jensen, O. N., and Rogowska-Wrzesinska, A. (2019). FlashPack: Fast and simple preparation of ultrahigh-performance capillary columns for LC-MS. Mol. Cell. Proteom. 18, 383–390. doi: 10.1074/mcp.TIR118.000953
Lange-Asschenfeldt, B., Marenbach, D., Lang, C., Patzelt, A., Ulrich, M., Maltusch, A., et al. (2011). Distribution of bacteria in the epidermal layers and hair follicles of the human skin. Skin Pharmacol. Physiol. 24, 305–311.
Leontein, K., and Lönngren, J. (1993). Determination of the absolute configuration of sugars by gas-liquid chromatography of their acetylated 2-octyl glycosides. Methods Carbohydr. Chem. 9, 87–89.
Lipkind, G. M., Shashkov, A. S., Knirel, Y. A., Vinogradov, E. V., and Kochetkov, N. K. (1988). A computer-assisted structural analysis of regular polysaccharides on the basis of 13C-n.m.r. data. Carbohydr. Res. 75, 59–75. doi: 10.1016/0008-6215(88)80156-3
Mart’yanov, S. V., Botchkova, E. A., Plakunov, V. K., and Gannesen, A. V. (2021). The impact of norepinephrine on mono-species and dual-species staphylococcal biofilms. Microorganisms 9:820. doi: 10.3390/microorganisms9040820
Mauclaire, L., and Egli, M. (2010). Effect of simulated microgravity on growth and production of exopolymeric substances of Micrococcus luteus space and earth isolates. FEMS Microbiol. Immunol. 59, 350–356. doi: 10.1111/j.1574-695X.2010.00683.x
N’Diaye, A., Mijouin, L., Hillion, M., Diaz, S., Konto-Ghiorghi, Y., Percoco, G., et al. (2016). Effect of substance P in Staphylococcus aureus and Staphylococcus epidermidis virulence: Implication for skin homeostasis. Front. Microbiol. 7:506. doi: 10.3389/fmicb.2016.00506
Netzer, R., Stafsnes, M. H., Andreassen, T., Goksøyr, A., Bruheim, P., and Brautaset, T. (2010). Biosynthetic pathway for γ-cyclic sarcinaxanthin in Micrococcus luteus: Heterologous expression and evidence for diverse and multiple catalytic functions of C(50) carotenoid cyclases. J. Bacteriol. 192, 5688–5699. doi: 10.1128/JB.00724-10
Nichols, B. W. (1963). Separation of the lipids of photosynthetic tissues: Improvements in analysis by thin-layer chromatography. Biochim. Biophys. Acta 70, 417–422. doi: 10.1016/0006-3002(63)90771-6
Ovcharova, M. A., Geraskina, O. V., Danilova, N. D., Botchkova, E. A., Martyanov, S. V., Feofanov, A. V., et al. (2021). Atrial natriuretic peptide affects skin commensal Staphylococcus epidermidis and Cutibacterium acnes dual-species biofilms. Microorganisms 9:552. doi: 10.3390/microorganisms9030552
Ovchinnikova, O. G., Liu, B., Kocharova, N. A., Shashkov, A. S., Kondakova, A. N., Siwinska, M., et al. (2012). Structure of a peptidoglycan-related polysaccharide from Providencia alcalifaciens O45. Biochemistry (Mosc) 77, 609–615. doi: 10.1134/S0006297912060077
Pakkiri, L. S., Wolucka, B. A., Lubert, E. J., and Waechter, C. J. (2004). Structural and topological studies on the lipid-mediated assembly of a membrane-associated lipomannan in Micrococcus luteus. Glycobiology 14, 73–81. doi: 10.1093/glycob/cwh012
Perez-Riverol, Y., Bai, J., Bandla, C., Hewapathirana, S., García-Seisdedos, D., Kamatchinathan, S., et al. (2022). The PRIDE database resources in 2022: A Hub for mass spectrometry-based proteomics evidences. Nucleic Acids Res. 50, D543–D552. doi: 10.1093/nar/gkab1038
Peterson, S. L., Bennett, L. G., and Tornabene, T. G. (1975). Effects of lead on the lipid compusition of Micrococcus luteus Cells. Appl. Microbiol. 29, 669–679. doi: 10.1128/am.29.5.669-679.1975
Reading, N. C., Torres, A. G., Kendall, M. M., Hughes, D. T., Yamamoto, K., and Sperandio, V. (2007). A novel two-component signaling system that activates transcription of an enterohemorrhagic Escherichia coli effector involved in remodeling of host actin. J. Bacteriol. 189, 2468–2476. doi: 10.1128/JB.01848-06
Rosay, T., Bazire, A., Diaz, S., Clamens, T., Blier, A. S., Mijouin, L., et al. (2015). Pseudomonas aeruginosa expresses a functional human natriuretic peptide receptor ortholog: Involvement in biofilm formation. MBio. 6:e1033-15. doi: 10.1128/mBio.01033-15
Sawardeker, J. S., Sloneker, J. H., and Jeanes, A. (1965). Quantitative determination of monosaccharides as their alditol acetates by gas liquid chromatography. Anal. Chem. 37, 1602–1603.
Scardaci, R., Bietto, F., Racine, P. J., Boukerb, A. M., Lesouhaitier, O., Feuilloley, M. G., et al. (2022). Norepinephrine and serotonin can modulate the behavior of the probiotic Enterococcus faecium NCIMB10415 towards the host: Is a putative surface sensor involved→ Microorganisms 10:487. doi: 10.3390/microorganisms10030487
Shashkov, A. S., Lipkind, G. M., Knirel, Y. A., and Kochetkov, N. K. (1988). Stereochemical factors determining the effects of glycosylation on the 13C chemical shifts in carbohydrates. Magn. Reson. Chem. 26, 735–747. doi: 10.1016/j.carres.2012.08.016
Singh, S., Datta, S., Narayanan, K. B., and Rajnish, K. N. (2021). Bacterial exo-polysaccharides in biofilms: Role in antimicrobial resistance and treatments. J. Genet. Eng. Biotechnol. 19, 1–19. doi: 10.1186/s43141-021-00242-y
Toukach, P. V., and Egorova, K. S. (2016). Carbohydrate structure database merged from bacterial, archaeal, plant and fungal parts. Nucleic Acid Res. 44, D1229–D1236. doi: 10.1093/nar/gkv840
Tyanova, S., Temu, T., and Cox, J. (2016a). The MaxQuant computational platform for mass spectrometry-based shotgun proteomics. Nat. Protoc. 11, 2301–2319.
Tyanova, S., Temu, T., Sinitcyn, P., Carlson, A., Hein, M. Y., Geiger, T., et al. (2016b). The perseus computational platform for comprehensive analysis of (prote)omics data. Nat. Methods 13, 731–740. doi: 10.1038/nmeth.3901
Vaskovsky, V. E., Kostetsky, E. Y., and Vasendin, I. M. (1975). A universal reagent for phospholipid analysis. J. Chromatogr. A 114, 129–141.
Vergara, E., Neira, G., González, C., Cortez, D., Dopson, M., and Holmes, D. S. (2020). Evolution of predicted acid resistance mechanisms in the extremely acidophilic Leptospirillum genus. Genes 11:389. doi: 10.3390/genes11040389
Walkley, A. (1947). A critical examination of a rapid method for determining organic carbon in soils—Effect of variations in digestion conditions and of inorganic soil constituents. Soil Sci. 63, 251–264.
Willets, K. A. (2009). Surface-enhanced Raman scattering (SERS) for probing internal cellular structure and dynamics. Anal. Bioanal. Chem. 394, 85–94.
Zdorovenko, E. L., Gannesen, A. V., Dmitrenok, A. S., Zhurina, M. V., Mart’yanov, S. V., and Shashkov, A. S. (2021). Structure of cell-wall glycopolymers of Micrococcus luteus C01. Carbohydr. Res. 506:108356. doi: 10.1016/j.carres.2021.108356
Keywords: Micrococcus luteus, epinephrine, biofilms, biofilm matrix, human skin microbiota, host–microbiota interactions, NMR, mass spectrometry
Citation: Gannesen AV, Ziganshin RH, Zdorovenko EL, Klimko AI, Ianutsevich EA, Danilova OA, Tereshina VM, Gorbachevskii MV, Ovcharova MA, Nevolina ED, Martyanov SV, Shashkov AS, Dmitrenok AS, Novikov AA, Zhurina MV, Botchkova EA, Toukach PV and Plakunov VK (2022) Epinephrine extensively changes the biofilm matrix composition in Micrococcus luteus C01 isolated from human skin. Front. Microbiol. 13:1003942. doi: 10.3389/fmicb.2022.1003942
Received: 26 July 2022; Accepted: 22 August 2022;
Published: 20 September 2022.
Edited by:
Ezio Ricca, University of Naples Federico II, ItalyReviewed by:
Angela Casillo, University of Naples Federico II, ItalyAnella Saggese, University of Naples Federico II, Italy
Copyright © 2022 Gannesen, Ziganshin, Zdorovenko, Klimko, Ianutsevich, Danilova, Tereshina, Gorbachevskii, Ovcharova, Nevolina, Martyanov, Shashkov, Dmitrenok, Novikov, Zhurina, Botchkova, Toukach and Plakunov. This is an open-access article distributed under the terms of the Creative Commons Attribution License (CC BY). The use, distribution or reproduction in other forums is permitted, provided the original author(s) and the copyright owner(s) are credited and that the original publication in this journal is cited, in accordance with accepted academic practice. No use, distribution or reproduction is permitted which does not comply with these terms.
*Correspondence: Andrei V. Gannesen, YW5kcmVpLmdhbm5lc2VuQGdtYWlsLmNvbQ==