- 1College of Food Science and Engineering, Northwest A&F University, Xianyang, China
- 2School of Food Science, Henan Institute of Science and Technology, Xinxiang, China
Alicyclobacillus acidoterrestris is a major concern in fruit juice industry due to its spoilage potential of acidic fruit juice. Quantifying the expression levels of functional genes by real-time quantitative polymerase chain reaction (RT-qPCR) is necessary to elucidate the response mechanisms of A. acidoterrestris to acid stress. However, appropriate reference genes (RGs) for data normalization are required to obtain reliable RT-qPCR results. In this study, eight novel candidate RGs were screened based on transcriptome datasets of A. acidoterrestris under acid stress. The expression stability of eight new RGs and commonly used RG 16s rRNA was assessed using geNorm, NormFinder, and BestKeeper algorithms. Moreover, the comprehensive analysis using the RefFinder program and the validation using target gene ctsR showed that dnaG and dnaN were the optimal multiple RGs for normalization at pH 4.0; ytvI, dnaG, and 16s rRNA at pH 3.5; icd and dnaG at pH 3.0; and ytvI, dnaG, and spoVE at pH 2.5. This study revealed for the first time that A. acidoterrestris had different suitable RGs under different acid conditions, with implications for further deciphering the acid response mechanisms of this spoilage-causing bacterium.
Introduction
Commercial fruit juices have been widely regarded as safe from pathogenic and spoilage-causing microorganisms due to their inherent high acidity, unfavorable for microbial survival, growth, and proliferation (Kakagianni et al., 2018). However, a large-scale spoilage incident of pasteurized apple juice occurred in 1982, in which Alicyclobacillus acidoterrestris was identified as the causative agent (Cerny et al., 1984). Thereafter, A. acidoterrestris related contamination has been reported in various fruit juices and beverages (Smit et al., 2011; Pornpukdeewattana et al., 2020).
Alicyclobacillus acidoterrestris is a Gram-positive, spore-forming, thermo-acidophilic and strictly aerobic bacterium (Smit et al., 2011). The unique heat and acid resistance of A. acidoterrestris enable it to survive commercial pasteurization and further grow and multiply in acidic fruit juice to produce distinct antiseptic, disinfectant, or medicinal off-flavors, causing product deterioration. Such incidents of spoilage have caused considerable economic loss and posed a challenge for the microbial stability of fruit juices worldwide (Witthuhn et al., 2012). Hence, it is imperative to develop effective detection and control measures to avoid the contamination of this bacterium without affecting the nutrition and flavor of fruit juice (Pornpukdeewattana et al., 2020). To achieve this goal, the in-depth profile of the molecular regulatory mechanism of A. acidoterrestris resistance to heat and acid stress is essential. Specifically, the expression pattern of target genes under stress conditions must be fully elucidated.
The quantification of functional gene expression levels is one of the most important aspects in systematic clarifying gene transcription and regulation (Chen et al., 2020). To date, the reverse transcription quantitative real-time polymerase chain reaction (RT-qPCR) method has been the preferred method to quantify the target gene expression level due to its high accuracy, sensitivity, and reproducibility. It is also commonly used to confirm the result obtained by RNA sequencing (RNA-seq) (Shakeel et al., 2017). However, the RT-qPCR assay relies on the stably expressed reference genes (RGs) to obtain expression data of genes in different spatial-temporal conditions. An inadequate use of RG may lead to biased gene expression profiles and low reproducibility (Huggett et al., 2005; Guenin et al., 2009; Chen et al., 2020). More and more evidence shows that the expression of RGs fluctuates considerably under different conditions, and no single RG is suitable for all gene expression analysis assays. The main factors introducing the instability of RGs expression include different species, cell types, tissues, cell developmental stages, and experimental treatment conditions (Everaert et al., 2011; Park et al., 2015; Peng et al., 2018; de Lázaro and Kostarelos, 2019). In previous studies, genes such as glyceraldehyde-3-phosphate dehydrogenase (GAPDH), β-actin (ACTB), β-tubulin 2 (β-TUB2), ubiquitin C (UBC), and rRNA are often used as RGs because of their functions in basic cellular processes (Fulvio et al., 2020; Gonzalez-Pujana et al., 2020). However, several studies have shown that these traditional RGs have variable expression levels and are not stably expressed in all experimental conditions. Glare et al. (2002) and Everaert et al. (2011) found that the GAPDH and ACTB displayed high expression variability across healthy and diseased mouse tissues. Meanwhile, the 16s rRNA demonstrated large variability in stability for many bacterial organisms depending on the conditions studied (Liu et al., 2013; Peng et al., 2018). Thus, it is better to evaluate the utility of potential RGs under specific experimental conditions.
For A. acidoterrestris, all current studies related to stress responses at the molecular level have used only a single RG (16s rRNA) (Jiao et al., 2015; Feng et al., 2019; Zhao et al., 2021). No reports are available about credible RG selection in A. acidoterrestris, which limits further disclosure on its stress tolerance mechanisms. Therefore, a systematic research on stably expressed RGs of A. acidoterrestris under stress conditions is required. The RNA-seq technique provides not only a method to determine gene expression at the transcriptome level but also a novel approach for RGs prediction, which has been successfully applied in multiple species (Alexander et al., 2012; He et al., 2019; Zhang et al., 2020; Jureckova et al., 2021). Therefore, it was hypothesized that the novel and reliable RGs for investigating stress responses in A. acidoterrestris could be predicted using transcriptome data.
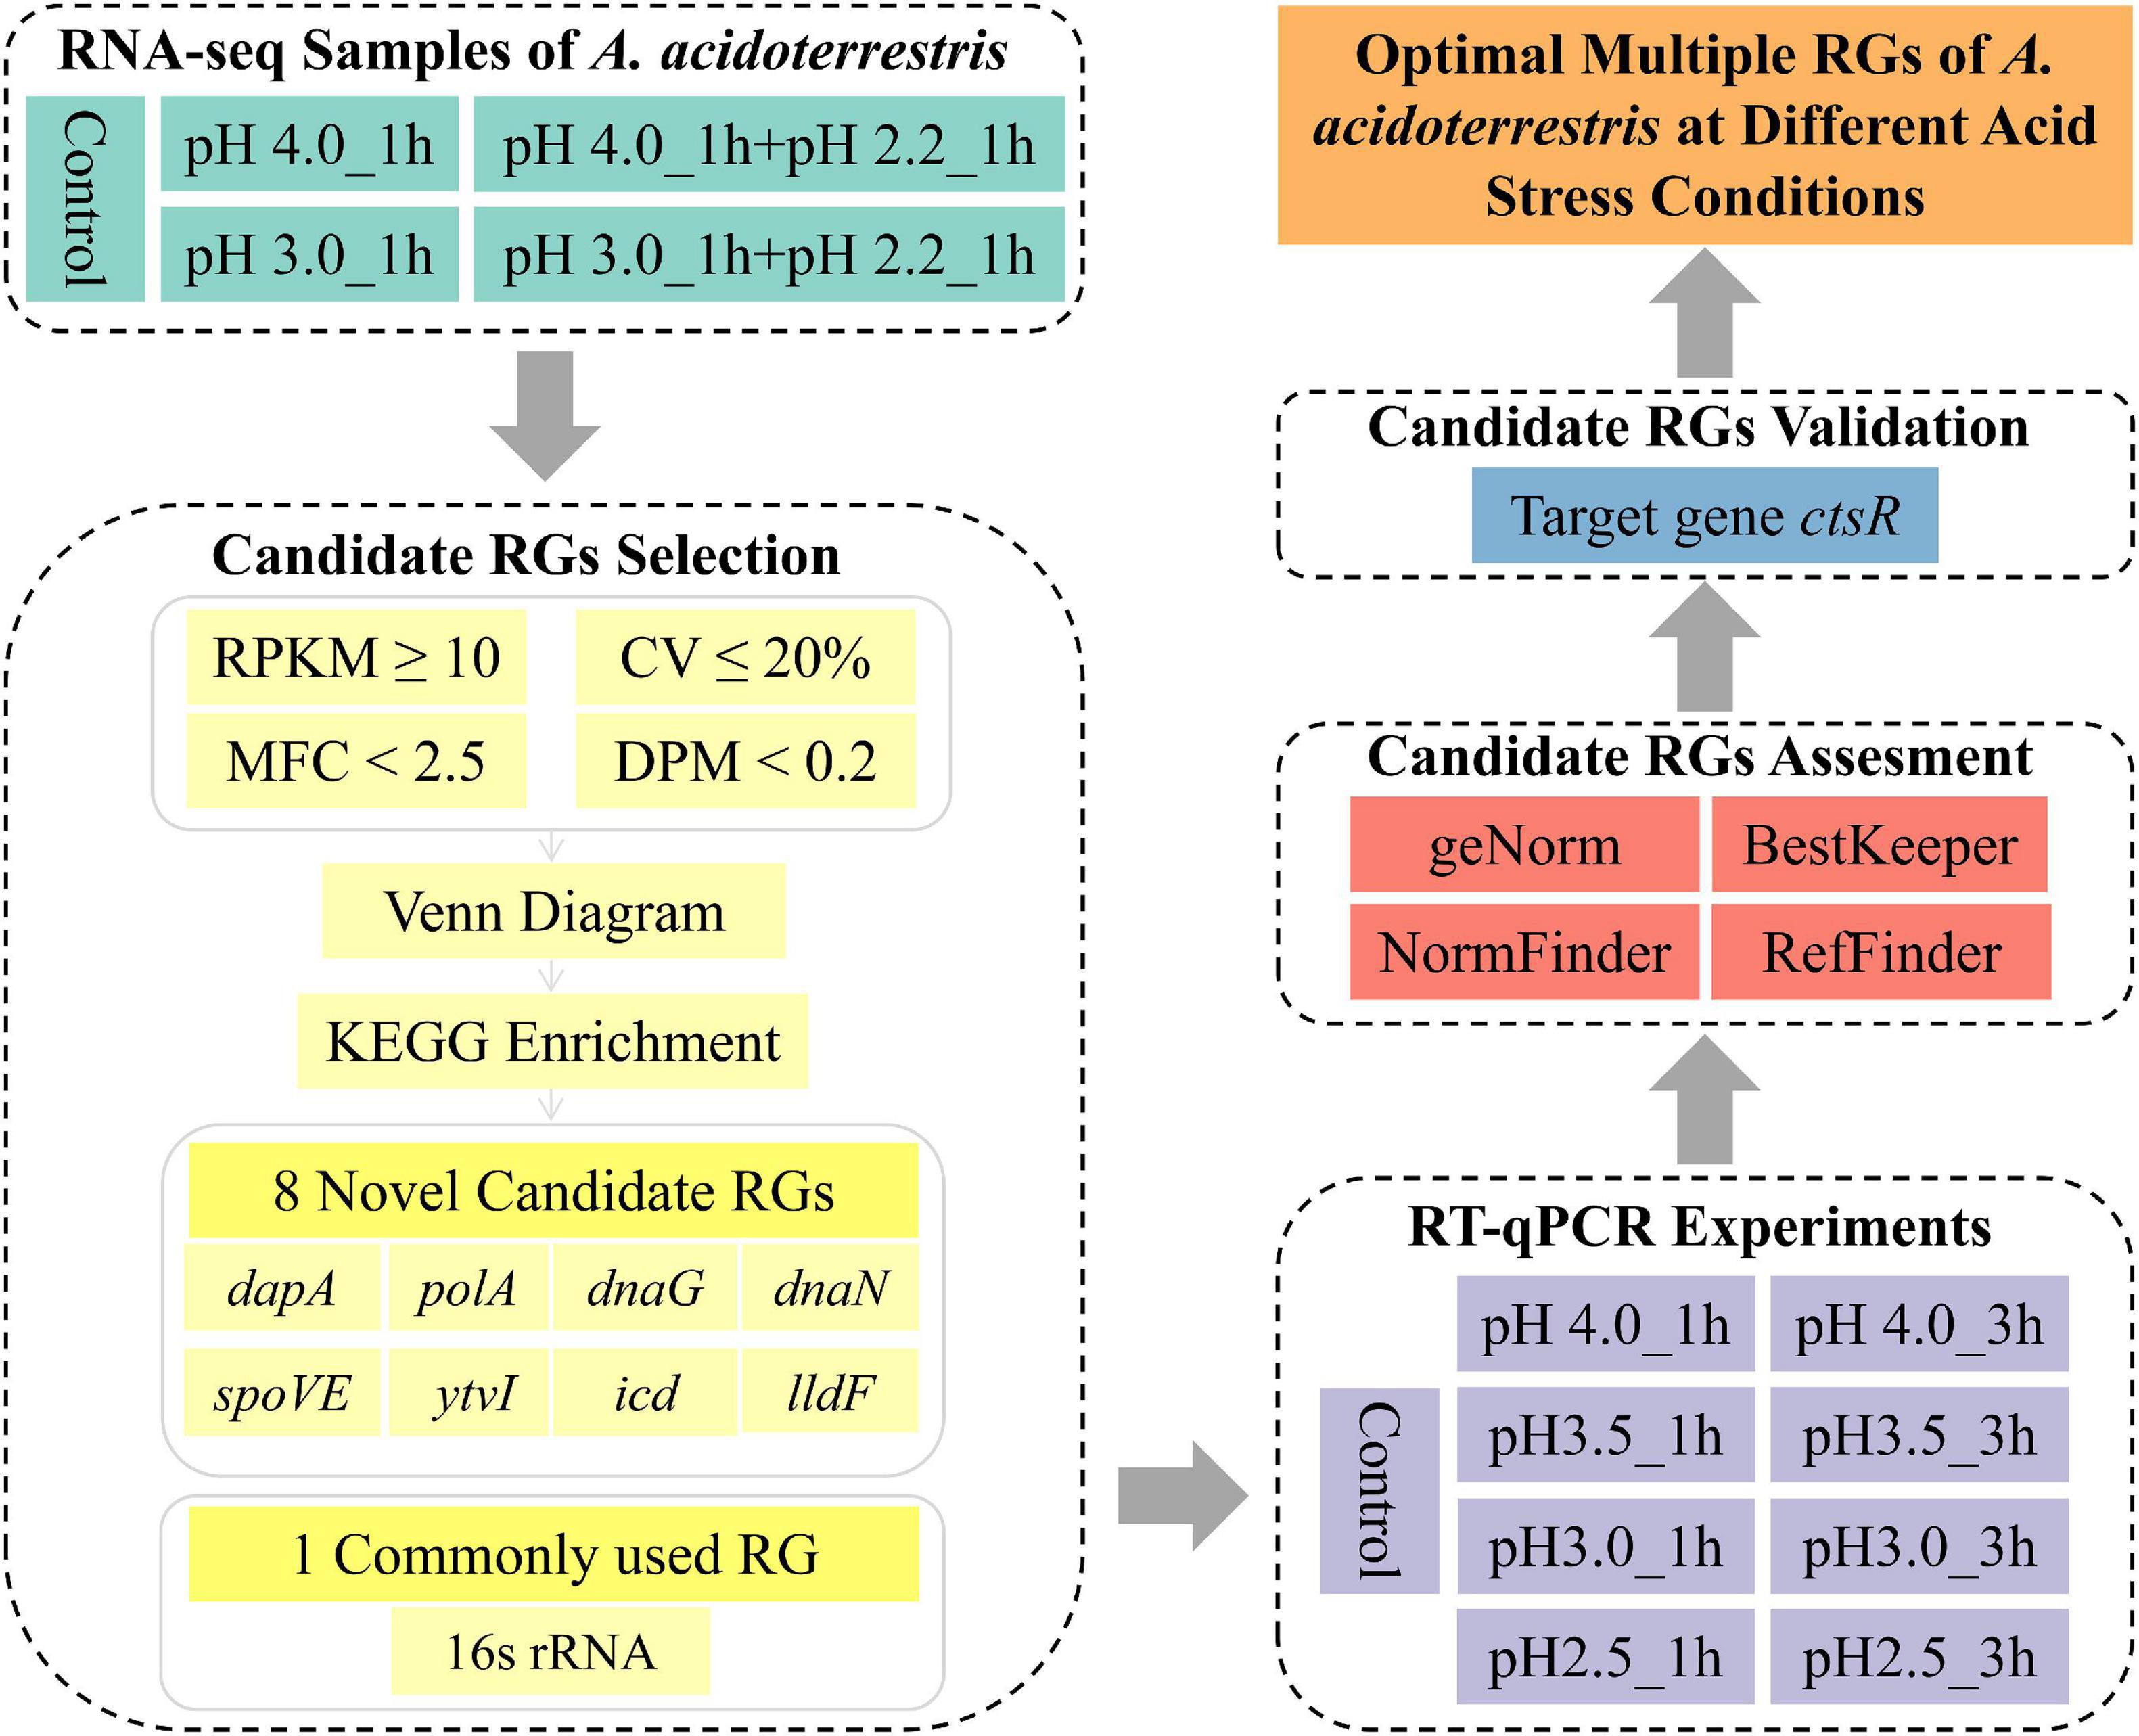
In the present study, the transcriptome data of fifteen acid stress-related samples of A. acidoterrestris were analyzed. Potential RGs were predicted on a genome-wide scale based on their relatively stable expression levels, of which eight genes (polA, icd, dnaG, dapA, dnaN, ytvI, spoVE, and lldF) were selected. The commonly used RG (16s rRNA) was selected for comparison. These nine candidate RGs were amplified using RT-qPCR in nine groups of samples with different acid stress treatments. Three different algorithms (geNorm, NormFinder, and BestKeeper) and a comprehensive program (RefFinder) were used to evaluate the stability of each RG. Finally, the reliability of recommended optimal RGs was validated using the target gene (ctsR). The overall workflow of this study is shown in Figure 1. The results of this study might serve as potential resources for dissecting the response mechanisms of A. acidoterrestris to acid stress.
Materials and Methods
Bacterial Strain and Growth Conditions
A. acidoterrestris DSM 3922T was purchased from Deutsche Sammlung von Mikroorganismen und Zellkulturen (DSMZ, Braunschweig, Germany). The A. acidoterrestris medium (AAM) prepared following the method proposed by Jiao et al. (2015) was used as culture medium. The bacterial stock culture was thawed at room temperature and then streaked onto AAM agar incubating at 45°C for 24 h. Then, a single colony was transferred to 50 mL of AAM broth and incubated at 45°C with shaking at 150 rpm for 12 h. The activated culture was obtained after a consecutive transfer (2%, v/v) under the same conditions.
Preparation of Acid Stress Samples
Cells grown to the mid-log phase (6 h) were divided into five equal parts, centrifuged, and washed with sterile saline. Four parts of cell pellets were suspended in the same volume of fresh AAM broth with adjusted pH values (pH 3.5, 3.0, and 2.5) or normal AAM broth (pH 4.0), and then incubated at 45°C with shaking at 150 rpm. The pH values were adjusted by addition of 1 mol/L HCl. Samples were collected at 1 h and 3 h after acid stress. The mid-log phase cells without acid stress was used as a control. All treatments were performed in triplicate using independent cultures. The collected cells were washed, and the cell pellets were lyophilized immediately using liquid nitrogen and subsequently subjected to RNA extraction.
RNA Extraction and cDNA Synthesis
Total RNA was extracted using an RNAiso Kit following the manufacturer’s protocols (TakaRa, Japan). The quality and concentration of RNA samples were determined using a NanoDrop 2000 spectrophotometer (Thermo Scientific, United States), and the integrity was further analyzed in Agilent 2100 (Agilent Technologies, DE). The qualified RNA was reverse transcribed to cDNA using a PrimeScript RT reagent kit with gDNA Eraser (TakaRa, Japan) (He et al., 2018). The reverse transcription assay (20 μL volume) was performed according to the following steps: 37°C for 15 min, 85°C for 5 s, cool down to 4°C. cDNA was stored at −20°C until RT-qPCR analyses.
Candidate RGs Selection
Transcriptome sequencing of A. acidoterrestris under acid stress was performed by RNA-seq on an Illumina HiSeqTM2500 platform (unpublished data, Figure 1). The values of reads per kilobase of transcript per million mapped reads (RPKM) were calculated using Cufflinks after quality control and filtration of low-quality raw sequence data (Park et al., 2018). The coefficient of variation (CV,%) and maximum fold change (MFC) were calculated using Microsoft Excel based on the RPKM value of every gene in each sample. The CV is defined as the ratio of the standard deviation (SD) to the mean of the FPKM of all samples for one gene, while the MFC is defined as the fold change between the largest and smallest RPKM values within all samples (Zhang et al., 2020). Meanwhile, the dispersion measure (DPM) was calculated on the pattern gene finder (PaGeFinder) website1 (Pan et al., 2012). Probability density curves of FPKM, CV, DPM, and MFC of transcripts with credible function annotation and high expression levels (RPKM ≥ 10) were fitted and drawn using the Origin software. Venn diagram analysis and Kyoto Encyclopedia of Genes and Genomes (KEGG) enrichment was performed using the OmicShare online platform tools2.
Primers Design and Amplification Efficiency Analysis
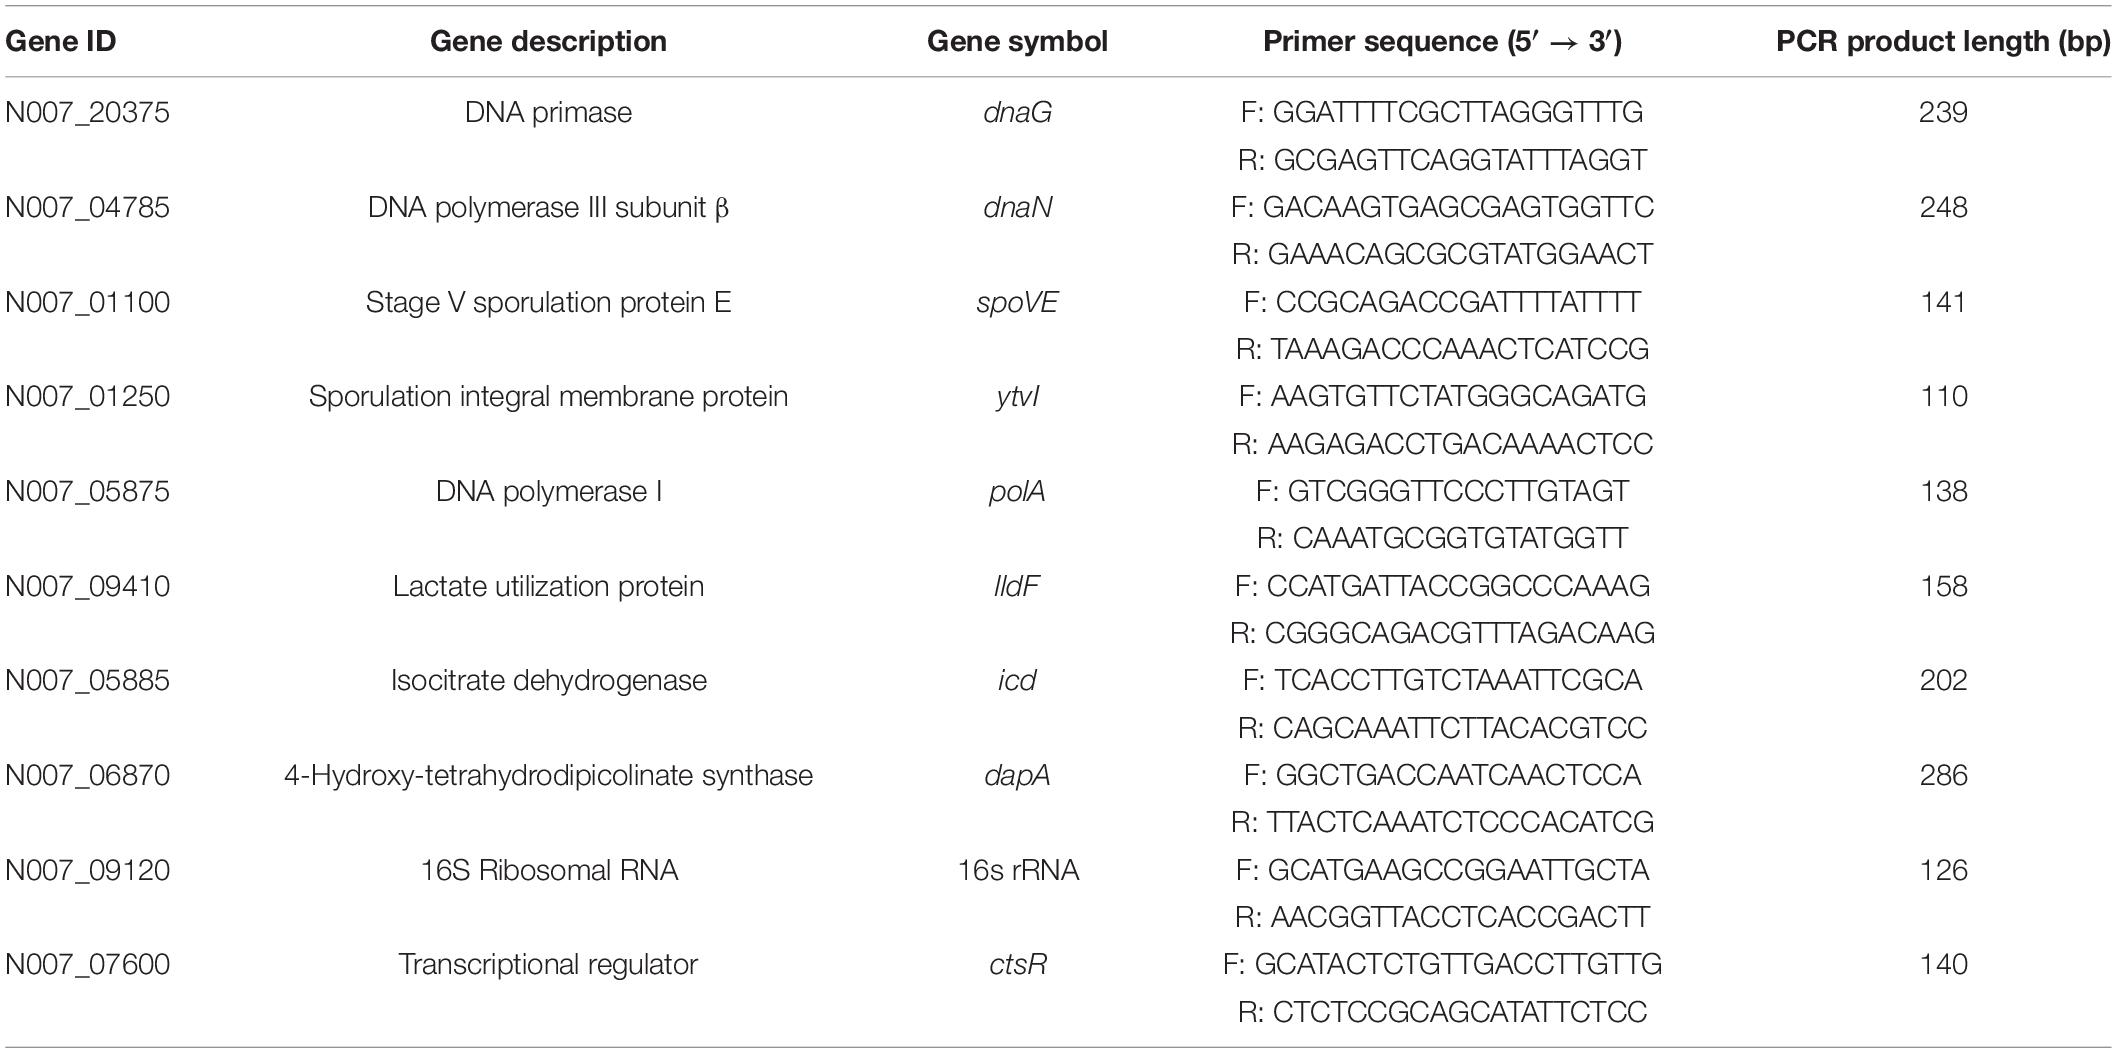
Specific primer pairs for candidate RGs and target gene were designed using Primer 5 and are listed in Table 1. Primers were synthesized by AuGCT DNA-SYN Biotechnology Company (Beijing, China), and further purified with polyacrylamide gel electrophoresis (PAGE) method. Amplification efficiencies (E) and correlation coefficients (R2 values) of genes were generated using slopes of the standard curves obtained from tenfold diluted cDNA series. The E-value was calculated using the formula: E (%) = [10(–1/slope) − 1] × 100.
RT-qPCR Analysis
The assays were carried out in a 25-μL reaction containing 12.5 μL of TB Green Premix Ex Taq (Tli RNaseH Plus) (TakaRa, Japan), 1.0 μL each of the forward and reverse primers (0.4 μM), 2 μL of template cDNA (<100 ng), and 8.5 μL of nuclease-free water. Quantitative amplification was performed in a CFX-96 thermal cycler (Bio-Rad Laboratories, United States) as follows: 1 cycle at 95°C for 30 s, 40 cycles at 95°C for 5 s, and 60°C for 30 s. To confirm product specificity, a melting curve analysis between 60 and 95°C was performed after each amplification. No-template and no-RT controls for each primer pair were included. Each RT-qPCR was performed in triplicate, and each experiment was independently repeated three times.
Determination of the Expression Stability of RGs
The expression level of candidate RGs was evaluated according to the quantification cycle (Cq) value. Three statistical algorithms, geNorm (Vandesompele et al., 2002), BestKeeper (Pfaffl et al., 2004), and NormFinder (Andersen et al., 2004) were used to determine the expression stability of candidate RGs. Raw Ct values were directly applied for BestKeeper analysis, but the raw data were converted into relative quantities using the 2–ΔCt method (ΔCt = eachCt − minimumCt) for the other two analyses. Finally, the online tool RefFinder3 was used to confirm whether the three algorithms worked properly and to comprehensively rank RGs from experimental data (Xie et al., 2012).
Validation of the Selected RGs
To validate the selected RGs, the expression level of one target gene (ctsR) was detected with the same cDNA samples used to select RGs. The RT-qPCR conditions were the same as previously described in Section “RT-qPCR Analysis.” The relative expression level of the ctsR gene was calculated using the 2–ΔΔCt method (Livak and Schmittgen, 2001). Four RG strategies were used for data normalization, including the optimal multiple RGs from each treatment, the optimal multiple RGs from all samples, the least stable RG from each treatment, and the commonly used RG (16s rRNA) (Peng et al., 2018). The ΔCt data was used to calculate statistical differences using the one-way analysis of variance (ANOVA) employing Duncan’s test at p < 0.05. Statistical analysis was performed using SPSS version 19.0 (IBM, United States). Three replicates of four independent experiments were performed.
Compliance With the MIQE Guidelines
The RT-qPCR analysis in this work was performed in strict compliance with the minimum information for publication of quantitative real-time PCR experiments (MIQE) guidelines (Bustin et al., 2009) to promote transparency and ensure the reliability and integrity of the results. All experimental procedures were carried out in the investigators’ laboratory, with the exception of the RNA quality assessment, which was performed with Agilent 2100 at the College of Agronomy of Northwest A&F University. The MIQE checklist is detailed in Supplementary Table 6.
Results
Selection of Candidate RGs Based on RNA-Seq Data
RPKM values of all transcripts in each A. acidoterrestris sample were obtained from transcriptome datasets. 2,751 unigenes were first chosen for further RGS selection after removing transcripts without a credible functional annotations or with low expression levels (RPKM = 0). Then, the probability density curve of all 2,751 genes was evaluated using four indicators including RPKM, CV, MFC, and DPM values (Figures 2A–D). Potential RGs were relatively highly expressed genes (Brown et al., 2018). A total of 2010 genes had RPKM values ≥ 10, accounting for 73.06% of all 2,751 genes (blue area, Figure 2A). Meanwhile, the most promising RGs had low expression variability, namely, the lowest CV, MFC, and DPM values (Gao et al., 2018; Zhang et al., 2020). As shown in Figure 2B, 33 genes had a CV value ≤ 20% (1.20% of 2751 genes, yellow area). A more stringent DPM (<0.2) than the default parameter (<0.3) was used. A total 34 genes had the DPM values < 0.2 (1.24% of 2,751 genes, green area) (Figure 2C). The MFC reflects the range of extreme values, and there were 159 genes with MFC < 2.5 (5.78% of 2,751 genes, pink area, Figure 2D).
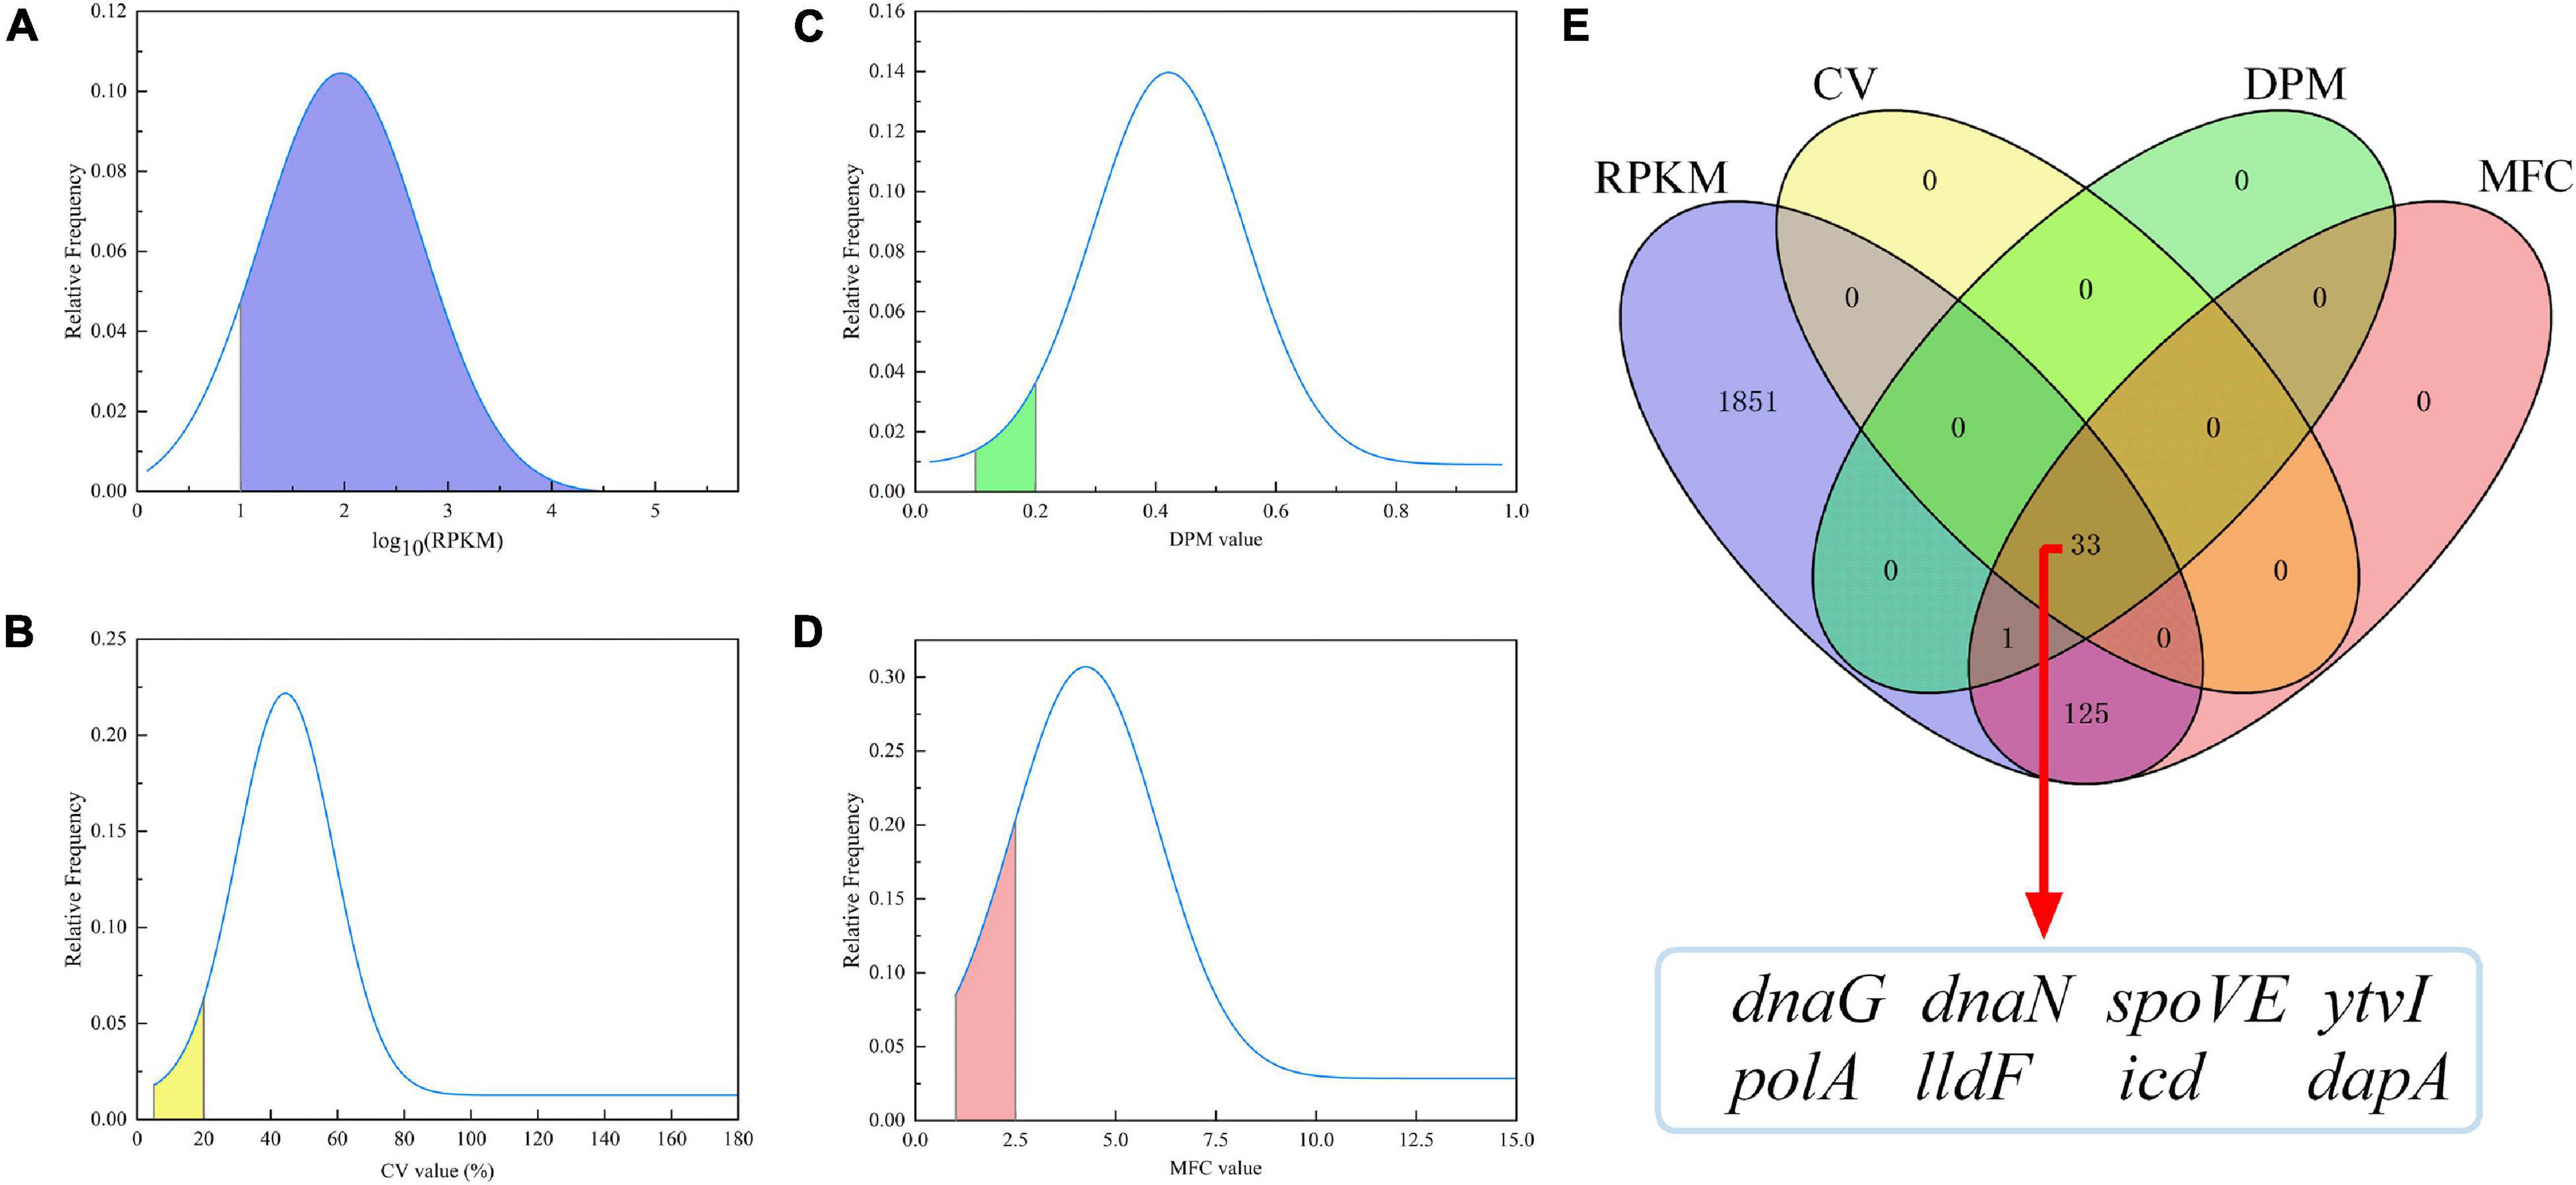
Figure 2. Probability density curve of RPKM, CV, DPM, and MFC values of 2751 genes (A–D), and the overlap genes obtained by the Venn diagram analysis (E). RPKM, reads per kilobase of transcript per million mapped reads; CV, coefficient of variation; DPM, dispersion measure; MFC, maximum fold change.
A Venn diagram analysis was further performed (Figure 2E), in which blue, yellow, green, and pink corresponded to those shown in Figures 2A–D, respectively. A total of 33 genes simultaneously met the aforementioned requirements of four parameters, which were significantly enriched in four KEGG pathways (q < 0.05) (Supplementary Table 1) and were considered as candidate RGs. Of these, eight genes (dapA, spoVE, ytvI, polA, icd, dnaG, lldF, and dnaN) with a relatively lower CV value were selected. The summarized information of eight potential RGs based on transcriptome data and the raw RPKM values are shown in Table 2 and Supplementary Table 2, respectively. In addition, the commonly used RG (16s rRNA) for exploring target gene expression in A. acidoterrestris was included. In total, nine candidate RGs were selected for further assessment.
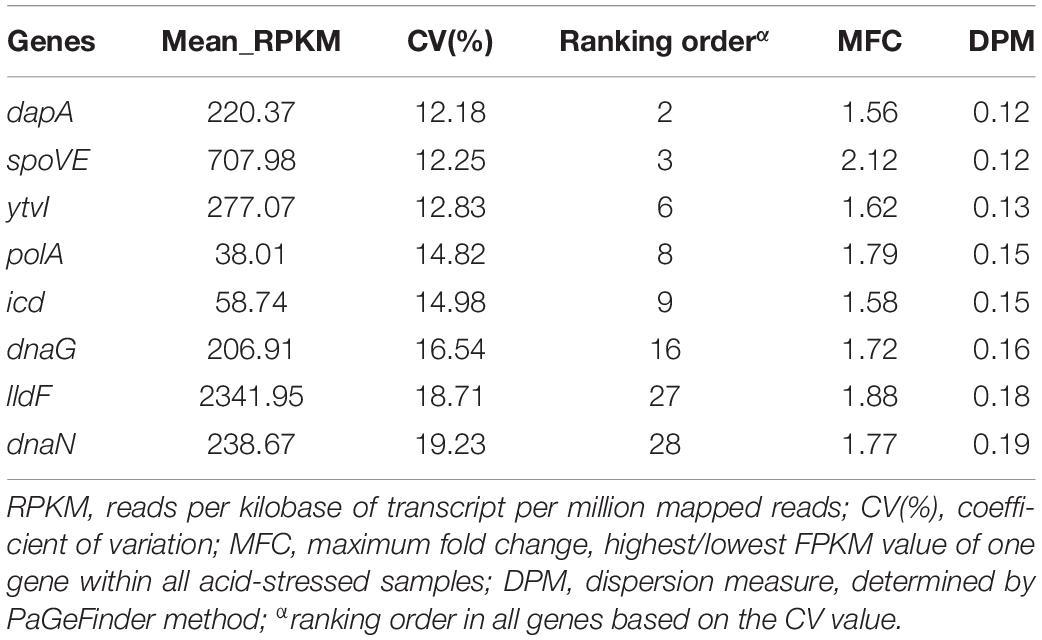
Table 2. The summarized information of candidate reference genes in Alicyclobacillus acidoterrestris based on the transcriptome data.
Determination of Primer Amplification Specificity and Efficiency
As shown in Figure 3A, the melting curves observed from PCR amplification products for each gene had a single distinct sharp peak, indicating the absence of non-specific amplicons or primer dimers. The amplification efficiency varied from 99.85% (16s rRNA) to 101.95% (spoVE), and the linear correlation coefficients (R2) were from 0.9968 (ctsR) to 0.9996 (lldF) (Figure 3B). Therefore, each pair of primers had good amplification specificity and efficiency, and can be used in RT-qPCR analysis.
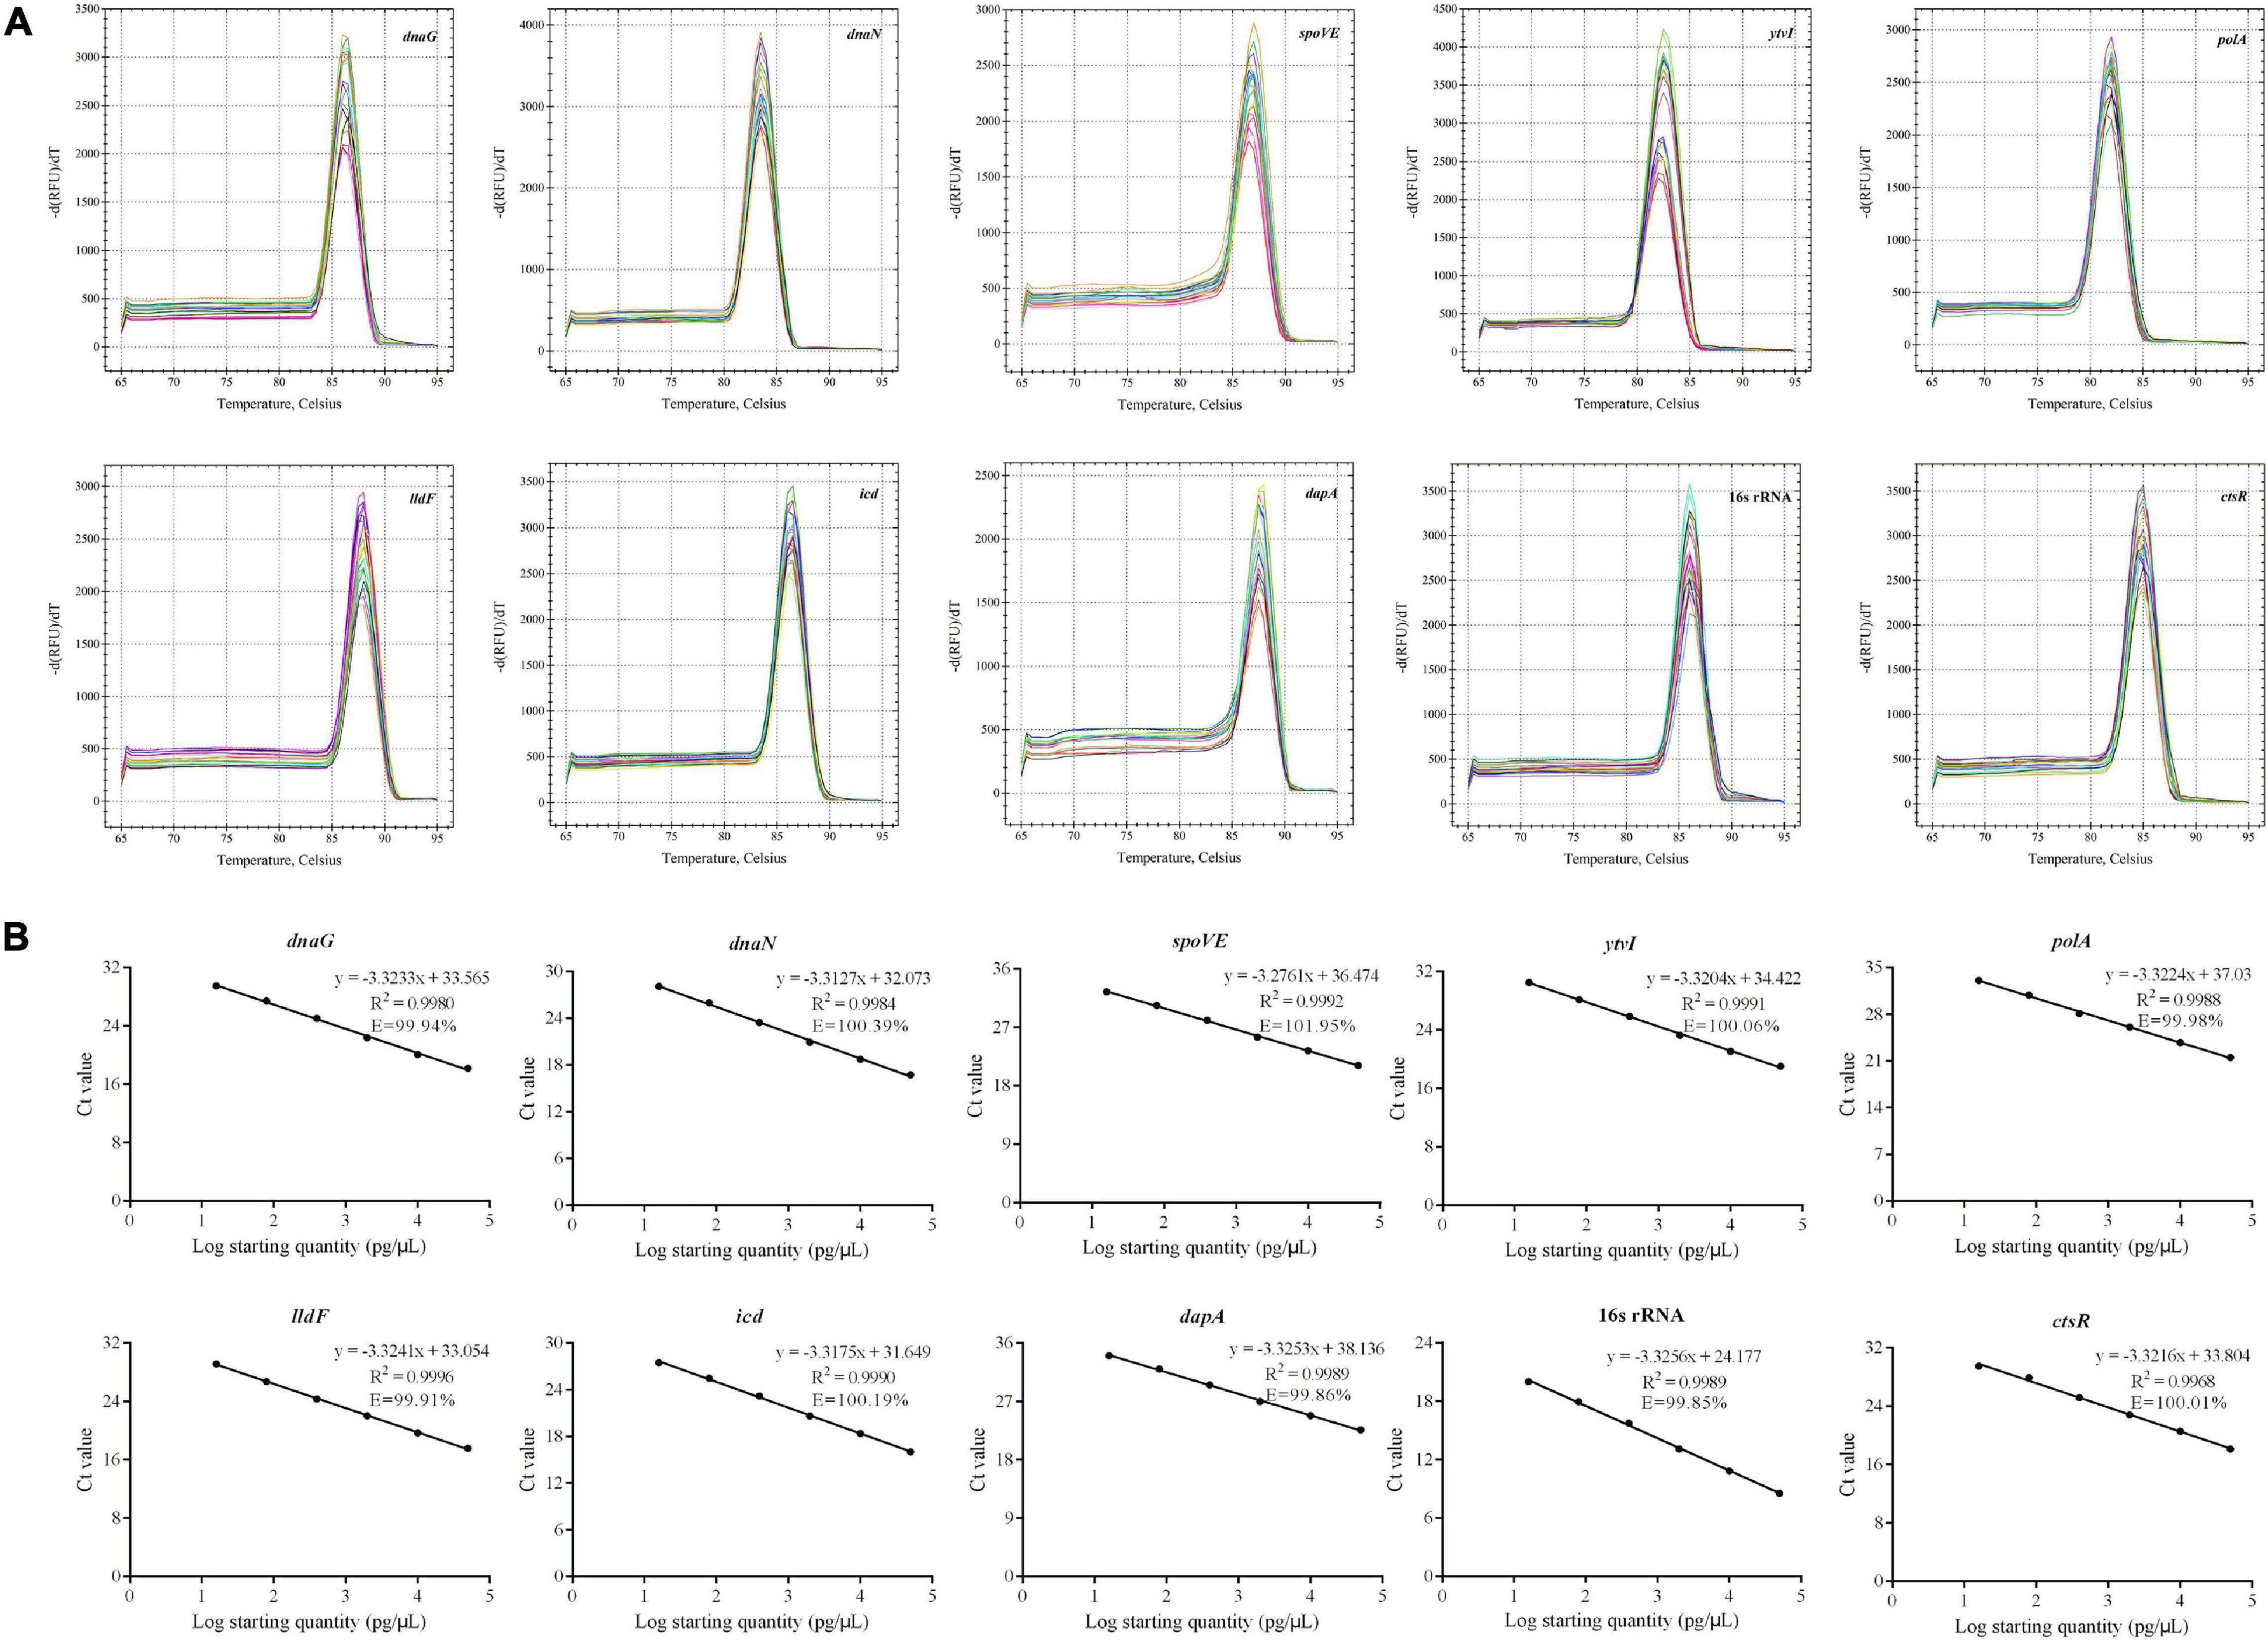
Figure 3. Confirmation of the primer amplification specificity and efficiency of candidate reference genes and target gene. (A) Melting curve analysis; (B) standard curves showing the correlation between the copies and the quantification cycle (Cq) values.
Expression Profiles of Candidate RGs
The cycle threshold (Ct) values were detected across all samples to determine the transcriptional differences among nine candidate RGs. Globally, the tested RGs featured a relatively wide expression variation, with the Ct values ranging from 9.61 to 25.54 (Figure 4 and Supplementary Table 3). The gene with the highest expression level was 16s rRNA, with the lowest mean Ct value (11.34), and the lowest was spoVE with the highest mean Ct value (23.46). The narrower the SD range of a gene was, the higher its expression stability in different samples was. The top three RGs with low SDs were polA (0.734), ytvI (0.756), and dnaG (0.964), while the three most variably expressed genes were icd (1.299), dnaN (1.594), and lldF (2.011).
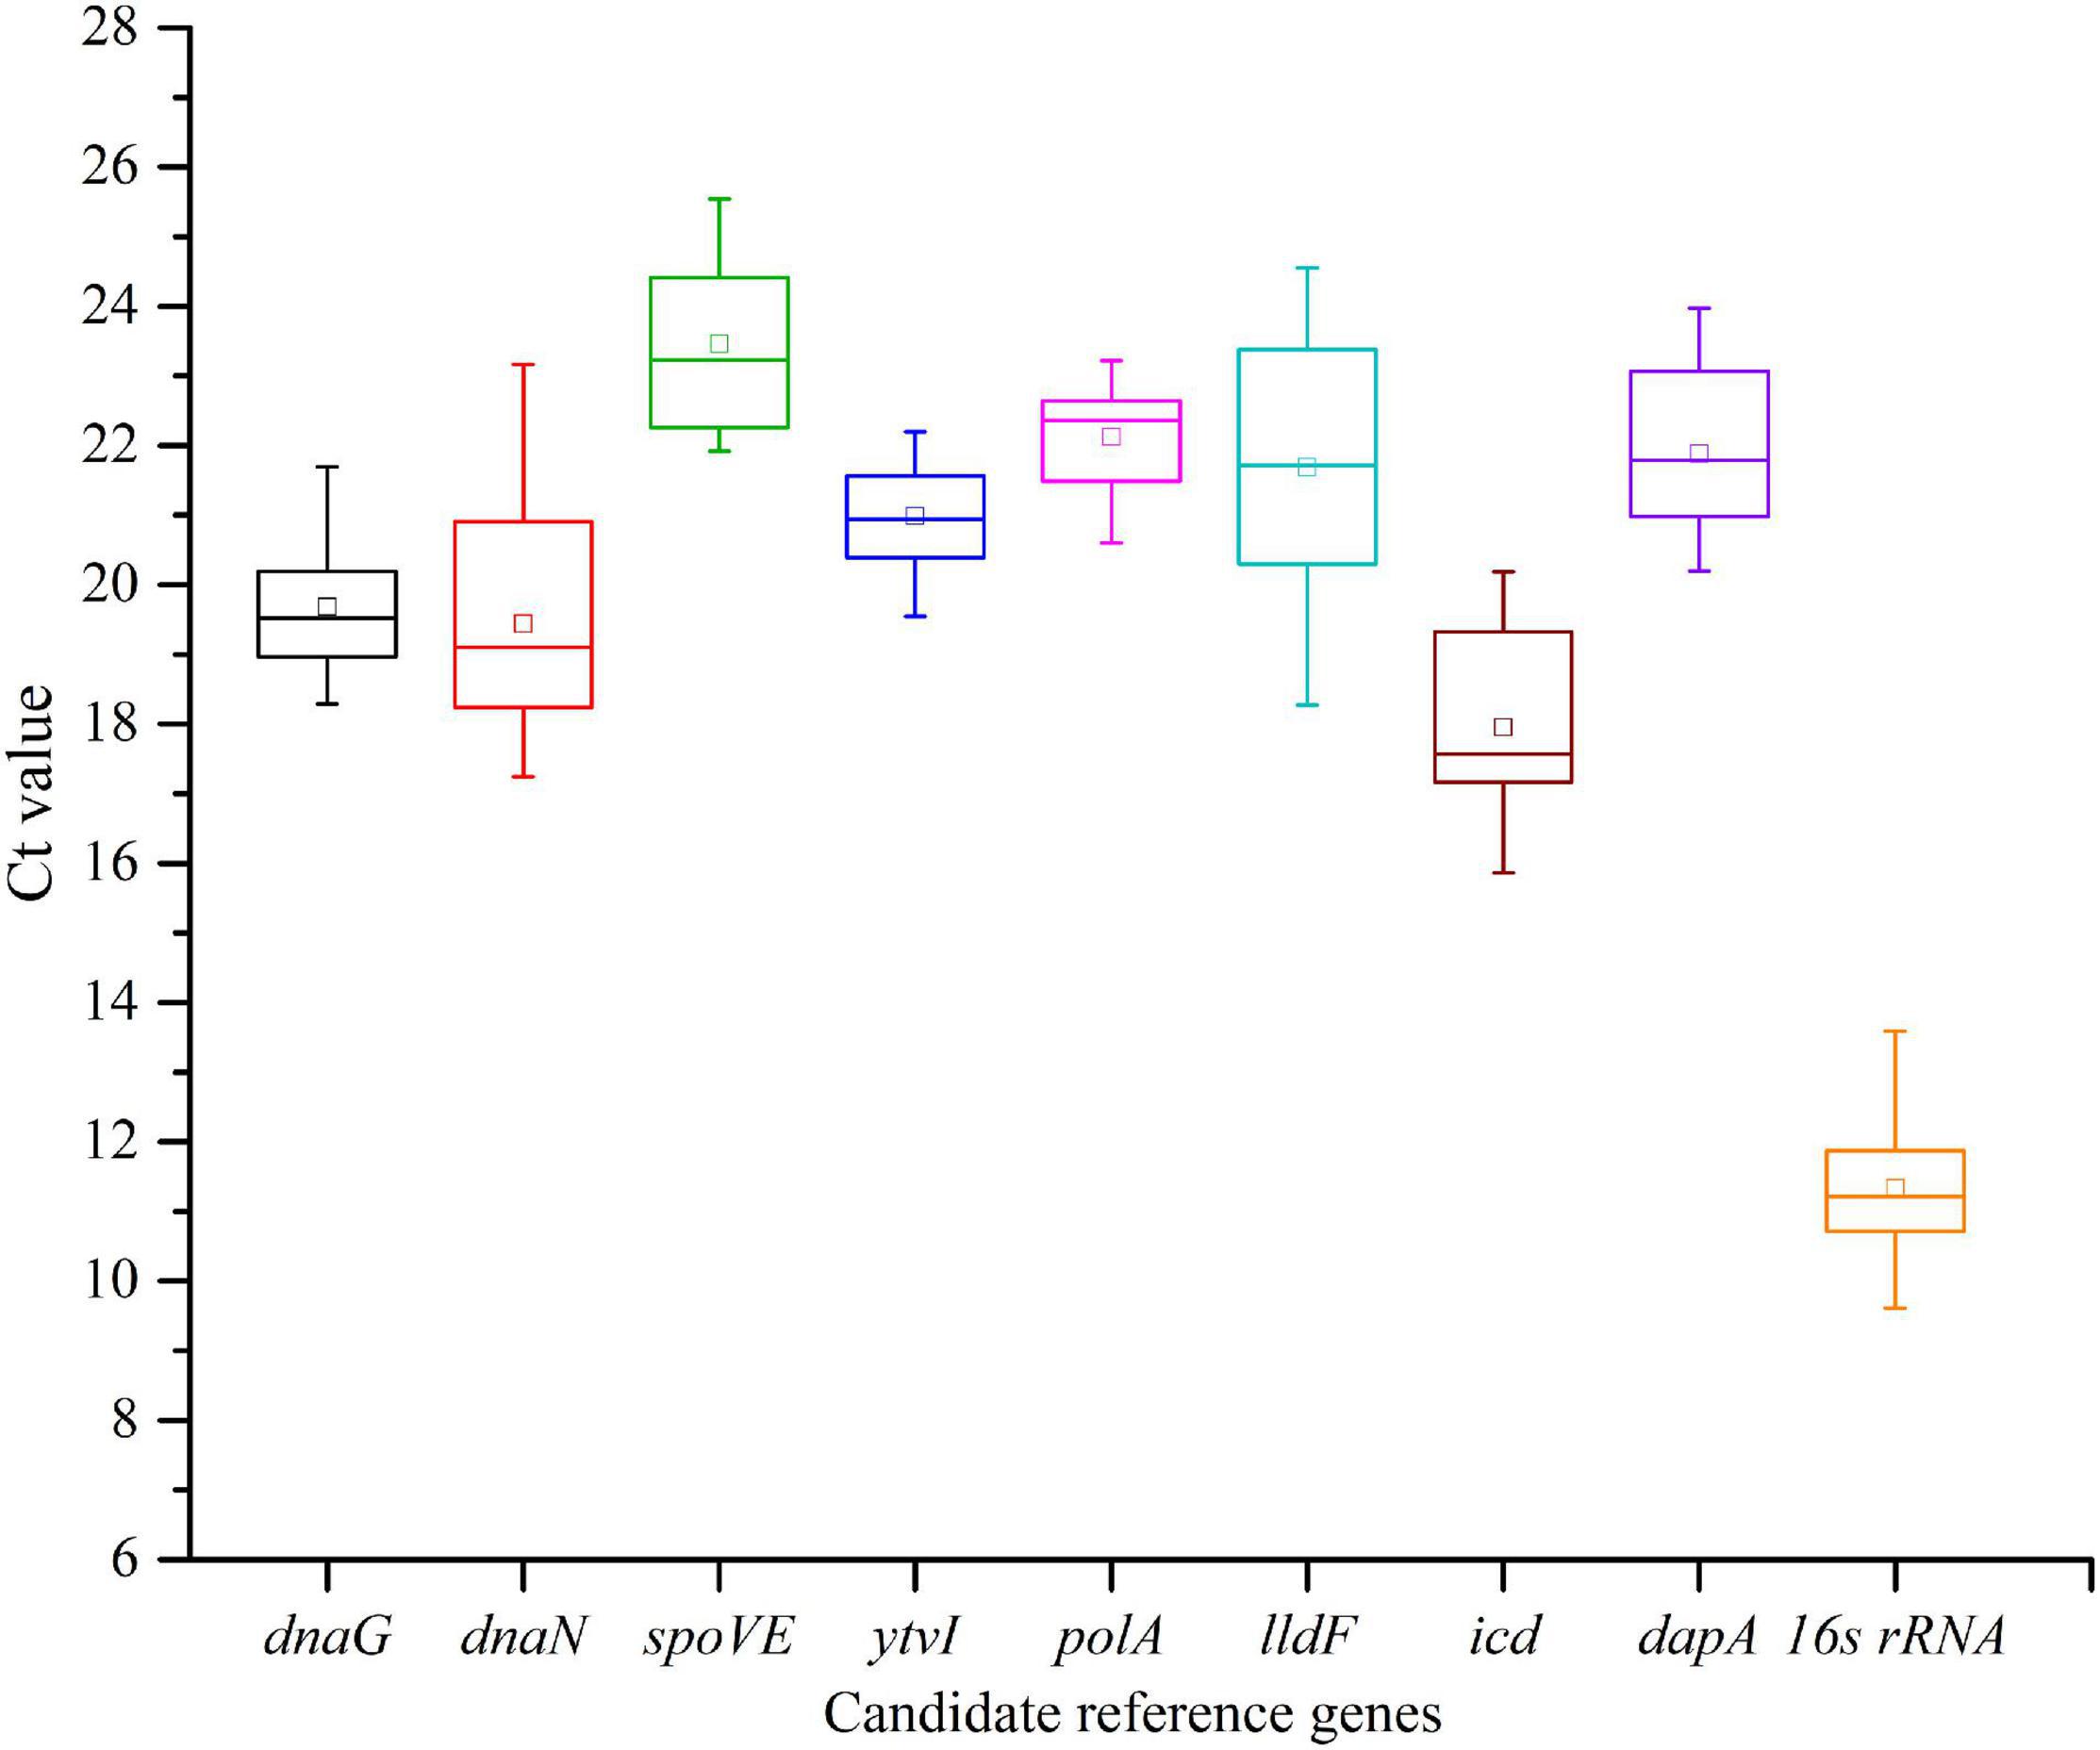
Figure 4. Expression levels of nine candidate reference genes across all samples in Alicyclobacillus acidoterrestris. The outer box is determined from 25th to 75th percentiles, and the inner box represents the mean value. The line across the box is the median. The whiskers represent the minimum and maximum values.
Expression Stability Analysis of Candidate RGs
geNorm Analysis
The expression stability of nine candidate RGs was ranked by the M-values calculated using geNorm analysis. As shown in Figures 5A–E, M-values of nine RGs in each treatment were lower than the default threshold of 1.5, meaning they were stably expressed. Meanwhile, the lower M-value suggested a higher expression stability (Vandesompele et al., 2002). For cells cultivated in normal AAM (pH 4.0), the two most stable genes were dnaN and ytvI with the lowest M-value (Figure 5A). Under acid stress at pH 3.5, 16s rRNA and ytvI were the two most stable genes (Figure 5B). At pH 3.0, the two most stable genes were dnaG and icd (Figure 5C). The two most stable genes at pH 2.5 were dnaG and polA (Figure 5D). The most unstable gene was dapA at pH 4.0 and 3.5, and lldF at pH 3.0 and 2.5 (Figures 5A–D). Considering all samples, polA and ytvI were the two most stable genes, and the most unstable gene was lldF (Figure 5E).
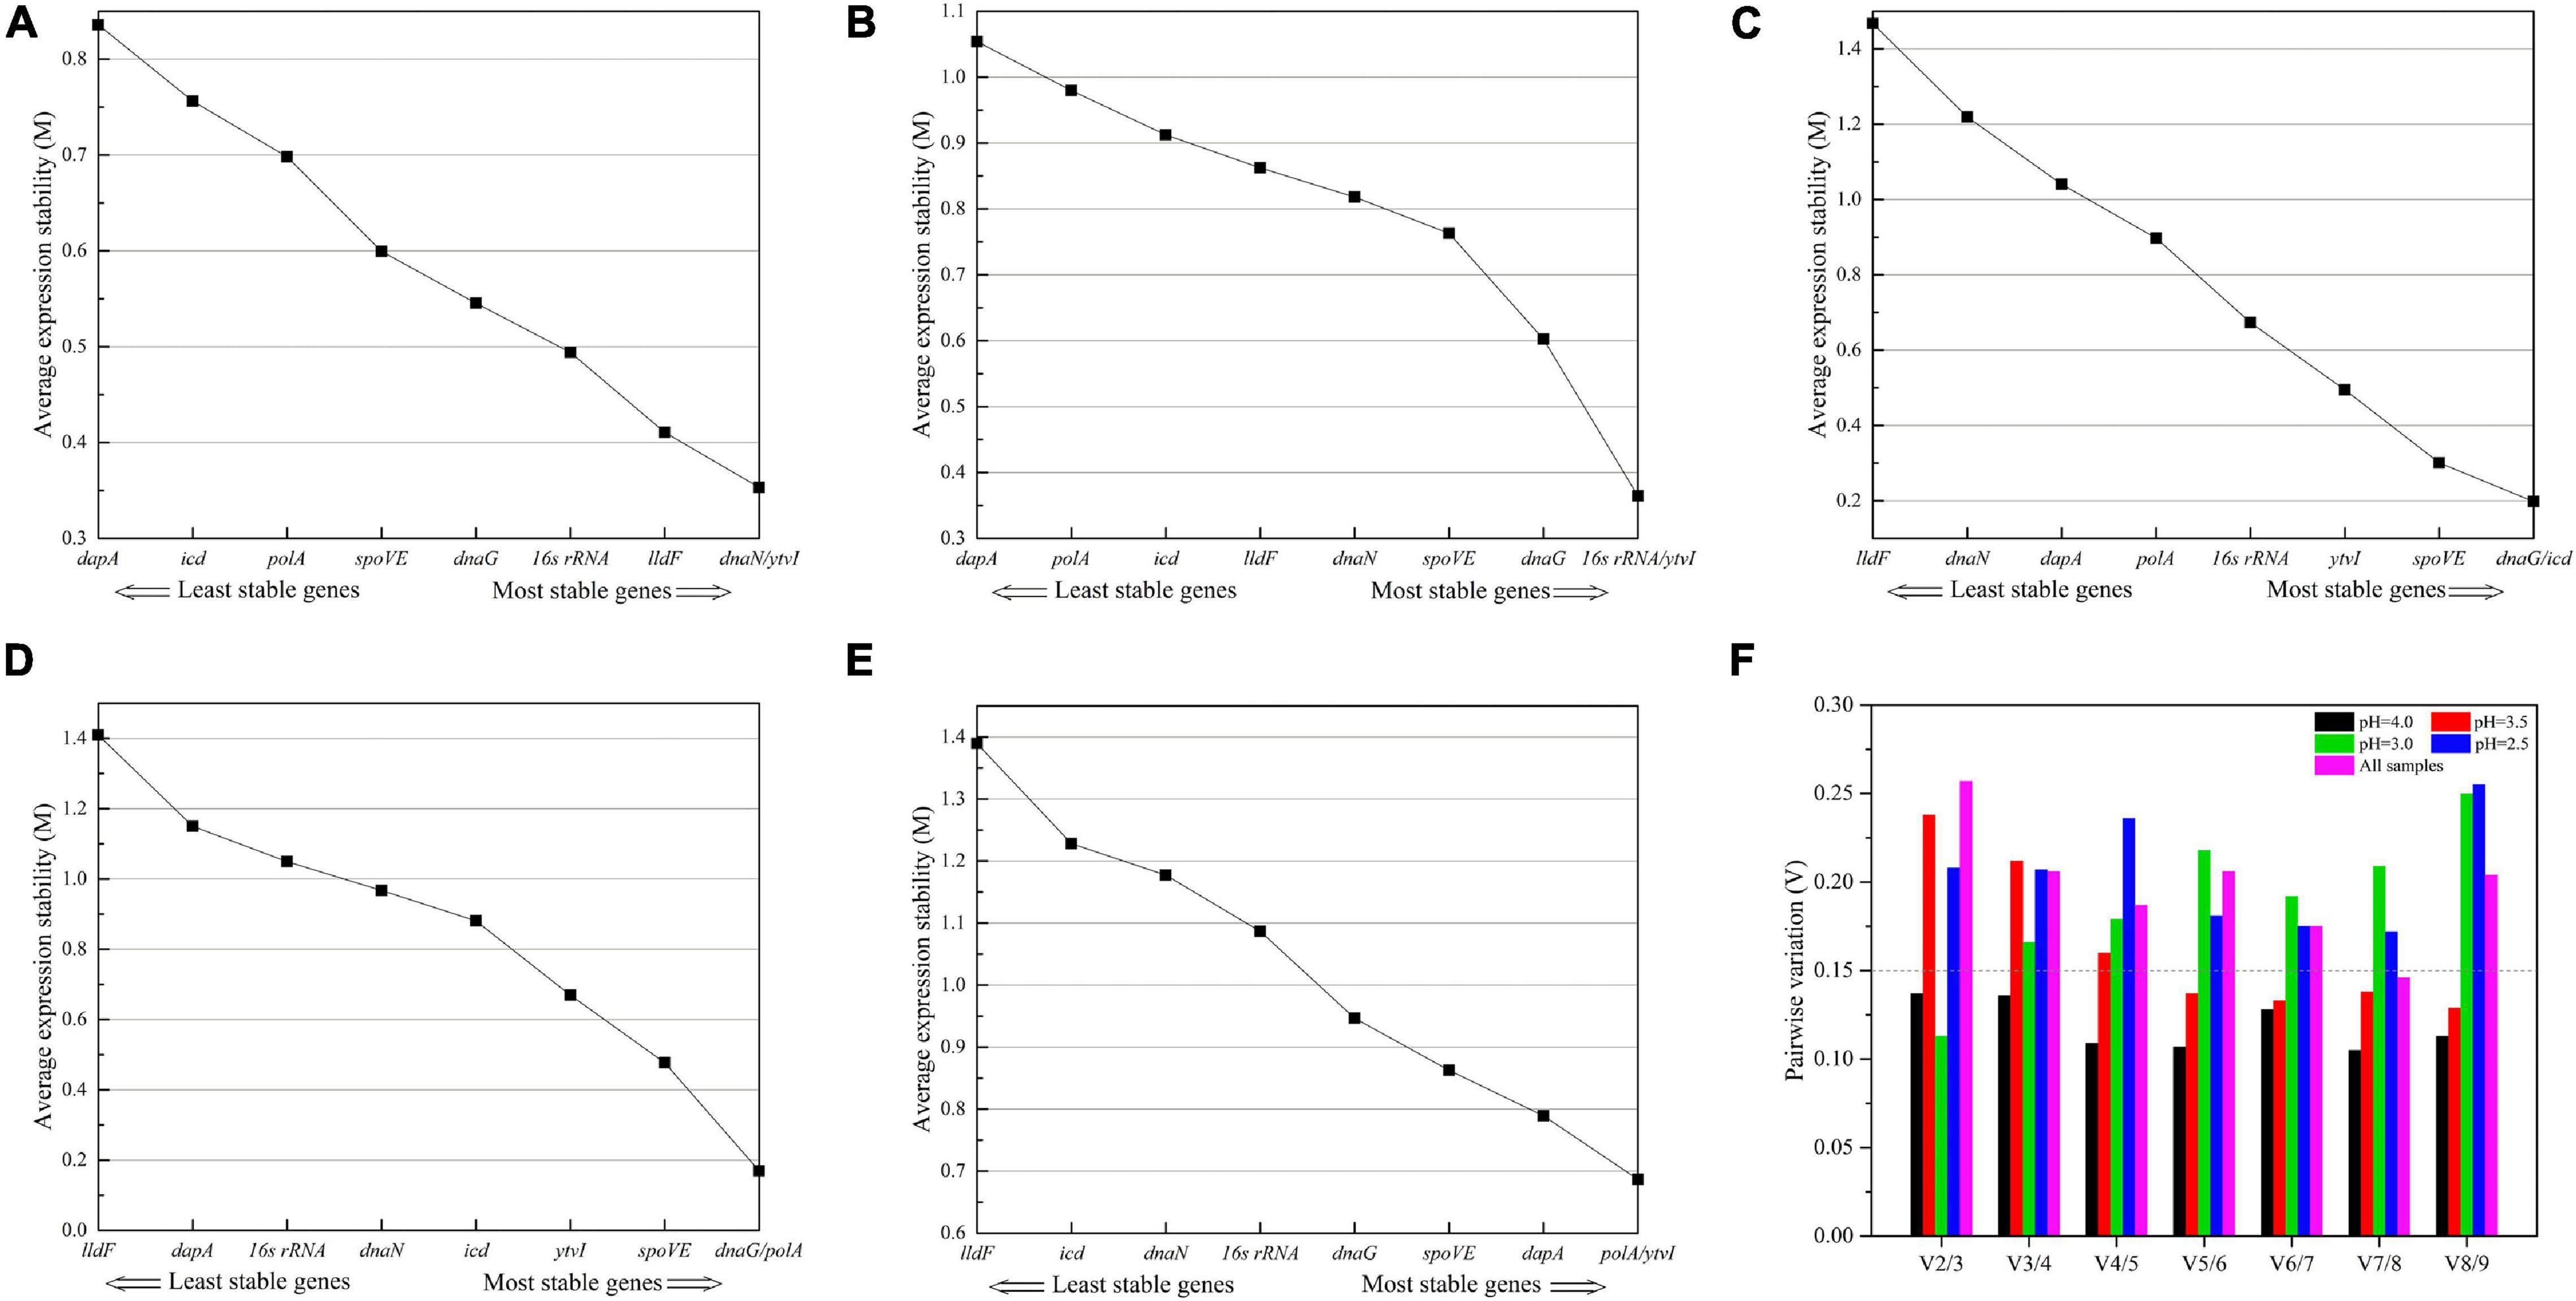
Figure 5. Average expression stability (A–E) and optimal number of reference genes (F) calculated using geNorm program. (A–D) A. acidoterrestris cells treated at pH 4.0, 3.5, 3.0, and 2.5, respectively. (E) All samples. (F) The optimal number of reference genes was calculated based on the pairwise variation (Vn/Vn + 1) values.
Meanwhile, the geNorm algorithm determines the optimal number of RGs by stepwise calculation of pairwise variation (Vn/n+1) between the two sequential normalization factors NFn and NFn+1. When Vn/n+1 is less than 0.15, the minimum value of n was the optimal number of RG needed (Vandesompele et al., 2002). As shown in Figure 5F, the V2/3 values for pH 4.0 and 3.0 treatments were both lower than the cutoff value of 0.15, indicating that using two RGs was sufficient to normalize qRT-PCR derived gene expression data under these two conditions. However, the V5/6 value was lower than 0.15 at pH 3.5, and the lowest Vn/n+1 value was always above 0.15 at pH 2.5. The help center of geNorm software indicated that a cutoff value of 0.15 was not a strict value and suggested the use of three best RGs as a valid normalization strategy. And the threshold of Vn/n+1 should be dependent on specific data (Vandesompele et al., 2002; Wan et al., 2010; Fulvio et al., 2020). Considering the results and practical feasibility, three RGs were appropriate for gene expression normalization for A. acidoterrestris under pH 3.5 and 2.5 stress conditions.
NormFinder Analysis
NormFinder determines the expression stability values of candidate RGs by combining intra- and intertreatment expression variations. Low expression stability values indicated that genes had stable expression (Andersen et al., 2004). As shown in Table 3, dnaG was the most stable gene at pH 4.0 and 3.0, while ytvI was the most stable gene at pH 3.5, pH 2.5, and in the combined analysis of all samples. At pH 4.0, 3.5, and 3.0, the top three genes analyzed by NormFinder analysis included the two most stable genes obtained from the aforementioned geNorm algorithm. However, at pH 2.5, the two most stable genes from geNorm analysis, dnaG and icd, ranked sixth and seventh, respectively, in NormFinder. However, the least stable genes identified by both geNorm and NormFinder were the same in different acid-stressed samples.

Table 3. Expression stability of candidate reference genes in A. acidoterrestris assessed by NormFinder program.
BestKeeper Analysis
BestKeeper algorithm assesses the expression stability of RGs based on the SD and CV values, with the lower SD value, the more stable RG expression is. Genes with an SD value greater than one were considered unsuitable as RGs (Pfaffl et al., 2004). As shown in Figure 6, SD values of the most stable candidate RGs identified using geNorm and NormFinder were all less than one, further confirming that these genes were stably expressed under different conditions. However, a slight difference was observed between the results of BestKeeper analysis and the findings obtained by aforementioned two methods. According to the BestKeeper algorithm, dnaG, polA, and dnaN were regarded as the three most stably expressed genes at pH 4.0 (Figure 6A), while polA ranked sixth in both geNorm and NormFinder analysis. At pH 3.5, icd, polA, and ytvI were the most stable genes (Figure 6B), while icd ranked sixth using geNorm, and polA ranked seventh using the aforementioned two methods. ytvI, spoVE, and polA were the most stable genes at pH 3.0 (Figure 6C), while polA ranked fifth and sixth in geNorm and NormFinder, respectively. At pH 2.5, the most stably expressed genes were ytvI, dnaG, and spoVE (Figure 6D), while dnaG ranked fifth using NormFinder.
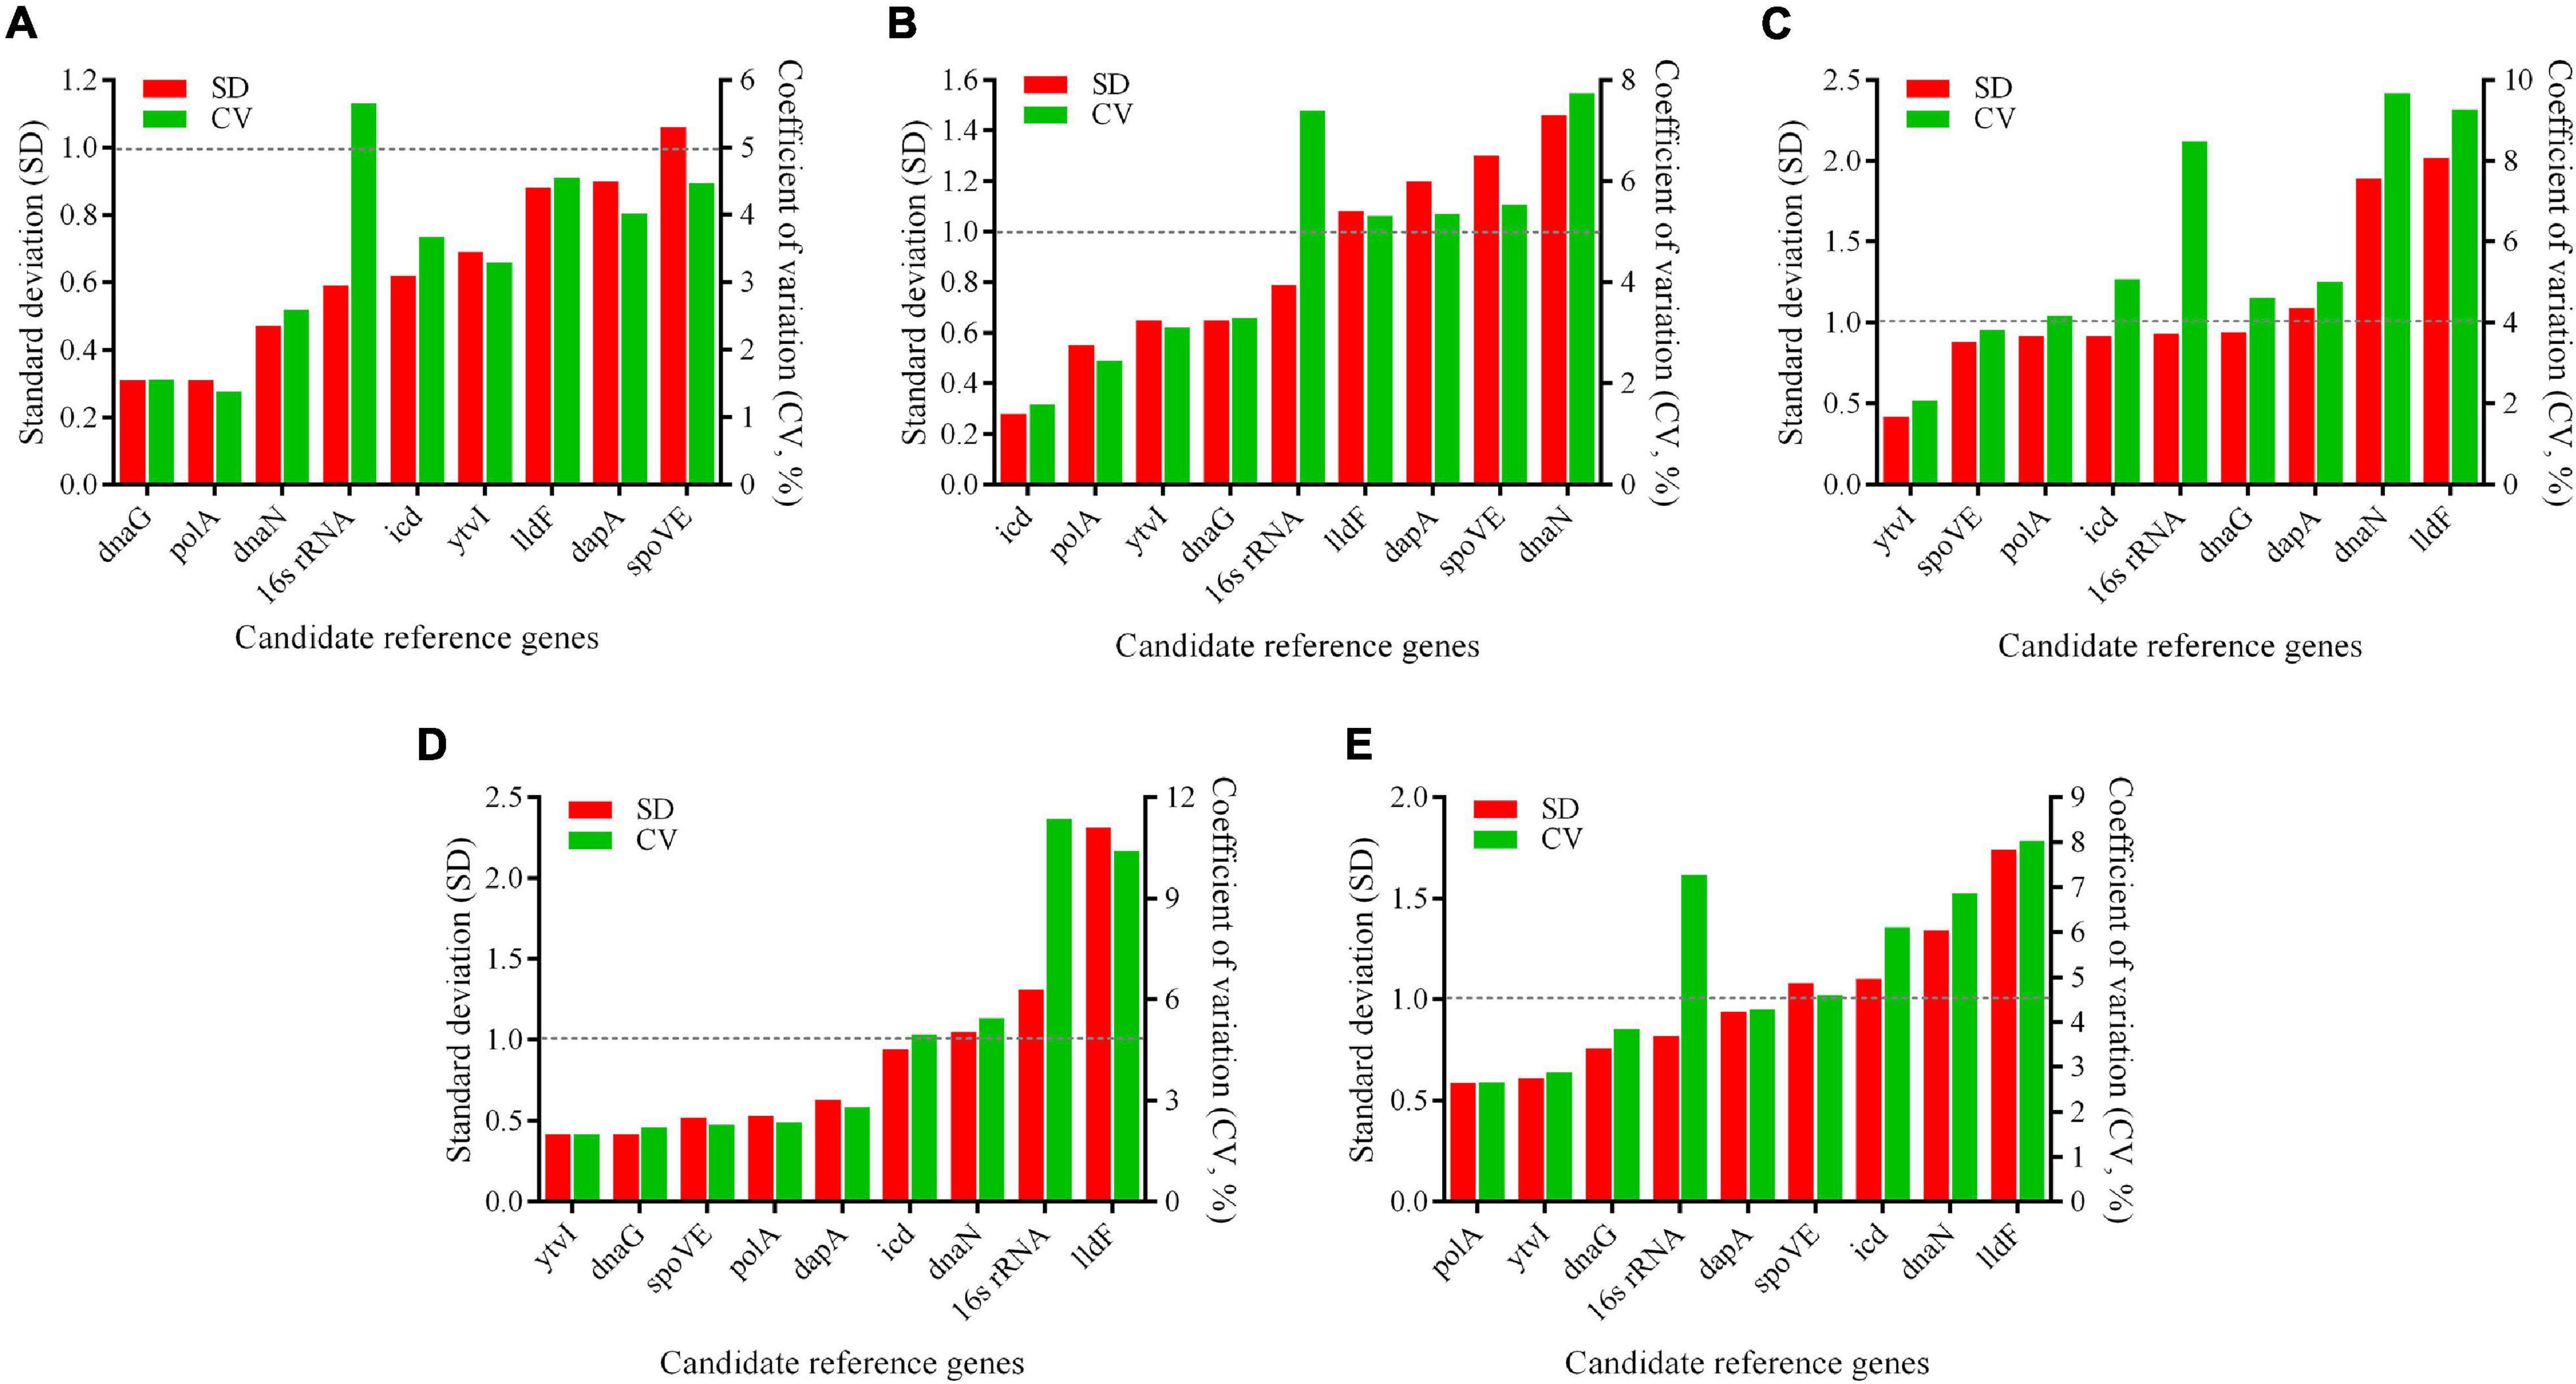
Figure 6. Expression stability of candidate reference genes in A. acidoterrestris assessed by BestKeeper program. (A–D) A. acidoterrestris cells treated at pH 4.0, 3.5, 3.0, and 2.5, respectively. (E) All samples. SD, standard deviation; CV, coefficient of variation.
A Comprehensive Analysis
The comprehensive ranking of the expression stability of candidate RGs was obtained by the RefFinder algorithm, which integrated the results of the aforementioned three standard analysis algorithms (Xie et al., 2012). At pH 4.0, the top three most stable RGs were dnaG, dnaN, and ytvI. At pH 3.5, ytvI, dnaG, and 16s rRNA were the most stable RGs analyzed. At pH 3.0, icd, dnaG, and spoVE were the most stably expressed RGs. At pH 2.5, ytvI, dnaG, and spoVE were the most stable RGs (Figure 7 and Supplementary Table 4). Interestingly, the first three genes with the most stable expression under the four acid stress treatments all included dnaG, as shown in Venn diagram analysis (Supplementary Figure 1), indicating that dnaG could be used as a stable RG at pH ranging from 4 to 2.5. Except for pH 3.0, ytvI was one of the top three stable genes in the other three acid-stressed cells. Meanwhile, spoVE was confirmed in the top three stable genes in cells treated with stronger acid stress (pH 3.0 and 2.0).
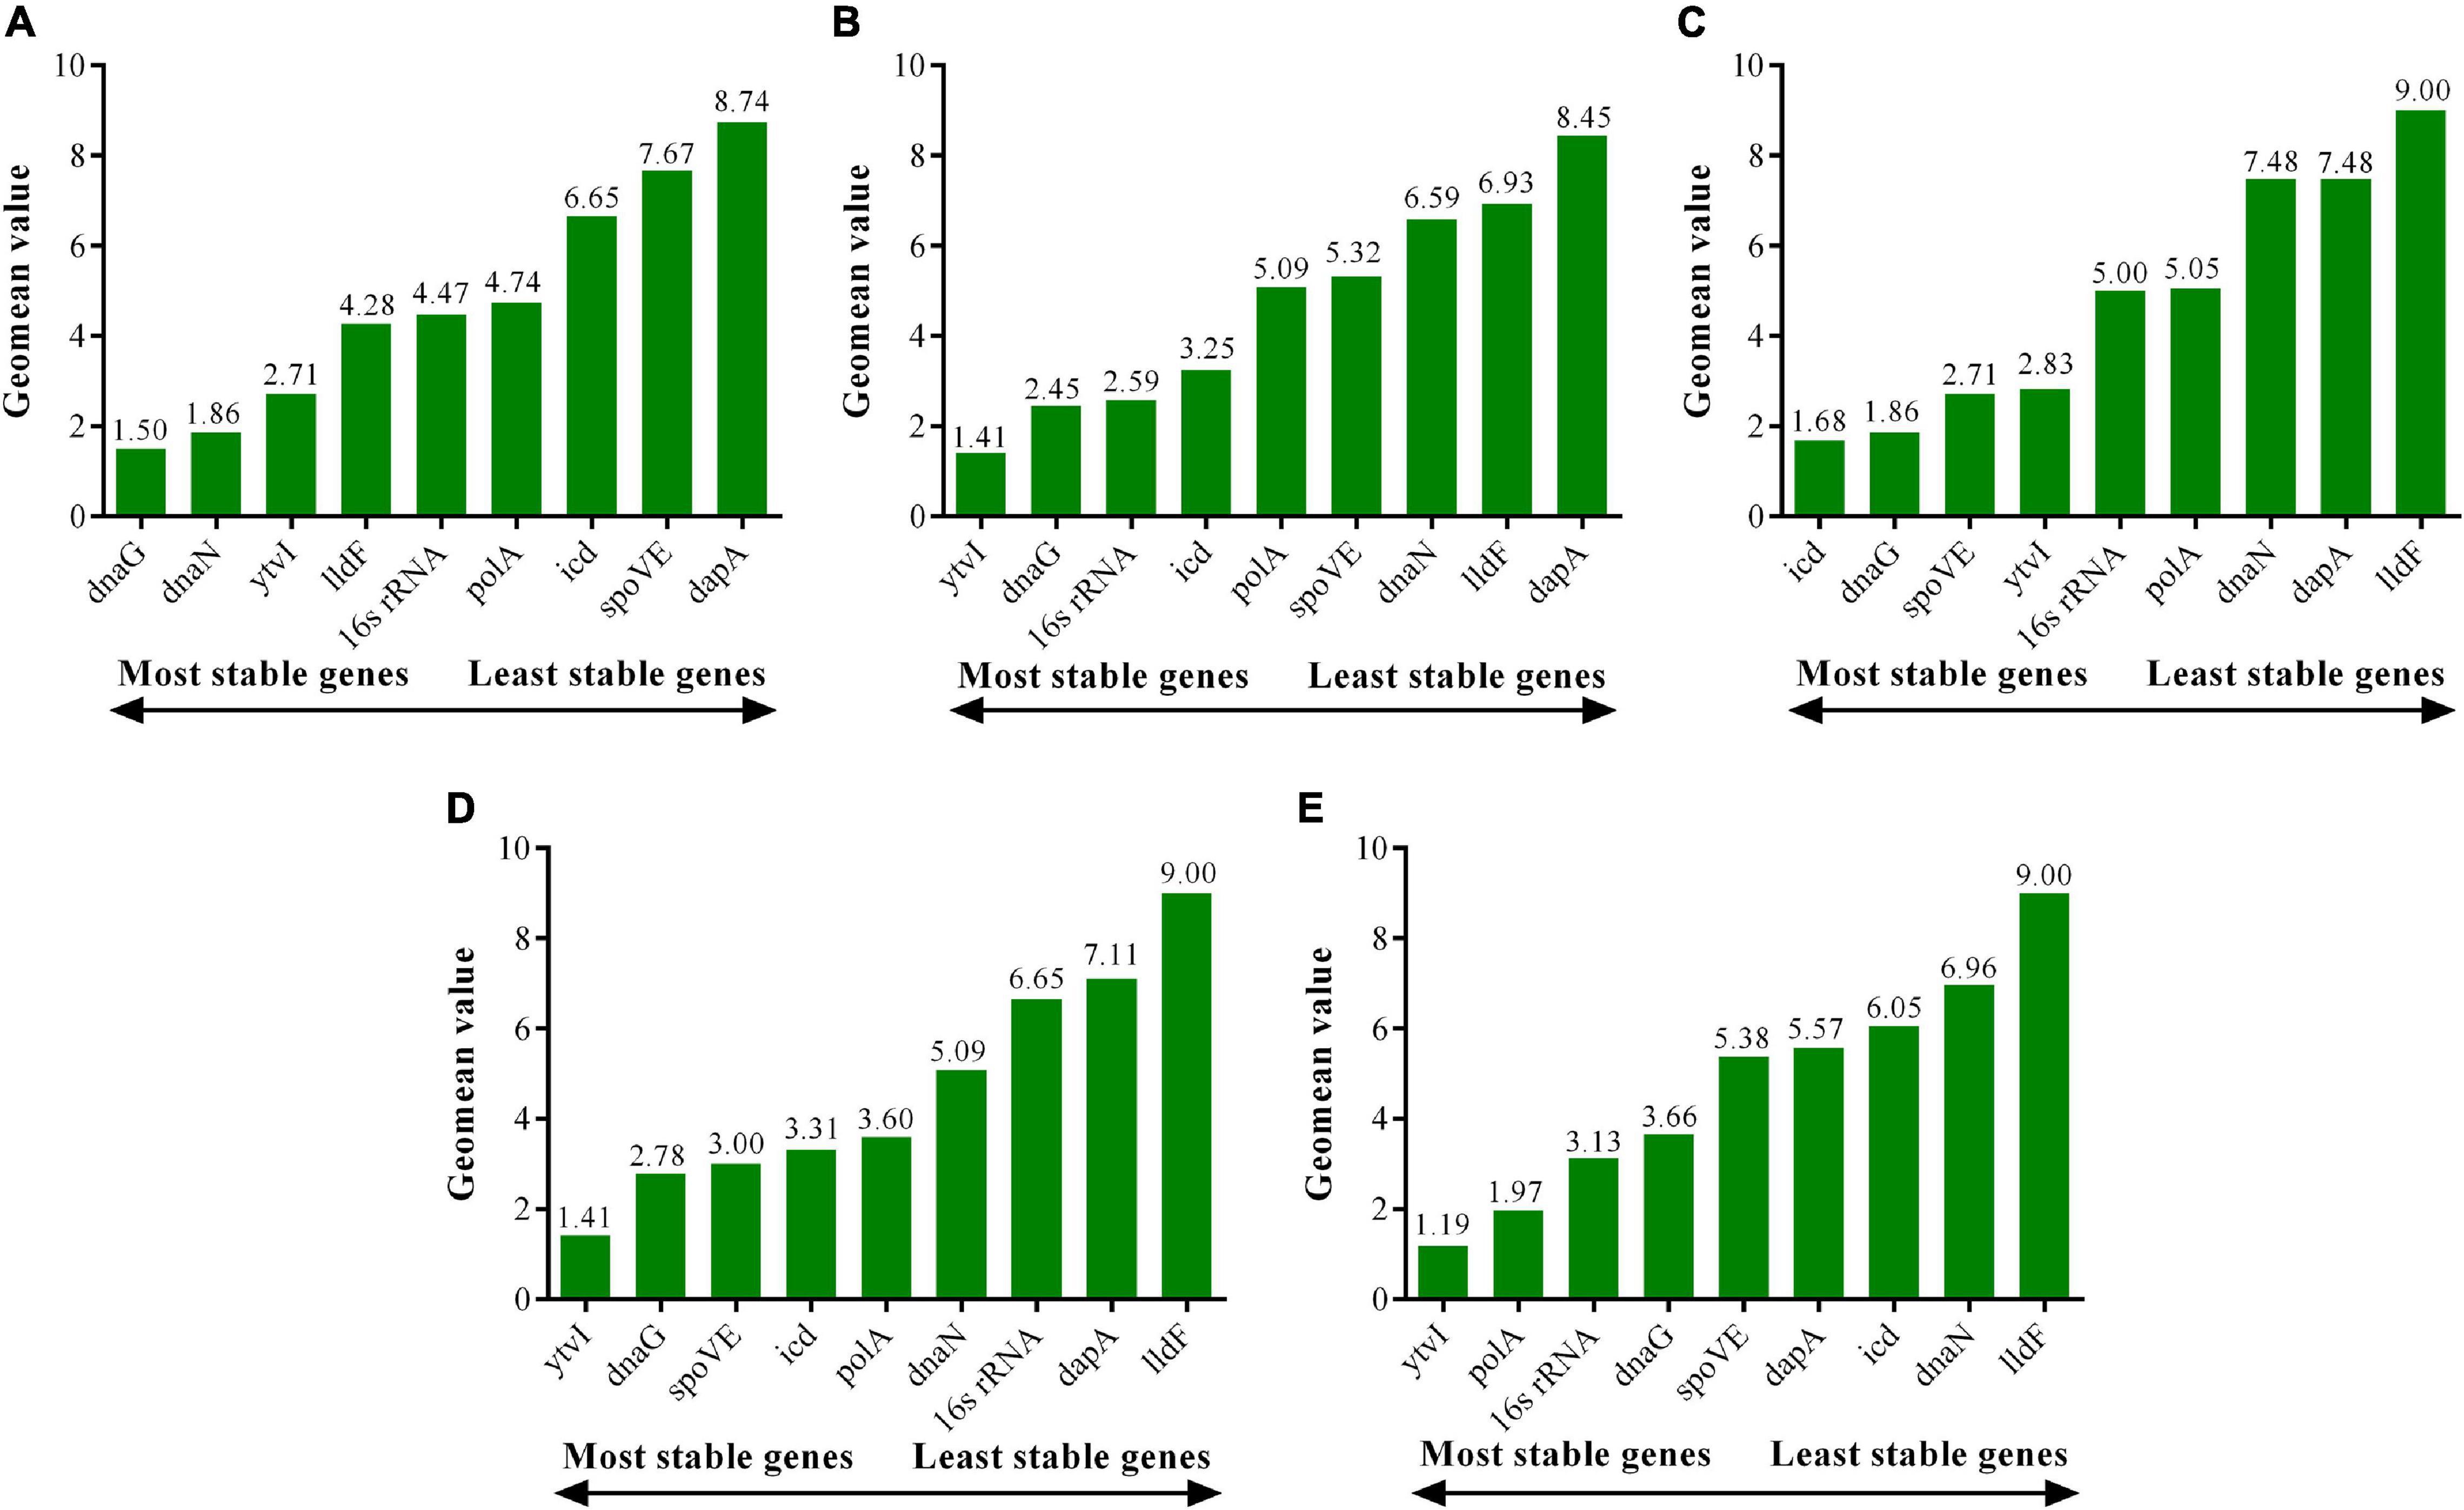
Figure 7. Expression stability of candidate reference genes in A. acidoterrestris assessed by RefFinder program. (A–D) A. acidoterrestris cells treated at pH 4.0, 3.5, 3.0, and 2.5, respectively. (E) All samples.
Combining the optimal number of RGs for normalization obtained using geNorm, dnaG and dnaN were considered as optimal multiple RGs at pH 4.0, while dnaG and icd were optimal RGs at pH 3.0. However, three RGs were selected for normalization under the other two acid stress conditions. ytvI, dnaG, and 16s rRNA were used as ideal multiple RGs for normalization at pH 3.5, and ytvI, dnaG, and spoVE at pH 2.5.
Validation of the Recommended RGs
To validate the selected candidate RGs, the expression profile of target gene ctsR involved in bacterial stress responses was detected (Figure 8 and Supplementary Table 5). Besides the optimal multiple RGs selected from each treatment, the least stable gene in each treatment (dapA at pH 4.0 and 3.5, lldF at pH 3.0 and 2.5) and the optimal multiple RGs selected from all samples (ytvI and polA at pH 4.0 and 3.0; ytvI, dnaG, and polA at pH 3.5; and ytvI, polA, and 16s rRNA at pH 2.5) were also used to normalize the expression level of ctsR. As shown in Figure 8A, the ctsR was upregulated at pH 4.0 for 1 h but downregulated for 3 h when normalized by optimal multiple RGs. After acid stress at pH 3.5 for both 1 h and 3 h, the expression level of ctsR increased when normalized by optimal multiple RGs (Figure 8B). However, a decreased pattern was discovered at pH 4.0 and pH 3.5 for 1 h when normalized with the least stable genes. Overall, the expression of ctsR was underestimated when normalized by the least stable gene at pH 4.0 and 3.5 compared with that normalized by optimal multiple RGs. Using these three normalization methods, the expression level of ctsR increased after 1 h and 3 h at both pH 3.0 and 2.5 (Figures 8C,D). However, when normalized using the least stable genes, the expression level exhibited an obvious overestimation with a sharp increasing pattern.
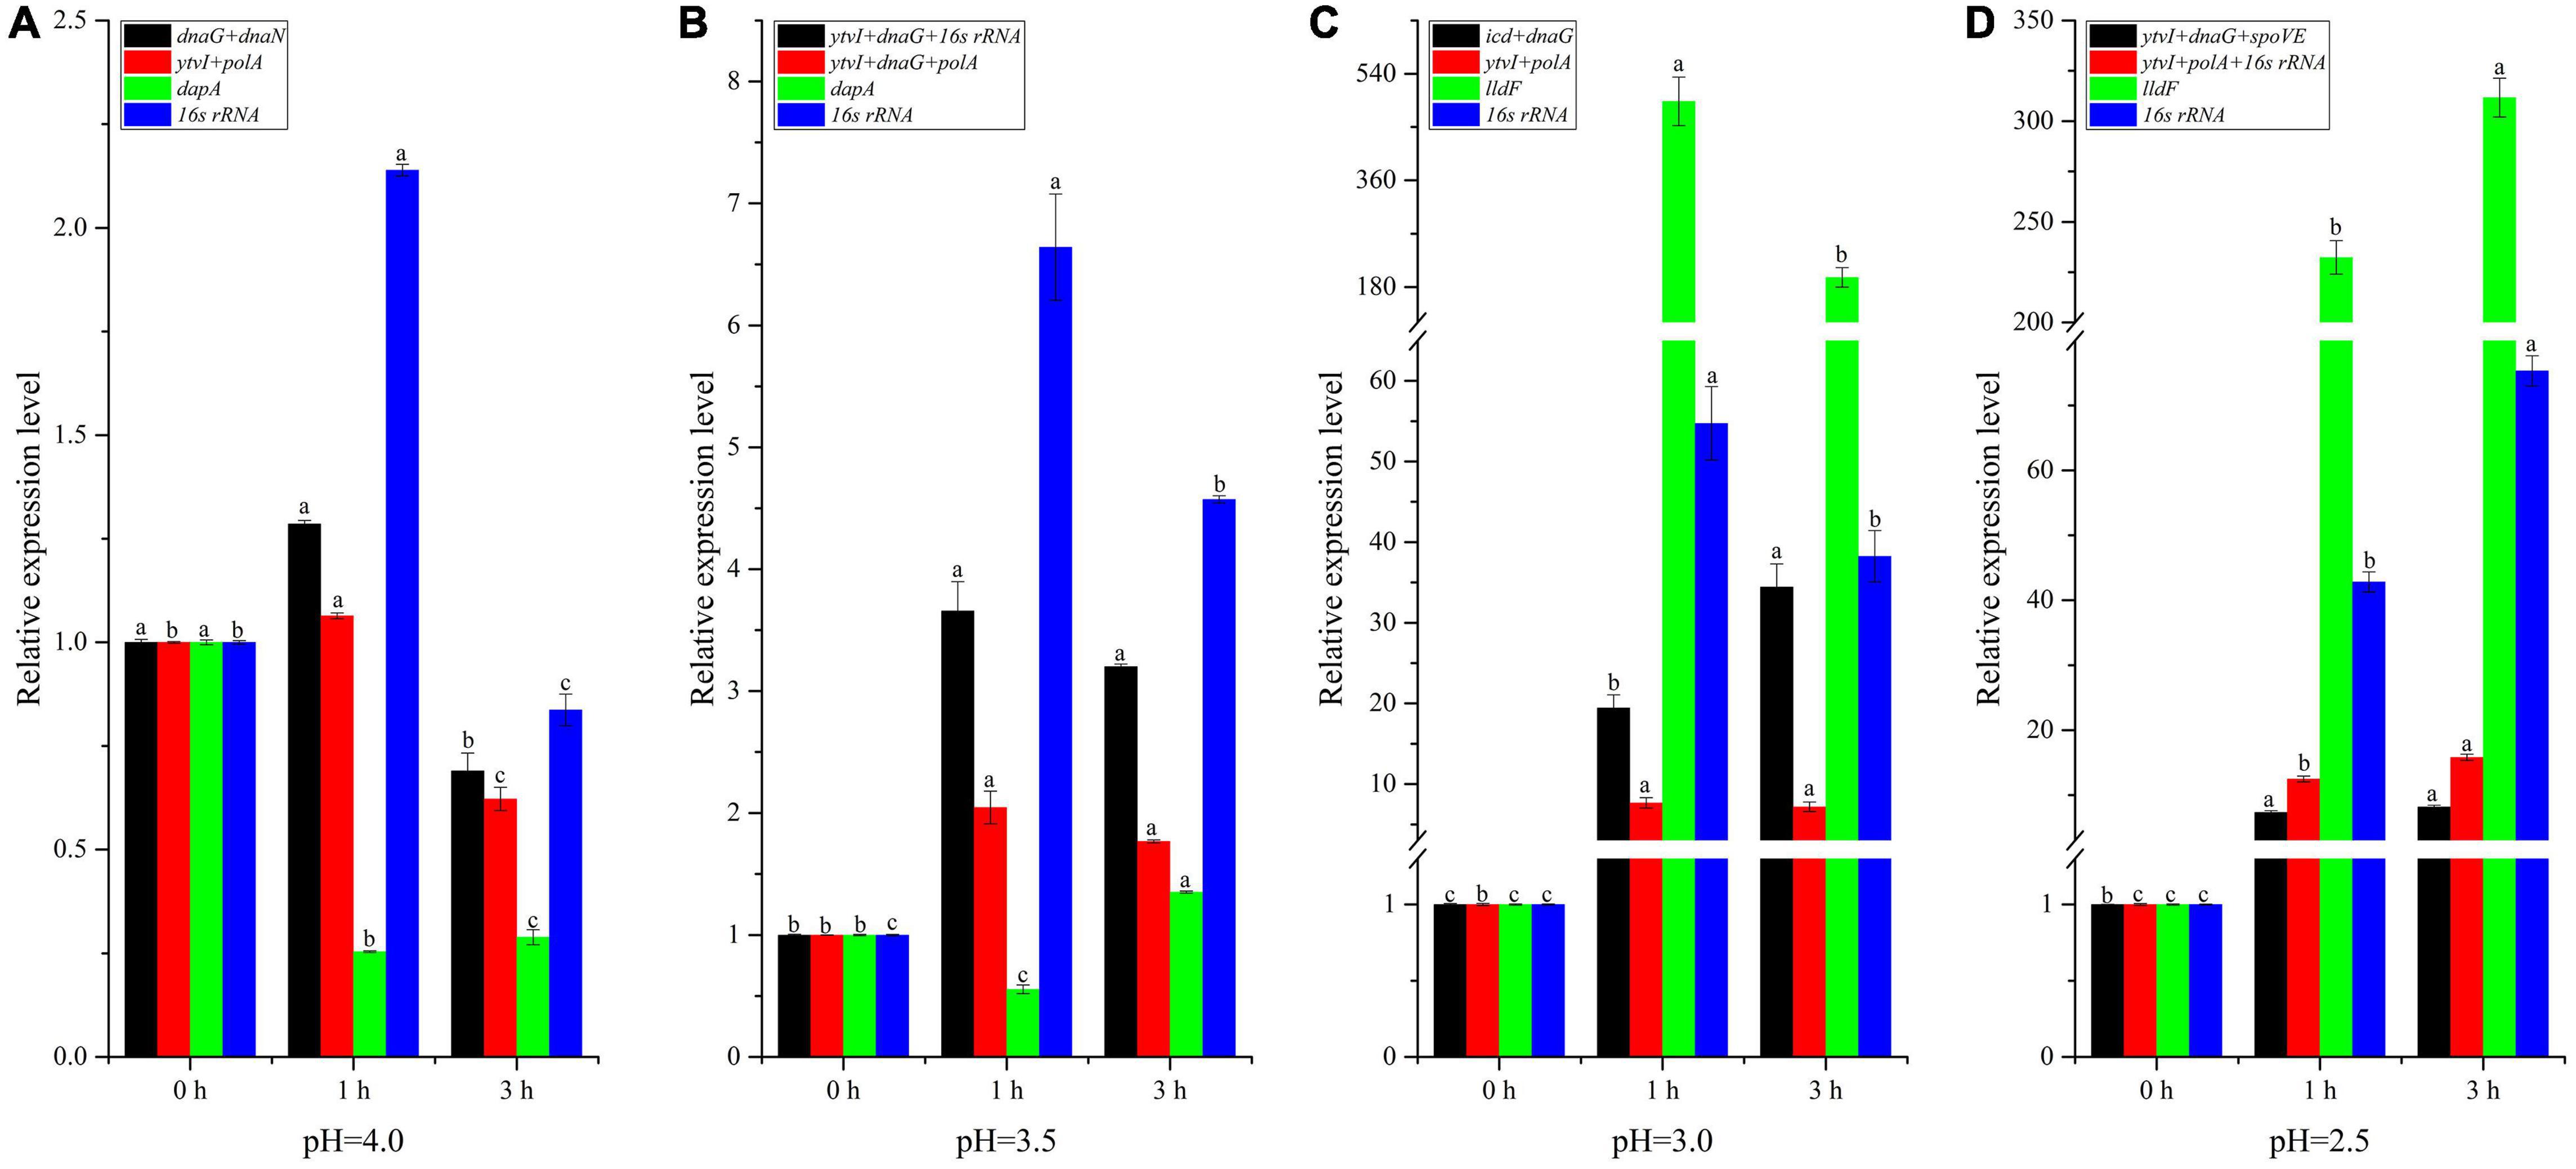
Figure 8. Relative expression level of the ctsR gene normalized by the different reference genes (RGs) in A. acidoterrestris cells under different acid stress conditions. (A) pH = 4.0, (B) pH = 3.5, (C) pH = 3.0, (D) pH = 2.5. Different letters above each column for the same RG normalization strategy indicate significant differences at a significant level of 0.05.
Discussion
Gene expression analysis is a primary method to reveal the response mechanism of microorganisms to different stress conditions, and several techniques have been developed to investigate gene expression at the transcriptional level. RT-qPCR is one of the most utilized methods because it can quantify the transcript abundance of target genes in an accurate and reproducible manner (Bernáldez et al., 2017). However, correct normalization using appropriate RGs is a prerequisite for the reliable assessment of gene expression in RT-qPCR analysis (Guenin et al., 2009). In this study, RGs suitable for quantifying the expression level of genes involved in acid responses of A. acidoterrestris, a spoilage-causing bacterium in acidic fruit juice, were selected and evaluated. The acid stress conditions applied (pH 4.0, 3.5, 3.0, and 2.5) were selected based on the growth profiles of A. acidoterrestris at different pH values (Zhao et al., 2021) and the actual acidity of fruit juices (Smit et al., 2011).
A total of eight candidate novel RGs were selected from the transcriptome data of A. acidoterrestris using the criteria including high expression levels (RPKM ≥ 10), and a low variability with CV ≤ 20%, MFC < 2.5, and DPM < 0.2 (Figure 2). Multiple studies have shown that transcriptomic data is a reliable source for exploring suitable RGs under specific experimental conditions, and similar criteria have been used for RGs screening in other species (Gao et al., 2018; Zhang et al., 2020; Xing et al., 2021). For A. acidoterrestris, all current studies on the functional gene expression used 16s rRNA as RG to normalize RT-qPCR data, but the stability of 16s rRNA has not been evaluated under specific conditions (Jiao et al., 2015; Feng et al., 2019; Zhao et al., 2021). Therefore, 16s rRNA was also selected as a candidate RG to evaluate its expression stability under acid stress.
For all candidate RGs, the Ct values of RT-qPCR were systematically analyzed by geNorm, NormFinder, and BestKeeper methods to obtain the most stably expressed RGs and their best combination for A. acidoterrestris under acid stress. A slightly different pattern of the expression stability ranking of candidate RGs was discovered among three program analysis results for the same group of acid-stressed cells (Supplementary Table 4), which was also reported in previous reports (Peng et al., 2018). The variance in results might be due to the differences in algorithms and analytical procedures of these three different methods (Thellin et al., 2009; Noti et al., 2015). Moreover, the function and regulation pattern of genes might also lead to the inaccurate assessment of expression stability ranking. The coregulated genes with similar expression profiles can receive preferential stability ranking from the geNorm algorithm, while NormFinder and BestKeeper are less sensitive to coregulation (Andersen et al., 2004; Pfaffl et al., 2004). To counteract potential bias and avoid contradictory results caused by the use of single methods, the RefFinder program was further used for the comprehensive ranking of candidate RGs. The results showed that the expression stability of candidate RGs was different under different acid conditions (Figure 7 and Supplementary Table 4), implying the necessity for RGs validation under specific experimental treatments. At pH 4.0, dnaG was identified as the most stable gene, followed by dnaN and ytvI. Similarly, dnaG and ytvI were also positioned in the top three of expression stability ranking at pH 3.5, and ytvI was the most stable gene. At pH 3.0 and 2.5, the most stable genes were icd and ytvI, respectively, followed by dnaG and spoVE under both conditions. It was interesting to discover that the expression stability of dnaG was ranked in the top three under the four acid stress conditions applied. Hence, dnaG was a universal RG stably expressed in A. acidoterrestris under acid stress. The dnaG encodes DNA primase, which primes DNA synthesis by incorporating ribonucleotides complementary to the DNA template to generate an RNA primer. Another point of concern was spoVE, encoding the stage V sporulation protein E, which had low expression stability under normal growth (pH 4.0) and low acid stress intensity (pH 3.5). However, at pH 3.0 and 2.5, its expression stability was relatively high, ranking the third, which might be associated with the sporulation of A. acidoterrestris under more severe stress conditions. Our previous study found that the dormant spores of A. acidoterrestris were produced under acid stress with pH less than 3.5 (Zhao et al., 2021).
Besides evaluating the expression stability of candidate RGs and obtaining the most stable RGs, determining the optimal number of RGs is an important aspect for RT-qPCR assay. As reported in the MIQE guidelines, normalization based on a single RG is not acceptable, and the optimal number of RGs must be experimentally determined (Bustin et al., 2009). Moreover, many studies indicated that the normalization with multiple RGs was necessary for the accurate assessment of gene expression under specific conditions (Noti et al., 2015; Zhang et al., 2020). The geNorm algorithm is usually used to determine the optimal number of RGs based on the pairwise variation (Vn/n+1) (Vandesompele et al., 2002). At pH 4.0 and 3.0, the V2/3 value was less than the cutoff value of 1.5, indicating that two RGs would be sufficient for normalizing gene expression (dnaG and dnaN, and icd and dnaG, respectively). However, the V5/6 value was less than 0.15 at pH 3.5, indicating that at least five RGs should be included for evaluating gene expression. In addition, the lowest Vn/n+1 value was always greater than 0.15 at pH 2.5. Notably, the information about the optimal number of RGs was provided only by geNorm software, which was therefore limited to the ranking obtained by this algorithm and did not consider the results produced by others. Many studies showed that 0.15 should not be considered as an absolute threshold, and the number of RGs had to be a tradeoff between accuracy and functionality (Vandesompele et al., 2002; Wan et al., 2010; Fulvio et al., 2020). Meanwhile, the additional cost due to excessive RGs could limit the number of samples that could be tested (Metcalf et al., 2010). Hence, considering the analysis results and practical feasibility, three RGs would be appropriate for gene expression normalization in A. acidoterrestris at pH 3.5 (ytvI, dnaG, and 16s rRNA) and 2.5 (ytvI, dnaG, and spoVE).
Multiple recent studies revealed that the expression levels of some traditional RGs varied considerably under certain conditions and were not as stable as previously thought (Vandecasteele et al., 2002; Desroche et al., 2005). Similarly, the traditional RG (16s rRNA) for A. acidoterrestris was not stably expressed under all the four acid stress conditions used in this study. At pH 4.0, 3.0, and 2.5, 16s rRNA was not a stably expressed RG, with the stability ranking below the fifth out of nine candidate RGs. However, at pH 3.5 and four groups of samples analyzed together, the expression stability of 16s rRNA ranked third and it could be used as a stable RG. Hence, it was too absolute to think that 16s rRNA was completely unsuitable for use as a RG, but caution should be taken in assuming that 16s rRNA is stably expressed under all conditions, and its applicability should be evaluated under each specific experimental condition. The unstable expression of 16s rRNA may be caused by its high transcription level (Desroche et al., 2005), as 16s rRNA had the lowest mean Ct value (Figure 4). Therefore, the templates for 16s rRNA amplification should be diluted more times than that for other genes in RT-qPCR to neutralize the effects of its high abundance.
In order to validate the selected RGs, three RGs strategies were employed to normalize the expression level of target gene ctsR, encoding a transcriptional regulator of the bacterial stress responses (Periago et al., 2002). The expression pattern of ctsR was obviously influenced by the RG strategy (Figure 8). When normalized by the optimal RGs, except for cells treated at pH 4.0 for 3 h, the transcription level of ctsR increased in the other seven samples compared with control. Similar expression trends of ctsR were observed in our previous study in which all acid-stressed cells were analyzed together and 16s rRNA was used as RG (Zhao et al., 2021). Importantly, the expression of 16s rRNA was relatively stable and ranked third when all acid-stressed cells were analyzed together (Figure 7). During normalization with the least stable gene, the expression level of ctsR was underestimated at pH 4.0 and 3.5, but overestimated at pH 3.0 and 2.5. Therefore, using reliable RGs was a prerequisite for accurate RT-qPCR data analysis of A. acidoterrestris under different acid stress conditions.
Conclusion
This study illustrated the potential of transcriptomic datasets of A. acidoterrestris for identifying novel candidate RGs for RT-qPCR assay and the importance of experimental validation of gene expression stability before selecting suitable RGs under different conditions. Eight candidate genes (dapA, spoVE, ytvI, polA, icd, dnaG, lldF, and dnaN) with high expression level and low expression variance were screened using transcriptomic datasets generated in A. acidoterrestris under acid stress. Three statistical algorithms (geNorm, NormFinder, and BestKeeper), a comprehensive program (RefFinder) analysis, and validation using target gene ctsR indicated that dnaG and dnaN at pH 4.0, ytvI, dnaG, and 16s rRNA at pH 3.5, icd and dnaG at pH 3.0, and ytvI, dnaG, and spoVE at pH 2.5 stably expressed and were selected as ideal RGs. Significantly, 16s rRNA of A. acidoterrestris was not stably expressed under all acid conditions (pH 4.0–2.5), while dnaG could be used as a suitable RG to normalize gene expression under these treatments. This study was the first to systematically analyze the RGs for RT-qPCR in A. acidoterrestris under stress conditions. The results will contribute to future investigation of functional genes related to acid responses of A. acidoterrestris and facilitate RG selection of other Alicyclobacillus strains under different experimental conditions.
Data Availability Statement
The datasets generated for this study can be found in online repositories. The names of the repository/repositories and accession number(s) can be found below: SRA, PRJNA742261 and PRJNA721075.
Author Contributions
NZ: conceptualization, methodology, investigation, visualization, and writing-original draft. JX: methodology, validation, and visualization. LJ: conceptualization and validation. MQ: investigation. JZ: investigation and formal analysis. XW: writing-review and editing. MF: conceptualization, supervision, funding, and writing-review and editing. All authors contributed to the article and approved the submitted version.
Funding
This work was supported by the National Natural Science Foundation of China (grant numbers 31871769 and 32072187) and Program for Innovative Research Team (in Science and Technology) in University of Henan Province (grant number 21IRTSTHN024).
Conflict of Interest
The authors declare that the research was conducted in the absence of any commercial or financial relationships that could be construed as a potential conflict of interest.
Publisher’s Note
All claims expressed in this article are solely those of the authors and do not necessarily represent those of their affiliated organizations, or those of the publisher, the editors and the reviewers. Any product that may be evaluated in this article, or claim that may be made by its manufacturer, is not guaranteed or endorsed by the publisher.
Supplementary Material
The Supplementary Material for this article can be found online at: https://www.frontiersin.org/articles/10.3389/fmicb.2021.731205/full#supplementary-material
Footnotes
- ^ http://bioinf.xmu.edu.cn/PaGeFinder/index.jsp
- ^ https://www.omicshare.com/tools/
- ^ https://www.heartcure.com.au/reffinder/
References
Alexander, H., Jenkins, B. D., Rynearson, T. A., Saito, M. A., Mercier, M. L., and Dyhrman, S. T. (2012). Identifying reference genes with stable expression from high throughput sequence data. Front. Microbiol. 3:385. doi: 10.3389/fmicb.2012.00385
Andersen, C. L., Jensen, J. L., and Orntoft, T. F. (2004). Normalization of real-time quantitative reverse transcription-PCR data: A model-based variance estimation approach to identify genes suited for normalization, applied to bladder and colon cancer data sets. Cancer Res. 64, 5245–5250. doi: 10.1158/0008-5472.CAN-04-0496
Bernáldez, V., Córdoba, J. J., Andrade, M. J., Alía, A., and Rodríguez, A. (2017). Selection of reference genes to quantify relative expression of ochratoxin A-related genes by Penicillium nordicum in dry-cured ham. Food Microbiol. 68, 104–111. doi: 10.1016/j.fm.2017.07.001
Brown, A. J., Gibson, S., Hatton, D., and James, D. C. (2018). Transcriptome-based identification of the optimal reference CHO genes for normalisation of qPCR data. Biotechnol. J. 13:1700259. doi: 10.1002/biot.201700259
Bustin, S. A., Benes, V., Garson, J. A., Hellemans, J., Huggett, J., Kubista, M., et al. (2009). The MIQE guidelines: minimum information for publication of quantitative real-time PCR experiments. Clin. Chem. 55, 611–622. doi: 10.1373/clinchem.2008.112797
Cerny, G., Hennlich, W., and Poralla, K. (1984). Spoilage of fruit juice by Bacilli: isolation and characterization of the spoiling microorganisms. Zeitschrift Lebensmittel-Untersuchung und-Forschung 179, 224–227. doi: 10.1007/BF01041898
Chen, C. M., Yuan, M., Song, J. J., Liu, Y. Y., Xia, Z. H., Yuan, Y. F., et al. (2020). Genome-wide identification and testing of superior reference genes for transcript normalization during analyses of flesh development in Asian pear cultivars. Sci. Hortic. 271:109459. doi: 10.1016/j.scienta.2020.109459
de Lázaro, I., and Kostarelos, K. (2019). Exposure to graphene oxide sheets alters the expression of reference genes used for real-time RT-qPCR normalization. Sci. Rep. 9:12520. doi: 10.1038/s41598-019-48970-z
Desroche, N., Beltramo, C., and Guzzo, J. (2005). Determination of an internal control to apply reverse transcription quantitative PCR to study stress response in the lactic acid bacterium Oenococcus oeni. J. Microbiol. Methods 60, 325–333. doi: 10.1016/j.mimet.2004.10.010
Everaert, B. R., Boulet, G. A., Timmermans, J., and Vrints, C. J. (2011). Importance of suitable reference gene selection for quantitative real-time PCR: Special reference to mouse myocardial infarction studies. PLoS One 6:e23793. doi: 10.1371/journal.pone.0023793
Feng, X., He, C. Y., Jiao, L. X., Liang, X. H., Zhao, R. X., and Guo, Y. C. (2019). Analysis of differential expression proteins reveals the key pathway in response to heat stress in Alicyclobacillus acidoterrestris DSM 3922T. Food Microbiol. 80, 77–84. doi: 10.1016/j.fm.2019.01.003
Fulvio, F., Martinelli, T., and Paris, R. (2020). Selection and validation of reference genes for RT-qPCR normalization in different tissues of milk thistle (Silybum marianum, Gaert.). Gene 768:145272. doi: 10.1016/j.gene.2020.145272
Gao, D., Kong, F. N., Sun, P. P., Bi, G. Q., and Mao, Y. X. (2018). Transcriptome-wide identification of optimal reference genes for expression analysis of Pyropia yezoensis esponses to abiotic stress. BMC Genomics 19:251. doi: 10.1186/s12864-018-4643-8
Glare, E. M., Divjak, M., Bailey, M. J., and Walters, E. H. (2002). β-Actin and GAPDH housekeeping gene expression in asthmatic airways is variable and not suitable for normalising mRNA levels. Thorax 57, 765–770. doi: 10.1136/thorax.57.9.765
Gonzalez-Pujana, A., Lázaro, I., Vining, K. H., Santos-Vizcaino, E., Igartua, M., Hernandez, R. M., et al. (2020). 3D encapsulation and inflammatory licensing of mesenchymal stromal cells alter the expression of common reference genes used in real-time RT-qPCR. Biomater. Sci. 8, 6741–6753. doi: 10.1039/d0bm01562h
Guenin, S., Mauriat, M., Pelloux, J., Van Wuytswinkel, O., Bellini, C., and Gutierrez, L. (2009). Normalization of qRT-PCR data: the necessity of adopting a systematic, experimental conditions-specific, validation of references. J. Exp. Bot. 60, 487–493. doi: 10.1093/jxb/ern305
He, S. K., Cui, Y., Qin, X. J., Zhang, F., Shi, C. L., Paoli, G. C., et al. (2018). Influence of ethanol adaptation on Salmonella enterica serovar Enteritidis survival in acidic environments and expression of acid tolerance-related genes. Food Microbiol. 72, 193–198. doi: 10.1016/j.fm.2017.12.005
He, S. N., An, T., Runa, A., and Liu, S. A. (2019). Validation of reliable reference genes for RT-qPCR studies of target gene expression in Colletotrichum camelliae during spore germination and mycelial growth and interaction with host plants. Front. Microbiol. 10:2055.
Huggett, J., Dheda, K., Bustin, S., and Zumla, A. (2005). Real-time RT-PCR normalisation; strategies and considerations. Genes Immun. 6, 279–284. doi: 10.1038/sj.gene.6364190
Jiao, L. X., Ran, J. J., Xu, X. X., and Wang, J. J. (2015). Heat, acid and cold stresses enhance the expression of DnaK gene in Alicyclobacillus acidoterrestris. Food Res. Int. 67, 183–192. doi: 10.1016/j.foodres.2014.11.023
Jureckova, K., Raschmanova, H., Kolek, J., Vasylkivska, M., Branska, B., Patakova, P., et al. (2021). Identification and validation of reference genes in Clostridium beijerinckii NRRL B-598 for RT-qPCR using RNA-Seq Data. Front. Microbiol. 12:640054. doi: 10.3389/fmicb.2021.640054
Kakagianni, M., Kalantzi, K., Beletsiotis, E., Ghikas, D., and Lianou, A. (2018). Development and validation of predictive models for the effect of storage temperature and pH on the growth boundaries and kinetics of Alicyclobacillus acidoterrestris ATCC 49025 in fruit drinks. Food Microbiol. 74, 40–49. doi: 10.1016/j.fm.2018.02.019
Liu, J. J., Tan, Y., Yang, X. H., Chen, X. H., and Li, F. L. (2013). Evaluation of Clostridium ljungdahlii DSM 13528 reference genes in gene expression studies by qRT-PCR. J. Biosci. Bioeng. 116, 460–464. doi: 10.1016/j.jbiosc.2013.04.011
Livak, K. J., and Schmittgen, T. D. (2001). Analysis of relative gene expression data using real-time quantitative PCR and the 2–Δ Δ CT method. Methods 25, 402–408. doi: 10.1006/meth.2001.1262
Metcalf, D., Sharif, S., and Weese, J. S. (2010). Evaluation of candidate reference genes in Clostridium difficile for gene expression normalization. Anaerobe 16, 439–443. doi: 10.1016/j.anaerobe.2010.06.007
Noti, O., Vaudano, E., Pessione, E., and Garcia-Moruno, E. (2015). Short-term response of different Saccharomyces cerevisiae strains to hyperosmotic stress caused by inoculation in grape must: RT-qPCR study and metabolite analysis. Food Microbiol. 52, 49–58. doi: 10.1016/j.fm.2015.06.011
Pan, J. B., Hu, S. C., Hao, W., Zou, Q., and Ji, Z. L. (2012). PaGeFinder: quantitative identification of spatiotemporal pattern genes. Bioinformatics 28, 1544–1545. doi: 10.1093/bioinformatics/bts169
Park, J. Y., Jo, S. K., Park, K. M., Yu, H., Bai, J., Ryu, S., et al. (2018). Transcriptomic analysis of Staphylococcus aureus under the stress condition of antibacterial erythorbyl laurate by RNA sequencing. Food Control 96, 1–8. doi: 10.1016/j.foodcont.2018.08.021
Park, S. J., Kwon, S. G., Hwang, J. H., Da, H. P., Kim, T. W., and Kim, C. W. (2015). Selection of appropriate reference genes for RT-qPCR analysis in Berkshire, Duroc, Landrace, and Yorkshire pigs. Gene 558, 152–158. doi: 10.1016/j.gene.2014.12.052
Peng, S., Liu, L. X., Zhao, H. Y., Wang, H., and Li, H. (2018). Selection and validation of reference genes for quantitative real-time PCR normalization under ethanol stress conditions in Oenococcus oeni SD-2a. Front. Microbiol. 9:892. doi: 10.3389/fmicb.2018.00892
Periago, P. M., van Schaik, W., Abee, T., and Wouters, J. A. (2002). Identification of proteins involved in the heat stress response of Bacillus cereus ATCC 14579. Appl. Environ. Microbiol. 68, 3486–3495. doi: 10.1128/AEM.68.7.3486-3495.2002
Pfaffl, M. W., Tichopad, A., Prgomet, C., and Neuvians, T. P. (2004). Determination of stable housekeeping genes, differentially regulated target genes and sample integrity: bestkeeper-Excel-Based tool using pair-wise correlations. Biotechnol. Lett. 26, 509–515. doi: 10.1023/B:BILE.0000019559.84305.47
Pornpukdeewattana, S., Jindaprasert, A., and Massa, S. (2020). Alicyclobacillus spoilage and control-a review. Crit. Rev. Food Sci. Nutr. 60, 108–122. doi: 10.1080/10408398.2018.1516190
Shakeel, M., Rodriguez, A., Tahir, U. B., and Jin, F. L. (2017). Gene expression studies of reference genes for quantitative real-time PCR: an overview in insects. Biotechnol. Lett. 40, 227–236. doi: 10.1007/s10529-017-2465-4
Smit, Y., Cameron, M., Venter, P., and Witthuhn, R. C. (2011). Alicyclobacillus spoilage and isolation-A review. Food Microbiol. 28, 331–349. doi: 10.1016/j.fm.2010.11.008
Thellin, O., Elmoualij, B., Heinen, E., and Zorzi, W. (2009). A decade of improvements in quantification of gene expression and internal standard selection. Biotechnol. Adv. 27, 323–333. doi: 10.1016/j.biotechadv.2009.01.010
Vandecasteele, S. J., Peetermans, W. E., Merckx, R., and Eldere, J. V. (2002). Quantification of expression of Staphylococcus epidermidis housekeeping genes with Taqman quantitative PCR during in vitro growth and under different conditions. J. Bacteriol. 183, 7094–7101. doi: 10.1128/JB.183.24.7094-7101.2001
Vandesompele, J., Preter, K. D., Pattyn, F., Poppe, B., Roy, N. V., Paepe, A. D., et al. (2002). Accurate normalization of real-time quantitative RT-PCR data by geometric averaging of multiple internal control genes. Genome Biol. 3:0034.1. doi: 10.1186/gb-2002-3-7-research0034
Wan, H. J., Zhao, Z. G., Qian, C. T., Sui, Y. H., Malik, A. A., and Chen, J. F. (2010). Selection of appropriate reference genes for gene expression studies by quantitative real-time polymerase chain reaction in cucumber. Anal. Biochem. 399, 257–261. doi: 10.1016/j.ab.2009.12.008
Witthuhn, R. C., Merwe, E. V. D., Venter, P., and Cameron, M. (2012). Guaiacol production from ferulic acid, vanillin and vanillic acid by Alicyclobacillus acidoterrestris. Int. J. Food Microbiol. 157, 113–117. doi: 10.1016/j.ijfoodmicro.2012.04.022
Xie, F. L., Peng, X., Chen, D. L., Xu, L., and Zhang, B. H. (2012). miRDeepFinder: a miRNA analysis tool for deep sequencing of plant small RNAs. Plant Mol. Biol. 80, 75–84. doi: 10.1007/s11103-012-9885-2
Xing, Q. K., Rousvoal, S., and Leblanc, C. (2021). Transcriptome-wide identification and evaluation of optimal reference genes for RT-qPCR expression analysis of Saccharina latissima responses to biotic and abiotic stress. J. Appl. Phycol. 33, 617–727. doi: 10.1007/s10811-020-02279-x
Zhang, J. P., Deng, C. C., Li, J. L., and Zhao, Y. J. (2020). Transcriptome-based selection and validation of optimal house-keeping genes for skin research in goats (Capra hircus). BMC Genomics 21:493. doi: 10.1186/s12864-020-06912-4
Keywords: ctsR, dnaG, geNorm, juice spoilage, normalization, RefFinder
Citation: Zhao N, Xu J, Jiao L, Qiu M, Zhang J, Wei X and Fan M (2021) Transcriptome-Based Selection and Validation of Reference Genes for Gene Expression Analysis of Alicyclobacillus acidoterrestris Under Acid Stress. Front. Microbiol. 12:731205. doi: 10.3389/fmicb.2021.731205
Received: 26 June 2021; Accepted: 10 August 2021;
Published: 27 August 2021.
Edited by:
Min Suk Rhee, Korea University, South KoreaReviewed by:
Irene De Lazaro Del Rey, Harvard University, United StatesAntonio Bevilacqua, University of Foggia, Italy
Copyright © 2021 Zhao, Xu, Jiao, Qiu, Zhang, Wei and Fan. This is an open-access article distributed under the terms of the Creative Commons Attribution License (CC BY). The use, distribution or reproduction in other forums is permitted, provided the original author(s) and the copyright owner(s) are credited and that the original publication in this journal is cited, in accordance with accepted academic practice. No use, distribution or reproduction is permitted which does not comply with these terms.
*Correspondence: Mingtao Fan, ZmFubXRAbndzdWFmLmVkdS5jbg==
 Ning Zhao
 Junnan Xu
 Lingxia Jiao2
 Mengzhen Qiu
 Jie Zhang
 Mingtao Fan