 Qisheng Song
 Xiaohong Guo2
95% of researchers rate our articles as excellent or good
Learn more about the work of our research integrity team to safeguard the quality of each article we publish.
Find out more
ORIGINAL RESEARCH article
Front. Microbiol. , 04 October 2021
Sec. Antimicrobials, Resistance and Chemotherapy
Volume 12 - 2021 | https://doi.org/10.3389/fmicb.2021.714617
This article is part of the Research Topic Approaches to address Resistance, Drug Discovery, and Vaccine development in Mycobacterium Tuberculosis: Challenges and opportunities View all 9 articles
Background: To date, radiographic sign clusters of multidrug-resistant pulmonary tuberculosis (MDR-TB) patients have not been reported. We conducted a study to investigate the classification and prognosis of sign clusters in pulmonary Computed Tomography (CT) images from patients with MDR-TB for the first time by using principal component analysis (PCA).
Methods: The clinical data and pulmonary CT findings of 108 patients with MDR-TB in the Liupanshui Third Hospital were collected (from January 2018 to December 2020). PCA was used to analyze the sign clusters on pulmonary CT, and receiver operating characteristic (ROC) analysis was used to analyze the predictive value of the treatment outcome of MDR-TB patients.
Results: Six cluster signs of MDR-TB were determined by PCA: nodules, infiltration, consolidation, cavities, destroyed lung and non-active lesions. Nine months after treatment, the area under the ROC curve (AUC) of MDR-TB patients with a cavity sign cluster was 0.818 (95% CI: 0.733–0.886), and the positive predictive value (PPV) and negative predictive value (NPV) of the treatment outcome were 79.6% (95% CI: 65.7–89.8%) and 72.9% (95% CI: 59.7–83.6%), respectively.
Conclusion: PCA plays an important role in the classification of sign groups on pulmonary CT images of MDR-TB patients, and the sign clusters obtained from PCA are of great significance in predicting the treatment outcome.
Due to its high incidence rate, high recurrence rate, high mortality rate, long course of treatment and high cost, multidrug-resistant pulmonary tuberculosis (MDR-TB, defined as TB strains resistant to at least isoniazid and rifampin) is still one of the main public health problems in tuberculosis prevention and control (Pontali et al., 2019; Harding, 2020; Migliori et al., 2020; Singh et al., 2020). In addition, there are ~1.9 million latent MDR-TB-infected people around the world (Knight et al., 2019); consequently, the diagnosis and treatment of patients with MDR-TB remain daunting challenges. Imaging is of great reference value for the early diagnosis and evaluation of the treatment outcome of MDR-TB patients. At present, there are many studies describing the signs of CT imaging in patients with MDR-TB (Zahirifard et al., 2003; Song et al., 2016; Wang et al., 2018; Mehrian et al., 2020). However, during clinical practice, there is nearly no possibility that only a single sign exists in a CT image of patients with MDR-TB. Typically, a set of signs are present in some sort of imaging, and there are always obvious correlations among them.
In medical research, the same individual often involves multiple random variables, and these variables regularly have a certain correlation. According to the relationship between the original variables, principal component analysis (PCA) can be used to calculate a few principal components and summarize the main information for the original variables. Compared with other statistical methods, PCA neither increases nor reduces the total information, making it one of the most important dimensionality reduction methods (Wold et al., 1987). Therefore, PCA could be used to analyze the sign clusters on pulmonary CT images in MDR-TB cases.
PCA has been used in many medical studies, but the study of PCA in radiographic sign clusters of MDR-TB patients has not been reported (Yamamura et al., 1991; Yamamoto et al., 2010; Dillmann et al., 2014).
In addition, it might be more accurate to analyze the predictive value of treatment outcomes in MDR-TB patients by using the sign clusters obtained from PCA.
This study retrospectively analyzed the clinical and imaging features of 108 patients with MDR-TB (without HIV) from January 2018 to December 2020 by using PCA, and receiver operating characteristic (ROC) analysis was used to evaluate the abovementioned sign clusters for the positive predictive value (PPV) of the treatment outcome of MDR-TB patients and to provide an important theoretical basis for imaging research on patients with MDR-TB.
The Ethics Committee of Liupanshui Third Hospital approved the study, and individual consent for this retrospective analysis was waived because only imaging findings and demographic data were retrieved from the picture archiving and communication system (PACS) server and medical records.
The research was conducted at the Liupanshui Third Hospital, which is a referral hospital for the management of TB patients and suspects from Liupanshui city, which has a population of more than three million. From January 2018 to December 2020, 1986 patients with a diagnosis of smear-positive pulmonary TB were screened. Of these, 1449 patients with positive sputum cultures were available for review, including 1,181 cases with drug-sensitive TB (DS-TB), 158 cases with MDR-TB and 110 patients with other forms of drug-resistant TB. Of the 156 patients with MDR-TB, 2 HIV-positive cases and 48 cases other cases were excluded due to incomplete clinical data (35 patients had not completed the course of treatment, and 13 patients experienced treatment interruption). The remaining 108 subjects comprised 55 cured patients and 53 patients with treatment failure. Sixty-six patients were randomly selected among the 1,181 patients, with DS-TB as controls. All the subjects in this study were HIV-negative (Figure 1).
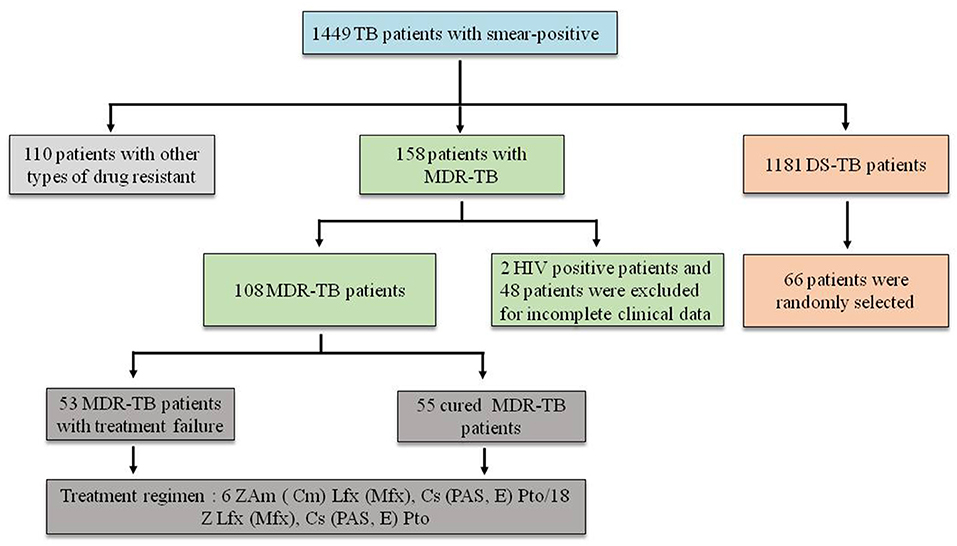
Figure 1. Screening of patients. Z, pyrazinamide; Am, amikacin; Cm, capreomycin; LFX, levofloxacin; MFX, moxifloxacin; CS, cycloserine; PAS, p-aminosalicylic acid; E, ethambutol; PTO, prothionamide.
The research hospital is located in an economically underdeveloped area of China, so it has not been able to obtain core drugs such as beta-quinoline. The treatment regimen still adopted the guidelines recommended by the World Health Organization (WHO) in 2014 (World Health Organization, 2014) (Figure 1).
The clinical data included age, sex, smoking status, alcohol abuse status, and previous TB treatment history.
All subjects in this study underwent High-Resolution Computed tomography (HRCT) scans before treatment, in the 3rd, 6th, 9th, and 12th months and post-treatment. Imaging assessments were evaluated for the following signs: (1) airway damage, including as thickening of the airway wall, stenosis or expansion of the lumen and thickening of the interstitium around the tracheal vascular bundle; (2) small nodules <1 cm in diameter, including trees in buds, branch line nodes, nodules with poorly defined margins, cluster nodules, reticulonodular opacity (combined reticular and nodular opacity) and miliary nodules; (3) large nodules between 1 and 3 cm in diameter; (4) patchy opacities, including patchy shadows and irregular flaky infiltration; (5) ground glass opacities (GGOs); (6) pure consolidations, including focal consolidation, segment consolidation, and lobe consolidation; (7) consolidations with cavities: consolidations with single or multiple cavities (including moth-eaten cavities); (8) cavitary lesions <3 in number; (9) multiple cavities ≥ 3 in number but not including consolidations or destroyed lung; (10) pleural involvement (including pleural thickening or pleural effusion); (11) fibrotic lesions, including fibrotic nodules with clear boundaries, fiber chords, fibrous plaque, and fibrous masses; (12) bronchiectasis not included in consolidations or destroyed lung; (13) air trapping; and (14) destroyed lung.
Because the incidence rate of a single sign could not reflect the scope and severity of the lesion, we compared various signs according to the six-zone scoring methods proposed by Casarini et al. (1999). On the HRCT scans, the lungs were divided into six zones (namely, the upper, middle, and lower zones of the right and left lungs). These areas of the lungs were defined as the “upper zones” above the level of the carina, the “middle zones” between the level of the carina and the level of the inferior pulmonary veins, and the “lower zones” below the level of the inferior pulmonary veins. The HRCT score was determined by visually estimating the extent of disease in each zone. The HRCT scans were analyzed by three independent chest radiologists on the premise of unknown disease types, and final conclusions on the findings were reached by consensus. The arbitrary score was based on the percentage of lung parenchyma that showed evidence of each recorded abnormality: involvement of (1) <25%, (2) 25–50%, (3) 50–75%, and (4) more than 75% of the image. A total score for each area was generated by adding the partial scores of each sign mentioned above, theoretically ranging between 0 and 4. Altogether, the total score for each lung ranged between 0 and 24. For example, “X” indicated that the distribution range was more than 75% in six zones of both the right lung and left lung, and the total score was 24 (4 × 6).
Cures and treatment failure were determined according to WHO guidelines in 2018 (World Health Organization, 2018). A cure occurs when a patient who has completed treatment exhibits no evidence of failure and has three or more consecutive negative cultures taken at least 30 days apart after the intensive phase. A failure occurs when treatment is terminated or when there is a need for a permanent regimen change of at least two anti-TB drugs because of a lack of conversion by the end of the intensive phase, bacteriological reversion in the continuation phase after conversion to negative, evidence of additional acquired resistance to fluoroquinolones or second-line injectable drugs, or adverse drug reactions.
SPSS 22.0 and MedCalc software were used for data analysis. Measurement data for variables with normal distributions were compared using a t-test, and those without normal distributions were compared using a non-rank-sum parameter test. Count data were compared using a chi-squared test. PCA was used to analyze the sign clusters, and the predictive value of the treatment outcome was analyzed by ROC analysis. Statistical significance was set at two-tailed P < 0.05.
As the age of the patients did not conform to a normal distribution (P < 0.05), the non-rank-sum parameter test was used for comparison, and there was no significant difference between the DS-TB and MDR-TB groups (P > 0.05). Moreover, there was no significant difference between the DS-TB and MDR-TB groups (P > 0.05) with respect to the other items, except that the treatment history was more frequent in the MDR-TB group than in the control group (P < 0.05) after the chi-squared test (Table 1).
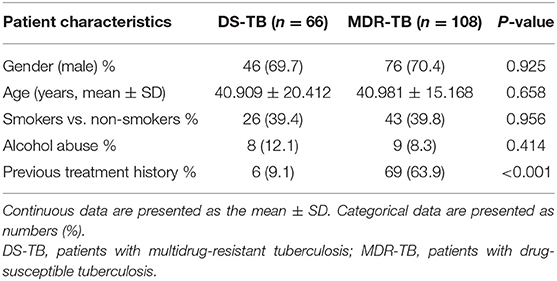
Table 1. Comparison of clinical characteristics of the patients with DS-TB and MDR-TB.
As all scores of the patients' signs did not conform to a normal distribution (P < 0.05), the non-rank-sum parameter test was used for comparison. The results showed that the incidence and score of pure consolidation in DS-TB patients were higher than those in the MDR-TB group (P < 0.05); in contrast, the incidence and score of fibrous lesions and bronchiectasis in the MDR-TB group were higher (P < 0.05). In multiple cavities, the incidence was higher in the MDR-TB group than in the DS-TB group (P < 0.05), but there was no difference in their scores (P > 0.05). Other signs, including airway damage, small nodules, large nodules, patchy opacities, GGOs, consolidations with cavitary lesions, air trapping, and destroyed lung, showed no statistically significant differences in incidence or scores between the two groups (P > 0.05) (Table 2).
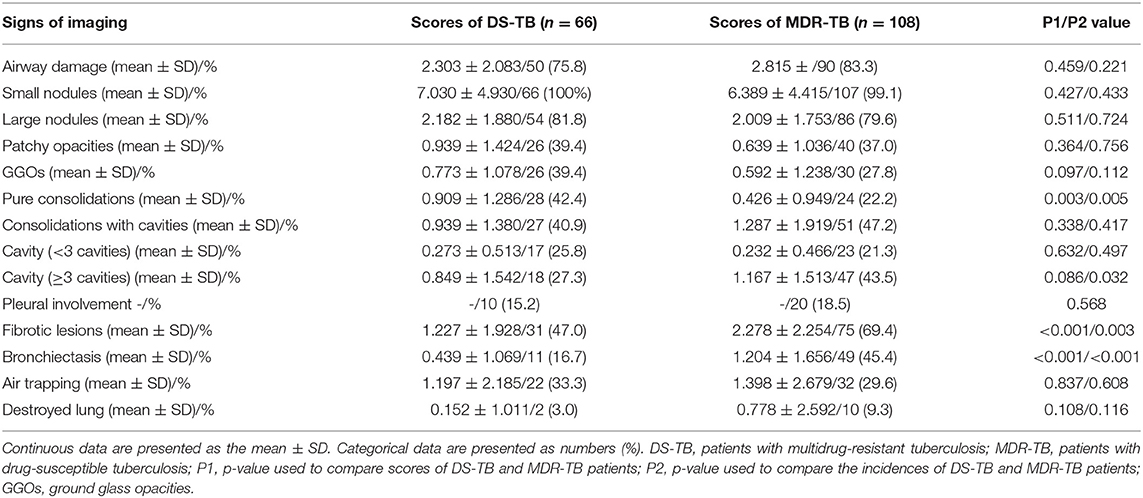
Table 2. Comparison of imaging features in MDR-TB and DS-TB cases.
Using the scores of the foregoing 14 signs of 108 MDR-TB patients before treatment as variables, PCA was performed by using SPSS 22.0 software.
The Kaiser-Meyer-Olkin (KMO) test was used to check the partial correlation between variables, and Bartlett's spherical test was used to test the correlation matrix between data. In this study, the KMO value was 0.608 (>0.5), and the chi-squared value of Bartlett's spherical test was 389.651, with P = 0.000 (<0.01). Both tests suggested that the sample was suitable for PCA.
According to the screen plot (the data after the seventh principal component tended to be flat) and the rule stating that the characteristic root of the principal component be >1, the first six principal components were selected, and the cumulative contribution rate was 73.123%. The specific results are shown in Figure 2 and Table 3.
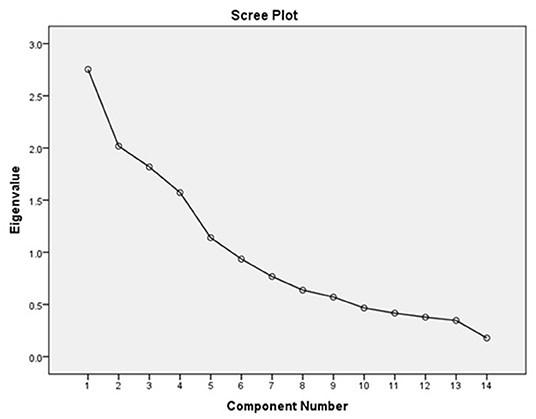
Figure 2. Scree plot.
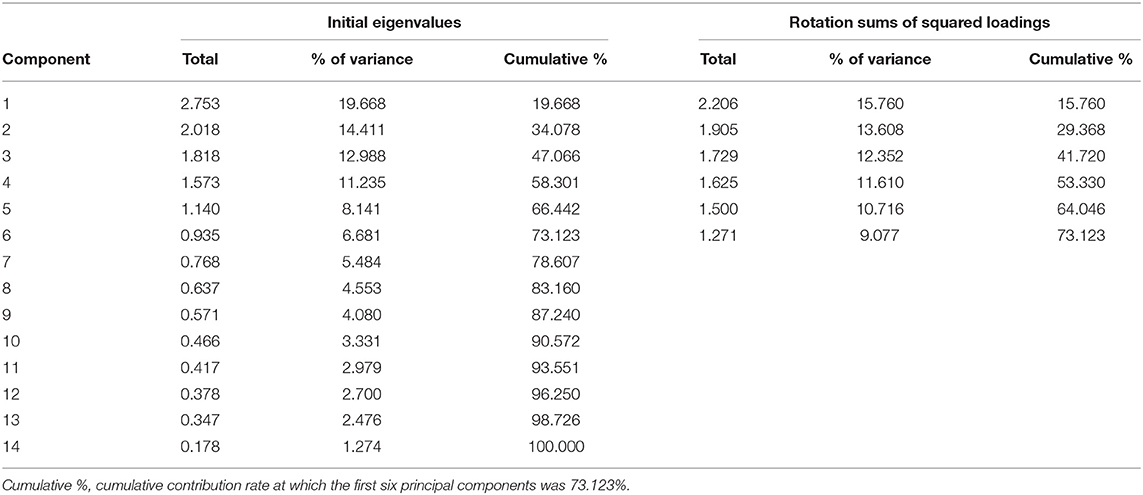
Table 3. Total variance explained.
The first principal component represented a non-active sign cluster, including fibrotic lesions, bronchiectasis and air trapping. The second principal component represented the destroyed lung sign cluster, including airway damage and pleural involvement. The third principal component represented cavity sign clusters, including cavities and consolidations with cavities. The fourth principal component represented the infiltration sign cluster, including patchy shadows and GGOs. The fifth principal component was the sign cluster of nodules, including various types of nodules. The sixth principal component represented pure consolidations without cavities. The specific results are shown in Table 4 (data with correlation coefficients <0.5 were excluded).
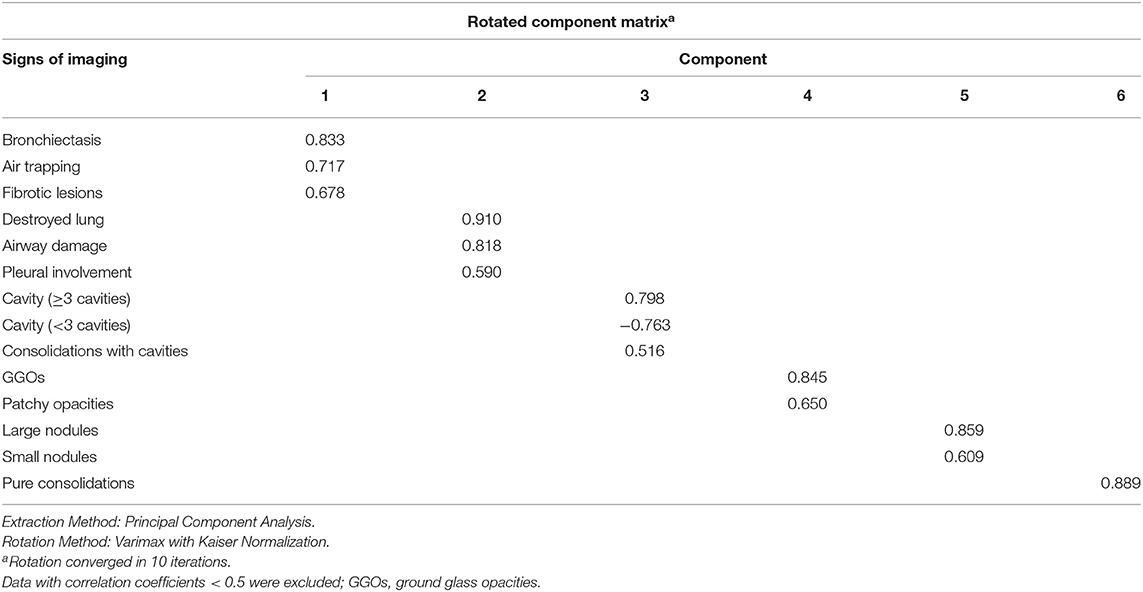
Table 4. Rotated component matrix.
ROC analysis was performed by using the treatment outcomes of MDR-TB patients as the dependent variable and five foregoing active sign cluster scores as covariates. The results showed that the areas under the ROC curves (AUCs) of the sign clusters with infiltration, consolidations and destroyed lung were too low, and those of all treatment stages were <0.7.
The AUCs of the sign clusters of nodules tested before treatment, in the 3rd, 6th, 9th, and 12th months, and post-treatment were 0.669 (95% CI: 0.571–0.756), 0.684 (95% CI: 0.587–0.770), 0.734 (95% CI: 0.641–0.815), 0.764 (95% CI: 0.673–0.841), 0.777 (95% CI: 0.686–0.851), and 0.798 (95% CI: 0.710–0.870), respectively.
The AUCs of the sign clusters of cavities detected before treatment, in the 3rd, 6th, 9th, 12th months, and post-treatment were 0.546 (95% CI: 0.448–0.643), 0.551 (95% CI: 0.452–0.647), 0.702 (95% CI: 0.606–0.786), 0.818 (95% CI: 0.733–0.886), 0.872 (95% CI: 0.794–0.928), 0.883 (95% CI: 0.807–0.937), respectively.
With the extension of the treatment time, the AUC increased gradually, and a significant difference among the different stages appeared after the 3rd month (P < 0.05), but no difference was found between the 9th month and post-treatment (P > 0.05).
After 6 months of treatment, the sensitivity and specificity were 90.9% (95% CI: 80.0–97.0%) and 41.51% (95% CI: 28.1–55.9%), respectively, and the PPV and negative predictive value (NPV) were 60.3% (95% CI: 48.5–71.2%) and 73.3% (95% CI: 54.1–87.7%), respectively. Nine months after treatment, the sensitivity and specificity were 70.91% (95% CI: 65.7–89.8%) and 72.9% (95% CI: 68.0–90.6%), respectively. The PPV and NPV were 79.6% (95% CI: 65.7–89.8%) and 72.9% (95% CI: 59.7–83.6%), respectively (Figure 3).
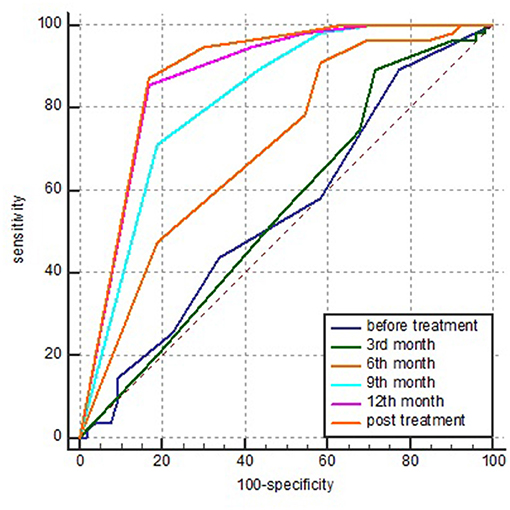
Figure 3. AUC of the sign clusters of cavities detected in various stages of treatment by ROC analysis. AUC, area under the ROC curve and ROC, receiver operating characteristic.
Although large studies of MDR-TB patients have been reported, inconsistencies still exist in the clinic due to differences in research areas, objects and methods, especially in imaging.
In terms of sex, age, smoking status and alcohol abuse status, no difference was found between the two groups, suggesting that these factors might not be risk factors for MDR-TB. As reported in other studies, we found that patients with a previous TB treatment history were significantly more likely to have MDR-TB (Eshetie et al., 2017; Pradipta et al., 2018).
Unlike other studies of pure consolidations (Yeom et al., 2009; Song et al., 2016), we found that the incidence and scores were relatively high in DS-TB patients (P < 0.05) and were similar to those reported by Sulistijawati et al. (2019). Significantly, other studies did not clearly indicate whether the consolidations in their research were accompanied by cavities, and the sign of consolidations in our previous studies included all the consolidations with or without cavities. The difference might stem from the fact that consolidations in other studies were not categorized; on the other hand, as Yeom et al. (2009) put forward, the levels of epidemiology vary across different countries and populations. Therefore, research data from different countries should be provided for more accurate results.
Similar to other studies, our research showed that both the incidence and scores of fibrotic lesions and bronchiectasis in MDR-TB patients were relatively higher than those in the control group (Chung et al., 2006). Both fibrotic lesions and bronchiectasis were related to collagen deposition and fibrous scarring, which could occur in all stages of anti-TB treatment (Hunter, 2011; DiFazio et al., 2016). Understandably, most MDR-TB patients have a history of anti-TB and treatment with longer courses and experience a lengthy repair process in the lungs; these fibrotic changes are also important reasons for the sequelae of cured MDR-TB patients.
Consistent with most literature studies (Chung et al., 2006; Yeom et al., 2009; Wang et al., 2018; Sulistijawati et al., 2019), our study showed that more cavities were found in patients with MDR-TB than in DS-TB patients (P < 0.05), although statistical analysis showed no difference in their scores (P > 0.05). A possible reason was that the number of patients in the control group was relatively low.
Despite many descriptions of the signs of pulmonary tuberculosis (Hatipoglu et al., 1996; Jeon et al., 2016; Meghji et al., 2016; Restrepo et al., 2016), nearly no patients with pulmonary tuberculosis presented with only a single sign. The majority of patients were characterized as having a sign cluster manifesting as one certain main sign accompanied by a variety of other signs, and the pathological bases of some signs were similar or even identical (Hunter, 2011, 2020); all cases involved proliferation (granulomas), exudation, necrosis or a mixed process of mutual transformation. Due to the descriptive signs and comparison of the studies that did not conform, the results were inconsistent.
Therefore, on the one hand, we hope that a unified sign or sign clusters could be applied in imaging studies of MDR-TB patients to compare the results of multiple studies. On the other hand, we would like to use fewer representative signs or sign clusters to simplify the imaging research process.
As an important statistical method of data dimension reduction, PCA could explore the basic structure of observation data by studying the internal dependence of many variables and determine a few hypothetical variables to represent basic data.
In our study, we obtained six CT sign clusters in MDR-TB patients. By using PCA, five active sign clusters (nodules, cavities, infiltration opacities, pure consolidations and destroyed lung) and one non-active sign cluster. To the best of our knowledge, this is the first study to use PCA to classify the signs of MDR-TB patients worldwide. Compared with signs reported in other studies, this classification can simplify the analysis of signs in patients with MDR-TB, which is of great significance for imaging studies of MDR-TB patients.
This sign included both consolidations and cavities that could not be classified as pure consolidations or simple cavities in terms of imaging. In a pathology study, Hunter (2011) speculated that consolidations, especially consolidations with cavities, were actually caused by bronchial tuberculosis, which leads to airway obstruction and then causes fatty and caseous necrotizing pneumonia at different stages, including various pathological components: fatty components, caseous tissue, cavities, caseous granulomas and fibrotic tissue. This complex pathological component makes it impossible for us to classify it accurately in imaging. However, it was found that consolidations with cavities were significantly correlated with cavities by our PCA, which is consistent with the “Instructions to Panel Physicians for Completing New U.S. Department of State Medical Examination for Immigrant or Refugee Applicants” (Centers for Disease Control and Prevention, 2006). Therefore, this result provides an important basis for the classification of imaging signs in MDR-TB patients.
Chen et al. used positron emission tomography (PET) CT and HRCT to predict the treatment effect of 28 MDR-TB patients in 2017 (Chen et al., 2014), which showed very good predicted results for treatment at the 2nd month and 6th month, respectively. However, PET CT is not suitable for the clinic because of its high price and radiation.
In their study, the AUC was 0.82 (95% CI: 0.58–1.0) at the 6th month when the CT reading score was used to predict the outcome of treatment by ROC analysis. However, our study suggested that the AUCs of treatment based on the signs of cavities at the 6th and 9th months were 0.702 (95% CI: 0.606–0.786) and 0.818 (95% CI: 0.733–0.886), respectively. Obviously, the AUC at the 6th month in our study was significantly lower than the corresponding value obtained by Chen et al., but the areas at the 9th month were similar. One reason for these diversities was that our evaluation methods were different: the signs described by Chen et al. were six single signs, and they did not indicate whether consolidations with cavitation were classified as consolidations or cavities. However, the objects we evaluated were five activity sign clusters obtained by PCA. On the other hand, the most important reason might be the different therapeutic regimens. Restricted by economic conditions and other factors, the local tuberculosis hospital still applied the treatment regimen recommended by the WHO in 2014 (World Health Organization, 2014). If the subjects in this study were treated by the treatment regimen guided by the WHO in 2020 (Mirzayev et al., 2020), better predictive value could be obtained.
Moreover, we must recognize that although CT has predictive value for the treatment outcome of MDR-TB patients, it is not ideal. We still need to combine sputum culture at present or find new biomarkers in the future to obtain better predictions.
Our study has several important limitations. First, the number of cases was relatively small. Second, the residential areas in which our study subjects lived were economically impoverished. Due to the limitations of low education and poor income levels, most patients could not seek medical advice at the first appearance of symptoms; some patients, especially those who were elderly, even gave up the diagnosis and treatment, which inevitably led to the bias of investigated object selection. Third, 69 (63.9%) MDR-TB patients had a treatment history, and a longer history was associated with more lesion extents and more damage to the lungs, which had some influence on the imaging findings.
However, from another perspective, delayed diagnosis and treatment could lead to more complex signs. For the patients with MDR-TB who had a treatment history, most of the sensitive mycobacterium had been killed, and the image produced by the action of the sensitive mycobacterium should have been resolved. Therefore, we believe that these imaging data might be more meaningful for the extraction of sign clusters. Naturally, research on more patients and multicenter research should be conducted in the future to confirm our results.
Furthermore, different treatment regimens had a significant influence on the predictive value of the treatment outcome. Therefore, the impact of the latest anti-MDR-TB regimen recommended by the WHO in 2020 on the prognosis of imaging in MDR-TB patients needs to be further studied (Mirzayev et al., 2020).
PCA plays an important role in the classification of sign groups on pulmonary CT images of MDR-TB patients, and the sign clusters obtained from PCA are of great significance in predicting the treatment outcome.
The original contributions presented in the study are included in the article/supplementary material, further inquiries can be directed to the corresponding author/s.
The studies involving human participants were reviewed and approved by the Ethics Committee of Liupanshui Third Hospital. Written informed consent from the participants' legal guardian/next of kin was not required to participate in this study in accordance with the national legislation and the institutional requirements.
QS and XL conceived and designed the study and drafted the manuscript. QS, XG, LZ, and LY collated and collected data. QS did the statistical analysis. All authors played a significant role in data collection and analysis.
This study was supported by a grant to the Guizhou Province Science and Technology Plan Project: [2020] No. 4y151.
The authors declare that the research was conducted in the absence of any commercial or financial relationships that could be construed as a potential conflict of interest.
All claims expressed in this article are solely those of the authors and do not necessarily represent those of their affiliated organizations, or those of the publisher, the editors and the reviewers. Any product that may be evaluated in this article, or claim that may be made by its manufacturer, is not guaranteed or endorsed by the publisher.
Casarini, M., Ameglio, F., Alemanno, L., Zangrilli, P., Mattia, P., Paone, G., et al. (1999). Cytokine levels correlate with a radiologic score in active pulmonary tuberculosis. Am. J. Respir. Crit. Care Med. 159, 143–148. doi: 10.1164/ajrccm.159.1.9803066
Centers for Disease Control and Prevention (2006). Instructions to Panel Physicians for Completing New U.S. Atlanta: Department of State Medical Examination for Immigrant or Refugee Applicant, Centers for Disease Control and Prevention.
Chen, R. Y., Dodd, L. E., Lee, M., Paripati, P., Hammoud, D. A., Mountz, J. M., et al. (2014). PET/CT imaging correlates with treatment outcome in patients with multidrug-resistant tuberculosis. Sci. Transl. Med. 6:265ra166. doi: 10.1126/scitranslmed.3009501
Chung, M. J., Lee, K. S., Koh, W. J., Kim, T. S., Kang, E. Y., and Kim, S. M. (2006). Drug-sensitive tuberculosis, multidrug-resistant tuberculosis, and nontuberculous mycobacterial pulmonary disease in nonAIDS adults: comparisons of thin-section CT findings. Eur. Radiol. 16, 1934–1941. doi: 10.1007/s00330-006-0174-9
DiFazio, R. M., Mattila, J. T., Klein, E. C., Cirrincione, L. R., Howard, M., Wong, E. A., et al. (2016). Active transforming growth factor-beta is associated with phenotypic changes in granulomas after drug treatment in pulmonary tuberculosis. Fibrogenesis Tissue Repair 9:6. doi: 10.1186/s13069-016-0043-3
Dillmann, U., Holzhoffer, C., Johann, Y., Bechtel, S., Graber, S., Massing, C., et al. (2014). Principal component analysis of gait in Parkinson's disease: relevance of gait velocity. Gait Posture 39, 882–887. doi: 10.1016/j.gaitpost.2013.11.021
Eshetie, S., Gizachew, M., Dagnew, M., Kumera, G., Woldie, H., Ambaw, F., et al. (2017). Multidrug resistant tuberculosis in Ethiopian settings and its association with previous history of anti-tuberculosis treatment: a systematic review and meta-analysis. BMC Infect. Dis. 17:219. doi: 10.1186/s12879-017-2323-y
Harding, E. (2020). WHO global progress report on tuberculosis elimination. Lancet Respir. Med. 8:19. doi: 10.1016/S2213-2600(19)30418-7
Hatipoglu, O. N., Osma, E., Manisali, M. E. T. I. N., Ucan, E. S., Balci, P., Akkoclu, A., et al. (1996). High resolution computed tomographic findings in pulmonary tuberculosis. Thorax 51, 397–402. doi: 10.1136/thx.51.4.397
Hunter, R. L. (2011). Pathology of post primary tuberculosis of the lung: an illustrated critical review. Tuberculosis 91, 497–509. doi: 10.1016/j.tube.2011.03.007
Hunter, R. L. (2020). The pathogenesis of tuberculosis-the koch phenomenon reinstated. Pathogens 9:813. doi: 10.3390/pathogens9100813
Jeon, K. N., Ha, J. Y., Park, M. J., Bae, K., Baek, H. J., Choi, B. H., et al. (2016). Pulmonary tuberculosis in patients with emphysema: computed tomography findings. J. Comput. Assist. Tomogr. 40, 912–916. doi: 10.1097/RCT.0000000000000452
Knight, G. M., McQuaid, C. F., Dodd, P. J., and Houben, R. (2019). Global burden of latent multidrug-resistant tuberculosis: trends and estimates based on mathematical modelling. Lancet Infect. Dis. 19, 903–912. doi: 10.1016/S1473-3099(19)30307-X
Meghji, J., Simpson, H., Squire, S. B., and Mortimer, K. (2016). A systematic review of the prevalence and pattern of imaging defined post-TB lung disease. PLoS ONE 11:e0161176. doi: 10.1371/journal.pone.0161176
Mehrian, P., Farnia, P., Jalalvand, D., Chamani, M. R., and Bakhtiyari, M. (2020). Computerised tomography scan in multi-drug-resistant versus extensively drug-resistant tuberculosis. Pol. J. Radiol. 85, e39–e44. doi: 10.5114/pjr.2020.93123
Migliori, G. B., Tiberi, S., Zumla, A., Petersen, E., Chakaya, J. M., Wejse, C., et al. (2020). Challenges facing the new decade. The 2020 clinical update by the Global Tuberculosis Network. Int. J. Infect Dis. 92S, S15–S25. doi: 10.1016/j.ijid.2020.01.042
Mirzayev, F., Viney, K., Linh, N. N., Gonzalez-Angulo, L., Gegia, M., Jaramillo, E., et al. (2020). World Health Organization recommendations on the treatment of drug-resistant tuberculosis, 2020 update. Eur. Respir. J. 57:2003300. doi: 10.1183/13993003.03300-2020
Pontali, E., Raviglione, M. C., and Migliori, G. B. (2019). Regimens to treat multidrug-resistant tuberculosis: past, present and future perspectives. Eur. Respir. Rev. 28:152. doi: 10.1183/16000617.0035-2019
Pradipta, I. S., Forsman, L. D., Bruchfeld, J., Hak, E., and Alffenaar, J. W. (2018). Risk factors of multidrug-resistant tuberculosis: a global systematic review and meta-analysis. J. Infect. 77, 469–478. doi: 10.1016/j.jinf.2018.10.004
Restrepo, C. S., Katre, R., and Mumbower, A. (2016). Imaging manifestations of thoracic tuberculosis. Radiol. Clin. North Am. 54, 453–473. doi: 10.1016/j.rcl.2015.12.007
Singh, R., Dwivedi, S. P., Gaharwar, U. S., Meena, R., Rajamani, P., and Prasad, T. (2020). Recent updates on drug resistance in Mycobacterium tuberculosis. J. Appl. Microbiol. 128, 1547–1567. doi: 10.1111/jam.14478
Song, Q., Zhang, G., Jiang, H., Ren, Y., and Lu, X. (2016). Imaging features of pulmonary CT in Type 2 diabetic patients with multidrug-resistant tuberculosis. PLoS ONE 11:e0152507. doi: 10.1371/journal.pone.0152507
Sulistijawati, R. S., Icksan, A. G., Lolong, D. B., and Nurwidya, F. (2019). Thoracic radiography characteristics of drug sensitive tuberculosis and multi drug resistant tuberculosis: a study of Indonesian national tuberculosis prevalence survey. Acta Med. 62, 24–29. doi: 10.14712/18059694.2019.42
Wang, Y. X. J., Chung, M. J., Skrahin, A., Rosenthal, A., Gabrielian, A., and Tartakovsky, M. (2018). Radiological signs associated with pulmonary multi-drug resistant tuberculosis: an analysis of published evidences. Quant. Imaging Med. Surg. 8, 161–173. doi: 10.21037/qims.2018.03.06
Wold, S., Esbensen, K., and Geladi, P. (1987). Principal component analysis. Chemomet. Intellig. Lab. Syst. 2, 37–52. doi: 10.1016/0169-7439(87)80084-9
World Health Organization (2014). Companion Handbook to the WHO Guidelines for the Programmatic Management of Drug-Resistant Tuberculosis. Geneva: World Health Organization.
World Health Organization (2018). WHO Treatment Guidelines for Multidrug- and Rifampicin-Resistant Tuberculosis. 2018 Update. Geneva: World Health Organization Document.
Yamamoto, S., Tsumura, N., Ogawa-Ochiai, K., Nakaguchi, T., Kasahara, Y., Namiki, T., et al. (2010). Early detection of disease-oriented state from hyperspectral tongue images with principal component analysis and vector rotation. Annu. Int. Conf. IEEE Eng. Med. Biol. Soc. 2010, 3025–3028. doi: 10.1109/IEMBS.2010.5626147
Yamamura, K., Onodera, S., Sasaki, N., Matsumoto, H., Nakano, H., and Makino, M. (1991). Principal component analysis of various respiratory function tests: the relationship between factor score and severity of pulmonary circulatory disorder in chronic obstructive pulmonary disease. Respir. Med. 85, 37–43. doi: 10.1016/S0954-6111(06)80208-8
Yeom, J. A., Jeong, Y. J., Jeon, D., Kim, K. I., Kim, C. W., Park, H. K., et al. (2009). Imaging findings of primary multidrug-resistant tuberculosis: a comparison with findings of drug-sensitive tuberculosis. J. Comput. Assist. Tomogr. 33, 956–960. doi: 10.1097/RCT.0b013e31819877ab
Zahirifard, S., Bakhshayesh Karam, M., Mirsaeidi, S. M., Ehsanpour, A., and Masjedi, M. R. (2003). The radiological spectrum of pulmonary multidrug-resistant tuberculosis in HIV-negative patients. Iran J. Radiol. 1, 161–166. Available online at: https://www.researchgate.net/publication/285331956_The_Radiological_Spectrum_of_Pulmonary_Multidrug-Resistant_Tuberculosis_in_HIV-Negative_Patients
Keywords: sign clusters, CT image, multidrug-resistant tuberculosis, principal component analysis, receiver operating characteristic
Citation: Song Q, Guo X, Zhang L, Yang L and Lu X (2021) New Approaches in the Classification and Prognosis of Sign Clusters on Pulmonary CT Images in Patients With Multidrug-Resistant Tuberculosis. Front. Microbiol. 12:714617. doi: 10.3389/fmicb.2021.714617
Received: 25 May 2021; Accepted: 09 September 2021;
Published: 04 October 2021.
Edited by:
Sandeep Sharma, Lovely Professional University, IndiaReviewed by:
Sinosh Skariyachan, St. Pius X College, IndiaCopyright © 2021 Song, Guo, Zhang, Yang and Lu. This is an open-access article distributed under the terms of the Creative Commons Attribution License (CC BY). The use, distribution or reproduction in other forums is permitted, provided the original author(s) and the copyright owner(s) are credited and that the original publication in this journal is cited, in accordance with accepted academic practice. No use, distribution or reproduction is permitted which does not comply with these terms.
*Correspondence: Qisheng Song, c3FzY29ucXVlckAxMjYuY29t; Xiwei Lu, dGJfbHV4aXdlaUAxMjYuY29t
Disclaimer: All claims expressed in this article are solely those of the authors and do not necessarily represent those of their affiliated organizations, or those of the publisher, the editors and the reviewers. Any product that may be evaluated in this article or claim that may be made by its manufacturer is not guaranteed or endorsed by the publisher.
Research integrity at Frontiers
Learn more about the work of our research integrity team to safeguard the quality of each article we publish.