 Henk J. van Lingen
 James G. Fadel1
 David R. Yáñez-Ruiz
 Ermias Kebreab
94% of researchers rate our articles as excellent or good
Learn more about the work of our research integrity team to safeguard the quality of each article we publish.
Find out more
ORIGINAL RESEARCH article
Front. Microbiol., 27 July 2021
Sec. Systems Microbiology
Volume 12 - 2021 | https://doi.org/10.3389/fmicb.2021.705613
3-Nitrooxypropanol (3-NOP) supplementation to cattle diets mitigates enteric CH4 emissions and may also be economically beneficial at farm level. However, the wider rumen metabolic response to methanogenic inhibition by 3-NOP and the intermediary metabolite requires further exploration. Furthermore, supplementation potently decreases CH4 emissions from cattle. The reduction of utilizes H2 and yields , the latter of which may also inhibit rumen methanogens, although a different mode of action than for 3-NOP and its derivative was hypothesized. Our objective was to explore potential responses of the fermentative and methanogenic metabolism in the rumen to 3-NOP, and their metabolic derivatives using a dynamic mechanistic modeling approach. An extant mechanistic rumen fermentation model with state variables for carbohydrate substrates, bacteria and protozoa, gaseous and dissolved fermentation end products and methanogens was extended with a state variable of either 3-NOP or . Both new models were further extended with a state variable, with exerting methanogenic inhibition, although the modes of action of 3-NOP-derived and -derived are different. Feed composition and intake rate (twice daily feeding regime), and supplement inclusion were used as model inputs. Model parameters were estimated to experimental data collected from the literature. The extended 3-NOP and models both predicted a marked peak in H2 emission shortly after feeding, the magnitude of which increased with higher doses of supplement inclusion. The H2 emission rate appeared positively related to decreased acetate proportions and increased propionate and butyrate proportions. A decreased CH4 emission rate was associated with 3-NOP and supplementation. Omission of the state variable from the 3-NOP model did not change the overall dynamics of H2 and CH4 emission and other metabolites. However, omitting the state variable from the model did substantially change the dynamics of H2 and CH4 emissions indicated by a decrease in both H2 and CH4 emission after feeding. Simulations do not point to a strong relationship between methanogenic inhibition and the rate of and formation upon 3-NOP supplementation, whereas the metabolic response to supplementation may largely depend on methanogenic inhibition by .
Animal agriculture emits about 7.1 gigatonnes of CO2 equivalents of greenhouse gases per year, which represents approximately 14.5% of total global anthropogenic greenhouse gas emissions in 2005 (Gerber et al., 2013). Dairy and beef cattle emitted 4.6 gigatonnes CO2 equivalents, of which CH4 from enteric fermentation contributed about 45%. To decrease the latter enteric source of greenhouse gas emission, various dietary supplements with a potential inhibiting effect on ruminal methanogenesis have been tested. 3-nitrooxypropanol (3-NOP) is one of the most effective dietary supplements that was tested for cattle (e.g., Hristov et al., 2015), and may also be economically beneficial (Alvarez-Hess et al., 2019). The mode of action of 3-NOP was elucidated to be the inhibition of methyl co-enzyme-M reductase (MCR), with clear indications that can be metabolized from 3-NOP and inhibit methanogenesis by blocking MCR activity as well (Duin et al., 2016). However, the wider effects of 3-NOP and on methanogenic archaea in the rumen and the implications for the dynamics of ruminal metabolites require a more thorough exploration.
Nitrate is another dietary supplement (commonly in the form of a calcium salt, sometimes a sodium or potassium salt) that has been observed to decrease enteric CH4 from cattle substantially and persistently (Van Zijderveld et al., 2011), although there seem no on-farm economical benefits (Alvarez-Hess et al., 2019). Nitrate is primarily reduced to NH3 by ruminal bacteria, which may result in the utilization of four equivalents of H2 per equivalent of . This reduction reaction causes less H2 available for CH4 production by the methanogens. However, supplementation to dairy cattle diets was reported to increase H2 emissions (Olijhoek et al., 2016). The latter increase was explained by being reduced to , with inhibiting the methanogenic metabolism (Latham et al., 2016). Therefore, the presence of as an intermediate in the reduction of to NH3 may contribute to the CH4 suppressing effect of supplementation to cattle diets as well.
Various ruminal bacteria possess and express genes that result in the employment of periplasmic and reductases (Kern and Simon, 2009; Yang et al., 2016). The methanogens that reside in the rumen, however, were not observed to transcribe genes that encode for and reductases (Greening et al., 2019). Lack of these reductases may suggest that the conversion of 3-NOP into inside methanogenic cells proceeds spontaneously or is catalyzed by different enzymes, which aligns with the formation of and upon the inactivation of the MCR enzyme (Duin et al., 2016). Although 3-NOP is transported across the methanogenic cell membrane, no evidence for transportation across the methanogenic cell membrane is known to the authors. If is transported across the methanogenic cell membrane, the derived from may even inhibit CH4 production completely by blocking MCR at the commonly used dietary inclusion rates of , which is not commonly observed. On a molar basis, the relatively low inclusion rates of 3-NOP compared to will likely result in lower production. Therefore, the mechanisms by which derived from and 3-NOP act on archaea appear different, with 3-NOP derived exerting its methanogenic inhibition inside the cell and derived potentially exerting methanogenic inhibition outside the cell.
Besides metabolic conversions and their enzyme kinetic implications, several studies suggested the inhibiting effect of 3-NOP and on ruminal methanogenesis to be partly thermodynamically controlled (Van Zijderveld et al., 2011; Dijkstra et al., 2018). Both 3-NOP and were found to increase H2 emission, suggesting thermodynamic inhibition of NADH oxidation in fermentative microbes in the rumen (Van Lingen et al., 2016). This thermodynamic inhibition results in a shift from acetate to more propionate production, which decreases the yield of H2 and next the yield of CH4. The objective of this study is to explore putative mechanisms of methanogenic inhibition by 3-NOP and and their implications for the dynamics of microbial fermentation in the bovine rumen using dynamic mechanistic modeling approaches. For this objective, an existing dynamic mechanistic model of microbial substrate degradation that incorporated various metabolic pathways (Van Lingen et al., 2019) is extended with putative kinetic downregulation mechanisms of methanogenesis by 3-NOP, and their derivatives. These newly developed modeling approaches also enable the evaluation of the thermodynamic control of H2 partial pressure (pH2) on volatile fatty acid (VFA) fermentation pathways via the NAD+ to NADH ratio in fermentative microbes upon the supplementation of feed with 3-NOP and .
An extant dynamic mechanistic rumen fermentation model with state variables for ruminal carbohydrate substrates, bacteria and protozoa, gaseous and dissolved fermentation end products and methanogens (Van Lingen et al., 2019) was extended with a representation of either the 3-NOP or metabolism. The extant model represents the hydrolysis of carbohydrate polymers (viz., degradable fiber, degradable starch and sugars) into hexose, the thermodynamic control of pH2 on volatile fatty acid (VFA) fermentation pathways via the NAD+ to NADH ratio in fermentative microbes, and hydrogenotrophic methanogenesis in the bovine rumen. Four different extensions of the original model were made. These model extensions comprised a representation of 3-NOP and and with and without , which is derived from both 3-NOP and , respectively. The four extended models are diagrammatically represented in Figures 1, 2, while a schematic overview of physiological characteristics incorporated per model is provided in Table 1A. Mathematical notation of influxes and outfluxes of model state variables is Pi;j, m and Ui;j, m;n, respectively, where the subscript represents the uptake or production of i by j-to-m transaction (generating n). To illustrate this, P3NOP;In, 3NOP represents the increase in 3-NOP as a result of the inflow of 3-NOP. Concentrations of i are computed as:
for and VFl being the rumen fluid volume. State variables are expressed in [g] or [mol], with the corresponding fluxes and concentrations expressed in [mol·h−1] or [g·h−1], and [mol·L−1] or [g·L−1], respectively. Abbreviations and general notation are available in Table 2. Parameters specific for the new models are provided in Table 3.
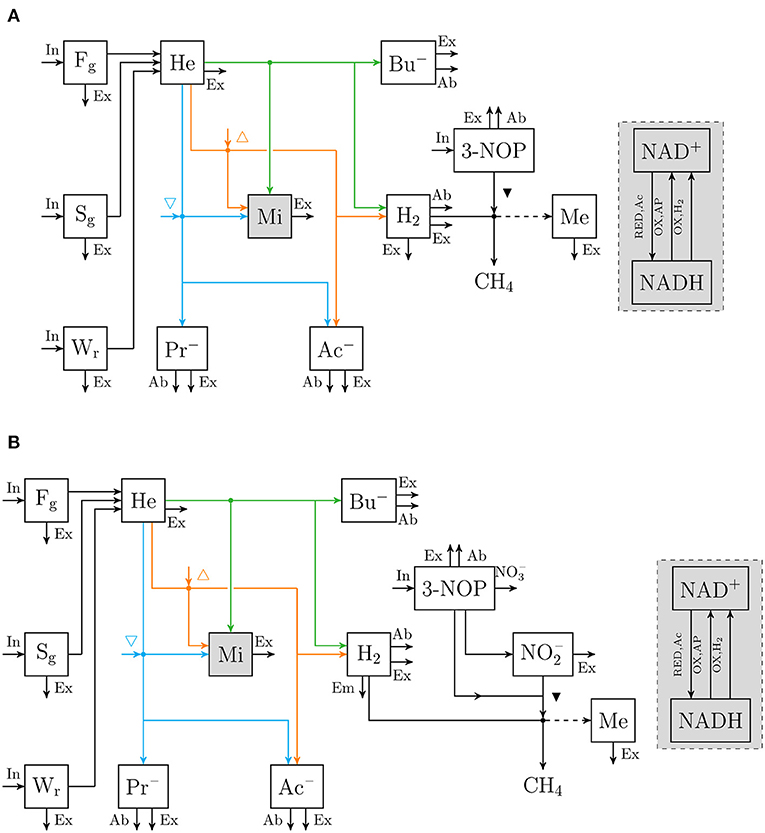
Figure 1. Flow chart that conceptually represent (A) the rumen 3-nitrooxypropanol simple model, and (B) the rumen 3-nitrooxypropanol+nitrite model. Boxes enclosed by solid lines represent state variables (with Fg for degradable fiber [g], Sg for degradable starch [g], Wr for soluble carbohydrates [g], He for hexose [mol], Mi for fermentative microbes [g], Ac− for acetate [mol], Pr− for propionate [mol], Bu− for butyrate [mol], H2 for hydrogen [mol], 3-NOP for 3-nitrooxypropanol [mol], for nitrite [mol], Me for methanogens [g]. The sum of NAD+ and NADH [mol] is a fraction of Mi and a gray fill is used to visualize this), arrows represent fluxes with the dashed arrow indicating H2 is not incorporated but its conversion to CH4 is required for growth (with In for dietary input, Ex for fractional exit from the rumen to the lower tract, Ab fractional absorption, Em for fractional emission, for nitrate production, RED, Ac for NAD+ reduction associated with hexose converted into 2 Ac, {OX,AP} for NADH oxidation associated with hexose converted into Ac− + Pr−, and {OX,H2} for hydrogenase catalyzed NADH oxidation; △ and ▽ indicate that at increased NAD+ to NADH ratio the microbial conversion is promoted and inhibited, respectively; ▾ indicates inhibition of methanogenesis; fluxes may be unique per state variable and are further specified in Van Lingen et al. (2019), dots indicate microbial conversions.
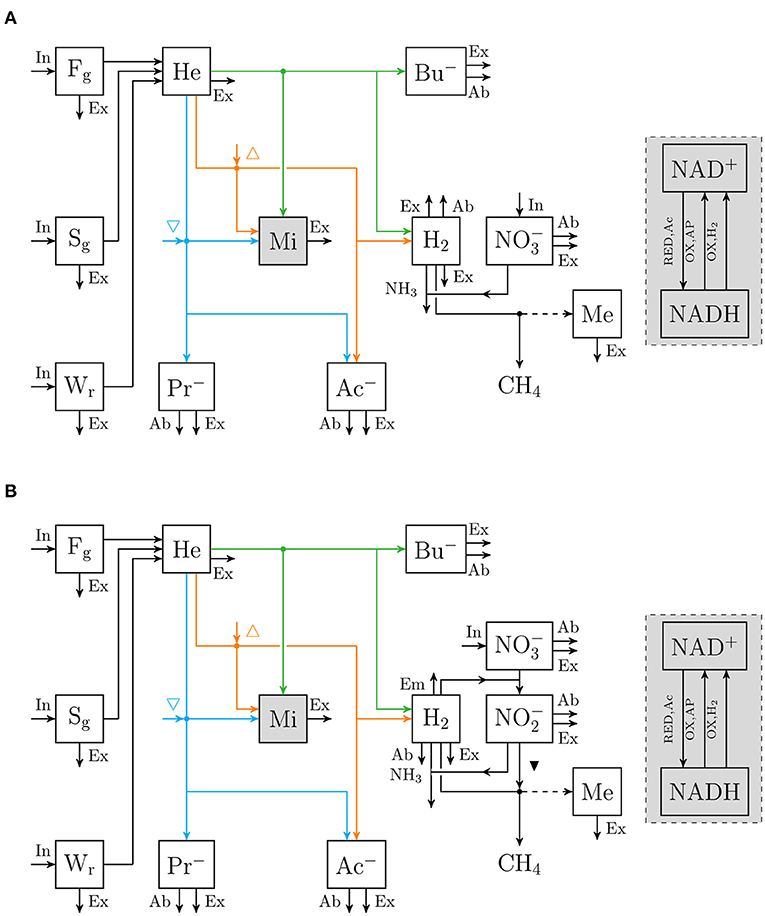
Figure 2. Flow chart that conceptually represent (A) the rumen nitrate simple model, and (B) the rumen nitrate+nitrite model. Boxes enclosed by solid lines represent state variables (with for nitrate [mol] and for nitrite [mol]; ▾ indicates inhibition of methanogenesis; other abbreviations are described in Figure 1), dots indicate microbial conversions.
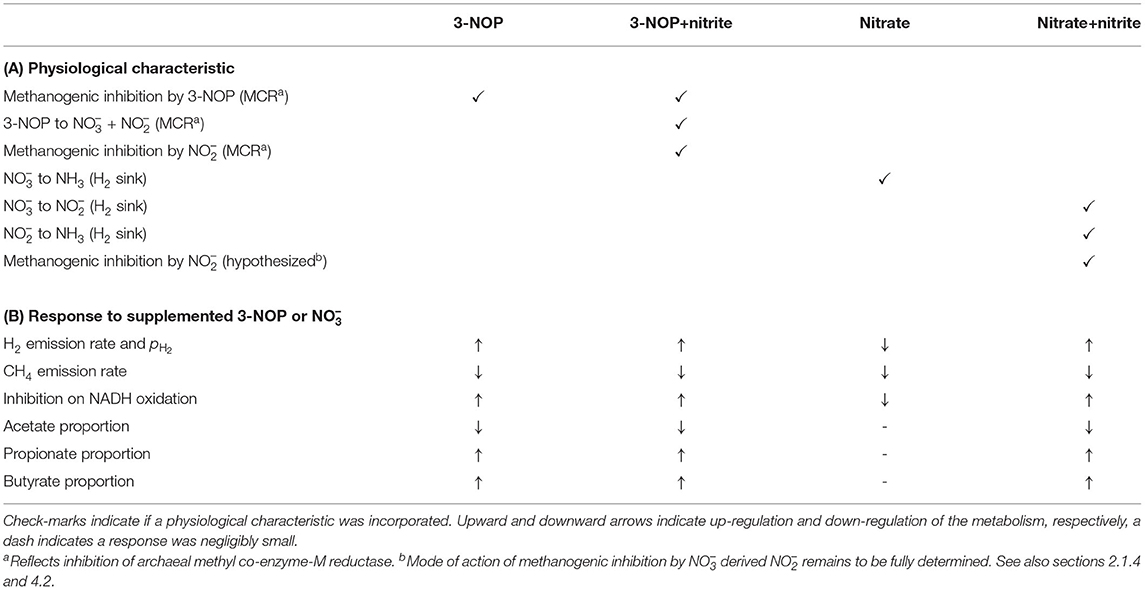
Table 1. Overview of (A) physiological characteristics regarding methanogenic inhibition and H2 sinks incorporated in 3-NOP, 3-NOP+nitrite, nitrate and nitrate+nitrite models, along with (B) the physiological response of various output variables to dietary inclusion of 3-NOP or .
Table 2. Abbreviations used in mathematical expressions in the model.
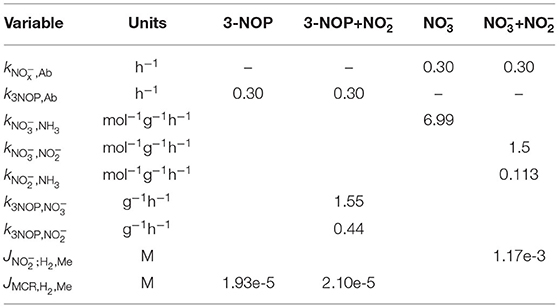
Table 3. Preliminary parameter values used in the 3-NOP, 3-NOP+, , and + models.
3-nitrooxypropanol state variable, Q3NOP [mol]. The Q3NOP state variable receives input from 3-NOP contents in the feed that was supplemented:
with DDM(t) the dry matter intake rate in time [kg·h−1] and c3NOP the 3-NOP content of the feed [mol·kg−1]. 3-NOP can easily diffuse through membranes (Duin et al., 2016) and was assumed to be absorbed across the rumen wall:
with k3NOP,Ab the fractional absorption rate of 3-NOP (value and units in Table 3). Finally 3-NOP was assumed to flow out to the lower tract with the fluid fraction, which was represented as:
with kFl,Ex the fractional outflow rate of the fluid fraction [h−1] as in Van Lingen et al. (2019). The differential equation of the Q3NOP state variable is given by:
Hydrogen state variable, QH2 [mol]. As described by Van Lingen et al. (2019), inputs to the QH2 state variable are H2 influxes associated with acetate and butyrate production (PH2; He, Ac and PH2; He, Bu), whereas outputs that are copied to the present model are emission, outflow with rumen fluid and absorption of H2 (UH2; H2, Em, UH2; H2, Ex, and UH2; H2, Ab, respectively). In the present model, the outflux that represents H2 utilization for 3-NOP inhibited methanogenic growth is given by:
where vH2, CH4 denotes the maximum utilization rate of H2 by archaea [mol·g−1h−1; from Van Lingen et al. (2019)], QMe the methanogen state variable, MH2; H2, CH4 the saturation constant for H2 utilization for methangenesis [M; from Van Lingen et al. (2019)], CH2 the dissolved H2 concentration, C3NOP the 3-NOP concentration and JMCR;H2, CH4 the inhibition constant of 3-NOP associated with hydrogenotrophic methanogenesis (Table 3). The differential equation is given by:
According to Duin et al. (2016), 3-NOP is broken down to and along with the formation of 1,3-propanediol. These conversions may take place in the archaeal cytosol that contribute to the presence that also inhibits MCR. For evaluating the implications of these metabolic steps, an extended 3-NOP model was developed that also comprised a state variable.
3-nitrooxypropanol state variable, Q3NOP [mol]. In addition to the inputs and outputs described for the simple 3-NOP model, the conversion of 3-NOP into and is described as output from the Q3NOP state variable in the present model by:
and
swith and the fractional rate constants for the conversion of 3-NOP reduction to and (Table 3) and the reduction flow rate is assumed to be also dependent on the methanogenic biomass. It was assumed that and is not transported across the methanogenic cell membrane and no other outputs were represented. This resulted in the differential equation of the Q3NOP state variable in the 3-NOP extended model given by:
Nitrite state variable, [mol]. Input to the state variable was production from 3-NOP reduction:
and outflow from the rumen to the lower tract is with the methanogens as in Van Lingen et al. (2019):
with kSo,Ex the fractional outflow rate of the solid material as in Van Lingen et al. (2019). The differential equation is given by:
Hydrogen state variable, QH2 [mol]. Compared with the 3-NOP simple model, the outflux that represents H2 utilization for methanogenesis in the 3-NOP+nitrite model also accounts for inhibition of methanogenic growth by , which is given by:
where JMCR;H2, CH4 denotes the inhibition constant with respect to the aggregated concentrations of 3-NOP and (Table 3). The differential equation for the 3-NOP+ extended model is given by:
The key mechanism for the decrease in CH4 production after supplementing is generally considered the utilization of H2 (Yang et al., 2016). The model was extended with only a state variable for evaluating the significance of this mechanism.
Nitrate state variable, [mol]. The state variable receives input from contents in the feed that was supplemented:
with the content of the feed [mol·kg−1]. Output comprised the reduction of to NH3 in the periplasm of fermentative microbes (Kern and Simon, 2009):
with the rate constant for reduction to NH3 (Table 3). The absorption of across the rumen wall was represented as:
with the fractional absorption rate for absorption (Table 3). was assumed to flow out with the fluid fraction from the rumen to the lower tract:
The differential equation is given by:
Hydrogen state variable, QH2 [mol]. Influxes and outfluxes that were taken from Van Lingen et al. (2019) were the same as for the 3-NOP model. In the model, output represented H2 utilization for reduction to NH3 while applying a 4:1 stoichiometric ratio:
The flux that represented H2 utilization for methanogenic growth was copied from the Van Lingen et al. (2019) model:
The differential equation is given by:
For evaluating the significance of the intermediary metabolite on the metabolism, an extended model was developed for which a state variable was also included.
Nitrate state variable, [mol]. The of the state variable in the simple model was broken up in two parts in the extended model. The first part resulted in output that comprised the reduction of to in the periplasm of fermentative microbes (Kern and Simon, 2009):
with the rate constant for reduction to by fermentative microbes (Table 3). Inflow, absorption across the rumen wall and outflow to the lower gastrointestinal tract were represented identical to the nitrate simple model, which resulted in a differential equation given by:
Nitrite state variable, [mol]. Input to the state variable was production from reduction:
whereas output from this state variable comprised absorption of across the rumen wall:
with the fractional absorption rate for , which was also used for absorption. The outflow of was with the fluid fraction from the rumen to the lower tract:
and the reduction of to NH3:
where denotes the rate constant for reduction to NH3 by fermentative microbes (Table 3). The differential equation is given by:
Hydrogen state variable, QH2 [mol]. Influxes and outfluxes that were taken from Van Lingen et al. (2019) were the same as for the 3-NOP models and the reduced model. In the full model, output represented H2 utilization for reduction to while applying a 1:1 stoichiometric ratio:
and H2 utilization for reduction to NH3 while applying a 3:1 stoichiometric ratio:
Rumen methanogens without cytochromes were suggested to be inhibited by (Latham et al., 2016) at their electron-carrier system (Yang et al., 2016). Therefore, the flux that represented H2 utilization for methanogenic growth that was incorporated accounted for inhibition by :
where denotes the H2 concentration, the inhibition constant for of the H2 uptake rate for methanogenesis (Table 3). The differential equation is given by:
Inputs to the model were intake rate (shown in Figures 1, 2) and nutrient composition of DM (Table 4). These inputs were taken from Van Zijderveld et al. (2011), Veneman et al. (2015), and Olijhoek et al. (2016) for the models, whereas the inputs were taken from Haisan et al. (2014), Hristov et al. (2015), Lopes et al. (2016), Haisan et al. (2017), and Van Wesemael et al. (2019) for the 3-NOP models. Every simulation was based on a dietary treatment with the inclusion rates of 3-NOP and that was supplemented. If the feed intake rate in time was not reported, feed intake rates were scaled to Olijhoek et al. (2016) for ad libitum feeding and scaled to Van Lingen et al. (2017) for restricted feeding. This scaling was done based on the fraction of daily feed intake consumed per hour of a day. The dietary nutrient contents and kFgHe and kSgHe for the different studies were set per dietary treatment and taken in accordance with Bannink et al. (2010) and CVB (2018). Non-identified fractions that may include pectin and fructan were assigned to Fg, Sg, and Wr as in Van Lingen et al. (2019). An overview of all nutrient contents and degradation characteristics is given in Table 4. For evaluating the biological significance of 3-NOP and on the rumen microbial metabolism, the 3-NOP models were run for supplement inclusion rates of 0, 0.5, and 1.0 mmol·(kg DMI)−1, whereas the models were run for inclusion rates of 0, 0.16, and 0.32 mol·(kg DMI)−1. Dry matter intake rate and composition input data were from Van Lingen et al. (2017) on which various parameters of the extant model were fitted previously.
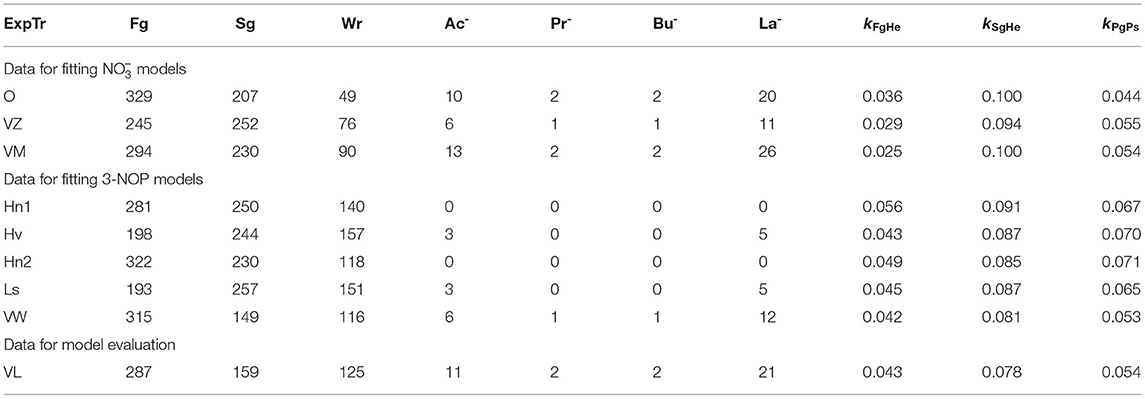
Table 4. Degradable fiber (Fg), degradable starch (Sg), degradable protein (Pg) soluble sugars (Wr), acetate (Ac−), propionate (Pr−), butyrate (Bu−), and lactate (La−) feed contents [g·kg−1], and fractional hydrolysis rates [h−1] of degradable fiber and degradable starch per experiment and/or treatment assigned (ExpTr) for 3-NOP and model fitting data from Olijhoek et al. (2016, O), Van Zijderveld et al. (2011, VZ), Veneman et al. (2015, VM), Haisan et al. (2014, Hn1), Hristov et al. (2015, Hv), Haisan et al. (2017, Hn2), Lopes et al. (2016, Ls) and Van Wesemael et al. (2019, VW), and model evaluation data from Van Lingen et al. (2017, VL, average across all treatments and cows).
The differential equations of all state variables were numerically integrated for a given set of initial conditions and parameter values. The equations were solved using the lsoda numerical integration method (Petzold, 1983), a robust implicit integrator for stiff and non-stiff systems. This numerical integrator changes step size automatically to minimize computation time while maintaining calculation accuracy. The DM intake profile caused dramatic changes in QH2 shortly after feeding, which is why integration steps sizes were 2.5×10⁻³ h during the first 0.5 h and 10−2 h during the remaining hours of every consecutive 12 h period. Based on the absorption rate of and that was discussed to be slowly (Nolan et al., 2016), the parameter was assigned a value of 0.30 h−1, which is slightly lower than used for NH3 and VFA absorption in the Dijkstra et al. (1996) model. Given the lack of data on 3-NOP absorption, the same value was used for the k3NOP,Ab parameter. Simulations based on the aforementioned collection of literature data were used for estimating the JMCR;H2, Me and parameters of both 3-NOP models and the model to average daily CH4 emission output. The and parameters of the + model were estimated to the diurnal H2 and CH4 emission rates that were extracted from the graphs presented in Van Zijderveld et al. (2011), Veneman et al. (2015) and Olijhoek et al. (2016). Including the , , and in the parameter estimation procedure resulted in limited identifiability and these three parameters were assigned values more arbitrarily, but such that concentrations in the 3-NOP+nitrite and nitrate+nitrate models approached the order of magnitude of the 3-NOP and concentrations, respectively.
To avoid numerical dispersion during the parameter estimation procedure and to correct for the model inaccuracy, the model was run using control treatment input (i.e., no supplementation of 3-NOP and ) for every study, after which the observed CH4 emission data for all dietary treatments for which a certain dose of 3-NOP and was administered were multiplied by the ratio of the observed and predicted values. A 240 h run of the model was considered to have converged to quasi steady-state. Model output of the final 24 h vs. the experimental data were calculated to assess the model performance given the model parameter values. The parameters were optimized to minimize the sum of squared residuals values using the BFGS algorithm (Conn et al., 1991).
The sensitivity of the CH4 emission rate to the parameters directly related to the inhibition was evaluated using a global sensitivity analysis. For this evaluation, the JMCR;H2, CH4, , , , , , , and k3NOP,Ab parameters of the 3-NOP+ and + models drawn from 0.75 to 1.25 times their optimum value using Latin hypercube sampling and a sample size of 1.000. The sensitivity of CH4 production was evaluated using the highest inclusion rates of 3-NOP and and the Van Lingen et al. (2017) feed input. Correlation coefficients were calculated to quantify the sensitivity of the CH4 emission rate to the parameter values at 0, 0.5, 1, 2, 4, 6, and 10 h from the last meal of a 240 h simulation. All analyses were performed using the base (R Core Team, 2020) and FME packages (Soetaert and Petzoldt, 2010) in R statistical software.
Parameter estimates of the optimized parameters of the four different models are provided in Table 3. In response to the assumed feed intake rate and all other parameters that were adopted from Van Lingen et al. (2019), all reference simulations in Figures 3–6, i.e., zero inclusion of 3-NOP and , are identical to the simulations shown in this study by definition. The present 3-NOP model predicts a 3-NOP concentration up to about 0.055 mM at 1.5 h from in silico feeding for the highest inclusion rate (Figure 3). Predicted 3-NOP concentrations then steadily approached zero at 12 h at which the next portion of feed was delivered. The diurnal dynamics of the total VFA concentration appeared largely unaffected by the inclusion of 3-NOP, whereas pH2 clearly increased in response to 3-NOP inclusion, with a peak of 0.3 atm at about 1 h from feeding for the 1.0 mmol·kg−1 inclusion rate. The emission rate of H2 followed a similar dynamic pattern as pH2 (result not shown). In contrast to the increased peak in pH2, the CH4 emission rate in response to 3-NOP decreased almost immediately after feeding and then increased to the reference emission rate, while C3NOP approached zero. Increased pH2 exerted increased thermodynamic inhibition of NADH oxidation, as indicated by the decreased minima of the thermodynamic potential factor (FT; a dimensionless factor that corrects a predicted kinetic reaction rate for the thermodynamic control exerted; FT = 1 indicates no thermodynamic inhibition; FT = 0 indicates equilibrium between forward and reverse reaction or, in other words, complete inhibition of the chemical reaction) and the prolonged decrease of rNAD. It should be noted that for both non-zero inclusion rates of 3-NOP, rNAD starts reconditioning toward basal level at about 3 and 5 h from feeding when FT is equal to zero (FT = 0 indicates neither the forward nor the reverse reaction of NADH oxidation are thermodynamically feasible). The decrease in rNAD after feeding was prolonged by 3-NOP supplementation that also resulted in decreased acetate, increase propionate and increased butyrate proportions that were prolonged. Extending the 3-NOP model to the 3-NOP+nitrite model had negligible effect on the dynamics of total VFA concentration (result not shown), whereas non-zero basal and peaks of 0.2 and 0.5 μM at 3.25 and 2.75 h from feeding appeared for the two inclusion rates, respectively (Figure 4). Other dynamics predicted by the 3-NOP+nitrite model appeared similar to the 3-NOP model.
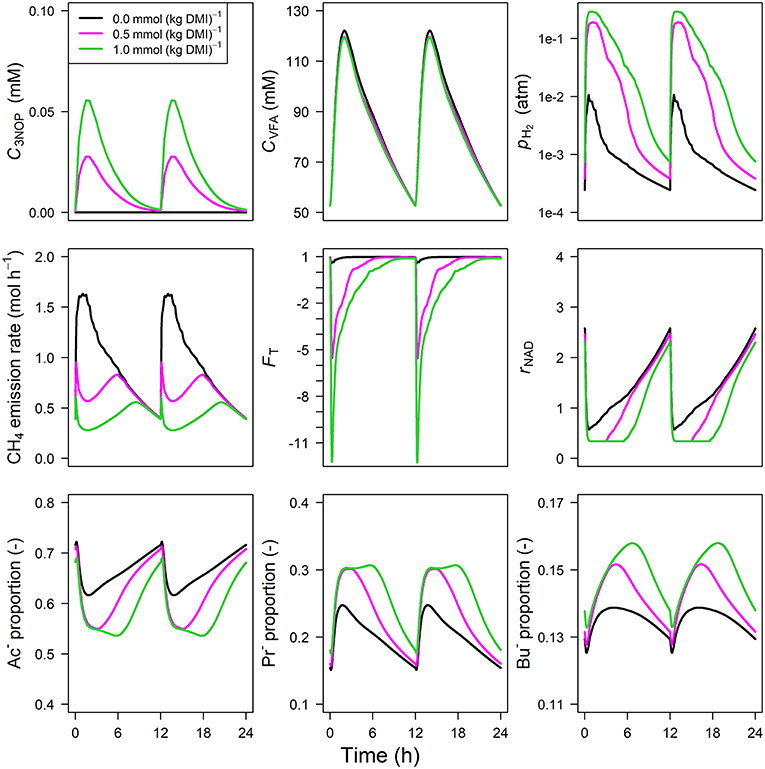
Figure 3. Solutions of the 3-NOP dynamic model without representation [mM], VFA concentration [mM], rumen headspace pH2 [atm], CH4 emission rates [mol·h−1], thermodynamic potential factor (FT; [–]), NAD+ to NADH ratio (rNAD), acetate proportion (Ac−), propionate proportion (Pr−), and butyrate proportion (Bu−).
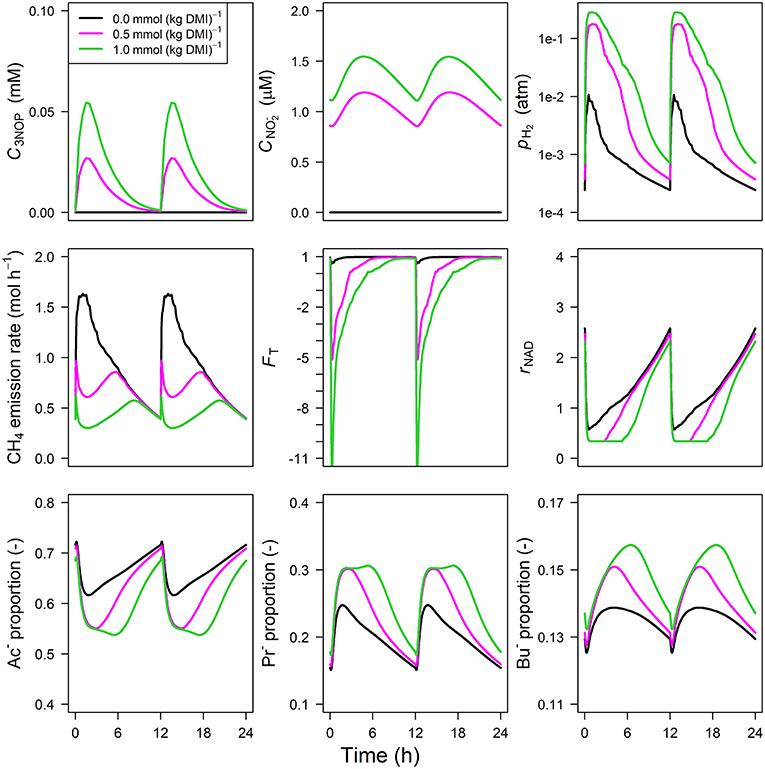
Figure 4. Solutions of the 3-NOP dynamic model with representation for 3-NOP concentration [mM], concentration [μM], rumen headspace pH2 [atm], CH4 emission rates [mol·h−1], thermodynamic potential factor (FT; [–]), NAD+ to NADH ratio (rNAD), acetate proportion (Ac−), propionate proportion (Pr−), and butyrate proportion (Bu−).
The concentration of predicted by the model showed an increase from 0 to 1.75 and 5.75 mM in 0.5 h for inclusion rates of 0.16 and 0.32 mol·kg−1 DMI, respectively, and then steadily approached zero at 12 h at which the next portion of feed was delivered (Figure 5). Peak pH2 was clearly decreased and delayed in response to inclusion with a pH2 value of 2.4×10⁻³ atm at 3.1 h from feeding for the 0.32 mol·kg−1 inclusion rate vs. 1 × 10⁻² atm at 0.5 h for zero inclusion. A qualitatively similar decrease was simulated for the emission rate of H2 (result not shown). In line with this decrease in H2, the CH4 emission rate was decreased compared to the reference simulation as well. Decreased pH2 alleviated the thermodynamic inhibition of NADH oxidation, as indicated by FT approaching one throughout almost the entire 24 h simulation period for the highest inclusion rate. The rNAD and the proportions of acetate, propionate and butyrate were negligibly affected by the inclusion of , as was the total VFA concentration. Extending the nitrate model to the nitrate+nitrite model negligibly affected the dynamics of total VFA concentration (result not shown), whereas the diurnal pattern qualitatively followed the diurnal pattern (Figure 6). In contrast to the nitrate model, the nitrate+nitrite model predicted an increase in pH2 with a peak of ~2.5×10⁻² atm from 1 to 2 h from feeding in response to inclusion in the diet, whereas a relatively similar decrease in CH4 emission rate was simulated. In line with the increase in pH2, rNAD and the proportions of acetate, propionate and butyrate decreased, decreased, increased and increased, respectively. When zooming in on the highest inclusion rate of using the nitrate+nitrite model, 2% passes out from the rumen after reduction to , 3% is absorbed after reduction to , 13% passes out from the rumen to the lower gastrointestinal tract, 32% is absorbed, and 51% undergoes complete reduction to NH3. These percentages indicate that 51% + 0.25 × (3%+2%) = 52% of the potential of as a H2 sink is utilized, where 0.25 relates to one of the four H2 equivalents for complete reduction of are consumed by fermentative microbes. Lastly, a qualitative overview of the output of the four different models in response to 3-NOP and supplementation is provided in Table 1B.
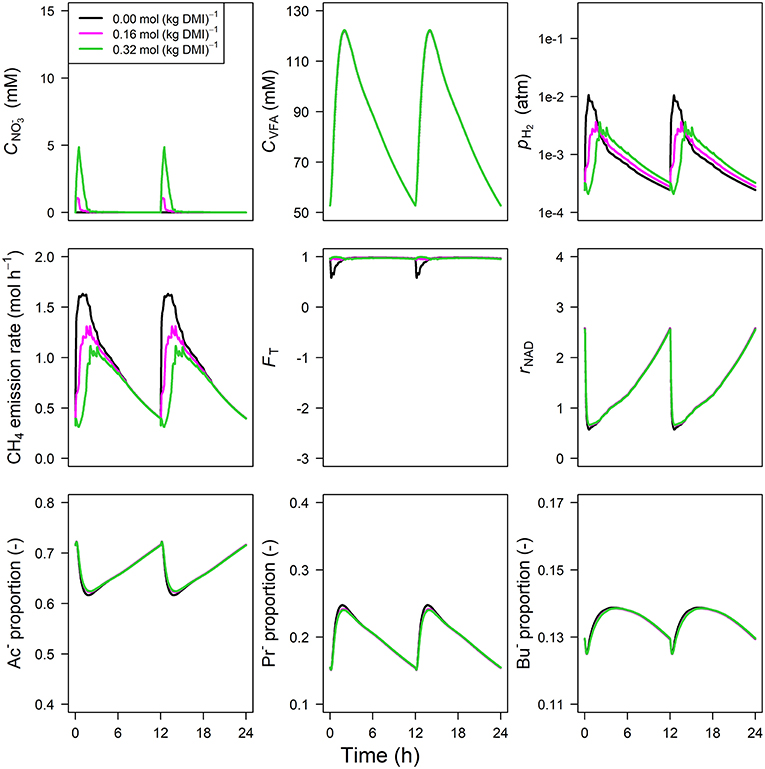
Figure 5. Solutions of the dynamic model without representation for concentration [mM], VFA concentration [mM], rumen headspace pH2 [atm], CH4 emission rates [mol·h−1], thermodynamic potential factor (FT; [–]), NAD+ to NADH ratio (rNAD), acetate proportion (Ac−), propionate proportion (Pr−), and butyrate proportion (Bu−).
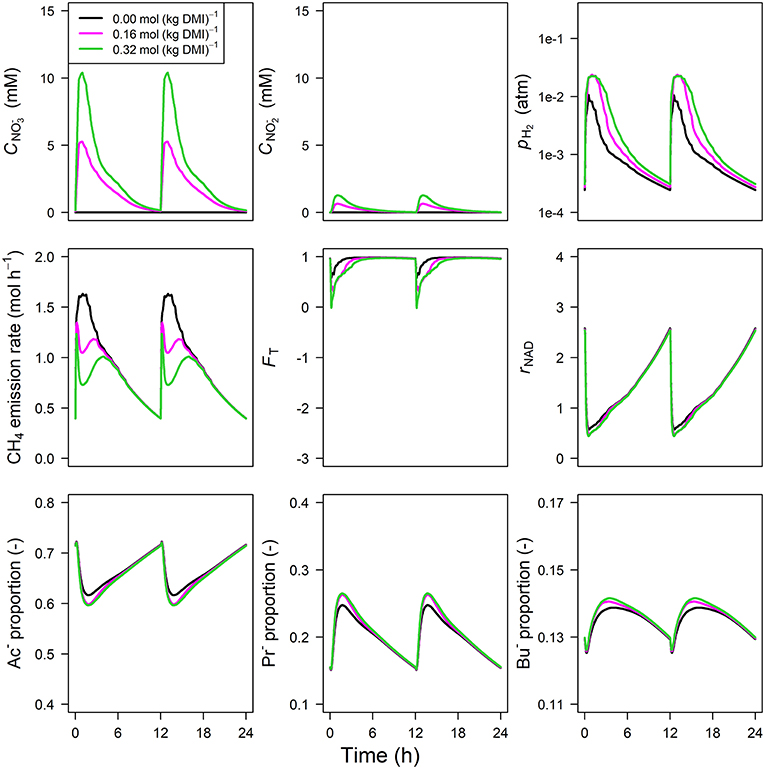
Figure 6. Solutions of the dynamic model with representation for concentration [mM], concentration [mM], rumen headspace pH2 [atm], CH4 emission rates [mol·h−1], thermodynamic potential factor (FT; [–]), NAD+ to NADH ratio (rNAD), acetate proportion (Ac−), propionate proportion (Pr−), and butyrate proportion (Bu−).
The JMCR;H2, Me inhibition parameter showed the strongest positive correlation with the CH4 emission rate (r= 0.6 to 0.90) by the 3-NOP+nitrite model for the different time points for which the global sensitivity analysis was performed (Figure 7). The k3NOP,Ab parameter related to 3-NOP reduction also showed positive correlations, although the magnitude of the correlations was slightly stronger for the JMCR;H2, Me parameter. The absorption parameter was negligibly correlated to CH4 emission rate at any of the time points. Correlations between the parameter and CH4 emission rate were also very minor, |r| ≤ 0.10, but were consistently negative. For the nitrate+nitrite model, the inhibition parameter showed correlations of 0.61 to 0.97 from 0.5 to 6 h and correlations of approximately 0.5 at 0.0 and 10 h, whereas the parameter related to reduction showed the correlations from roughly 0.22 to 0.76 at the various time points. The parameter related to reduction showed very weakly negative correlations varying from −0.02 to −0.13. The parameter related to absorption of and had the highest correlations of 0.78 and 0.57 at basal level, that is at 0 and 10 h, respectively, with the correlations at the other times points varying from 0.09 to 0.28.
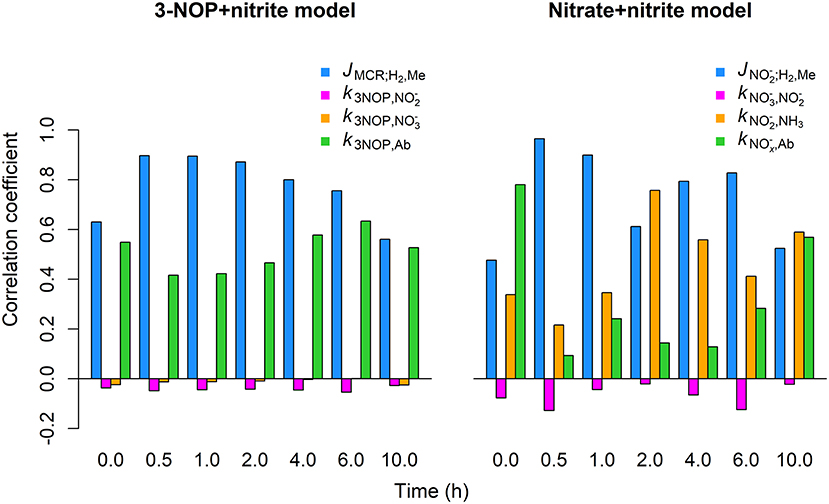
Figure 7. Correlation between CH4 emission rate and parameter values obtained from global sensitivity analysis for the 3-NOP+nitrite and nitrate+nitrite model when using inclusion rates of 1.0 mmol·kg−1 for 3-NOP and 0.32 mol·kg−1 for nitrate and the Van Lingen et al. (2017) feed input. Parameters values were drawn from the interval of 0.75 to 1.25 times their optimum value (see Table 3) using latin hypercube sampling and a sample size of 1,000. Correlation coefficents were calculated at 0, 0.5, 1, 2, 4, 6, and 10 h from the last meal of a 240 h simulation.
The present paper presents models for simulating the dynamics of rumen metabolic physiology after supplementing two effective inhibitors of enteric CH4 emissions from cattle, viz. 3-NOP and . It should be noted that 3-NOP is also economically profitable at farm level, whereas this could not be clearly indicated for (Alvarez-Hess et al., 2019). Furthermore, supplementation may increase the concentration of the intermediate to levels that are poisonous to the animal. To the authors' knowledge, the present study is the first effort that describes the metabolism of methanogenic inhibition in the rumen using dynamic mechanistic modeling. Presenting 3-NOP and models aids to distinguish the mode of action of decreased CH4 caused by supplementation of 3-NOP and to diets of cattle and other domestic ruminants, and explores further metabolic implications of H2 accumulation and its impact on VFA dynamics. The latter metabolic changes were most clearly indicated by the two 3-NOP models. The 3-NOP to conversion rate of the 3-NOP+nitrite model did not affect the inhibition potential of administered 3-NOP, whereas the 3-NOP to conversion rate appeared to alleviate methanogenic inhibition. The different metabolic dynamics of the two models point to the significance of the impact of as an inhibitor of methanogenic archaea, in addition to the metabolic steps that reduce to NH3 and serve as H2 sinks. The present modeling framework by which methanogenesis is inhibited by the concentration of an inhibitor (3-NOP models and nitrate+nitrite model) is possibly applicable to a wider variety of methanogenic inhibitors that are fed to various ruminant species.
Data availability is an important determinant of model parameter identifiability (e.g., Brun et al., 2001). Data used for parameter estimation of the present models comprised average daily CH4 emissions for both 3-NOP models and the nitrate model, whereas data describing diurnal dynamics of H2 and CH4 emission rates were used for the nitrate+nitrite model. It would be ideal, however, to obtain data that describes the diurnal dynamics of metabolites and also includes rumen 3-NOP, and concentrations. A dataset that comprises the concentrations of all these metabolites would increase the identifiability of the parameters, particularly of the nitrate+nitrite and 3-NOP+nitrite models for which the , , and parameters were not estimated to data. Such data would likely also increase the accuracy of the simulated diurnal profiles of the various metabolites. Despite a relatively large variation of ruminal and concentrations across published studies (e.g., Veneman et al., 2015; Wang et al., 2018), and concentrations of the same study were within the same order of magnitude for both studies. The and concentrations simulated using the nitrate+nitrite model are in the same order of magnitude as well, suggesting that our estimate has a fair degree of accuracy, given that the was highly identifiable to the diurnal profiles of H2 and CH4 emission. Although various parameters may not have the utmost accuracy, different estimates may not result in different conclusions being drawn regarding the mechanisms by which CH4 production is inhibited and the sensitivity of the CH4 emission rate to these parameters may not change and be more related to the overall developed model structures.
The 3-NOP models predicted increased and decreased emission rates of H2 and CH4 upon 3-NOP supplementation, respectively, which indicated the model behavior was in line with various responses observed in vivo (e.g., Van Gastelen et al., 2020). The present models that are extensions of the Van Lingen et al. (2019) model, which accounts for the thermodynamic control of rumen fermentation by representing a H2 pool and the inclusion of NAD+ and NADH, predict thermodynamic inhibition of NADH oxidation and next more pronounced minima and maxima in VFA proportions after feeding 3-NOP supplemented feed. These predictions align with changes in VFA proportions that were observed in vivo (e.g., Haisan et al., 2014, 2017; Romero-Perez et al., 2015; Lopes et al., 2016). The similar responses of the 3-NOP and 3-NOP+nitrite models and the weakly negative correlation between the CH4 emission rate and the parameter obtained from the global sensitivity analysis indicate that the rate of production from 3-NOP has a minor effect on the inhibition of methanogenesis.
Extension of the nitrate model with a representation reversed the pattern of pH2 and the H2 emission rate in response to supplementation. The increased H2 emission rate simulated using the nitrate+nitrite model reproduces the in vivo experiments used for model calibration (Van Zijderveld et al., 2011; Veneman et al., 2015; Olijhoek et al., 2016), and is also in line with increased dissolved H2 concentration observed in faunated and defaunated in vitro systems (Wenner et al., 2020). This increase in dissolved concentration and emission rate of H2 supports the role of as an inhibitor of methanogenesis (Iwamoto et al., 2002), which makes H2 accumulate. The positive correlations observed from the global sensitivity analysis for the CH4 emission rate with the and parameters point to the significance of the contribution of to the inhibition in CH4 emission observed upon supplementation. The positive relationship between the parameter and the CH4 emission rate suggests that the major mode of action of decreased CH4 production after supplementation is caused by inhibition rather than H2 that is consumed by the reduction of to NH3. The very weakly negative correlations obtained for could be associated with decreased CH4 emission by both H2 sink reinforcement and accumulation resulting in inhibited methanogenesis, although the effect may be negligibly small based on the low absolute correlations. If H2 sink mechanisms were the key controller of the CH4 emission rate, a negative relationship between the parameter and the CH4 emission rate should have been obtained from the global sensitivity analysis, with increased reduction of and resulting in less CH4. However, possibly in line with the low absolute correlations, Welty et al. (2019) only observed a numerical increase in dissolved H2 concentration upon supplementation to a continuous culture and no increase in H2 production. Therefore, the lack of H2 accumulation in this specific study does not point to substantial methanogenic inhibition by in continuous cultures. Moreover, another possible explanation for unaffected H2 concentration or production aligning with the present modeling study might be that their experimental conditions favored a rapid reduction of to NH3 that alleviated the methanogenic inhibition by .
In line with Duin et al. (2016), the present 3-NOP+nitrite model also represents formation. Nitrate production from 3-NOP would alleviate the methanogenic inhibition as it does not block MCR, indicating that the proportion in which and are formed from 3-NOP may determine the persistence of the methanogenic inhibition of 3-NOP supplementation to cattle diets. However, the sensitivity analysis did not indicate the formation rates of and were substantially influential for the area of the parameters space that was explored. Lack of evidence for the presence of and reductases in rumen methanogens (Greening et al., 2019) may conceptually support the fact that formation alleviates methanogenic inhibition, because may then not be reduced to . However, Duin et al. (2016) observed 0.7 mol of and 0.2 mol of per mol of MCR when titrating with 3-NOP, which then requires one or more alternative mechanisms for the production of and . 1,3-propanediol also being formed from 3-NOP may suggest the production of NO2 that is subsequently converted into and . The latter conversion has been described as a disproportionation reaction, which results in equimolar production of and (e.g., Park and Lee, 1988; Holleman and Wiberg, 2007). The production of 0.7 and 0.2 mol of and , respectively, may suggest either alternative production or utilization. If MCR deactivation by 3-NOP results in the formation of (Duin et al., 2016), MCR deactivation by may then result in the formation of NO (disproportionation also described by Park and Lee, 1988), which could explain why more than was observed. Furthermore, nitrate esters, which include 3-NOP, may hydrolyze and yield and an alkanediol (Baker and Easty, 1950, 1952). Although it is unknown if the latter hydrolysis reaction proceeds inside archaeal cells, it describes the production of and 1,3-propanediol from 3-NOP.
Nitrite at the outside or inside of archaeal cells will have consequences for the inhibition of archaeal physiology and methanogenesis. Whether or not transportation of across archaeal cell membranes takes place affects our understanding of methanogenic inhibition by derived from 3-NOP. Cabello et al. (2004) described some archaea, which are not abundant in the rumen, that possess transporters and and reductases. Therewith, these enzymes were not indicated in rumen methanogens. Furthermore, genes for nitrate and nitrite transporters were searched using the IGM/M online database (https://img.jgi.doe.gov/m/; Chen et al., 2019) using “Methanobrevibacter,” “nitrate,” “nitrite,” and “transporter” did not point to any enzyme that possibly facilitates transportation of across the archaeal cell membrane, indicating that transportation across archaeal cell membranes is unlikely to occur. Nitrite inside archaeal cells, which is formed from 3-NOP that is transported across the archaeal cell membrane, contributes to blocking MCR and enhances methanogenic inhibition (Duin et al., 2016), although this specific study did not investigate if MCR inhibition is the only way in which inhibits CH4 production. Besides MCR, membrane-associated enzyme complexes catalyze several metabolic steps of the methanogenic pathway in archaea without cytochromes (Thauer et al., 2008), which are the common methanogens in the rumen. Nitrite at the outside of archaeal cells may inhibit the membrane-associated enzyme complexes or disrupt the electron transport system of the membrane (Yang et al., 2016). In contrast to supplementation, 3-NOP supplementation results in substoichiometric ruminal concentrations of , which may indicate that the actual membrane-associated inhibition of methanogenesis is negligible based on the parameter for the model that is about two orders of magnitude greater than the JMCR;H2, Me parameter for the two 3-NOP models. Furthermore, the value of the latter parameter could be taken as an additional indication for absence of transportation across archaeal cell membranes, because the methanogenic metabolism may be completely ceased by blocking of MCR if concentrations predicted after supplementation to cattle diets occur inside archaea. To the authors' knowledge, ceased methanogenic metabolism has not been observed upon ruminal supplementation, which may rule out that is transported into archaeal cells.
Inhibited methanogenesis resulted in increased pH2 and H2 emissions from the rumen, as simulated by both 3-NOP models using different inclusion rates as well as implementing methanogenic inhibition by when transitioning from the nitrate to the nitrate+nitrite model. Increased pH2 exerted inhibition of NADH oxidation, which resulted in decreased proportions of acetate and increased proportions of propionate and butyrate (Van Lingen et al., 2016, 2019). These respective shifts in VFA proportions in response to pH2, which are also described by Janssen (2010), align with in vivo observations (Haisan et al., 2014, 2017; Lopes et al., 2016) for 3-NOP, whereas VFA proportions in response to supplementation seem less consistent in the literature. Observations were that acetate proportion was unaffected or increased, propionate proportion was unaffected, increased or decreased, and butyrate proportion was unaffected or increased across various studies (e.g., Guyader et al., 2015; Troy et al., 2015; Veneman et al., 2015; Olijhoek et al., 2016; Wang et al., 2018). This somewhat diverse picture in response to may be related to the methanogenic inhibition that is likely employed, which is adverse to the H2 sink mechanism in relation to thermodynamic inhibition of NADH oxidation and associated VFA proportions. Ruminal conditions that control the favorability of reduction may determine the occurrence of the H2 sink mechanism and the methanogenic inhibition by mechanism. A mixed culture in vitro experiment by Anderson et al. (2016) indicated a decreased acetate to propionate ratio and an increased headspace pH2 in response to increased supplementation, whereas these changes were impaired when the mixed culture was also inoculated with Denitrobacterium detoxificans, despite a more pronounced decrease of headspace CH4 partial pressure. This inoculation may have stimulated the reduction of and alleviated methanogenic inhibition and H2 accumulation, and next affected the production of the different VFA. Therefore, these observations will likely be reproduced by a nitrate model such as the present nitrate+nitrite model in which both the H2 sink mechanism and the nitrite inhibition of methanogenesis mechanism are implemented.
Thermodynamic inhibition of NADH oxidation was greatest for the highest pH2 that was simulated and changed VFA proportions the most, perhaps more than observed in vivo. Electron-bifurcating hydrogenases that are able of reoxidizing NADH oxidation (e.g., Buckel and Thauer, 2018), were found to be the primary mediators of H2 production by a metatranscriptomics analysis, but this analysis did not indicate that these hydrogenases were expressed differently in high and low CH4 emitting sheep (Greening et al., 2019). No differences between hydrogenase enzyme expressions in these two groups of sheep may not suggest that VFA proportions in ovine rumens were changed (Van Lingen et al., 2016) and also that the present modeling framework of rumen fermentation metabolism that did predict changes in VFA proportions is too simple. However, Greening et al. (2019) did not relate actual H2 emissions to enzyme expressions, nor were their samples collected from animals that were fed diets known to induce inhibition of methanogenic archaea, which point to the need for future studies that explore these relationships. Nonetheless, the latter recent study did report evidence for differences in enzyme expression associated with various alternative H2 utilizing pathways in high and low CH4 emitting sheep. Besides decreased expression of methanogenic enzymes, they reported increased expression of enzymes that mediate fumarate reduction. Fumarate reduction produces succinate, which is a precursor of propionate. Therefore, increased fumarate reduction upon elevated pH2 is expected to stimulate propionate production in the rumen, which qualitatively supports the present model predictions of increased propionate proportions upon feeding dietary substrate that induces methanogenic inhibition. Furthermore, a decrease in H2 recovered as the sum of propionate, butyrate, H2 and CH4 was observed when inhibiting methanogenesis in both batch and continuous culture (Ungerfeld, 2015), although the specific energetic benefits of methanogenic inhibition depended on the type and concentration of the inhibitor and on the in vitro system.
A more exhaustive metabolic framework of ruminal H2 dynamics may comprise more than the key mechanism by which hydrogenases produce H2 and mediate NADH oxidation. Ungerfeld (2015) speculated that H2 was incorporated in formate and microbial biomass, and perhaps taken away via reductive acetogenesis in continuous cultures. For the latter H2 utilizing pathway, the pH2 threshold may be as high as 2.5×10⁻³ atm (Poehlein et al., 2012). Administration of methanogenic inhibitors to the rumen increases the number of hours per day that this threshold is exceeded and may, therefore, stimulate reductive acetogenesis. Upon supplementating bromochloromethane as an methanogenic inhibitor to goats, a metagenomic analysis indicated that, apart from increased Prevotella and Selenomonas species that are able to produce propionate using the randomizing pathway, reductive acetogenic populations were also affected significantly suggesting that they provide minor contributions to the redirection of H2 (Denman et al., 2015). In the previously cited metatranscriptomics analysis for sheep rumens (Greening et al., 2019), reductive acetogenesis was indicated and enzyme expression was negatively correlated to CH4 yield. Therefore, the incorporation of the reductive acetogenic pathway in the present models may shed further light on the metabolic dynamics in the rumen upon supplementation of inhibitors. However, further studies are required to discover other so far unidentified H2 sinks for a better understanding of the metabolic pathways involved in H2 production and utilization (Guyader et al., 2017).
In conclusion, both 3-NOP models and the nitrate+nitrite model predicted that the H2 emission rate and pH2 increased with the inclusion rate of 3-NOP and , whereas a decreased CH4 emission rate was simulated for these supplements. Omission of the state variable from the 3-NOP model did not qualitatively change the overall dynamics of H2 and CH4 emission and other metabolites. However, omitting the state variable from the model substantially changed the dynamics of H2 and CH4 emissions indicated by a decrease in the emission rates of these two gases after feeding. Increased pH2 induced by methanogenic inhibition, after 3-NOP supplementation particularly, resulted in decreased proportions of acetate and increased proportions of propionate and butyrate, although the incorporation of alternative H2 consuming pathways may contribute to less pronounced responses in VFA proportions being predicted. The findings of this modeling study provide deeper insights into the metabolic physiology of ruminal bacteria, protozoa and archaea in response to two effective inhibitors of enteric CH4 production. These insights will contribute to a better use of antimethanogenic additives and therefore help reducing enteric CH4 production and the total ecological footprint of ruminant livestock production in the future.
R code and data files that support the model simulations of this study can be found online at the GitHub repository through: https://github.com/linge006/Modeling-inhibited-methanogenesis.
HL designed the research, performed all simulations of this study, and wrote the paper. HL, DY-R, and MK did the conceptualization. JF, EK, and MK supervised the work. EK and MK were responsible for the project administration. All authors reviewed drafts of the manuscript and approved the final version.
The research was funded by DSM Nutritional Products (Basel, Switzerland).
MK is affiliated with DSM Nutritional products, which is the funder of the present study and patented 3-NOP.
The remaining authors declare that the research was conducted in the absence of any commercial or financial relationships that could be construed as a potential conflict of interest.
All claims expressed in this article are solely those of the authors and do not necessarily represent those of their affiliated organizations, or those of the publisher, the editors and the reviewers. Any product that may be evaluated in this article, or claim that may be made by its manufacturer, is not guaranteed or endorsed by the publisher.
Dana Olijhoek and Anne Louise F. Hellwing (Aarhus University, Denmark), Caroline Plugge (Wageningen University, The Netherlands), and Tim J. Hackmann (University of California, Davis, USA) are greatly acknowledged for helpful input and discussions.
Alvarez-Hess, P. S., Little, S. M., Moate, P. J., Jacobs, J. L., Beauchemin, K. A., and Eckard, R. J. (2019). A partial life cycle assessment of the greenhouse gas mitigation potential of feeding 3-nitrooxypropanol and nitrate to cattle. Agric. Syst. 169, 14–23. doi: 10.1016/j.agsy.2018.11.008
Anderson, R. C., Ripley, L. H., Bowman, J. G. P., Callaway, T. R., Genovese, K. J., Beier, R. C., et al. (2016). Ruminal fermentation of anti-methanogenic nitrate-and nitro-containing forages in vitro. Front. Vet. Sci. 3:62. doi: 10.3389/fvets.2016.00062
Baker, J. W., and Easty, D. M. (1950). Hydrolysis of organic nitrates. Nature 166, 156–156. doi: 10.1038/166156a0
Baker, J. W., and Easty, D. M. (1952). Hydrolytic decomposition of esters of nitric acid. part I. general experimental techniques. alkaline hydrolysis and neutral solvolysis of methyl, ethyl, iso propyl, and tert.-butyl nitrates in aqueous alcohol. J. Chem. Soc. 77, 1193–1207. doi: 10.1039/jr9520001193
Bannink, A., Smits, M. C. J., Kebreab, E., Mills, J. A. N., Ellis, J. L., Klop, A., et al. (2010). Simulating the effects of grassland management and grass ensiling on methane emission from lactating cows. J. Agric. Sci. 148, 55–72. doi: 10.1017/S0021859609990499
Brun, R., Reichert, P., and Künsch, H. R. (2001). Practical identifiability analysis of large environmental simulation models. Water Resour. Res. 37, 1015–1030. doi: 10.1029/2000WR900350
Buckel, W., and Thauer, R. K. (2018). Flavin-based electron bifurcation, ferredoxin, flavodoxin, and anaerobic respiration with protons (Ech) or NAD+ (Rnf) as electron acceptors: a historical review. Front. Microbiol. 9:401. doi: 10.3389/fmicb.2018.00401
Cabello, P., Roldan, M. D., and Moreno-Vivian, C. (2004). Nitrate reduction and the nitrogen cycle in archaea. Microbiology 150, 3527–3546. doi: 10.1099/mic.0.27303-0
Chen, I.-M. A., Chu, K., Palaniappan, K., Pillay, M., Ratner, A., Huang, J., et al. (2019). IMG/M v. 5.0: an integrated data management and comparative analysis system for microbial genomes and microbiomes. Nucleic Acids Res. 47, D666–D677. doi: 10.1093/nar/gky901
Conn, A. R., Gould, N. I. M., and Toint, P. L. (1991). Convergence of quasi-Newton matrices generated by the symmetric rank one update. Math. Programm. 50, 177–195. doi: 10.1007/BF01594934
CVB (2018). “Chemische samenstellingen en nutritionele waarden van voedermiddelen,” in CVB Veevoedertabel 2018, eds J. W. Spek and M. C. Blok (The Hague: CVB Programma).
Denman, S. E., Martinez Fernandez, G., Shinkai, T., Mitsumori, M., and McSweeney, C. S. (2015). Metagenomic analysis of the rumen microbial community following inhibition of methane formation by a halogenated methane analog. Front. Microbiol. 6:1087. doi: 10.3389/fmicb.2015.01087
Dijkstra, J., Bannink, A., France, J., Kebreab, E., and van Gastelen, S. (2018). Antimethanogenic effects of 3-nitrooxypropanol depend on supplementation dose, dietary fiber content, and cattle type. J. Dairy Sci. 101, 9041–9047. doi: 10.3168/jds.2018-14456
Dijkstra, J., France, J., Neal, H. D. S. C., Assis, A. G., Aroeira, L. J. M., and Campos, O. F. (1996). Simulation of digestion in cattle fed sugarcane: model development. J. Agric. Sci. 127, 231–246. doi: 10.1017/S0021859600078011
Duin, E. C., Wagner, T., Shima, S., Prakash, D., Cronin, B., Yáñez-Ruiz, D. R., et al. (2016). Mode of action uncovered for the specific reduction of methane emissions from ruminants by the small molecule 3-nitrooxypropanol. Proc. Natl. Acad. Sci. U.S.A. 113, 6172–6177. doi: 10.1073/pnas.1600298113
Gerber, P. J., Steinfeld, H., Henderson, B., Mottet, A., Opio, C., Dijkman, J., et al. (2013). Tackling Climate Change Through Livestock: A Global Assessment of Emissions and Mitigation Opportunities. Food and Agriculture Organization of the United Nations (FAO), Rome.
Greening, C., Geier, R., Wang, C., Woods, L. C., Morales, S. E., McDonald, M. J., et al. (2019). Diverse hydrogen production and consumption pathways influence methane production in ruminants. ISME J. 13, 2617–2632. doi: 10.1038/s41396-019-0464-2
Guyader, J., Eugéne, M., Meunier, B., Doreau, M., Morgavi, D. P., Silberberg, M., et al. (2015). Additive methane-mitigating effect between linseed oil and nitrate fed to cattle. J. Anim. Sci. 93, 3564–3577. doi: 10.2527/jas.2014-8196
Guyader, J., Ungerfeld, E. M., and Beauchemin, K. A. (2017). Redirection of metabolic hydrogen by inhibiting methanogenesis in the rumen simulation technique (RUSITEC). Front. Microbiol. 8:393. doi: 10.3389/fmicb.2017.00393
Haisan, J., Sun, Y., Guan, L., Beauchemin, K. A., Iwaasa, A., Duval, S., et al. (2017). The effects of feeding 3-nitrooxypropanol at two doses on milk production, rumen fermentation, plasma metabolites, nutrient digestibility, and methane emissions in lactating Holstein cows. Anim. Product. Sci. 57, 282–289. doi: 10.1071/AN15219
Haisan, J., Sun, Y., Guan, L. L., Beauchemin, K. A., Iwaasa, A., Duval, S., et al. (2014). The effects of feeding 3-nitrooxypropanol on methane emissions and productivity of holstein cows in mid lactation. J. Dairy Sci. 97, 3110–3119. doi: 10.3168/jds.2013-7834
Holleman, A., and Wiberg, E. (2007). Lehrbuch der Anorganischen Chemie, 102nd Edn. Berlin: Walter de Gruyter GmbH &Co KG. doi: 10.1515/9783110177701
Hristov, A. N., Oh, J., Giallongo, F., Frederick, T. W., Harper, M. T., Weeks, H. L., et al. (2015). An inhibitor persistently decreased enteric methane emission from dairy cows with no negative effect on milk production. Proc. Natl. Acad. Sci. U.S.A. 112, 10663–10668. doi: 10.1073/pnas.1504124112
Iwamoto, M., Asanuma, N., and Hino, T. (2002). Ability of Selenomonas ruminantium, Veillonella parvula, and Wolinella succinogenes to reduce nitrate and nitrite with special reference to the suppression of ruminal methanogenesis. Anaerobe 8, 209–215. doi: 10.1006/anae.2002.0428
Janssen, P. (2010). Influence of hydrogen on rumen methane formation and fermentation balances through microbial growth kinetics and fermentation thermodynamics. Anim. Feed Sci. Technol. 160, 1–22. doi: 10.1016/j.anifeedsci.2010.07.002
Kern, M., and Simon, J. (2009). Electron transport chains and bioenergetics of respiratory nitrogen metabolism in Wolinella succinogenes and other epsilonproteobacteria. Biochim. Biophys. Acta 1787, 646–656. doi: 10.1016/j.bbabio.2008.12.010
Latham, E. A., Anderson, R. C., Pinchak, W. E., and Nisbet, D. J. (2016). Insights on alterations to the rumen ecosystem by nitrate and nitrocompounds. Front. Microbiol. 7:228. doi: 10.3389/fmicb.2016.00228
Lopes, J. C., de Matos, L. F., Harper, M. T., Giallongo, F., Oh, J., Gruen, D., et al. (2016). Effect of 3-nitrooxypropanol on methane and hydrogen emissions, methane isotopic signature, and ruminal fermentation in dairy cows. J. Dairy Sci. 99, 5335–5344. doi: 10.3168/jds.2015-10832
Nolan, J. V., Godwin, I. R., de Raphélis-Soissan, V., and Hegarty, R. S. (2016). Managing the rumen to limit the incidence and severity of nitrite poisoning in nitrate-supplemented ruminants. Anim. Product. Sci. 56, 1317–1329. doi: 10.1071/AN15324
Olijhoek, D. W., Hellwing, A. L. F., Brask, M., Weisbjerg, M. R., Højberg, O., Larsen, M. K., et al. (2016). Effect of dietary nitrate level on enteric methane production, hydrogen emission, rumen fermentation, and nutrient digestibility in dairy cows. J. Dairy Sci. 99, 6191–6205. doi: 10.3168/jds.2015-10691
Park, J., and Lee, Y. (1988). Solubility and decomposition kinetics of nitrous acid in aqueous solution. J. Phys. Chem. 92, 6294–6302. doi: 10.1021/j100333a025
Petzold, L. (1983). Automatic selection of methods for solving stiff and nonstiff systems of ordinary differential equations. SIAM J. Sci. Stat. Comput. 4, 136–148. doi: 10.1137/0904010
Poehlein, A., Schmidt, S., Kaster, A.-K., Goenrich, M., Vollmers, J., Thürmer, A., et al. (2012). An ancient pathway combining carbon dioxide fixation with the generation and utilization of a sodium ion gradient for atp synthesis. PLoS ONE 7:e33439. doi: 10.1371/journal.pone.0033439
R Core Team (2020). R: A Language and Environment for Statistical Computing. Vienna: R Foundation for Statistical Computing.
Romero-Perez, A., Okine, E. K., McGinn, S. M., Guan, L. L., Oba, M., Duval, S. M., et al. (2015). Sustained reduction in methane production from long-term addition of 3-nitrooxypropanol to a beef cattle diet. J. Anim. Sci. 93, 1780–1791. doi: 10.2527/jas.2014-8726
Soetaert, K., and Petzoldt, T. (2010). Inverse modelling, sensitivity and Monte Carlo analysis in R using package FME. J. Stat. Softw. 33, 1–28. doi: 10.18637/jss.v033.i03
Thauer, R. K., Kaster, A.-K., Seedorf, H., Buckel, W., and Hedderich, R. (2008). Methanogenic archaea: ecologically relevant differences in energy conservation. Nat. Rev. Microbiol. 6:579. doi: 10.1038/nrmicro1931
Troy, S. M., Duthie, C. A., Hyslop, J. J., Roehe, R., Ross, D. W., Wallace, R. J., et al. (2015). Effectiveness of nitrate addition and increased oil content as methane mitigation strategies for beef cattle fed two contrasting basal diets. J. Anim. Sci. 93, 1815–1823. doi: 10.2527/jas.2014-8688
Ungerfeld, E. M. (2015). Shifts in metabolic hydrogen sinks in the methanogenesis-inhibited ruminal fermentation: a meta-analysis. Front. Microbiol. 6:37. doi: 10.3389/fmicb.2015.00538
Van Gastelen, S., Dijkstra, J., Binnendijk, G., Duval, S., Heck, J., Kindermann, M., et al. (2020). 3-nitrooxypropanol decreases methane emissions and increases hydrogen emissions of early lactation dairy cows, with associated changes in nutrient digestibility and energy metabolism. J. Dairy Sci. 103, 8074–8093. doi: 10.3168/jds.2019-17936
Van Lingen, H. J., Edwards, J. E., Vaidya, J. D., Van Gastelen, S., Saccenti, E., Van den Bogert, B., et al. (2017). Diurnal dynamics of gaseous and dissolved metabolites and microbiota composition in the bovine rumen. Front. Microbiol. 8:425. doi: 10.3389/fmicb.2017.00425
Van Lingen, H. J., Fadel, J. G., Moraes, L. E., Bannink, A., and Dijkstra, J. (2019). Bayesian mechanistic modeling of thermodynamically controlled volatile fatty acid, hydrogen and methane production in the bovine rumen. J. Theoret. Biol. 480, 150–165. doi: 10.1016/j.jtbi.2019.08.008
Van Lingen, H. J., Plugge, C. M., Fadel, J. G., Kebreab, E., Bannink, A., and Dijkstra, J. (2016). Thermodynamic driving force of hydrogen on rumen microbial metabolism: a theoretical investigation. PLoS ONE 11:e0161362. doi: 10.1371/journal.pone.0161362
Van Wesemael, D., Vandaele, L., Ampe, B., Cattrysse, H., Duval, S., Kindermann, M., et al. (2019). Reducing enteric methane emissions from dairy cattle: two ways to supplement 3-nitrooxypropanol. J. Dairy Sci. 102, 1780–1787. doi: 10.3168/jds.2018-14534
Van Zijderveld, S. M., Gerrits, W. J. J., Dijkstra, J., Newbold, J. R., Hulshof, R. B. A., and Perdok, H. B. (2011). Persistency of methane mitigation by dietary nitrate supplementation in dairy cows. J. Dairy Sci. 94, 4028–4038. doi: 10.3168/jds.2011-4236
Veneman, J. B., Muetzel, S., Hart, K. J., Faulkner, C. L., Moorby, J. M., Perdok, H. B., et al. (2015). Does dietary mitigation of enteric methane production affect rumen function and animal productivity in dairy cows? PLoS ONE 10:e0140282. doi: 10.1371/journal.pone.0140282
Wang, R., Wang, M., Ungerfeld, E. M., Zhang, X. M., Long, D. L., Mao, H. X., et al. (2018). Nitrate improves ammonia incorporation into rumen microbial protein in lactating dairy cows fed a low-protein diet. J. Dairy Sci. 101, 9789–9799. doi: 10.3168/jds.2018-14904
Welty, C. M., Wenner, B. A., Wagner, B. K., Roman-Garcia, Y., Plank, J. E., Meller, R. A., et al. (2019). Rumen microbial responses to supplemental nitrate II. Potential interactions with live yeast culture on the prokaryotic community and methanogenesis in continuous culture. J. Dairy Sci. 102, 2217–2231. doi: 10.3168/jds.2018-15826
Wenner, B., Wagner, B., St-Pierre, N., Yu, Z., and Firkins, J. (2020). Inhibition of methanogenesis by nitrate, with or without defaunation, in continuous culture. J. Dairy Sci. 103, 7124–7140. doi: 10.3168/jds.2020-18325
Keywords: 3-NOP, nitrite, cattle, feed supplement, bacteria, archaea, methane
Citation: van Lingen HJ, Fadel JG, Yáñez-Ruiz DR, Kindermann M and Kebreab E (2021) Inhibited Methanogenesis in the Rumen of Cattle: Microbial Metabolism in Response to Supplemental 3-Nitrooxypropanol and Nitrate. Front. Microbiol. 12:705613. doi: 10.3389/fmicb.2021.705613
Received: 05 May 2021; Accepted: 28 June 2021;
Published: 27 July 2021.
Edited by:
Shyam Sundar Paul, Directorate of Poultry Research (DPR), ICAR, IndiaReviewed by:
Xuezhao Sun, Jilin Agricultural Science and Technology University, ChinaCopyright © 2021 van Lingen, Fadel, Yáñez-Ruiz, Kindermann and Kebreab. This is an open-access article distributed under the terms of the Creative Commons Attribution License (CC BY). The use, distribution or reproduction in other forums is permitted, provided the original author(s) and the copyright owner(s) are credited and that the original publication in this journal is cited, in accordance with accepted academic practice. No use, distribution or reproduction is permitted which does not comply with these terms.
*Correspondence: Henk J. van Lingen, aGVuay52YW5saW5nZW5Ad3VyLm5s
†Present address: Henk J. van Lingen, Laboratory of Systems and Synthetic Biology, Wageningen University & Research, Wageningen, Netherlands
Disclaimer: All claims expressed in this article are solely those of the authors and do not necessarily represent those of their affiliated organizations, or those of the publisher, the editors and the reviewers. Any product that may be evaluated in this article or claim that may be made by its manufacturer is not guaranteed or endorsed by the publisher.
Research integrity at Frontiers
Learn more about the work of our research integrity team to safeguard the quality of each article we publish.