 Cyril Conde1
 Marian Price-Carter2
 Thierry Cochard1
 Maxime Branger1
 Karen Stevenson3
 Richard Whittington4
 John P. Bannantine5*†
 Franck Biet1*†
- 1INRAE, ISP, Université de Tours, Nouzilly, France
- 2AgResearch Ltd., Hopkirk Research Institute, Palmerston North, New Zealand
- 3Moredun Research Institute, Penicuik, United Kingdom
- 4School of Veterinary Science, The University of Sydney, Sydney, NSW, Australia
- 5USDA-ARS, National Animal Disease Center, Ames, IA, United States
Mycobacterium avium subsp. paratuberculosis (Map) is the etiological agent of Johne’s disease in ruminants. The IS900 insertion sequence (IS) has been used widely as an epidemiological marker and target for PCR diagnosis. Updated DNA sequencing technologies have led to a rapid increase in available Map genomes, which makes it possible to analyze the distribution of IS900 in this slow-growing bacterium. The objective of this study is to characterize the distribution of the IS900 element and how it affects genomic evolution and gene function of Map. A secondary goal is to develop automated in silico restriction fragment length polymorphism (RFLP) analysis using IS900. Complete genomes from the major phylogenetic lineages known as C-type and S-type (including subtypes I and III), were chosen to represent the genetic diversity of Map. IS900 elements were located in these genomes using BLAST software and the relevant fragments extracted. An in silico RFLP analysis using the BstEII restriction site was performed to obtain exact sizes of the DNA fragments carrying a copy of IS900 and the resulting RFLP profiles were analyzed and compared by digital visualization of the separated restriction fragments. The program developed for this study allowed automated localization of IS900 sequences to identify their position within each genome along with the exact number of copies per genome. The number of IS900 copies ranged from 16 in the C-type isolate to 22 in the S-type subtype I isolate. A loci-by-loci sequence alignment of all IS900 copies within the three genomes revealed new sequence polymorphisms that define three sequevars distinguishing the subtypes. Nine IS900 insertion site locations were conserved across all genomes studied while smaller subsets were unique to a particular lineage. Preferential insertion motif sequences were identified for IS900 along with genes bordering all IS900 insertions. Rarely did IS900 insert within coding sequences as only three genes were disrupted in this way. This study makes it possible to automate IS900 distribution in Map genomes to enrich knowledge on the distribution dynamics of this IS for epidemiological purposes, for understanding Map evolution and for studying the biological implications of IS900 insertions.
Introduction
Among mycobacteria that cause severe disease in animals, Mycobacterium avium subspecies paratuberculosis (Map) occupies a leading position in terms of economic importance and welfare effects on livestock worldwide. Paratuberculosis or Johne’s disease has been recognized as a major disease of ruminants since the late nineteenth century and continues to spread in most industrialized countries (Rathnaiah et al., 2017). This disease has a significant economic impact on livestock on all continents despite expensive eradication programs existing worldwide and the use of vaccines. Today, the prophylaxis against paratuberculosis is costly and inefficient leading to great concern for controlling this endemic disease (Barkema et al., 2010; Whittington et al., 2019).
Despite the publication of the complete genome sequence of Map, knowledge of the biology and pathogenesis of this bacterium remains largely unclear. Genomic studies have revealed that Map evolved from Mycobacterium avium subsp. hominissuis (Mah) into two distinct lineages (Turenne et al., 2008). These lineages are historically referred to as the cattle (C) -type and the sheep (S) -type and can be consistently distinguished by the genotyping tools available for Map including VNTR, SSR, and SNP analysis (Bannantine et al., 2013). In addition to their genomic diversity, strains belonging to these two lineages exhibit phenotypic differences (Taylor, 1951; Stevenson et al., 2002; Janagama et al., 2009; Lefrancois et al., 2013; Bannantine et al., 2017). In general, strains belonging to the S lineage are more common in sheep and goats whereas those from the C lineage predominate in cattle but can be isolated from a wider host range including deer, bison and humans. The association of each lineage with either cattle or sheep hosts is not exclusive since strains representative of either lineage can cause disease in all types of ruminants (Stevenson, 2015). More recently, whole genome studies have revealed subdivision of the S lineage into two subtypes I and III, and confirm that both are distinct from the C-type (Bryant et al., 2016).
The complete, annotated genome sequence, of isolate Map K-10 of C-type was published in 2005 (Li et al., 2005). Very recently the complete genome of S-type Map including the genome of the Telford strain subtype I and the strains S397 and JIII-386 of subtype III have been established (Brauning et al., 2019; Wibberg et al., 2020; Bannantine et al., 2021). Recent studies have shown that C-type strains of Map have a very homogenous genome, but the S-type I strain Telford has a different genomic organization and more single nucleotide polymorphisms (SNPs) compared to the C-type Map strains (Uchiya et al., 2017; Bannantine et al., 2020; Wibberg et al., 2020). Furthermore, Map genomes aligned at a common start revealed that C-type strains have a highly homologous genome synteny while the S-type strains (both subtypes I and III) show large rearrangements (Bannantine et al., 2020; Wibberg et al., 2020).
Mobile genetic elements play a key role in chromosomal remodeling and host adaptation (Moran and Plague, 2004; Toft and Andersson, 2010). Among the insertion sequences (IS) present in the Map genome, the IS900 element is exclusively found in this subspecies (Green et al., 1989; Bull et al., 2000; Semret et al., 2006). This element varies from 16 to 22 copies per genome. These features make IS900 a robust marker for the diagnosis of Map. Moreover, this sequence has long been used for the study of the polymorphism of Map strains. IS900 is highly conserved across the two distinctive S and C lineages (Semret et al., 2006). The phylogeny based on IS900-RFLP distinguishes both these lineages and the subtypes I and III of Map (Pavlik et al., 1999; Biet et al., 2012). Unfortunately, this technique is time consuming, requiring a large amount of DNA and therefore dependent on very tedious culture of Map (Choy et al., 1998; Whittington et al., 2000). Consequently, this method is under-utilized or even abandoned. As a result, we developed a program to produce in silico IS900 RFLP patterns based on complete genome sequences to simplify the characterization of newly sequenced isolates.
IS900 belongs to the IS110 family of insertion sequences because they do not contain the typical terminal inverted repeat sequences and do not generate flanking direct target DNA repeats on insertion. The sequence of IS900 was first deposited under accession number X1629 (Green et al., 1989). The size of IS900 is 1,451 base pairs (bp). The sequence of IS900 contains a 1,200 bp gene encoding a putative transposase termed P43 belonging to the DDED family of transposases (Tizard et al., 1992), which contain a characteristic motif of three catalytic residues, two of which are aspartic acids and a third position that is either glutamic or aspartic acid (Nesmelova and Hackett, 2010). The sequence of IS900 also contains a second ORF, encoded on the complementary strand to the transposase, designated the hed gene (host expression dependent) of unknown function (Doran et al., 1997). This ORF spans the entire IS900 sequence but it does not contain a putative RBS or start codon (Supplementary Figure 3). Using a non-replicating vector, England et al. (1991) showed that integration of IS900 can transpose by simple insertion as well as by a replicative mechanism. The biological implications of IS900 transposition during Map adaptation to ruminant hosts and its evolution into two distinct lineages related to host specificity remain unknown.
In this study, we analyzed the chromosomal distribution of IS900 across the primary Map C and S lineages and identified IS900 sequence polymorphisms characteristic of each lineage and S-type subtypes. A bioinformatic RFLP genotyping method was developed to characterize the complete genomes of Map now available as well as those sequenced in the future. This program enables RFLP analysis in silico, including digital visualization for phylogenetic purposes. Finally, the distribution and analysis of IS900 in Map has evolutionary implications for this veterinary pathogen.
Materials and Methods
Strains and Genomes
Strain K-10 (Li et al., 2005, 2019), Telford (Brauning et al., 2019) and S397 (Bannantine et al., 2012) were included in this study as references of the major lineages that have emerged during the evolution of Map. Isolates were propagated on slopes of modified Middlebrook 7H11 supplemented with 20% (vol/vol) heat inactivated newborn calf serum, 2.5% (vol/vol) glycerol, 2 mM asparagine, 10% (vol/vol) Middlebrook oleic acid-albumin- dextrose-catalase (OADC) enrichment medium (Becton Dickinson, Oxford, Oxfordshire, United Kingdom), Selectatabs (code MS 24; MAST Laboratories Ltd., Merseyside, United Kingdom), and 2 μg ml-1 mycobactin J (Allied Monitor, Fayette, MO, United States). The complete genome sequence of K-10 (C-type, NC_002944.2), Telford (S-type subtype I, NZ_CP033688.1) and S397 (S-type subtype III, NZ_CP053749.1) were downloaded from the NCBI RefSeq (O’Leary et al., 2016; Table 1). S397 was annotated using PGAP (Tatusova et al., 2016).
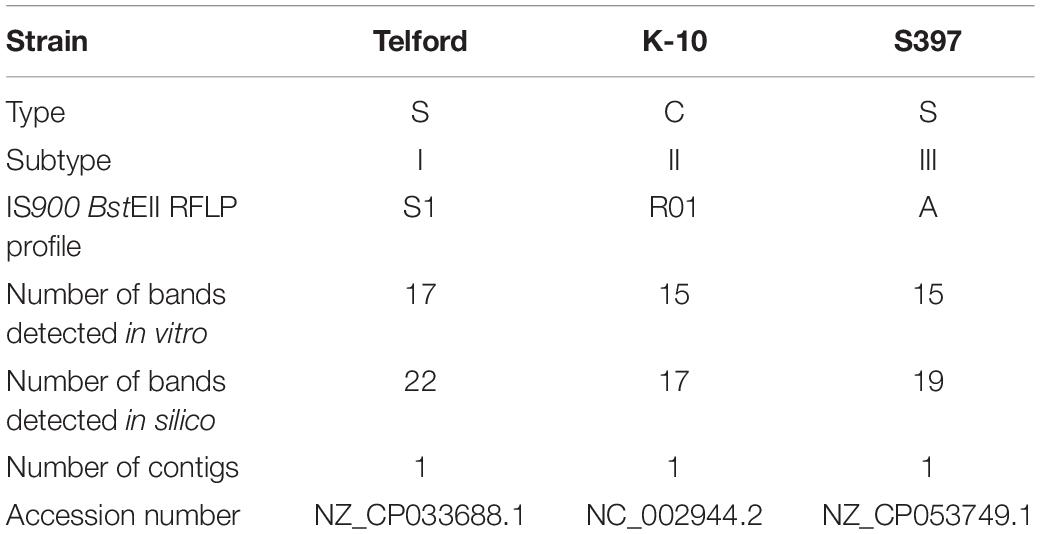
Table 1. Details of the strains and genomes used and information on the number of copies of the IS900.
In vitro IS900-RFLP
Mycobacterium avium subsp. paratuberculosis strains were typed by BstEII IS900-RFLP as described previously (Thibault et al., 2007). Profiles were designated according to nomenclature previously described (Collins et al., 1997; Pavlik et al., 1999; Mobius et al., 2009). Profiles were analyzed using BionumericsTM software version 7.6.3 (Applied Maths, Belgium).
Bioinformatic Analysis
IS900 Sequence Identification and in silico IS900 RFLP Workflow
We developed an in silico analysis pipeline for IS900 RFLP profiling using complete genome sequences as the input (Figure 1). As a first step, all BstEII restriction sites were located in the genome using in-house script (available at: https://forgemia.inra.fr/public-pgba/is900-rflp-in-silico) developed with Biopython (v1.76) (Cock et al., 2009). IS900 copies in the genome sequence were identified using a blastn version 2.9.0 (Altschul et al., 1990) search of IS900 sequence retrieved from the NCBI database (accession no. X16293) with a percent identity of 99% and an e-value of 1e-100 to exclude all false positive hits. For each hit, upstream and downstream sequences nearest the BstEII restriction sites were retrieved from the BstEII restriction map and length of the BstEII fragment was computed. A gel migration equation was previously determined using GelAnalyzer 19.11 and used to convert fragment length into migration distance for further visualization of the RFLP profile. Migration data and coordinates of IS900 copies were saved in .tsv and .rflp files, respectively, for visualization of the profile and further investigation of locus distribution. Visualization of RFLP profiles was performed using python library matplotlib (v3.3.0)2.
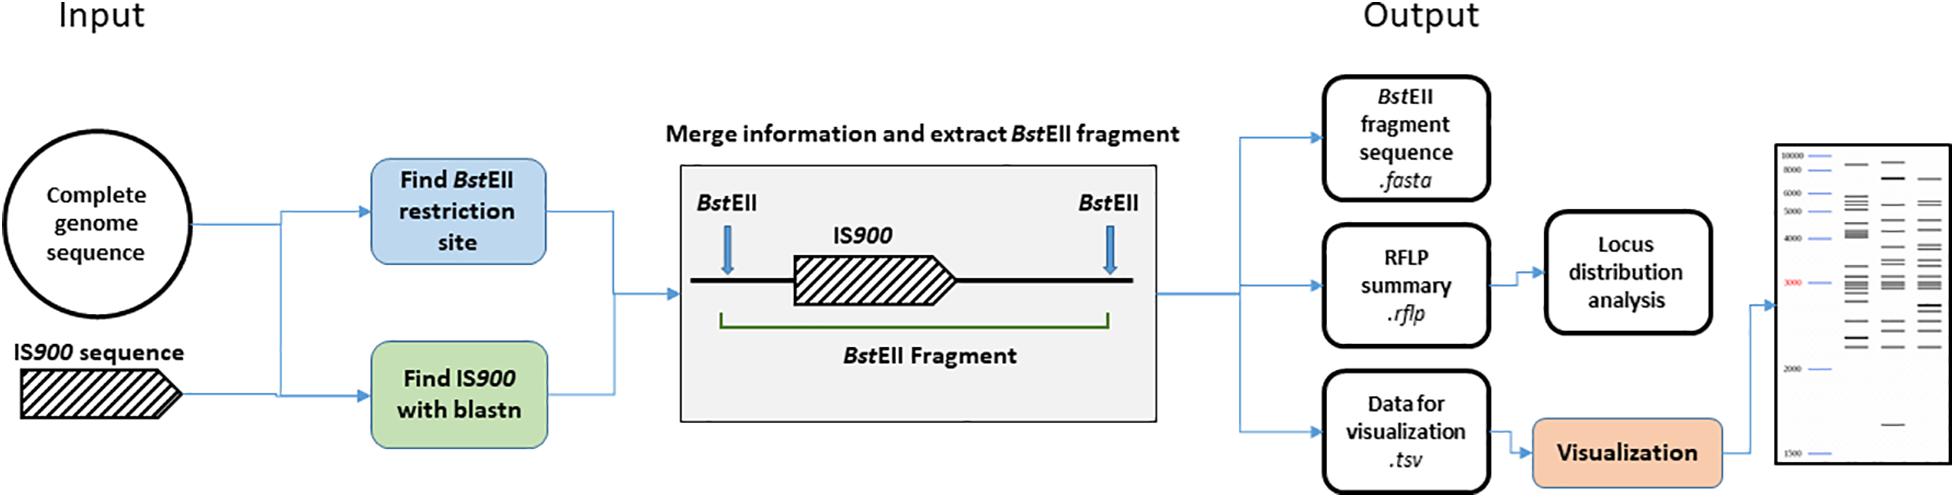
Figure 1. Bioinformatic analysis pipeline. Details of steps performed by the IS900 RFLP in silico pipeline. From complete genome sequences, BstEII restriction site and IS900 sequence positions were identified. Both data sets are merged together to extract the BstEII fragment sizes from the genome sequence. Previous positions IS900 and sequence orientation are stored in a.rflp file for further analysis. BstEII fragment sizes are converted into migration distance based on calculation from an in vitro gel migration (see section “Materials and Methods”) and saved in the .tsv file for further visualization of the RFLP profile.
IS900 Sequence Polymorphism
In order to confirm IS900 sequence polymorphisms previously described (Semret et al., 2006; Castellanos et al., 2009), IS900 copies from the three genomes were extracted and aligned using Multalin (Corpet, 1988) with the “DNA” symbol comparison table. Shorter IS900 copies in the alignment were manually checked with Artemis software version 18.1.0 (Carver et al., 2008) to confirm blastn results.
Mauve Alignment
Synteny alignments were determined with Mauve (snapshot_2015-02-13 build 0) (Darling et al., 2004). In order to avoid false indications of inversions or other rearrangements, these genomes were first shifted to start at the dnaA gene prior to Mauve analysis. Using the complete genome sequences of each strain, we performed a 1 vs. 1 genome alignment using progressive Mauve (Darling et al., 2010) and also an alignment of the three genome sequences in order to visualize differences in genomic organization.
Orthology Analysis
To identify IS900 copies inserted at orthologous genomic sites between the genomes of K-10, Telford and S397, we performed blastn searches using as queries, 2,000 bp of upstream and downstream genomic regions flanking each IS900 copy. These orthologous flanking regions from one genome were aligned to the two other genomes and compared to identify orthologous loci. Therefore, blastn results were parsed in order to select the best match. The best match was defined with the following criteria: (1) an e-value of 0 and (2) a minimum coverage of 80%. For many flanking regions, blastn yielded only one result. But for a few others, more than one result was returned. In cases where the coverage of the best result is below 80%, we searched for other results around 4,000 bp from the first result to identify genome rearrangement/differences and merged them. Finally, orthologous loci were considered linked to an IS900 loci if the center of the BLAST hit fell within the 2,000 bp region flanking the IS900 element in the target genome.
IS900 Sites Gene Ontology Enrichment Analysis
This approach aimed to determine if the genes near insertion sites were enriched for any particular function. Protein sequences upstream and downstream of IS900 were extracted, if available, from the RefSeq annotation. Functional annotation was performed using eggNOG-mapper-2.0.1 (Huerta-Cepas et al., 2017) based on eggNOG orthology data (Huerta-Cepas et al., 2019). Sequence searches were performed using DIAMOND version 2.0.5 (Buchfink et al., 2015).
Identifying the Candidate Insertion Sites
In order to identify targeted insertion site motifs in the genomes of Map, 10 bp of upstream and downstream sequence of each IS900 were extracted. Each strand of the IS element was considered and extracted sequences were reverse complemented if needed. Insertion sequences containing deletions or duplications were excluded from the analysis. Multalin (Corpet, 1988) was used to align upstream and downstream sequences using the “DNA” symbol comparison table. The alignment of the upstream sequence was performed with “gap penalty at opening” set to 1 and “gap penalty at extension” set to 0. The alignment of the downstream sequence was performed with default parameters. Upstream and downstream IS900 flanking regions from each genome were aligned to the M. avium subsp. hominissuis (Mah) 104 genome using blastn in order to find orthologous regions. Only adjacent regions have been retained. Putative target sequences, previously identified in the three genomes, were extracted manually from the Mah 104 genome using Artemis software version 18.1.0 (Carver et al., 2008) based on blastn results. MEME version 5.3.1 (Bailey and Elkan, 1994) was used to identify a putative target site motif.
Results
IS900 Sequence Identification in Complete Map Genomes
The complete genome sequences of Map strains representing the three known genetic lineages provide a unique opportunity to analyze the distribution of IS900 across all Map strains. The search for IS900 sequences in complete genomes identified 17 copies in the K-10 genome, 19 copies in the S397 genome and 22 copies in the Telford genome (Table 1). To investigate if the expansion of IS900 is correlated with the evolutionary scenario of Map, additional analysis on 10 available C-type complete genome sequences shows that between 16 and 17 IS900 copies are consistently observed, which is less than the number of copies identified in S-type strains (Supplementary Table 3). The advantage of having the complete genome is to be able to precisely locate the IS900 sequences on the chromosome. Figure 2A shows the positions of IS900 on the circular chromosome of K-10. In parallel with the evolution of Map, genomic organization of the three genetic lineages show numerous large rearrangements that impact the distribution of IS900 copies within these three genomes. This observation is illustrated in Figure 2B, which shows the mauve alignment of K-10, Telford, and S397 genomes along with the position of all IS900 insertions.
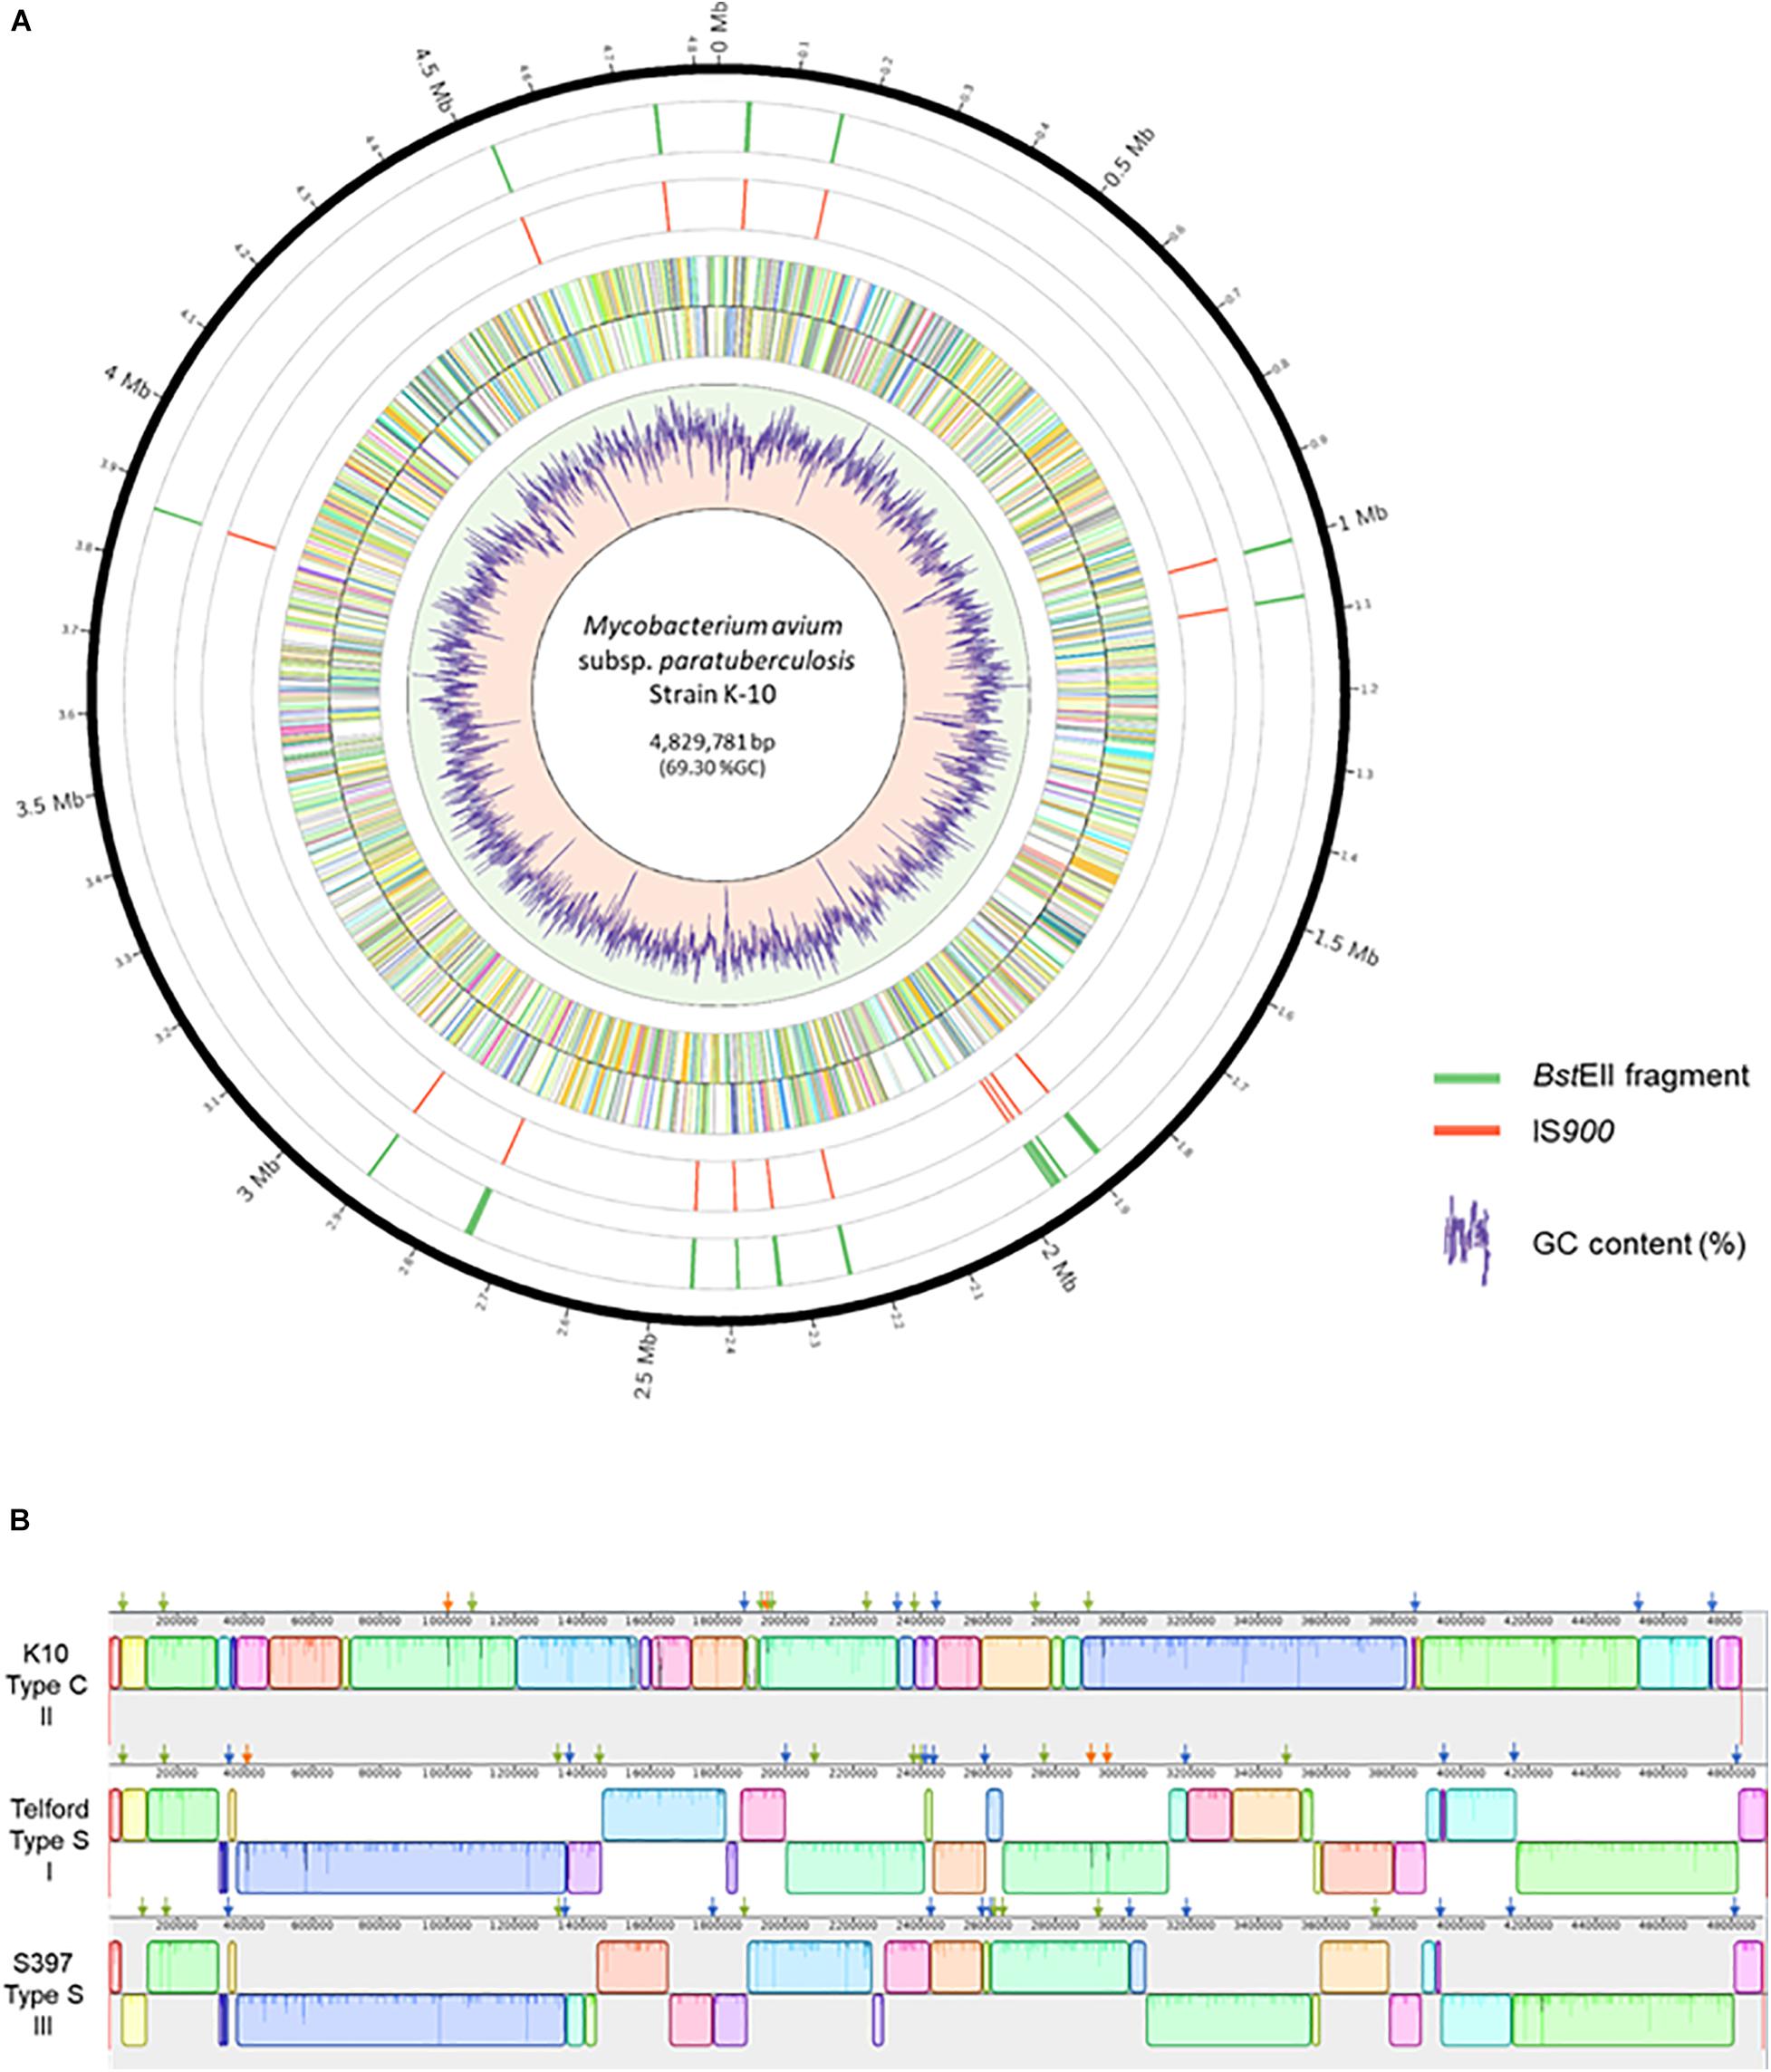
Figure 2. Distribution of IS900 copies on the genome of Mycobacterium avium subsp. paratuberculosis strain K-10. (A) Shown, using Circos version 0.69–8, from the outer circle to the inner circle are the megabase (Mb) positions on the chromosome, the BstEII restriction sites, the position of each IS900 element, plus strand ORFs, minus strand ORFs and a plot of the percent GC. (B) Mauve alignment of K-10 (top) with Telford (middle) and S397 (bottom) showing genomic reorganization of the genomes. The colored boxes represent homologous regions present in each genome. Blocks below the centerline indicate regions with inverse orientation. Regions outside the blocks lack homology between the genomes. Within each block there is a similarity profile of the DNA sequences and the white areas indicate sequences specific to a genome. The scale is in base pairs. Orthologous insertions are indicated, using the slider of Mauve, by a green arrow, specific insertions are indicated by a orange arrow and conserved loci only in two genomes by a blue arrow.
In addition, these three complete genomes were used to ascertain that SNP polymorphisms in the IS900 sequences are type-specific. To demonstrate this, 58 sequences representing all copies of IS900 from the three genomes were aligned.
The alignment in Supplementary Figure 1 shows three positions for which we observed SNPs. Remarkably, all 19 copies of the IS900 sequence in S397 have a SNP at position 169 (C-T). The second polymorphism is at position 216 with SNPs identified only in Telford and S397 but not on all loci. In Telford 19/22 loci show an A-G substitution. In the S397 7/19 loci show this same A-G substitution. Interestingly, this study reports for the first time a third SNP in IS900. Indeed, by alignment of sequences at each locus, we detected only in Telford at position 1406 a T-G substitution on eight of the 22 loci. These results were verified on all available complete genomes of Map through the alignment of 175 IS900 sequences. Further genome analysis has revealed other novel features of the IS900 sequences. Four loci have shorter sequences, loci 11 and 17 in K-10 have deletions of 44 and 70 bp, respectively, at the start of the sequence. Furthermore, loci seven in Telford and S397 has a 44-bp deletion at the start of the sequence (Supplementary Figure 1).
This analysis also identified a sequence repetition of the motif ACCTTTCTTGAAGGGTGTTCGGGG from position six, two times at locus nine in Telford and three times at locus 13 of S397.
To complete this analysis, we examined the other complete Map genomes in NCBI of C-type. The blastn result showed only one substitution A/G at position 981 in one of the 16 IS900 copies in the MAPK-CN7/15 genome and one substitution C/T at position 1,142 in one of the 16 IS900 copies in the MAP4 genome. This result correlated with the finding described above and confirms the high degree of conservation of the IS900 sequence, especially in C-type.
IS900 Restriction Fragment Length Polymorphism (RFLP) in silico
We developed a bioinformatic method that automatically searches the exact positions of IS900 in each genome. Using this tool, it is now possible to analyze and catalog IS900 RFLP patterns in silico. Building on the IS900-RFLP technique used for Map strain characterization (Pavlik et al., 1999; Stevenson et al., 2002; Mobius et al., 2009; Biet et al., 2012), our procedure combines the location of IS900 sequences with the generation of BstEII restriction fragments. The resulting output lists all the fragments with the exact size carrying a copy of IS900 (Figure 3A). From these data the program provides a digital visualization of the restriction fragments separated according to their size by mimicking their migration pattern in an agarose gel (Figure 3B). For comparison, the IS900 RFLP profiles obtained by the classical Southern blot method (Figure 3C) were used to find the approximate size and number of BstEII restriction fragments (Figure 3D). As shown in Figures 3B,C, the profiles obtained in silico and in vitro are highly consistent. More importantly, these profiles deduced from in silico genomic analysis can now be compared to those obtained previously by the classical technique.
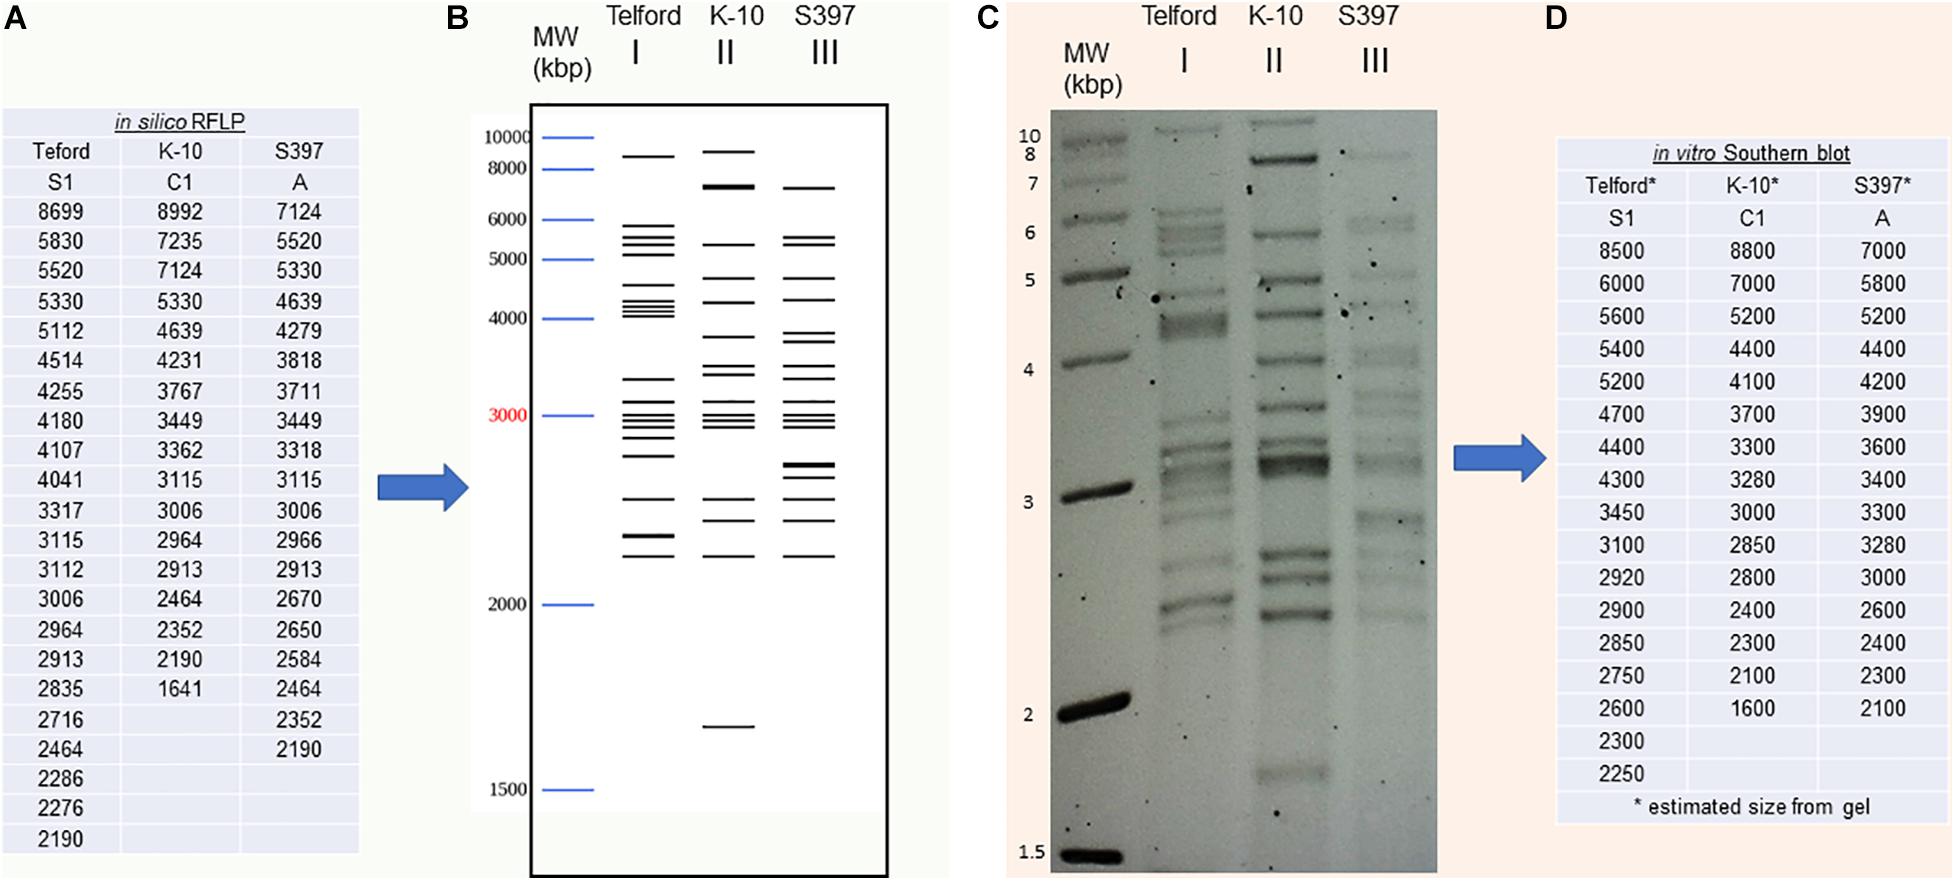
Figure 3. IS900 restriction fragment length polymorphism (RFLP) “in vitro” versus “in silico” (A) An in silico RFLP analysis was developed using complete genomes. This automated procedure identified the BstEII restriction sites to obtain the exact size of all DNA fragments carrying a copy of the IS900 sequence. IS900 RFLP profiles were compared using fragment sizes (A) or (B) by digital visualization of the restriction fragments separated according to their size by mimicking their migration in agarose gel. (C) The IS900 RFLP profiles obtained by classical Southern blot method and hybridization to IS900 were used to find the approximate fragment sizes by band analysis software (D).
The UPGMA dendrogram presented in Figure 4, adapted from Biet et al. (2012), shows an updated phylogeny based on IS900 RFLP typing where the new in silico profiles inferred from K-10, Telford, and S397 IS900 RFLP analysis have been included together with the in silico profiles inferred from the ten recently available genome sequences (Figure 4).
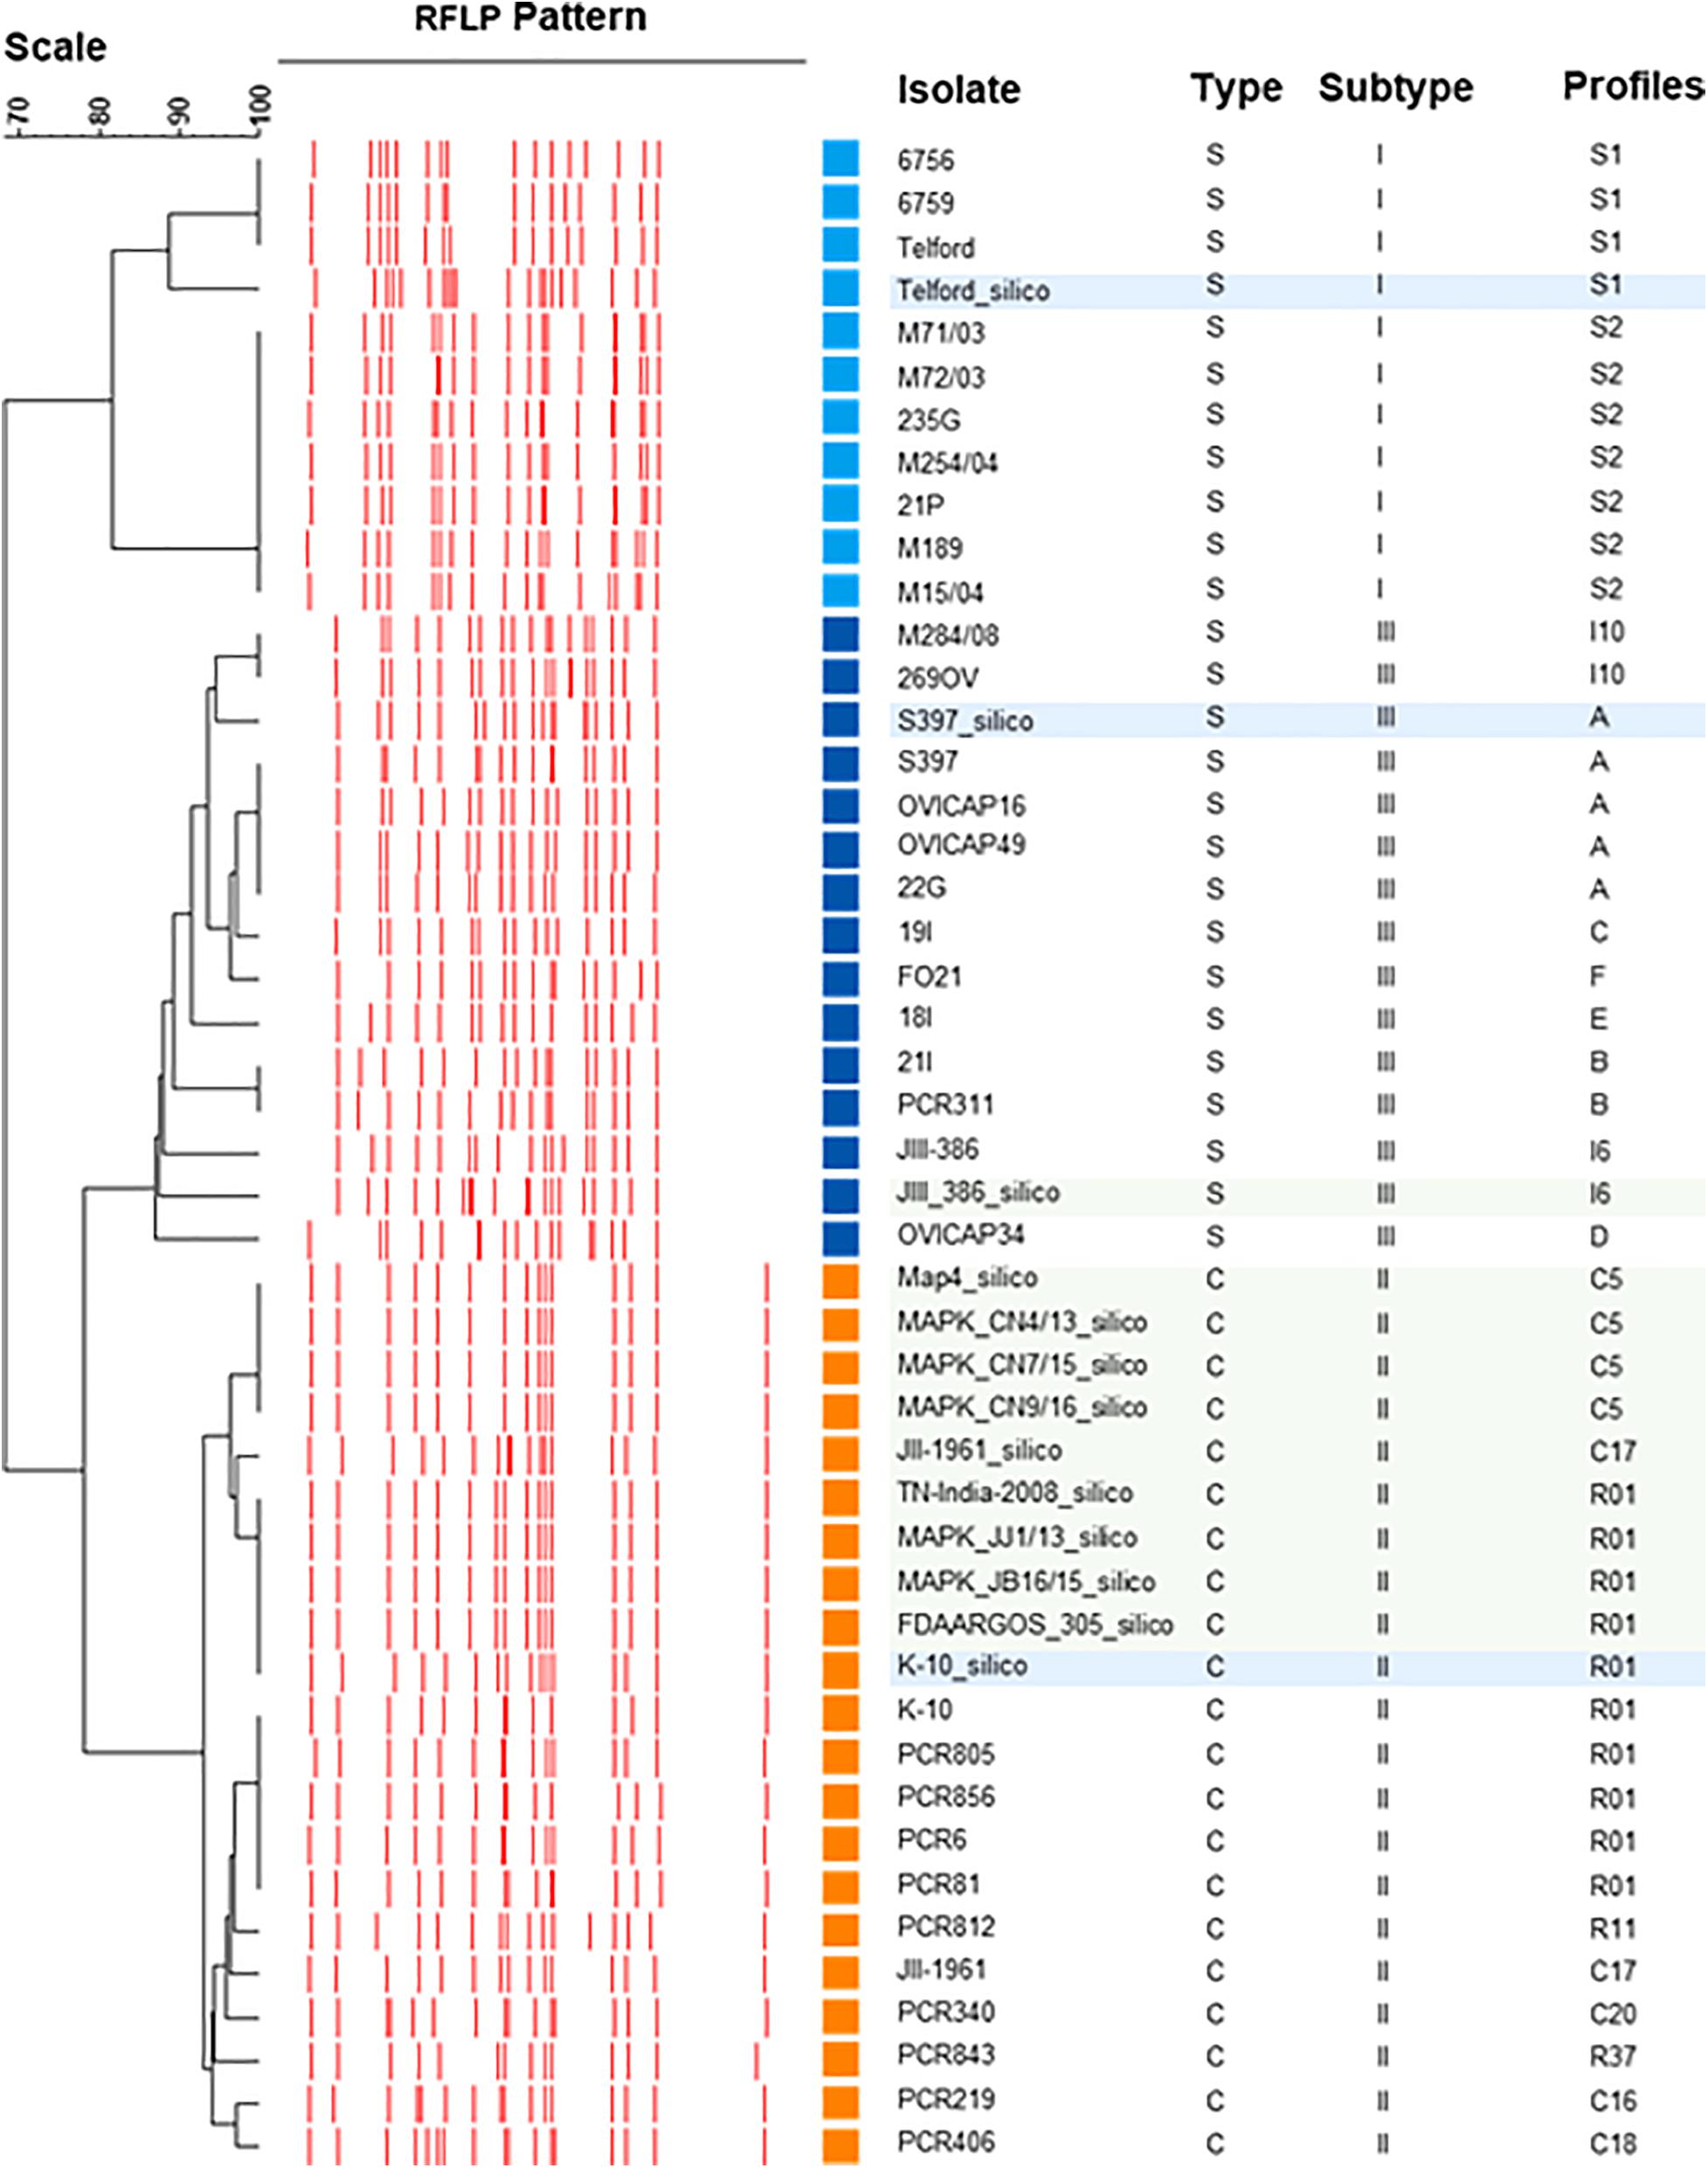
Figure 4. IS900 RFLP Phylogeny. Phylogeny RFLP with profiles established in silico and integrated into the database are indicated by blue boxes for the three reference genomes of C-type and S-type subtypes I and III and in green boxes for the other complete genomes available for Map.
Abundance, Distribution, and Orthology of IS900 Copies Between the Map Lineages
Next, we sought to identify each site of IS900 insertion within the three genomes representing the Map lineages C and S subtypes I and III. This approach was taken to investigate the role played by these insertions in the genomic evolution of Map as well as to identify sites that are enriched for unique insertions that might indicate distinct functionally important genes and pathways. Finally, we analyzed the sequence context of IS900 insertions to determine their target-site specificity. Using MEME (Bailey and Elkan, 1994) motif analysis software, we identified insertions that have a significant target sequence motif of CATGNNNNNNTCTCCTT (Supplementary Figure 2). The expect values (E-value) are small, ranging between 8.6e-46 and 5.5e-66, indicating a high probability that the motif sequence is required for insertion. These alignments are illustrated in Supplementary Figure 2.
To characterize the distribution of IS900 in Map, we searched for all genes upstream and downstream from each of the 58 total copies of IS900 across all three genomes. The directory of all the genes surrounding each copy is presented in Supplementary Tables 1, 2 and Supplementary Figure 3. From this analysis, the IS900 copies inserted at orthologous genomic sites or absent or polymorphic in each genome were identified. There are nine IS900 copies inserted in orthologous sites identified across the three genomes, four uniquely shared between K-10 and S397 and two shared between Telford and S397 (Supplementary Table 2 and Figure 5A). The K-10 genome contains two specific sites, Telford genome has three specific sites but no insertions are specific in the S397 genome. For some of the insertion sites, analysis of upstream and downstream genes revealed chromosomal rearrangements. Supplementary Table 2 and Figure 5B indicate the orthologous loci present either upstream or downstream of each IS900 insertion site. Overall these data show that apart from the three additional IS900 copies in Telford genome and the 17u locus of K-10, insertion of IS900 occurred at orthologous sites.
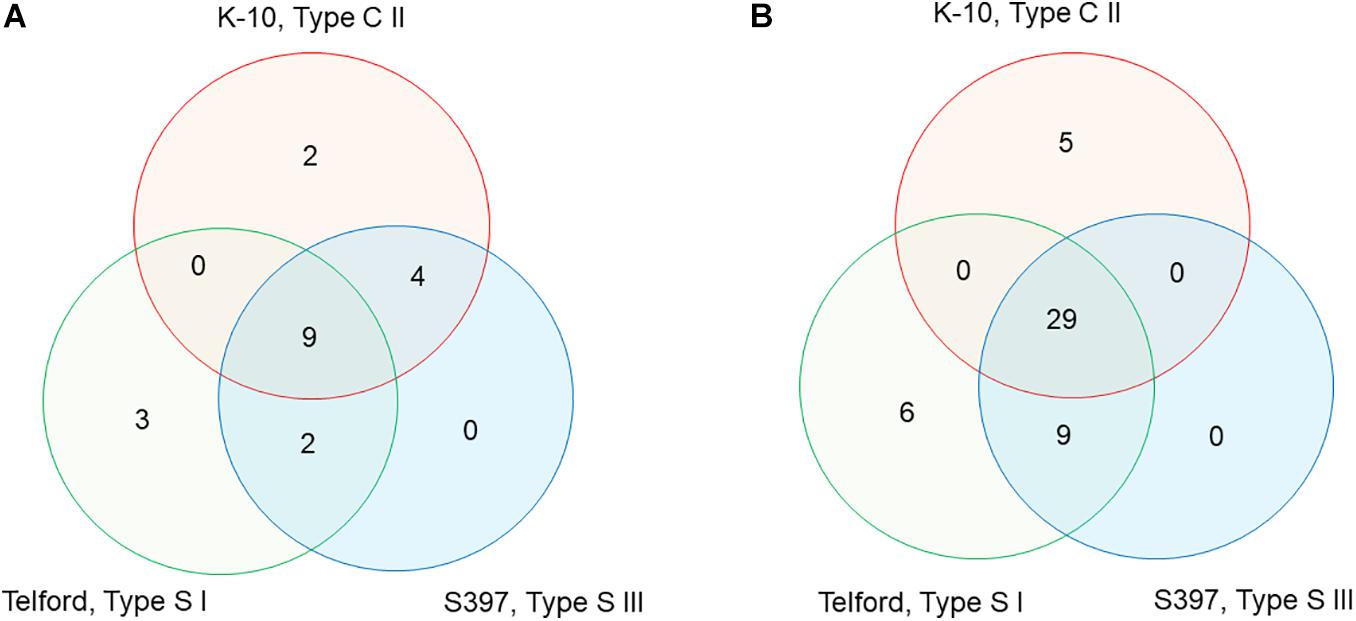
Figure 5. Venn diagram, showing IS900 orthologous sites and orthologous loci between the three Map genomes. (A) The diagram indicates the number of IS900 sites unique or orthologous between 2 and 3 genomes. (B) The diagram indicates the number of orthologous or unique loci upstream and downstream of the IS900 between genomes. Refer to Supplementary Table 2 for additional details.
Effect of IS900 Insertions in Map
In rare cases, we found that IS900 insertion sites within predicted coding sequences, indicating loss-of-function for only three disrupted genes. One example is illustrated in Figure 6 and Supplementary Figure 3 where the orthologous loci in Mah containing a gene predicted to encode a membrane protein was found disrupted in Map by an IS900 insertion.
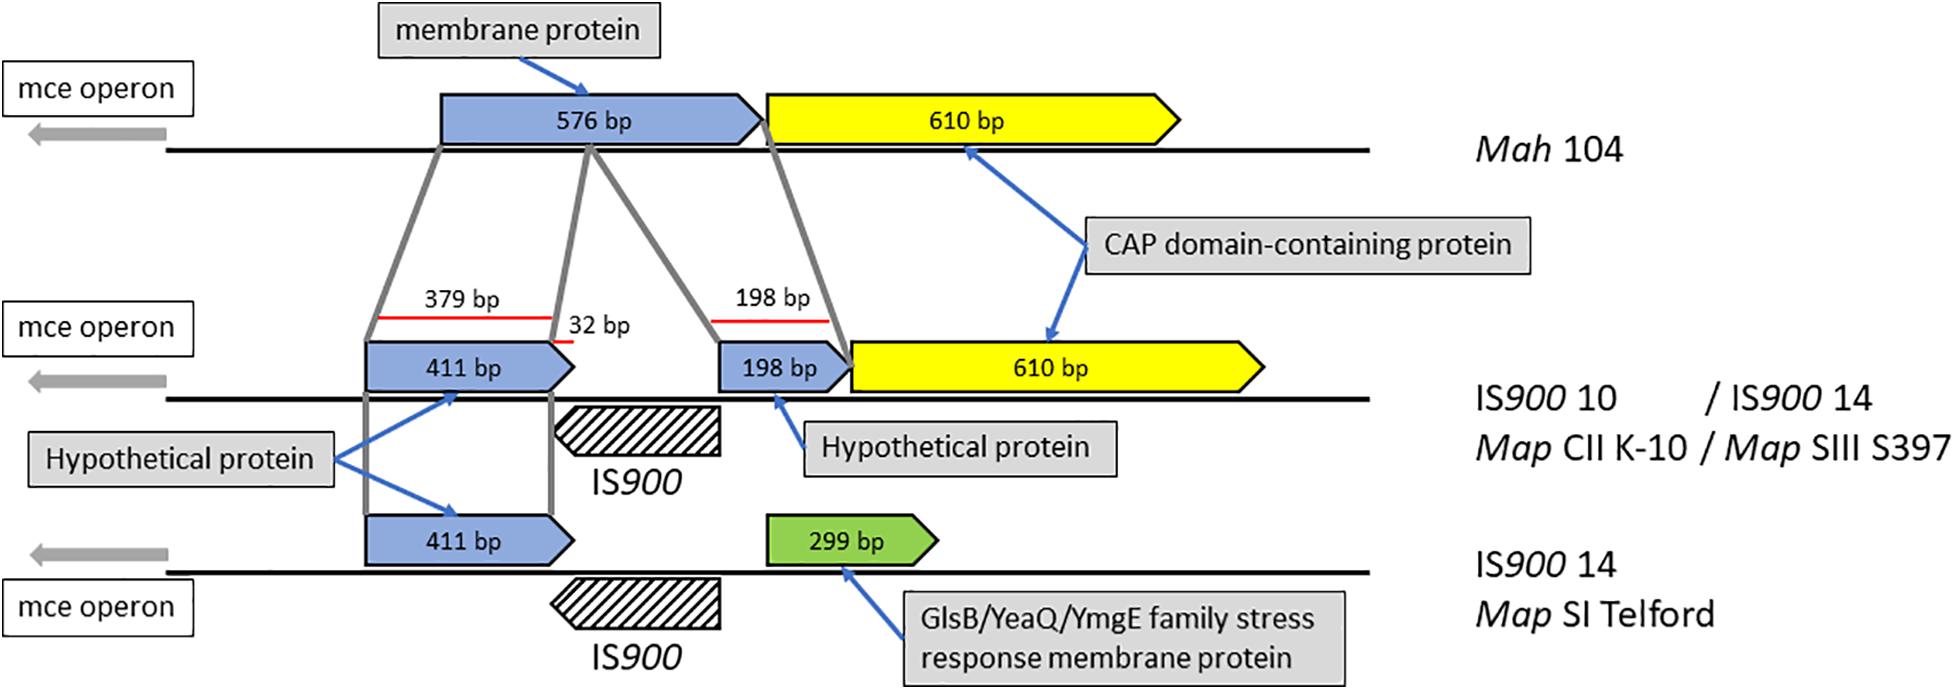
Figure 6. Mah gene disrupted by IS900 insertion in Map. Shown are orthologous regions of the genomes of M. avium subspecies. The 576 bp Mah gene encoding a putative membrane protein is disrupted by insertion of IS900 into that gene sometime after the subspecies delineation. The corresponding region in the Telford strain appears to have a second genome modifying event, which changed this region upstream of the insertion.
To determine what types of genes are adjacent to IS900 insertion sites, we performed a Gene Ontology (GO) enrichment analysis of all genes surrounding the IS900 sites. In this analysis, we identified 13 GO term pathways (Figure 7 and Supplementary Table 3). These analyses found enriched pathways mainly associated with transcription, replication, recombination and repair processes, lipid transport, and metabolism or secondary metabolites biosynthesis, transport, and catabolism.
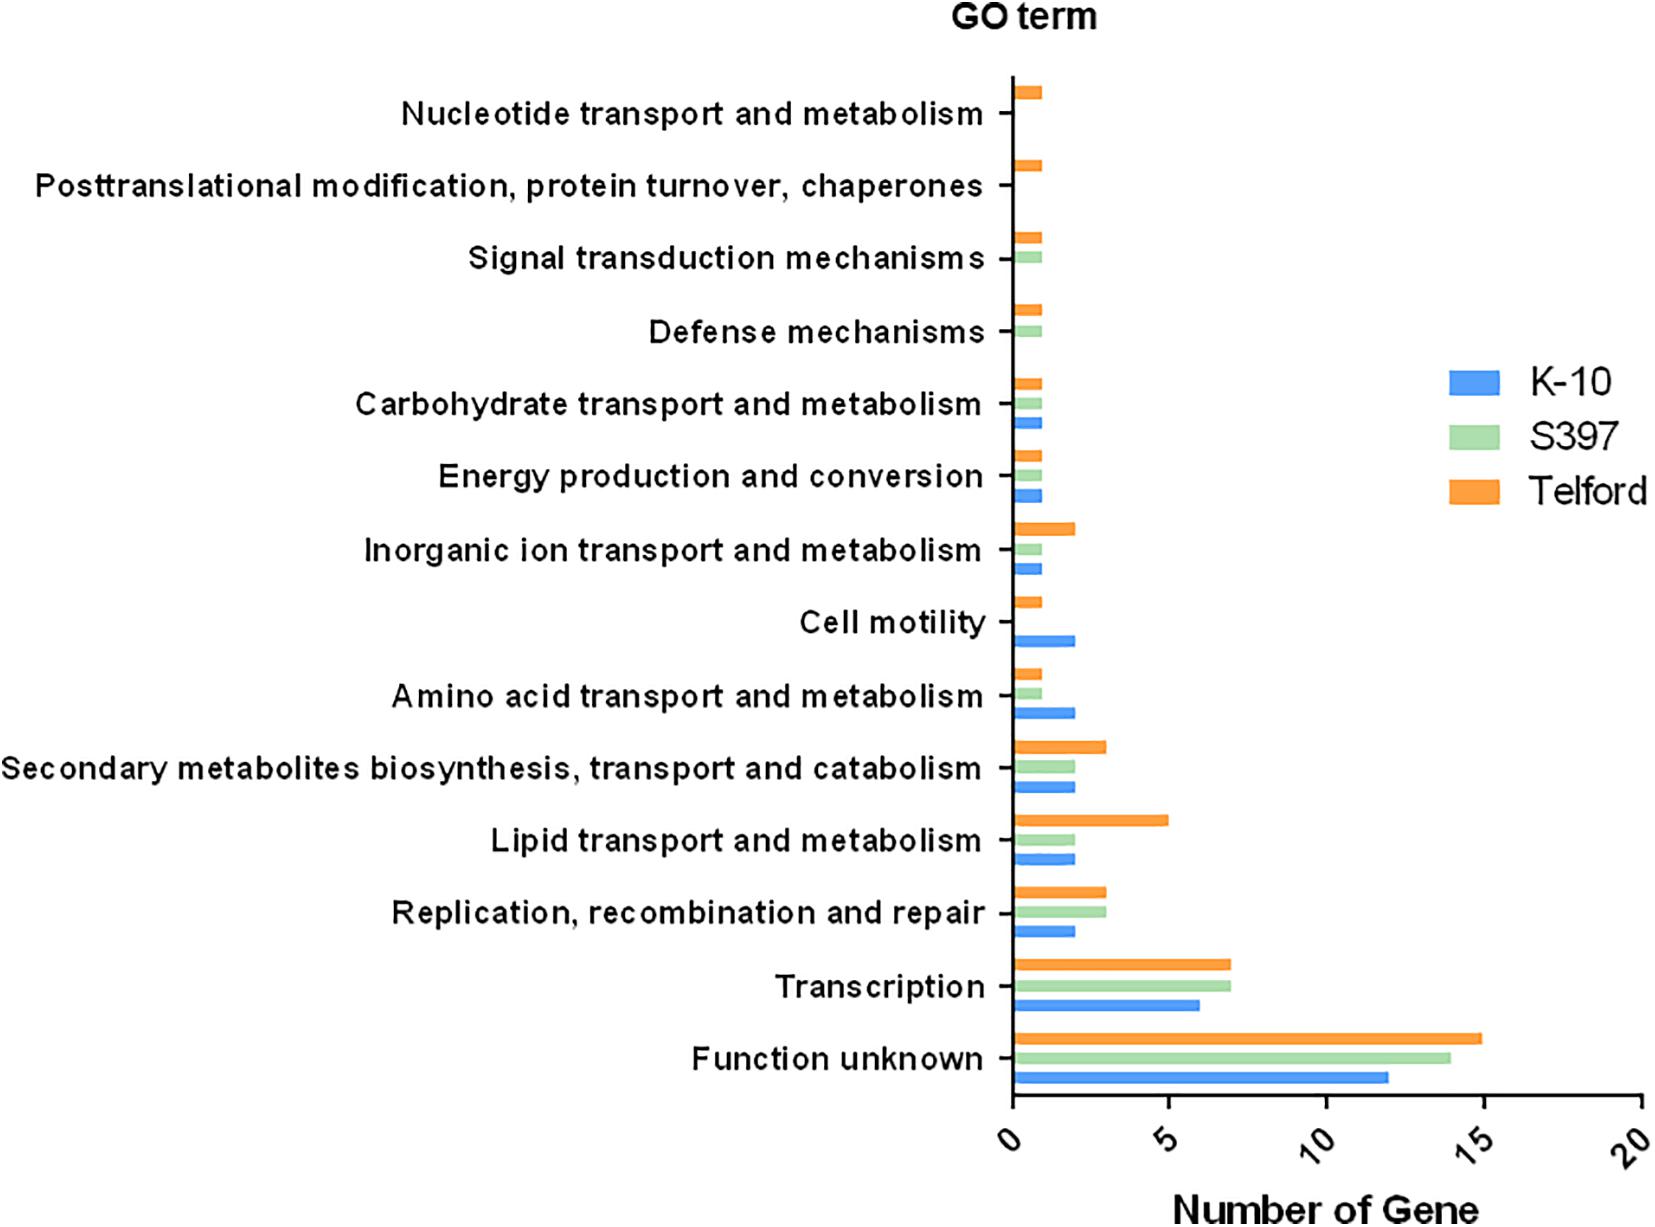
Figure 7. IS900 sites associated with functional genes and pathways. The diagram indicates Gene Ontology (GO) enrichment analysis of predicted coding sequences near IS900 sites.
Discussion
The Map subspecies is an economically significant veterinary pathogen in cattle, sheep and goat populations that is distinguishable from other members of the MAC complex by the presence of IS900 insertion sequences. It is possible that this transposable element is a driving force in the evolution of Map, especially in light of the paucity of genetic recombination and horizontal gene transfer that occurs in this bacterium (Bannantine et al., 2020). In this report we took the unique opportunity to analyze the complete genome sequences of three important Map genetic lineages to investigate IS900 loci-by-loci features and their genomic distribution.
With advances in “long read” sequencing technologies, the resolution of whole genome sequencing (WGS) has improved dramatically. This provides complete genomes required to determine the distribution of insertion sequences. Until WGS became achievable, the only information regarding the presence and number of IS900 copies were provided by RFLP analysis followed by Southern-blot hybridization to IS900 (IS900-RFLP). Compared to IS900-RFLP studies, which require laborious and time-consuming techniques, complete genome analysis gives the exact number and position of each copy of IS900.
IS900 is present in high copy numbers, between 16 and 17 copies in C-type genomes and more in S-type strains (19 copies in subtype III and 22 in subtype I). It is noteworthy that we found 19 copies of IS900 in the complete genome of strain JIII-386, which was recently published (Wibberg et al., 2020), but this same article reported only 18 copies of IS900. However, JIII-386 RFLP data from 2009 does show 19 IS900 copies (Mobius et al., 2009). This discrepancy is because Wibberg et al. only included intact IS900 elements, and therefore did not count the IS900 element at position 106338-107556 in the JIII-386 genome, which is frameshifted by a 2-bp deletion. Analysis extended to the other complete genomes of Map confirmed that C-type genomes have a maximum of 17 copies which may be related to the evolutionary history of these genetic lineages (Supplementary Table 3). The example of IS6110 exclusively found in M. tuberculosis Complex (MTBC) has shown that the number of copies of this IS is lineage-specific and classified as either low copy number (M. bovis) or high copy number in modern M. tuberculosis lineages (Gonzalo-Asensio et al., 2018). However, in Map this lineage relationship will require further investigation of additional genomes, especially S-type genomes, to determine if there is any correlation between copy number and host lineage. What is known currently is there are consistently more IS900 copies in S-type genomes compared to C-type genomes.
The development of RFLP in silico analysis provides a useful new tool to automatically define new strain profiles with a resolution that in vitro RFLP cannot provide for fragments of close size. These patterns can be compared with the many profiles described in the literature (Pavlik et al., 1999; Whittington et al., 2000; Stevenson et al., 2002; Biet et al., 2012) and in the dedicated Map typing application http://mac-inmv.tours.inra.fr (Cochard et al., 2020). The comparison of profiles with the in silico approach is facilitated by a numerical comparison of the sizes of the fragments and the knowledge of the associated loci. The in silico approach also offers the possibility to choose other restriction sites used for RFLP such as RFLP based on PstI or PvuII sites that have been used in the past (Pavlik et al., 1999; Stevenson et al., 2002; Mobius et al., 2009). The primary limitation of this analysis is the requirement of complete genome sequences. Although sequencing technologies have vastly improved the speed and cost of whole genome sequencing, this still must be acknowledged as a major hurdle to full adaptation of this in silico method. Nonetheless, accurate in silico RFLP profiles will continue to be developed with each new genome sequence and this will facilitate direct comparisons to newly isolated strains that are not sequenced but are only analyzed by traditional RFLP Southern blot.
This study, using the complete genomes, provided an opportunity to ascertain the degree of conservation of the IS900 sequence across the different Map types. Previous reports, performed on the basis of PCR fragment sequencing, had revealed the existence of type-specific SNP polymorphisms (Semret et al., 2006; Castellanos et al., 2009). Here using the alignment of the sequences of all the IS900 sites on the three genomes, i.e., 58 individual copies, we have confirmed and clarified the distribution of these SNPs. We have verified that for position 169, the 19 copies of the subtype III strain have a C-T mutation which distinguishes it from subtype I and C-type, which is congruent with the report of Castellanos et al. (2009). Position 216 also exhibits A-G polymorphism in the genome of subtype I and III strains, but only at certain loci. This explains why in previous analysis by sequencing of IS900 PCR fragments, the results were ambiguous. This report reveals for the first time the existence of a new polymorphic site at position 1406 (T-G), which is only present on eight loci subtype I. Altogether these results show that the sequence of IS900 remains extremely conserved and that the SNP polymorphism can define three sequevars distinguishing between S- and C-type and even subtypes I and III. These SNPs could be associated with the kinetics of IS900 expansion in Map.
In addition to knowing the distribution of IS900 copies present in each Map genome, we identified and analyzed their insertion site, initially partially studied (Bull et al., 2000), in order to study the expansion features of this IS and to investigate whether IS900 could play a role in the genomic evolution of Map. This report showed that the distribution of IS900 mainly concerns orthologous loci despite a non-conserved synteny for the genomes of the three types (Bannantine et al., 2020; Wibberg et al., 2020). Interestingly, the S397 genome does not have a specific IS900 locus, unlike K-10 or Telford, which have two and three specific loci, respectively. Although these results have been confirmed on all complete Map genomes available (including 175 sequences of IS900 aligned see Supplementary Table 3), these analyses could easily be extended to all future Map genome sequences.
The study of the genes surrounding each copy of IS900 was undertaken to determine if the sites impacted might lead to complete loss or modulation of functional genes and pathways. According to our analysis, the insertion of IS900 was stealthy and did not have a significant impact on gene function, since only a total of three disrupted genes were identified. Interestingly, 51 IS900 insertion sites are outside coding sequences where the consequences of insertions are more difficult to predict. The GO analysis was performed to determine what type of genes are adjacent to IS900 sites. Besides the large function unknown GO category, results suggest that insertions most frequently occurred in transcription, replication, recombination and repair processes, lipid transport and metabolism or secondary metabolites biosynthesis, transport and catabolism. The enriched pathways associated with lipid transport might modulate the cell wall biosynthesis, which is a particularity in Map and type-specific by production of various lipopeptides exposed in outer membrane of the cell wall of Map (Bannantine et al., 2017).
This study shows that the distribution of IS900 has the potential to provide new insight into Map genome evolution, which is linked to the phylogenomic data that distinguishes sheep and cattle lineages and the subtypes. Our observations raise many questions, on the dynamics of transposition of IS900, about the significance of the abundance of this IS, a fossil record of Map evolutionary dynamics combined with periods of intense transpositional activity. Is there a positive correlation between copy number and host adaptation? Could it be possible that Map has maintained copies of this IS to enhance its ability to infect its hosts via a similar evolution strategy to that employed by IS6110 in TB complex bacteria (Aravin et al., 2007)? Does IS900 somehow contribute to mycobactin dependency for in vitro growth? For all these questions, whole genome sequencing opens up many perspectives on our understanding of the role of IS900 on the particularities of this ruminant pathogen.
Data Availability Statement
The datasets presented in this study can be found in online repositories. The names of the repository/repositories and accession number(s) can be found below: https://www.ncbi.nlm.nih.gov/genbank/, NZ_CP033688.1; https://www.ncbi.nlm.nih.gov/genbank/, NC_002944.2; and https://www.ncbi.nlm.nih.gov/genbank/, NZ_CP053749.1.
Author Contributions
FB and JB conceived and designed the study. All authors made substantial contributions to the analysis and writing of the manuscript.
Funding
This study was funded by the USDA-Agricultural Research Service and by INRAE.
Conflict of Interest
The authors declare that the research was conducted in the absence of any commercial or financial relationships that could be construed as a potential conflict of interest.
Acknowledgments
We are grateful to the INRAE MIGALE bioinformatics facility (MIGALE, INRAE, 2020, Migale bioinformatics Facility, doi: 10.15454/1.5572390655343293E12
Supplementary Material
The Supplementary Material for this article can be found online at: https://www.frontiersin.org/articles/10.3389/fmicb.2021.660002/full#supplementary-material
Supplementary Figure 1 | IS900, highly conserved sequence across all three lineages. Alignment of the IS900 sequences of the 58 loci identified in the three genomes K10, Telford and S397. On the left is the name of the genome and the number of each loci of the IS900. SNP positions are indicated by a yellow arrow and blue or black letters.
Supplementary Figure 2 | MEME motif of putative IS900 insertion site extract from Mah 104 genome. Upstream and downstream region extracted from K-10, S397, and Telford genomes were aligned to the Mah 104 genome to find orthologous loci. Sequence of 14 to 17 bp present at conserved orthologous loci in the Mah 104 genome were extracted and MEME was used to discover conserved motif.
Supplementary Figure 3 | Detail of the genes surrounding all the IS900 loci. Representation of IS900 loci environment. Gene present 7500-bp upstream and downstream of each IS900 copies were considered. Gray box represents blastn IS900 hits. Presence of hed gene was indicated when a RBS was found upstream the gene (symbolized by a chevron). The first genes upstream and downstream IS900 copies were color filled according to their COG functional categories. Pseudo genes were indicated in black.
Supplementary Table 1 | Detail of all orthologous loci.
Supplementary Table 2 | IS900 orthologous sites and orthologous loci between the three Map genomes.
Supplementary Table 3 | IS900 orthologous analysis across all complete genomes.
Footnotes
References
Altschul, S. F., Gish, W., Miller, W., Myers, E. W., and Lipman, D. J. (1990). Basic local alignment search tool. J. Mol. Biol. 215, 403–410. doi: 10.1016/S0022-2836(05)80360-2
Aravin, A. A., Hannon, G. J., and Brennecke, J. (2007). The Piwi-piRNA pathway provides an adaptive defense in the transposon arms race. Science 318, 761–764. doi: 10.1126/science.1146484
Bailey, T. L., and Elkan, C. (1994). Fitting a mixture model by expectation maximization to discover motifs in biopolymers. Proc. Int. Conf. Intell Syst. Mol. Biol. 2, 28–36.
Bannantine, J. P., Bayles, D. O., and Biet, F. (2021). Complete genome sequence of a Type III ovine strain of mycobacterium avium subsp. paratuberculosis. Microbiol. Resour. Announc. 10, e01480–e01520. doi: 10.1128/MRA.01480-20
Bannantine, J. P., Conde, C., Bayles, D. O., Branger, M., and Biet, F. (2020). Genetic diversity among mycobacterium avium subspecies revealed by analysis of complete genome sequences. Front. Microbiol. 11:1701. doi: 10.3389/fmicb.2020.01701
Bannantine, J. P., Etienne, G., Laval, F., Stabel, J. R., Lemassu, A., Daffe, M., et al. (2017). Cell wall peptidolipids of Mycobacterium avium: from genetic prediction to exact structure of a nonribosomal peptide. Mol. Microbiol. 105, 525–539. doi: 10.1111/mmi.13717
Bannantine, J. P., Li, L. L., Sreevatsan, S., and Kapur, V. (2013). How does a Mycobacterium change its spots? Applying molecular tools to track diverse strains of Mycobacterium avium subspecies paratuberculosis. Lett. Appl. Microbiol. 57, 165–173. doi: 10.1111/lam.12109
Bannantine, J. P., Wu, C. W., Hsu, C., Zhou, S., Schwartz, D. C., Bayles, D. O., et al. (2012). Genome sequencing of ovine isolates of Mycobacterium avium subspecies paratuberculosis offers insights into host association. BMC Genomics 13:89. doi: 10.1186/1471-2164-13-89
Barkema, H. W., Hesselink, J. W., McKenna, S. L. B., Benedictus, G., and Groenendaal, H. (2010). “Global prevalence and economics of infection with Mycobacterium avium subsp. paratuberculosis in ruminants,” in Paratuberculosis: Organism, Disease, Control, eds M. A. Behr and D. M. Collins (Oxfordshire: Wallingford), 10–21.
Biet, F., Sevilla, I. A., Cochard, T., Lefrancois, L. H., Garrido, J. M., Heron, I., et al. (2012). Inter- and intra-subtype genotypic differences that differentiate Mycobacterium avium subspecies paratuberculosis strains. BMC Microbiol. 12:264. doi: 10.1186/1471-2180-12-264
Brauning, R., Plain, K., Gautam, M., Russell, T., Correa, C. C., Biggs, P., et al. (2019). Complete genome sequence of the telford Type S strain of mycobacterium avium subsp. paratuberculosis. Microbiol. Resour. Announc. 8, e00004–e00019. doi: 10.1128/MRA.00004-19
Bryant, J. M., Thibault, V. C., Smith, D. G., McLuckie, J., Heron, I., Sevilla, I. A., et al. (2016). Phylogenomic exploration of the relationships between strains of Mycobacterium avium subspecies paratuberculosis. BMC Genomics 17:79. doi: 10.1186/s12864-015-2234-5
Buchfink, B., Xie, C., and Huson, D. H. (2015). Fast and sensitive protein alignment using DIAMOND. Nat. Methods 12, 59–60. doi: 10.1038/nmeth.3176
Bull, T. J., Hermon-Taylor, J., Pavlik, I., El-Zaatari, F., and Tizard, M. (2000). Characterization of IS900 loci in Mycobacterium avium subsp. paratuberculosis and development of multiplex PCR typing. Microbiology (Reading) 146(Pt 9), 2185–2197. doi: 10.1099/00221287-146-9-2185
Carver, T., Berriman, M., Tivey, A., Patel, C., Bohme, U., Barrell, B. G., et al. (2008). Artemis and ACT: viewing, annotating and comparing sequences stored in a relational database. Bioinformatics 24, 2672–2676. doi: 10.1093/bioinformatics/btn529
Castellanos, E., Aranaz, A., de Juan, L., Alvarez, J., Rodriguez, S., Romero, B., et al. (2009). Single nucleotide polymorphisms in the IS900 sequence of Mycobacterium avium subsp. paratuberculosis are strain type specific. J. Clin. Microbiol. 47, 2260–2264. doi: 10.1128/JCM.00544-09
Choy, E., Whittington, R. J., Marsh, I., Marshall, J., and Campbell, M. T. (1998). A method for purification and characterisation of Mycobacterium avium subsp. paratuberculosis from the intestinal mucosa of sheep with Johne’s disease. Vet. Microbiol. 64, 51–60. doi: 10.1016/s0378-1135(98)00252-1
Cochard, T., Branger, M., Supply, P., Sreevatsan, S., and Biet, F. (2020). MAC-INMV-SSR: a web application dedicated to genotyping members of Mycobacterium avium complex (MAC) including Mycobacterium avium subsp. paratuberculosis strains. Infect. Genet. Evol. 77:104075. doi: 10.1016/j.meegid.2019.104075
Cock, P. J., Antao, T., Chang, J. T., Chapman, B. A., Cox, C. J., Dalke, A., et al. (2009). Biopython: freely available Python tools for computational molecular biology and bioinformatics. Bioinformatics 25, 1422–1423. doi: 10.1093/bioinformatics/btp163
Collins, D. M., Cavaignac, S., and de Lisle, G. W. (1997). Use of four DNA insertion sequences to characterize strains of the Mycobacterium avium complex isolated from animals. Mol. Cell Probes 11, 373–380. doi: 10.1006/mcpr.1997.0131
Corpet, F. (1988). Multiple sequence alignment with hierarchical clustering. Nucleic Acids Res. 16, 10881–10890. doi: 10.1093/nar/16.22.10881
Darling, A. C., Mau, B., Blattner, F. R., and Perna, N. T. (2004). Mauve: multiple alignment of conserved genomic sequence with rearrangements. Genome Res. 14, 1394–1403. doi: 10.1101/gr.2289704
Darling, A. E., Mau, B., and Perna, N. T. (2010). progressiveMauve: multiple genome alignment with gene gain, loss and rearrangement. PLoS One 5:e11147. doi: 10.1371/journal.pone.0011147
Doran, T., Tizard, M., Millar, D., Ford, J., Sumar, N., Loughlin, M., et al. (1997). IS900 targets translation initiation signals in Mycobacterium avium subsp. paratuberculosis to facilitate expression of its hed gene. Microbiology (Reading) 143(Pt 2), 547–552. doi: 10.1099/00221287-143-2-547
England, P. M., Wall, S., and McFadden, J. (1991). IS900-promoted stable integration of a foreign gene into mycobacteria. Mol. Microbiol. 5, 2047–2052. doi: 10.1111/j.1365-2958.1991.tb00827.x
Gonzalo-Asensio, J., Perez, I., Aguilo, N., Uranga, S., Pico, A., Lampreave, C., et al. (2018). New insights into the transposition mechanisms of IS6110 and its dynamic distribution between Mycobacterium tuberculosis Complex lineages. PLoS Genet. 14:e1007282. doi: 10.1371/journal.pgen.1007282
Green, E. P., Tizard, M. L., Moss, M. T., Thompson, J., Winterbourne, D. J., McFadden, J. J., et al. (1989). Sequence and characteristics of IS900, an insertion element identified in a human Crohn’s disease isolate of Mycobacterium paratuberculosis. Nucleic Acids Res. 17, 9063–9073. doi: 10.1093/nar/17.22.9063
Huerta-Cepas, J., Forslund, K., Coelho, L. P., Szklarczyk, D., Jensen, L. J., von Mering, C., et al. (2017). Fast genome-wide functional annotation through orthology assignment by eggNOG-Mapper. Mol. Biol. Evol. 34, 2115–2122. doi: 10.1093/molbev/msx148
Huerta-Cepas, J., Szklarczyk, D., Heller, D., Hernandez-Plaza, A., Forslund, S. K., Cook, H., et al. (2019). eggNOG 5.0: a hierarchical, functionally and phylogenetically annotated orthology resource based on 5090 organisms and 2502 viruses. Nucleic Acids Res. 47, D309–D314. doi: 10.1093/nar/gky1085
Janagama, H. K., Senthilkumar, T. M., Bannantine, J. P., Rodriguez, G. M., Smith, I., Paustian, M. L., et al. (2009). Identification and functional characterization of the iron-dependent regulator (IdeR) of Mycobacterium avium subsp. paratuberculosis. Microbiology 155(Pt 11), 3683–3690. doi: 10.1099/mic.0.031948-0
Lefrancois, L. H., Bodier, C. C., Cochard, T., Canepa, S., Raze, D., Lanotte, P., et al. (2013). Novel feature of Mycobacterium avium subsp. paratuberculosis, highlighted by characterization of the heparin-binding hemagglutinin adhesin. J. Bacteriol. 195, 4844–4853. doi: 10.1128/JB.00671-13
Li, L., Bannantine, J. P., Campo, J. J., Randall, A., Grohn, Y. T., Schilling, M. A., et al. (2019). Identification of sero-diagnostic antigens for the early diagnosis of Johne’s Disease using MAP protein microarrays. Sci. Rep. 9:17573. doi: 10.1038/s41598-019-53973-x
Li, L., Bannantine, J. P., Zhang, Q., Amonsin, A., May, B. J., Alt, D., et al. (2005). The complete genome sequence of Mycobacterium avium subspecies paratuberculosis. Proc. Natl. Acad. Sci. U.S.A. 102, 12344–12349. doi: 10.1073/pnas.0505662102
Mobius, P., Fritsch, I., Luyven, G., Hotzel, H., and Kohler, H. (2009). Unique genotypes of Mycobacterium avium subsp. paratuberculosis strains of Type III. Vet. Microbiol. 139, 398–404. doi: 10.1016/j.vetmic.2009.06.011
Moran, N. A., and Plague, G. R. (2004). Genomic changes following host restriction in bacteria. Curr. Opin. Genet. Dev. 14, 627–633. doi: 10.1016/j.gde.2004.09.003
Nesmelova, I. V., and Hackett, P. B. (2010). DDE transposases: structural similarity and diversity. Adv. Drug Deliv. Rev. 62, 1187–1195. doi: 10.1016/j.addr.2010.06.006
O’Leary, N. A., Wright, M. W., Brister, J. R., Ciufo, S., Haddad, D., McVeigh, R., et al. (2016). Reference sequence (RefSeq) database at NCBI: current status, taxonomic expansion, and functional annotation. Nucleic Acids Res. 44, D733–D745. doi: 10.1093/nar/gkv1189
Pavlik, I., Horvathova, A., Dvorska, L., Bartl, J., Svastova, P., du Maine, R., et al. (1999). Standardisation of restriction fragment length polymorphism analysis for Mycobacterium avium subspecies paratuberculosis. J. Microbiol. Methods 38, 155–167. doi: 10.1016/s0167-7012(99)00091-3
Rathnaiah, G., Zinniel, D. K., Bannantine, J. P., Stabel, J. R., Grohn, Y. T., Collins, M. T., et al. (2017). Pathogenesis, molecular genetics, and genomics of mycobacterium avium subsp. paratuberculosis, the etiologic agent of Johne’s disease. Front. Vet. Sci. 4:187. doi: 10.3389/fvets.2017.00187
Semret, M., Turenne, C. Y., and Behr, M. A. (2006). Insertion sequence IS900 revisited. J. Clin. Microbiol. 44, 1081–1083. doi: 10.1128/JCM.44.3.1081-1083.2006
Stevenson, K. (2015). Genetic diversity of mycobacterium avium subspecies paratuberculosis and the influence of strain type on infection and pathogenesis: a review. Vet. Res. 46:64. doi: 10.1186/s13567-015-0203-2
Stevenson, K., Hughes, V. M., de Juan, L., Inglis, N. F., Wright, F., and Sharp, J. M. (2002). Molecular characterization of pigmented and nonpigmented isolates of Mycobacterium avium subsp. paratuberculosis. J. Clin. Microbiol. 40, 1798–1804.
Tatusova, T., DiCuccio, M., Badretdin, A., Chetvernin, V., Nawrocki, E. P., Zaslavsky, L., et al. (2016). NCBI prokaryotic genome annotation pipeline. Nucleic Acids Res. 44, 6614–6624. doi: 10.1093/nar/gkw569
Taylor, A. W. (1951). Varieties of Mycobacterium johnei isolated from sheep. J. Pathol. Bacteriol. 63, 333–336.
Thibault, V. C., Grayon, M., Boschiroli, M. L., Hubbans, C., Overduin, P., Stevenson, K., et al. (2007). New variable-number tandem-repeat markers for typing Mycobacterium avium subsp. paratuberculosis and M. avium strains: comparison with IS900 and IS1245 restriction fragment length polymorphism typing. J. Clin. Microbiol. 45, 2404–2410. doi: 10.1128/JCM.00476-07
Tizard, M. L., Moss, M. T., Sanderson, J. D., Austen, B. M., and Hermon-Taylor, J. (1992). p43, the protein product of the atypical insertion sequence IS900, is expressed in Mycobacterium paratuberculosis. J. Gen. Microbiol. 138(Pt 8), 1729–1736. doi: 10.1099/00221287-138-8-1729
Toft, C., and Andersson, S. G. (2010). Evolutionary microbial genomics: insights into bacterial host adaptation. Nat. Rev. Genet. 11, 465–475. doi: 10.1038/nrg2798
Turenne, C. Y., Collins, D. M., Alexander, D. C., and Behr, M. A. (2008). Mycobacterium avium subsp. paratuberculosis and M. avium subsp. avium are independently evolved pathogenic clones of a much broader group of M. avium organisms. J. Bacteriol. 190, 2479–2487. doi: 10.1128/JB.01691-07
Uchiya, K. I., Tomida, S., Nakagawa, T., Asahi, S., Nikai, T., and Ogawa, K. (2017). Comparative genome analyses of Mycobacterium avium reveal genomic features of its subspecies and strains that cause progression of pulmonary disease. Sci. Rep. 7:39750. doi: 10.1038/srep39750
Whittington, R., Donat, K., Weber, M. F., Kelton, D., Nielsen, S. S., Eisenberg, S., et al. (2019). Control of paratuberculosis: who, why and how. A review of 48 countries. BMC Vet. Res. 15:198. doi: 10.1186/s12917-019-1943-4
Whittington, R. J., Hope, A. F., Marshall, D. J., Taragel, C. A., and Marsh, I. (2000). Molecular epidemiology of Mycobacterium avium subsp. paratuberculosis: IS900 restriction fragment length polymorphism and IS1311 polymorphism analyses of isolates from animals and a human in Australia. J. Clin. Microbiol. 38, 3240–3248. doi: 10.1128/JCM.38.9.3240-3248.2000
Wibberg, D., Price-Carter, M., Ruckert, C., Blom, J., and Mobius, P. (2020). Complete genome sequence of ovine mycobacterium avium subsp. paratuberculosis Strain JIII-386 (MAP-S/type III) and its comparison to MAP-S/type I, MAP-C, and M. avium complex genomes. Microorganisms 9:70. doi: 10.3390/microorganisms9010070
Keywords: Mycobacterium avium subsp. paratuberculosis, insertion sequence IS900, evolution, RFLP, complete genome
Citation: Conde C, Price-Carter M, Cochard T, Branger M, Stevenson K, Whittington R, Bannantine JP and Biet F (2021) Whole-Genome Analysis of Mycobacterium avium subsp. paratuberculosis IS900 Insertions Reveals Strain Type-Specific Modalities. Front. Microbiol. 12:660002. doi: 10.3389/fmicb.2021.660002
Received: 28 January 2021; Accepted: 07 April 2021;
Published: 10 May 2021.
Edited by:
Filipa F. Vale, University of Lisbon, PortugalReviewed by:
Felipe Luiz Pereira, Instituto Federal Catarinense, BrazilMostafa Y. Abdel-Glil, Institute of Bacterial Infections and Zoonoses, Friedrich Loeffler Institute, Germany
Copyright © 2021 Conde, Price-Carter, Cochard, Branger, Stevenson, Whittington, Bannantine and Biet. This is an open-access article distributed under the terms of the Creative Commons Attribution License (CC BY). The use, distribution or reproduction in other forums is permitted, provided the original author(s) and the copyright owner(s) are credited and that the original publication in this journal is cited, in accordance with accepted academic practice. No use, distribution or reproduction is permitted which does not comply with these terms.
*Correspondence: John P. Bannantine, am9obi5iYW5uYW50aW5lQHVzZGEuZ292; Franck Biet, ZnJhbmNrLmJpZXRAaW5yYWUuZnI=
†These authors have contributed equally to this work