- 1Institute of Plant Quarantine, Chinese Academy of Inspection and Quarantine, Beijing, China
- 2Biowavelet Ltd., Chongqing, China
- 3Department of Insects, School of Plant Protection, China Agricultural University, Beijing, China
Microbial communities in insects are related to their geographical sources and contribute to adaptation to the local habitat. The Colorado potato beetle (Leptinotarsa decemlineata) (CPB) is a potato pest that causes serious economic losses in Xinjiang Uygur Autonomous Region (XJ) and Heilongjiang Province (HL), China. The influence of microorganisms in the invasion and dispersal of CPB is unclear. We studied microbial communities of CPB collected from nine geographic sources in China using high throughput sequencing technology. Bacteroidetes, Firmicutes, and Proteobacteria were the most dominant phyla, Clostridia, Bacteroidetes, and γ-Proteobacteria were the most dominant classes, Enterobacterales, Lactobacillales, Clostridiales, and Bacteroidales were the most dominant orders, and Enterobacteriaceae, Streptococcidae, Verrucomicrobiaceae, and Rikenellaceae were the most dominant families. There were significant differences, among sources, in the relative abundance of taxa at the genus level. A total of 383 genera were identified, and the dominant bacteria at the genus level were compared between XJ and HL. Pseudomonas was the unique dominant microorganism in the HL area, and the other four microorganisms (Lelliottia, Enterococcus, Enterobacter, and Lactococcus) were common within the 2 regions. Bacterial community diversity in CPB from Urumqi, Jimunai, and Wenquan was higher than diversity in other regions. T-Distributed Stochastic Neighbor Embedding (tSNE) analysis indicated that order and genus were appropriate taxonomic levels to distinguish geographical sources of CPB. These findings provide insight into the diversity of microorganisms of CPB in the differences among geographically isolated populations.
Introduction
Insects and microorganisms have evolved mutually beneficial relationships. Many microorganisms colonize the digestive tract and contribute to growth and development, nutrient metabolism, reproduction, immunity, pesticide resistance, and communication between hosts (Crotti et al., 2012). Extrinsic factors can affect the composition of the gut microbiota. Environmental factors and food type can also affect the composition of the gut microbiota. Honey bees from colonies in different habitats can have significantly different gut microbiota. The gut microbial community of bees foraging on rapeseed crops and bees not feeding on these crops differs (Jones et al., 2018). The composition and diversity of gut microbiota in different geographical populations of the Dark Gill Scarab (Holotrichia parallela) differ. This may be related to environmental factors, such as rainfall, temperature, and soil pH (Huang et al., 2012).
The Colorado potato beetle (CPB), Leptinotarsa decemlineata (Say), Coleoptera, Chrysomelidae) is a major pest of potatoes. It is native to the Rocky Mountains of North America and is now distributed worldwide (Hare, 1990; Alyokhin et al., 2008; Alyokhin, 2009). In China, CPB was first discovered in Xinjiang Uygur Autonomous Region in 1993 (Zhang, 1994; Wang et al., 2010). It is now found throughout Xinjiang Uygur Autonomous Region (XJ) and some areas of Heilongjiang Province (HL) where it causes serious economic losses (Guo et al., 2014, 2017).
Variable geographical conditions can divide insect distributions into different populations or ecological types. The differences among these geographical populations can involve ecological adaptability, resistance, and physiology (Tu et al., 2015; Xia et al., 2018). For example, the life history of the green peach aphid [Myzus persicae (Sulzer)] in China varies in different regions. M. persicae in the north is holometabolous, while in the south it displays incomplete metamorphosis, and both in the central region (Yang and Zhang, 1997). Ostrinia furnacalis does not diapause in the tropics, but the last seasonal generation of mature larvae diapauses during winter in temperate and subtropical regions (Tu et al., 2015). The adult weight and pupal weight of Tribolium castaneum gradually decrease from high latitudes to low latitudes. CPB develops faster in the short days than in the long days, and its pupa in the short-lighted areas is larger than that in the long-lighted areas (Dolezal et al., 2007). These examples demonstrate that the growth and development of insect species is related to their geographical location.
Host plant differences can influence gut bacterial communities and the symbiotic bacteria can help CPB adapt to host plants and can affect the interactions with other microorganisms such as nematodes (Michael et al., 2008; Chung et al., 2017). Gut microbiota may change within a relatively short time for species invading new areas (Berasategui et al., 2016), and gut microbiota can be used as a label for environmental conditions. However, there are no reports on the relationship between geographical sources and gut microbial diversity. Current studies of geographical sources mainly use genetic tests such as DNA barcode technology (Smith et al., 2008; Kress et al., 2015), restriction fragment length polymorphisms (RFLPs) (Tan et al., 2001), and single nucleotide polymorphisms (SNPs) (Lü et al., 2013). All of these methods are based on gene flow between populations. They require several generations of insects to complete, and they cannot trace the sources of an individual insect within a short time interval. The technology of 16S rDNA gene sequencing is useful for microbial identification, but it has not been used for comparing the microbial communities of different geographic populations of the CPB. In this study, we used 16S rDNA gene sequencing to evaluate the geographical variation of CPB reflected by its bacterial communities. Microbial diversity analysis methods were screened and examined for their potential to provide new ideas for using geographical origin methods. This study helps to illustrate the mechanisms of CPB invasion and adaptation by revealing the microbial community differences in different regions.
Materials and Methods
Samples Preparation
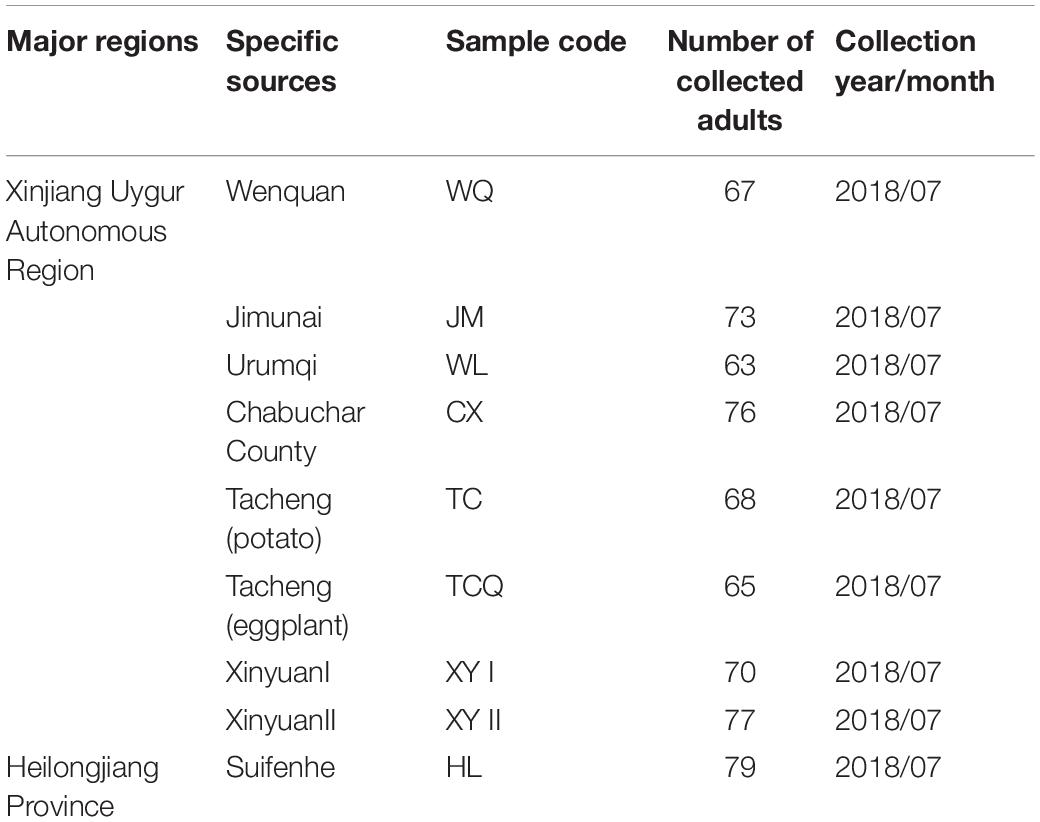
CPB adults were collected from Wenquan County, Chabuchar County, Jimunai County, and Urumqi of the Xinjiang Uygur Autonomous Region (XJ), and Suifenhe City of Heilongjiang Province (HL), China. All adults were collected in potato field. These five sources were taken as five samples. Furthermore, In Tacheng City of XJ, CPB beetles were collected in two areas 1 km apart and they were regarded as two samples. In Xinyuan County of XJ, CPB from different host plants (potato and eggplant) in the same area were taken as two samples. There were nine samples in total. Detailed information related to each sample is shown in Table 1. At least 20 live CPBs of each sample were collected. Each samples was split into six subsamples of two beetles each. The subsamples were used for sequencing as described below.
DNA Extraction, 16S rDNA Gene Amplification, and Sequencing
After the body surface was sterilized by 75% ethanol, two CPB adults from each source were pooled and subjected to genomic DNA extraction with the Fast DNA Stool Mini Kit (Qiagen). DNA quantity and quality were determined on 1% agarose gel. They were measured with a Nanodrop, and this was used as a template for PCR amplification. A total of 2 μg genomic DNA was used to amplify the 16S V3-V4 fragments using the primers (341F: 5′-CCTAYGGGRBGCASCAG-3′ and 806R: 5′-GGACTACNNGGGTATCTAAT-3′) by RT-PCR. The RT-PCR conditions included a denaturing step at 95°C for 5 min, followed by 20 cycles of 98°C for 20 s, 52°C for 30 s, 72°C for 30 s, and a final step of 5 min at 72°C. The PCR products were used to construct the libraries, and they were sequenced on an Ion Torrent S5^TM XL platform.
Quality Control and Taxonomy Assignment
Single-end reads were assigned to subsamples based on their unique barcode and truncated by cutting off the barcode and primer sequence. Quality filtering on the raw reads was performed under specific filtering conditions to obtain high-quality clean reads according to the Cut adapt (V1.9.1) quality control process (Martin, 2011). The reads were compared with a reference database (Silva database) using the UCHIME algorithm to detect chimera sequences, and the chimera sequences were removed (Edgar et al., 2011; Haas et al., 2011; Quast et al., 2013). The clean reads were then obtained.
Phylogenetics
To study the phylogenetic relationships of different OTUs and the differences among the dominant species in different samples, multiple sequence alignments were conducted using MUSCLE software (Version 3.8.31).
Data Analysis and Visualization
Clean reads were assigned into a microbe taxa table applying workflow, pick_closed_reference_otus.py, in QIIME v1.91 using the Greengenes_13_5 database. The Shannon, Simpson, Chao1, and PD whole tree indices were calculated using script, alpha_diversity.py, in QIIME v1.91. Beta diversity, based on both weighted and unweighted unifrac, was calculated by QIIME v1.91. Principal Coordinate Analysis (PCoA) was performed to obtain principal coordinates and visualize the complex, multidimensional data.
The composition of the bacterial community was calculated and displayed in R v3.5.1 using relative abundance at the phylum, class, order, family, and genus level. Relative abundance was normalized by log function before performing tSNE (t-Distributed Stochastic Neighbor Embedding) analysis with the Rtsne v0.15 package. Heatmap analysis was performed with the pheatmap v1.0.10 package at the Order and Genus levels using normalized relative abundance. LEfse v1.0.8 software was used to perform lefse analysis on relative abundance. The abundance differences of the marker bacteria in each group are shown in the bar plots.
Results
Sample Collection and DNA Extraction
A total of 638 CPB were collected from nine sources located in the XJ and HL areas (Figure 1). The sites were Wenquan (WQ), Tacheng (potato) (TC), Tacheng (eggplant) (TCQ), Chabuchar County (CX), Xinyuan (XYI), Xinyuan (XYII), Jimunai (JM), Urumqi (WL), and Suifenhe (Heilongjiang Province, HL). The collection information and quantity of CPB were shown in Table 1. Nine samples, six times for each sample, and a total of 54 subsamples were divided and subjected to 16S rDNA sequencing.
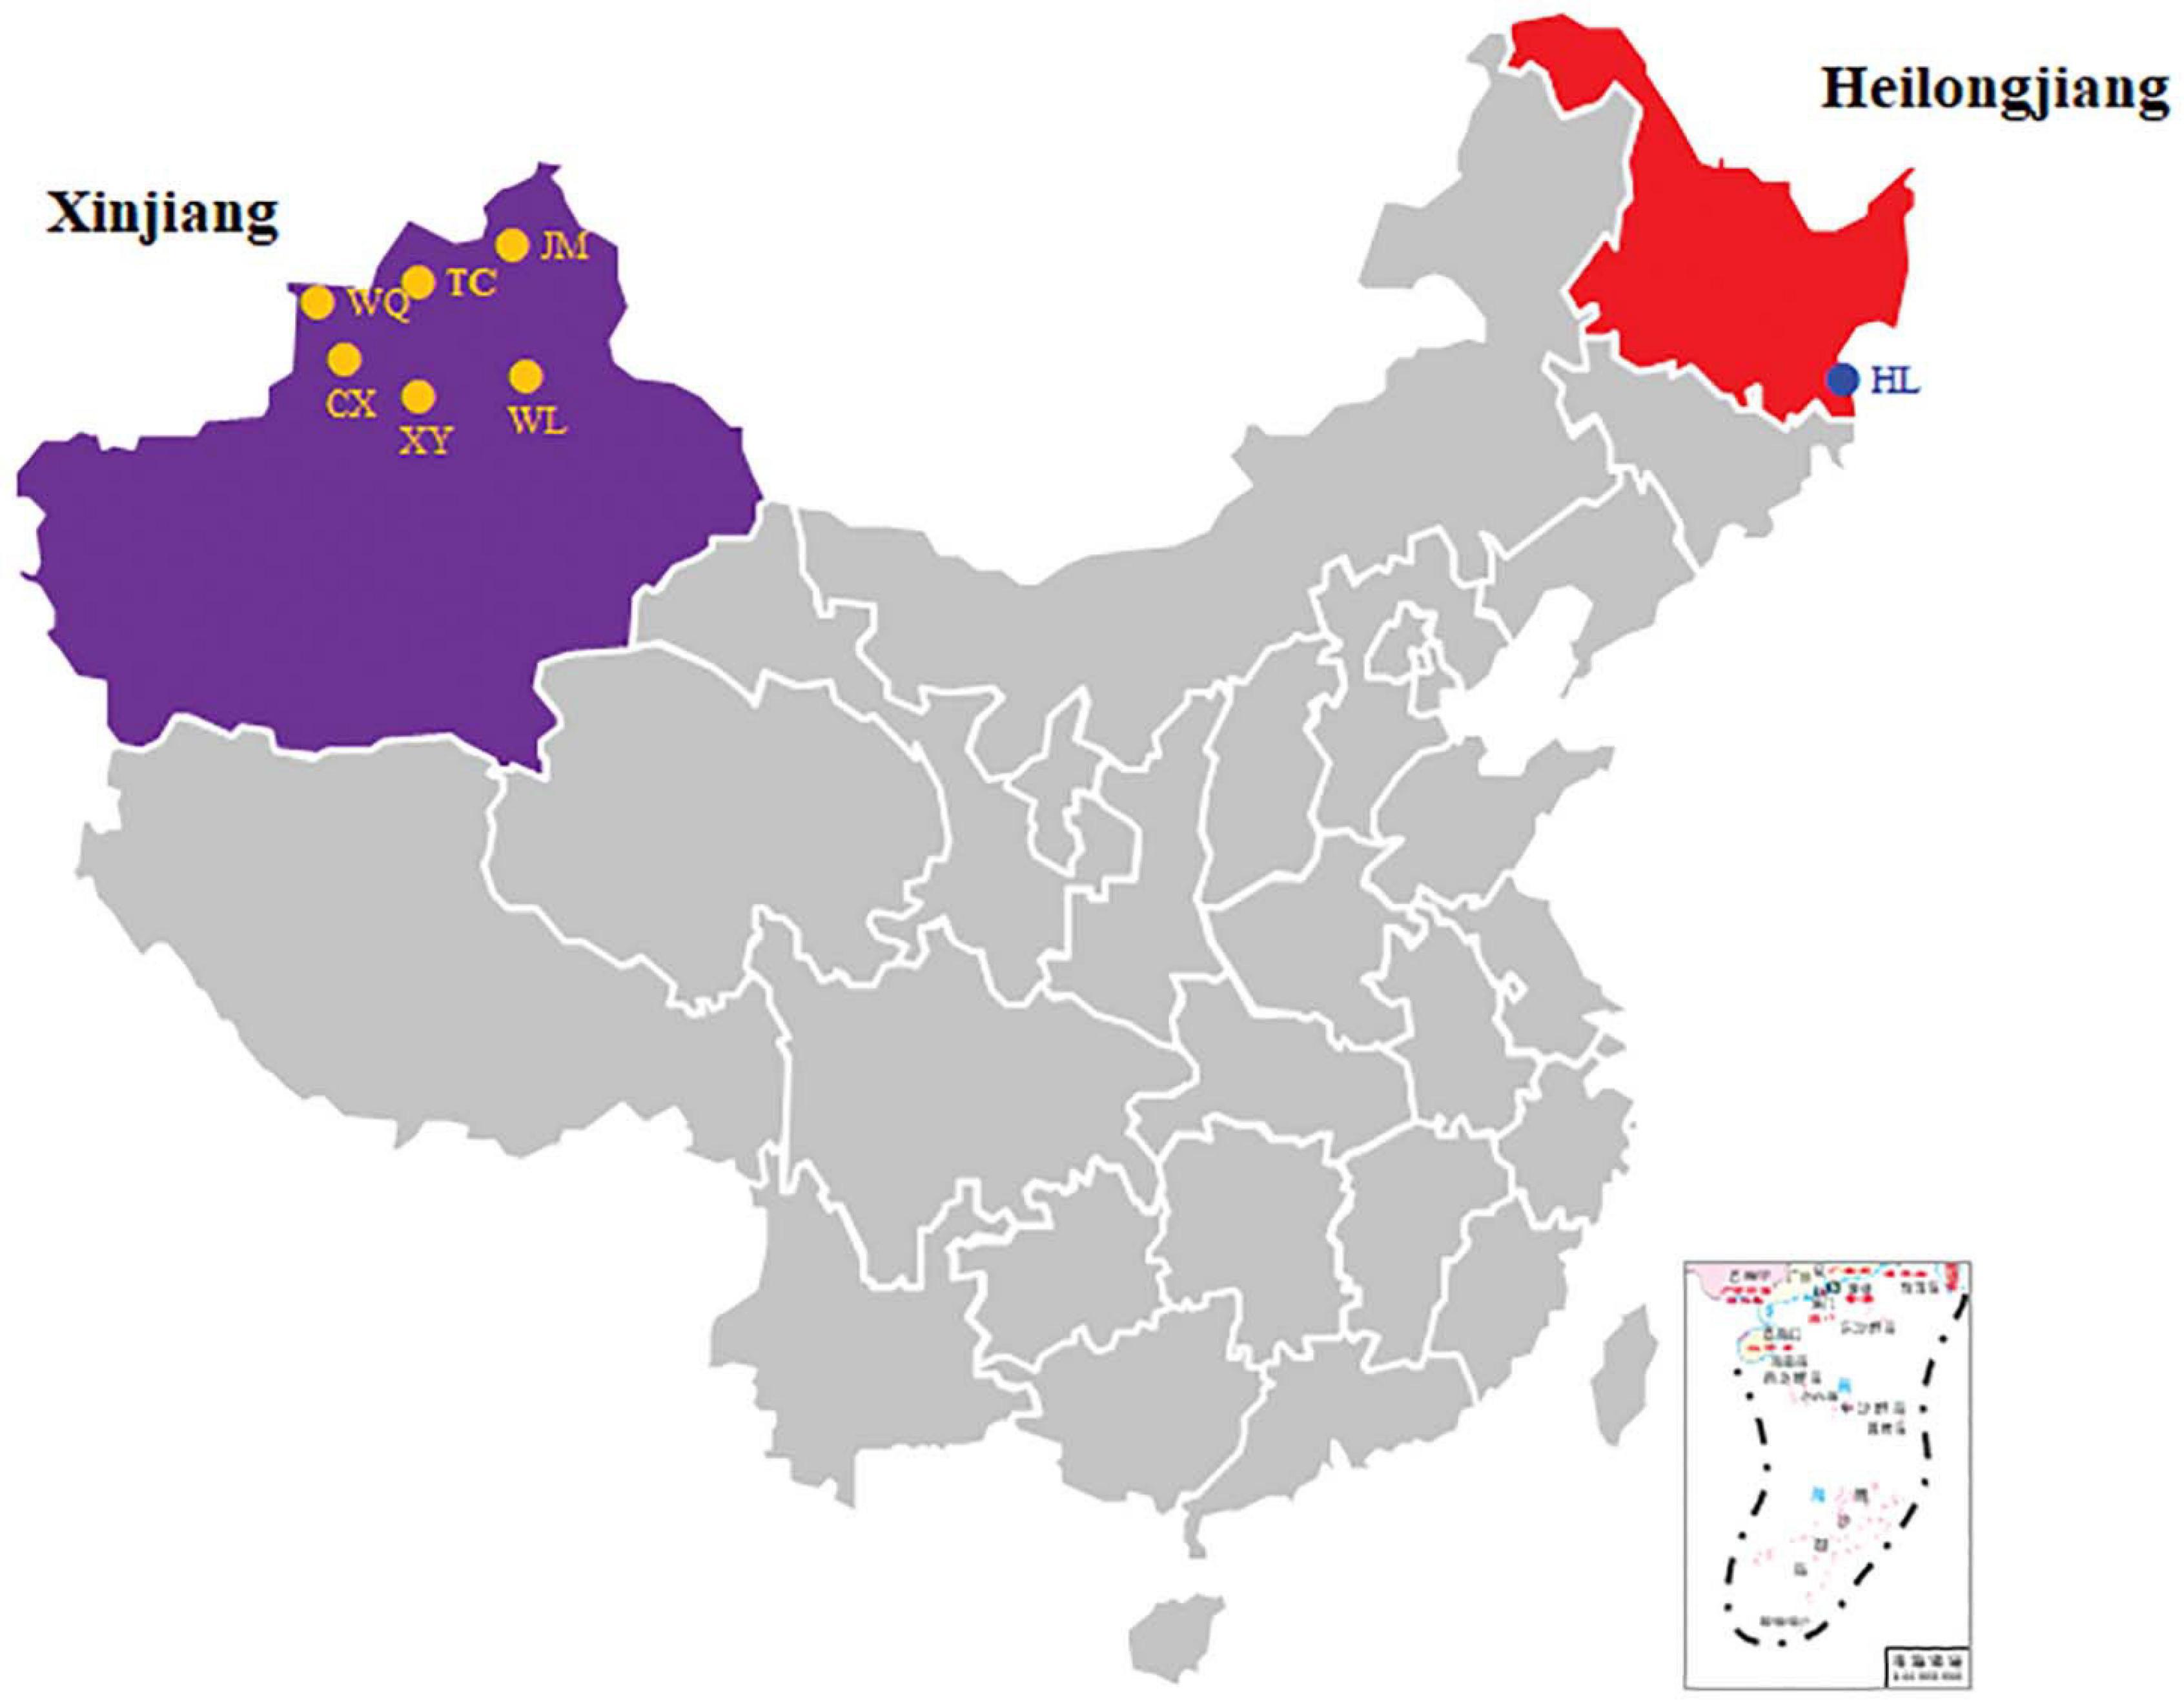
Figure 1. Sampling sites of CPB. The sampling sites are shown in a map of China, and the two main collection areas are indicated by different colors.
Sequencing and Analysis of Microbiota Diversity
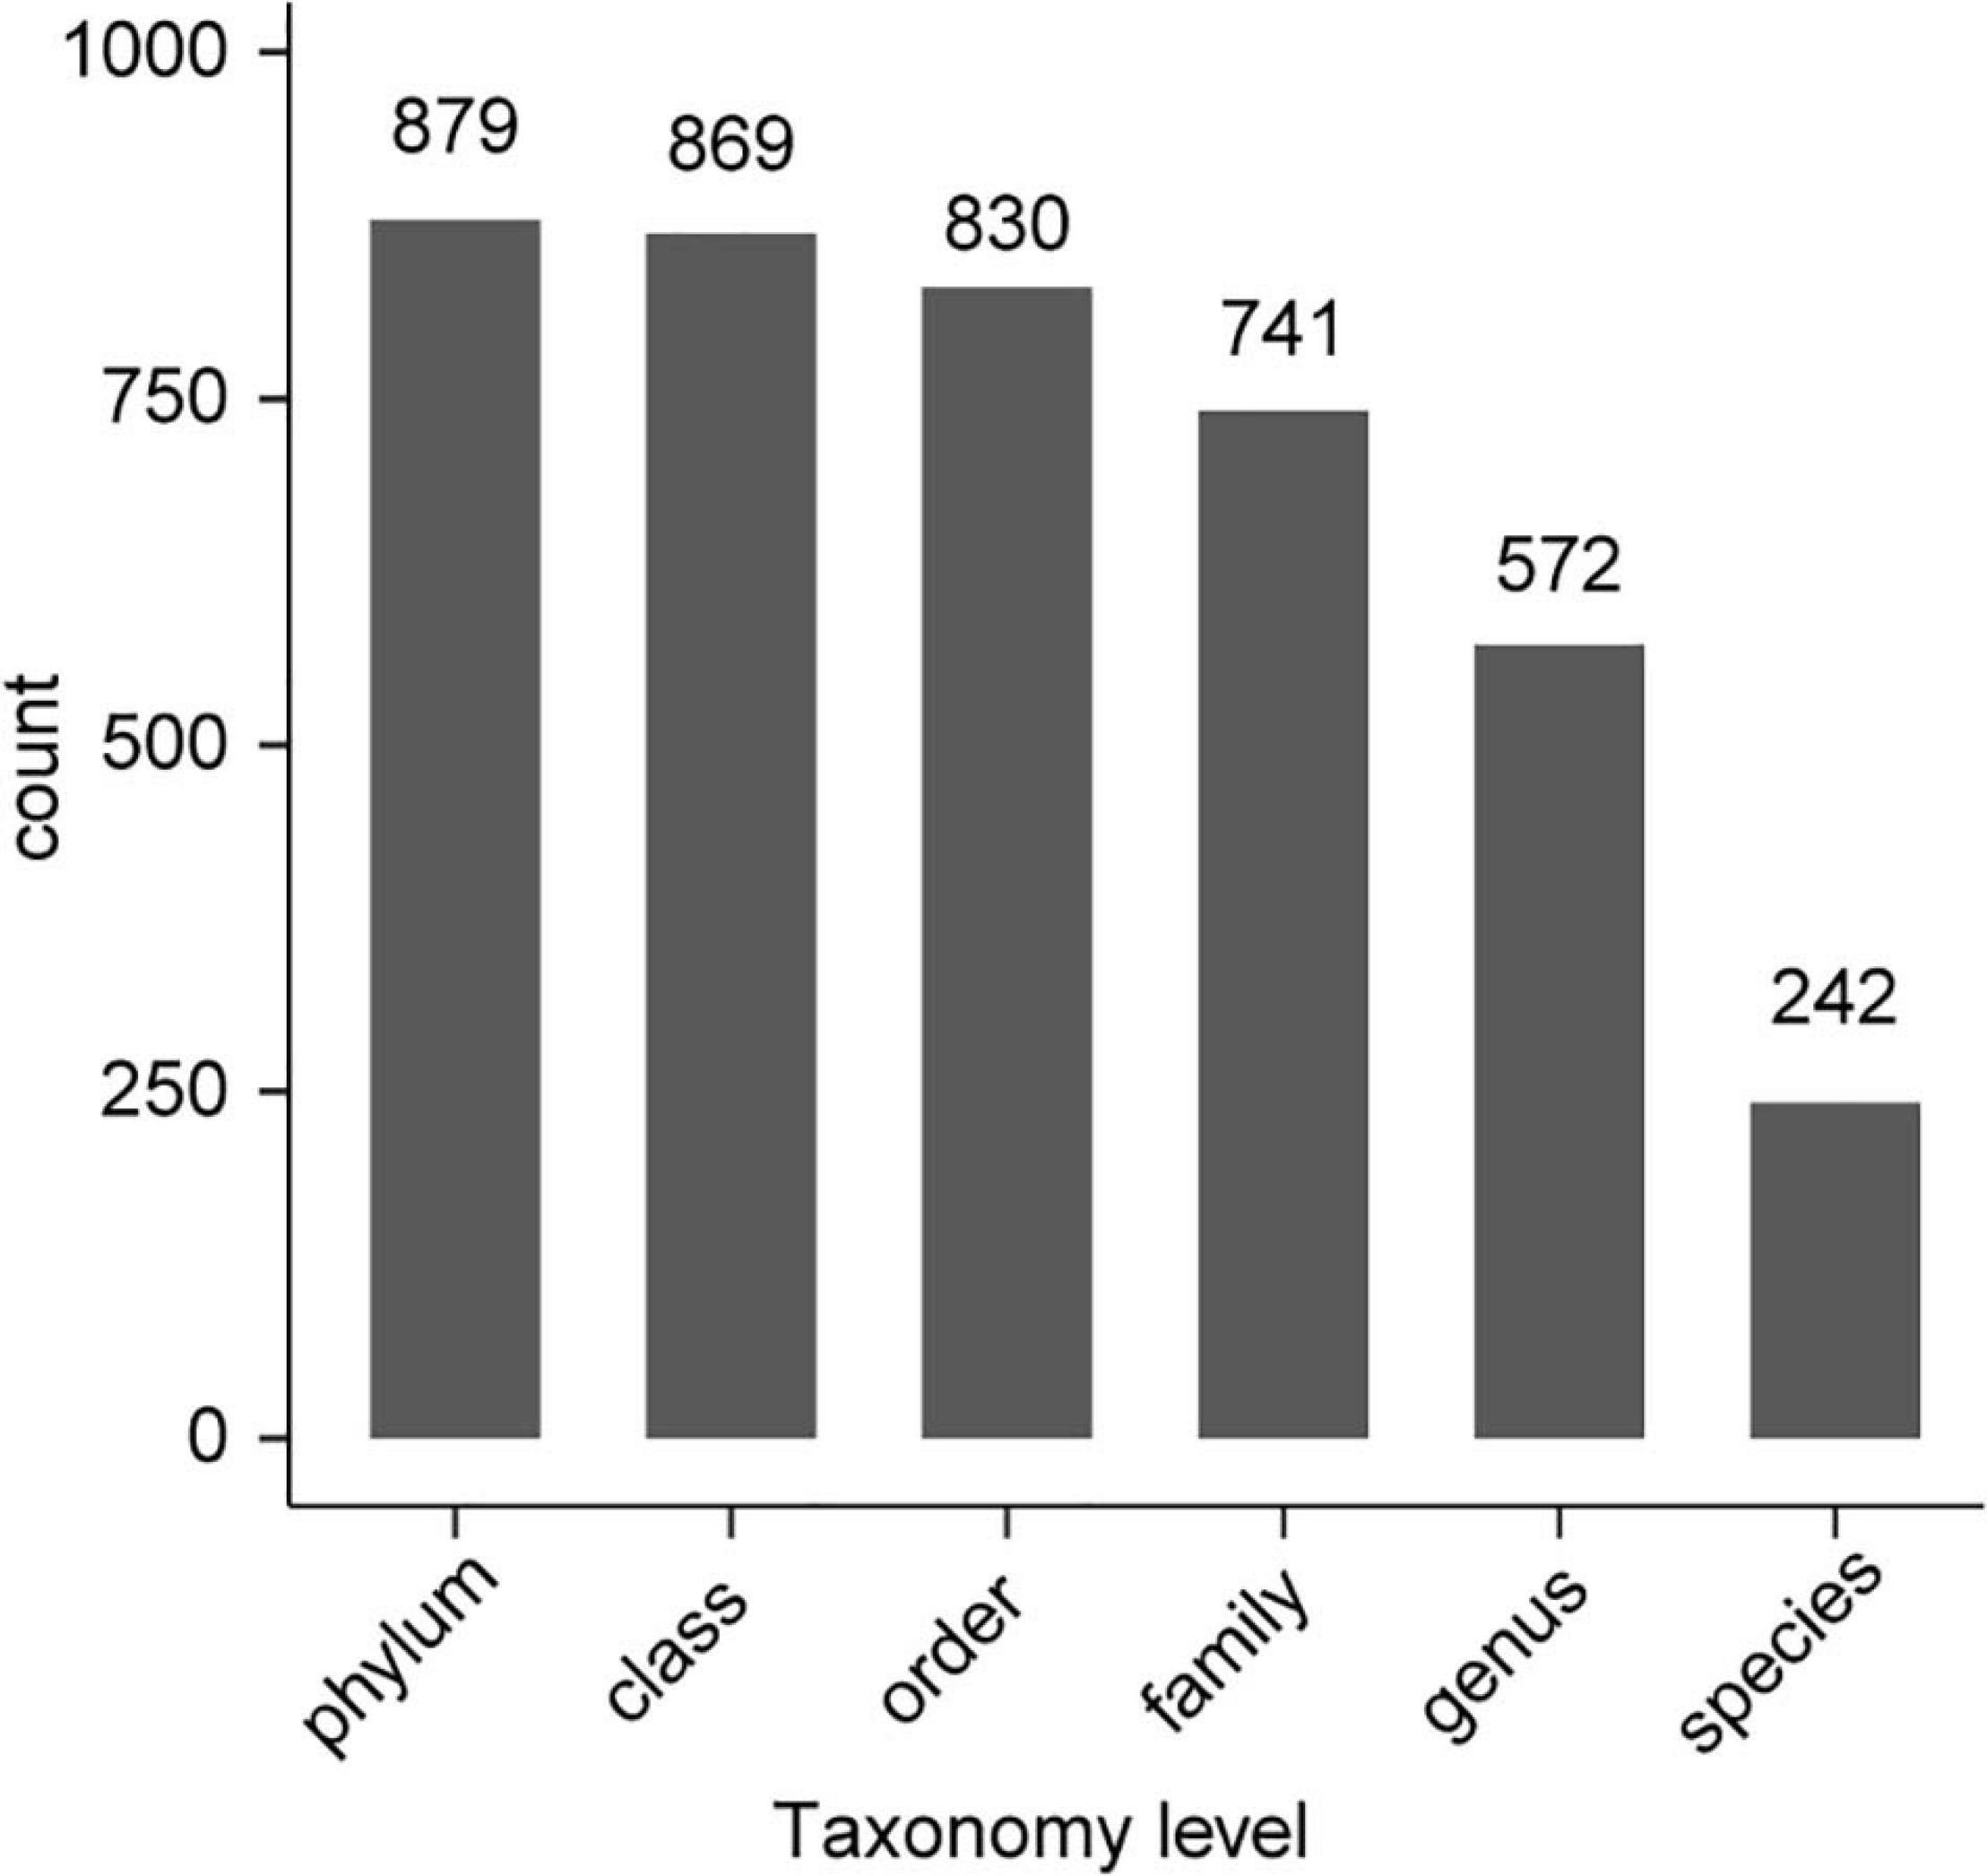
All 54 subsamples were simultaneously sequenced, and they produced a total of 4,295,080 reads. All data were submitted to the National Center for Biotechnology Information (NCBI), and the BioProject number is PRJNA683770. The number of reads obtained from the in vivo CPB microbiota of different geographical populations differed (Table 2). Each subsamples contained 50,000−100,000 reads. After quality control, there were 4,072,777 reads. Clean data were then classified by QIIME software. We classified 879 taxa of microbes, in 34 phyla, 54 classes, 107 orders, 187 families, and 383 genera. All 879 taxa were identified to different taxonomic levels; 879 were identified to the phylum level, 869 to class, 830 to order, 741 to family, 572 to genus, and 242 to species (Figure 2). We analyzed the composition of the microbiota of 54 subsample at the phylum, class, order, family, and genus levels (Table 2 and Figure 3). The relative abundance of microorganisms was different in each sample, but there was no significant difference in the six replicates of each sample. Each source was subjected to alpha diversity comparison, and the CPB in WL, JM, and WQ had high levels of microbial diversity (Figure 4).

Table 2. Total sequencing reads statistics in six repetitions, composition and number of microorganisms in different taxonomic levels of L. decemlineata nine samples.
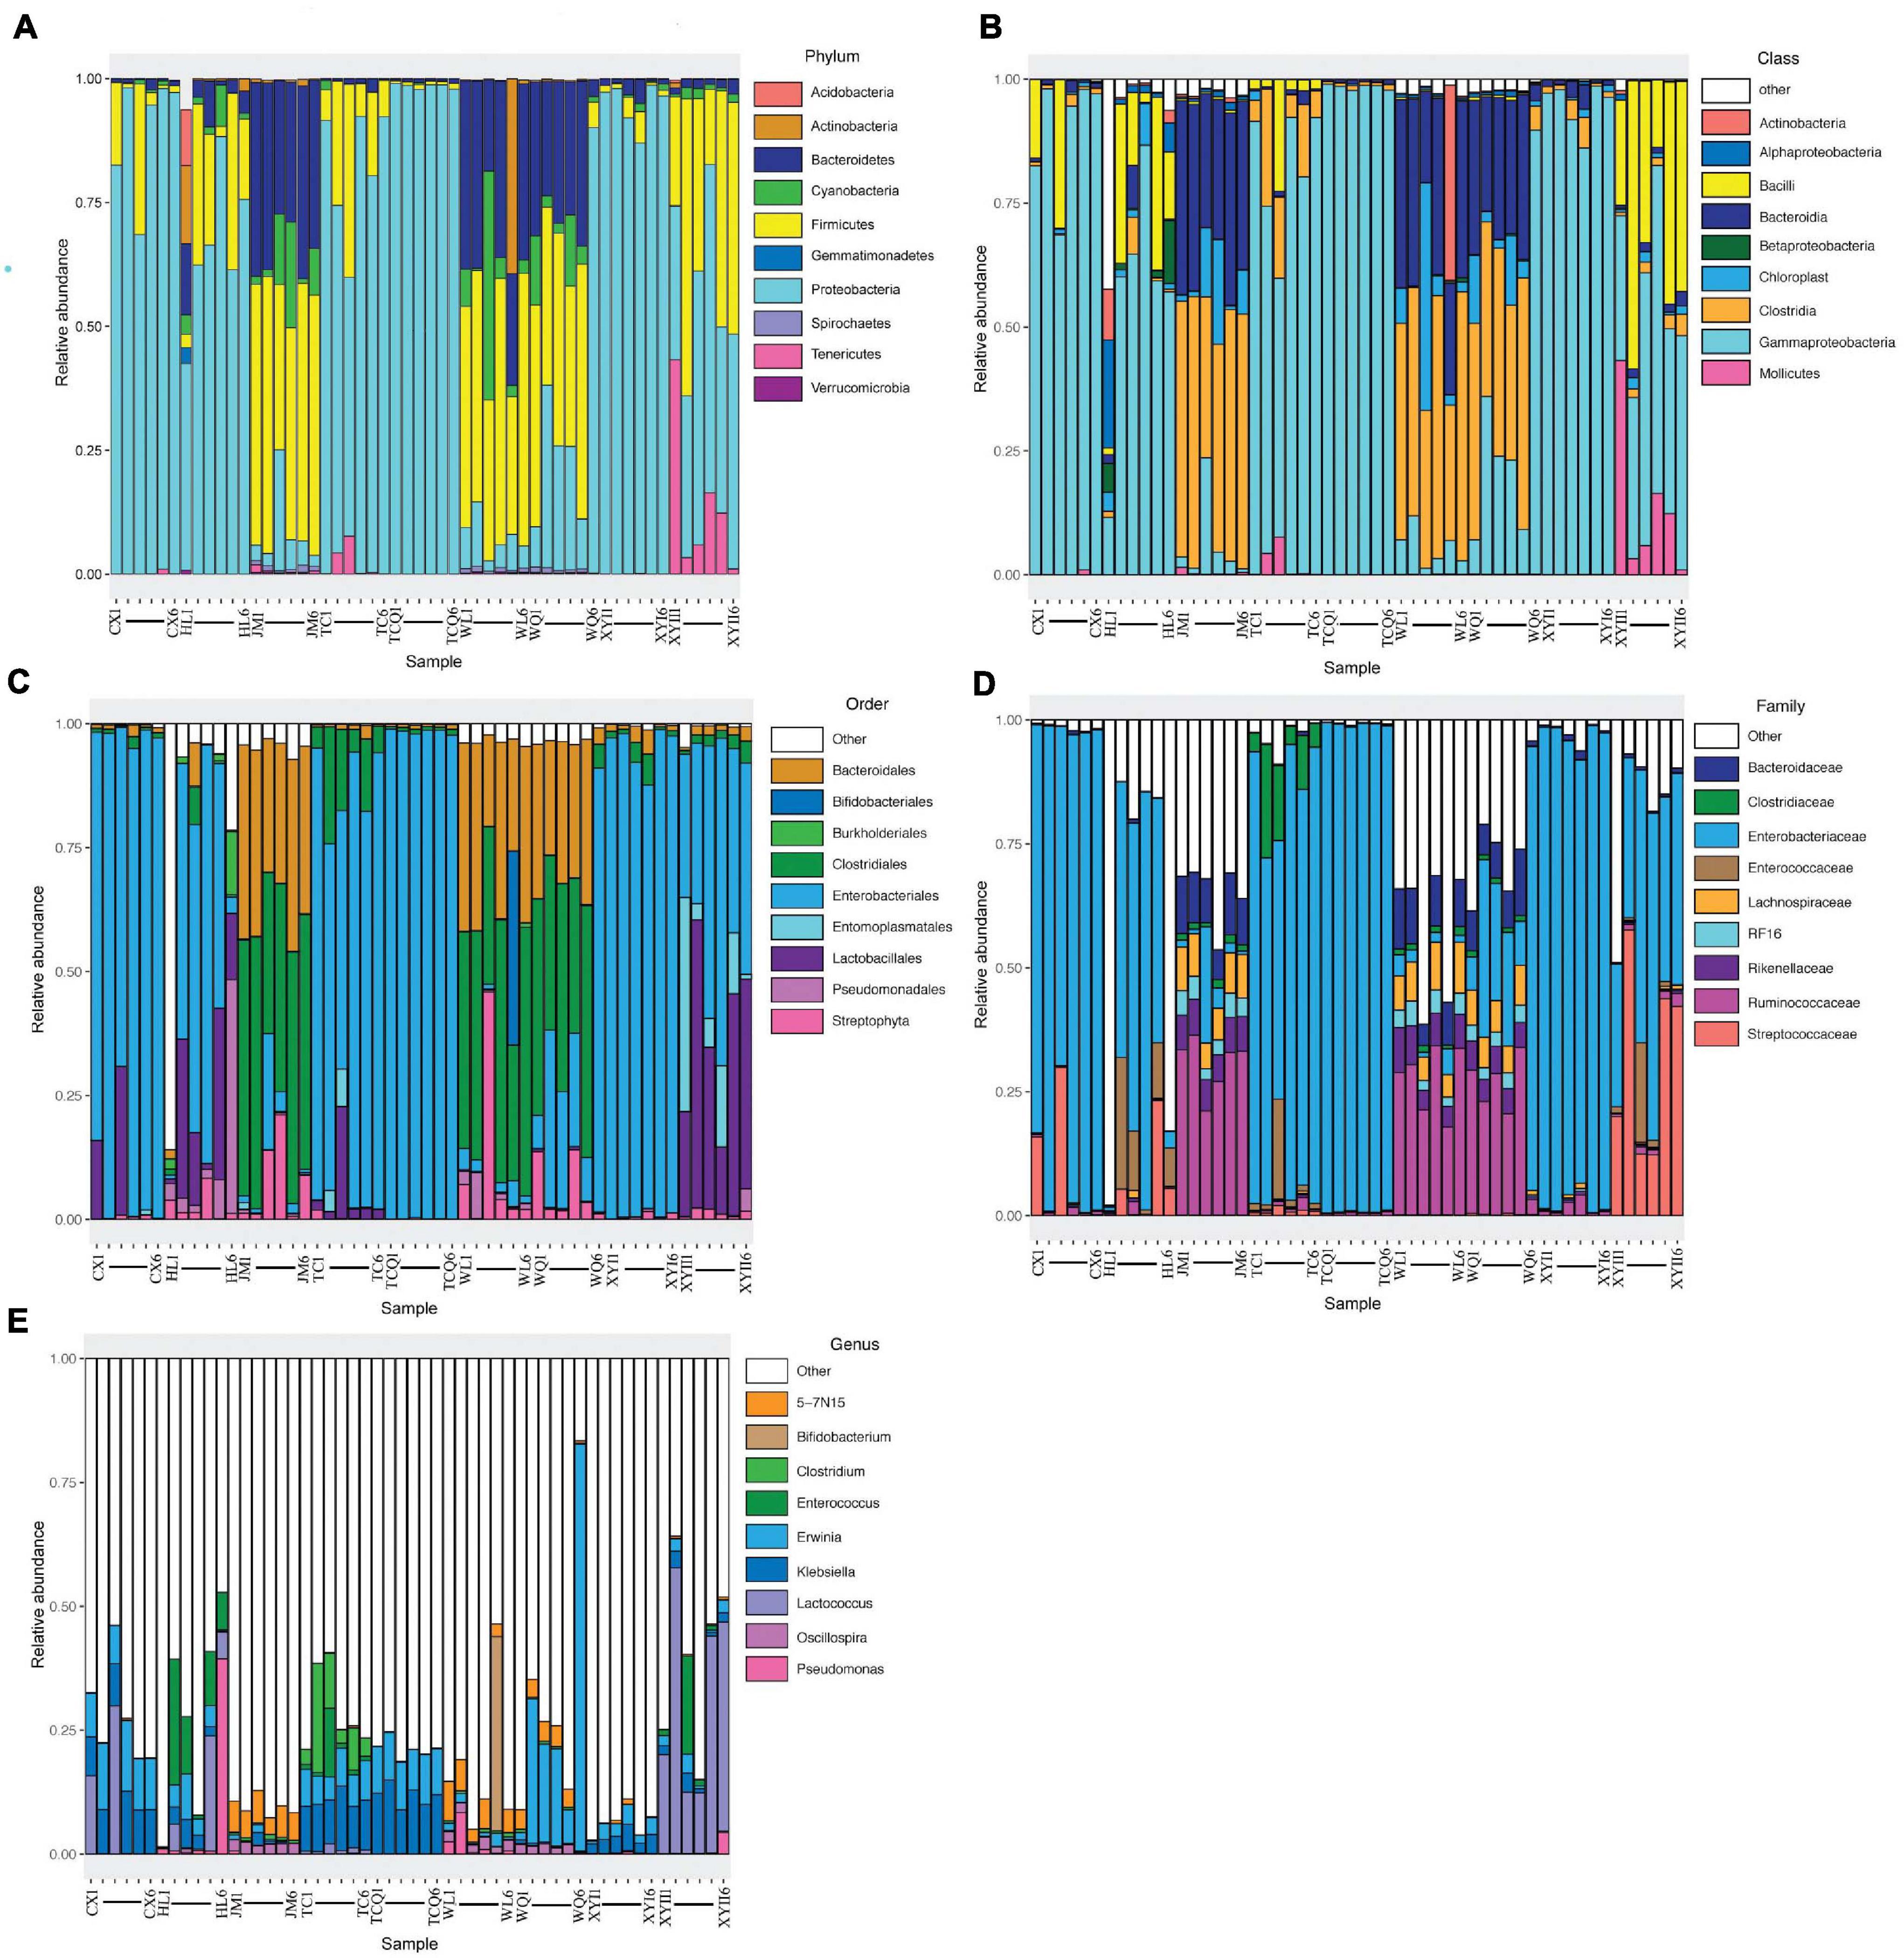
Figure 3. Top 10 phyla (class/order/family/genus) composition of microbiota. Each bar represents a sample, and each color represents a phylum (class/order/family/genus). Low relative abundance taxa and unclassified microbes are grouped into “Other.” (A) The top 10 phyla composition of microbiota. (B) The top 10 family composition of microbiota. (C) The top 10 class composition of microbiota. (D) The top 10 order composition of microbiota. (E) The top 10 genus composition of microbiota.
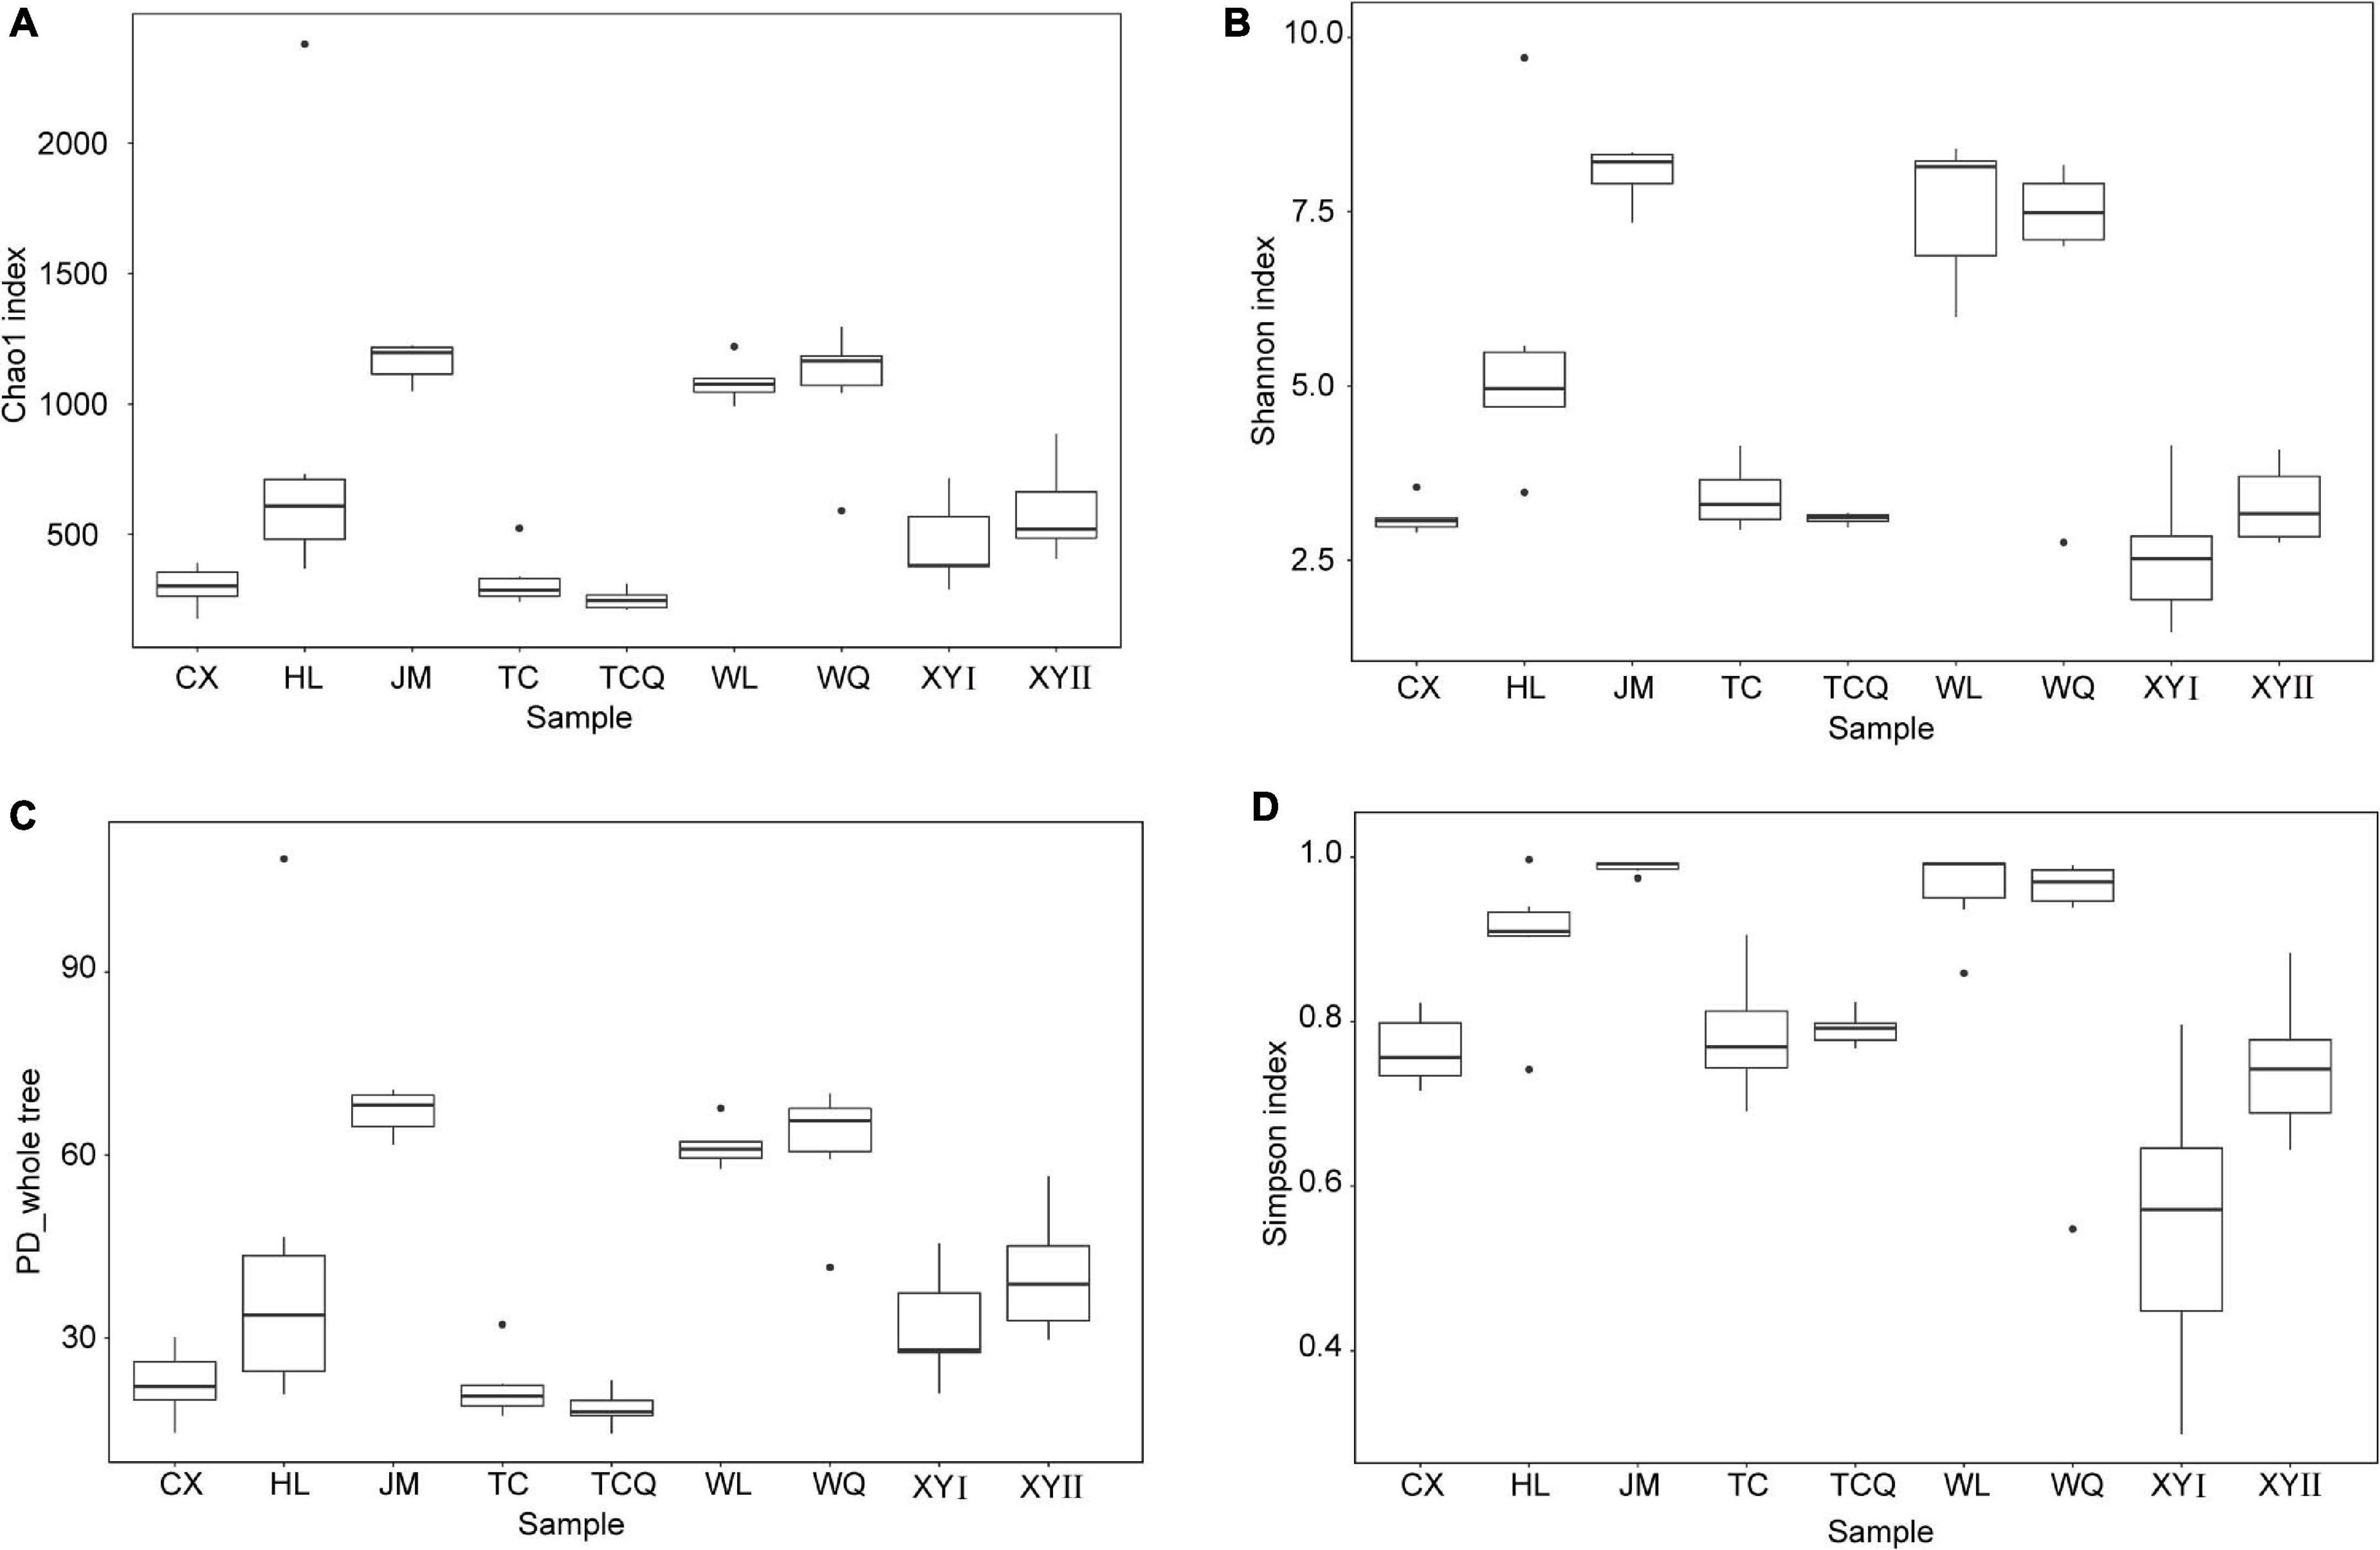
Figure 4. Alpha diversity indices of bacterial communities of CPB from different sampling sites. (A) Chao1 index. (B) Shannon index. (C) PD whole tree. (D) Simpson index.
To better compare the nine samples from different sources, the microbial diversity of five taxonomic levels was analyzed to explore the difference of the same insect in different sources (Table 3). The main microorganisms at each taxonomic level were briefly introduced. At the taxonomic level of phylum, the 16S rDNA gene sequences of gut microorganisms were annotated to 34 phyla, including Proteobacteria, Firmicutes, Oxyphotobacteria, Bacteroidetes, Tenericutes, Acfinobacteria, Acidobacteria, Monospora, Chloroflexi, and Spirochaetes. A total of 54 classes are annotated, mainly including γ-Proteobacteria, Bacilli, Class Clostridia, Bacteroidetes, Mollicutes, α-Proteobacteria, and Acidimicrobiia. At the taxonomic level of order, 107 orders of gut microorganisms were annotated, mainly including Enterobacterales, Lactobacillales, Clostridiales, Pseudomonadales, Bacteroidales, Entomoplasmatales, Bifidobacteriales, and Sphingobacteriales. A total of 187 families were annotated, including Enterobacteriaceae, Streptococcidae, Spiroplamataceae, Pseudomonadaceae, Bifidobacteriaceae, Verrucomicrobiaceae, Enterococcaceae, and Rikenellaceae.
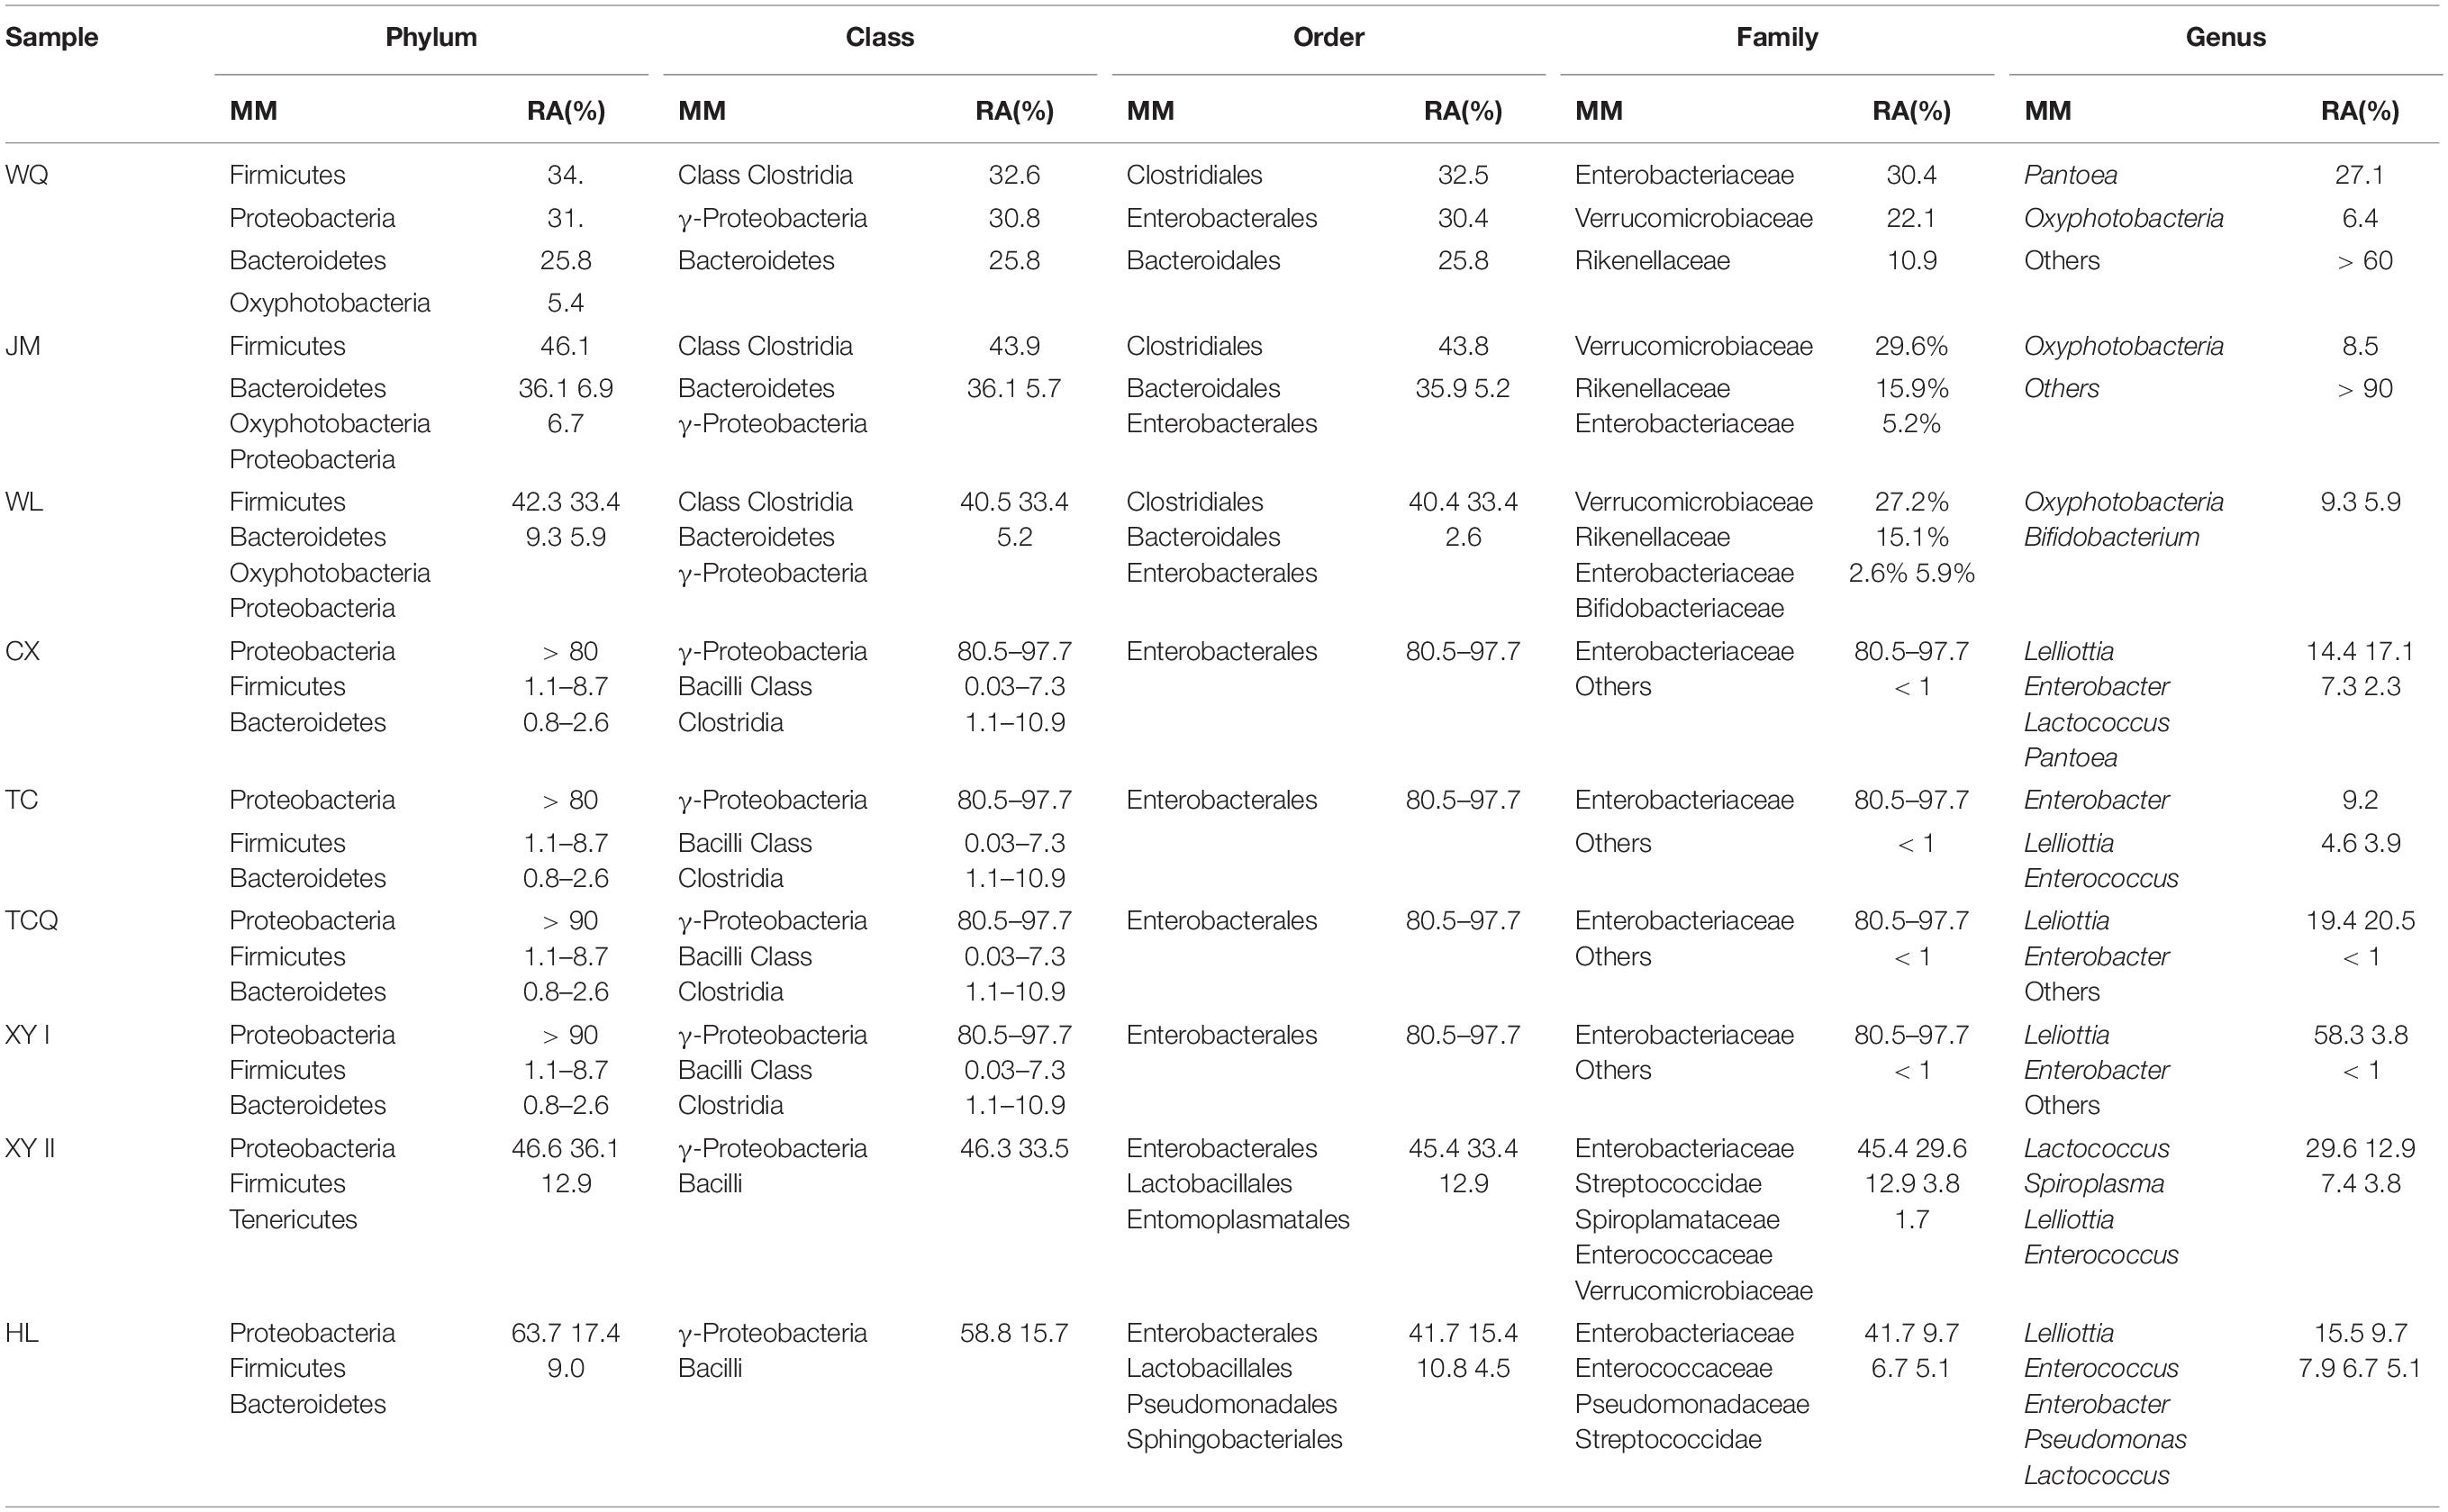
Table 3. The major microorganisms (MM) and their relative abundance (RA) of five taxonomic levels of L. decemlineata nine samples.
At the taxonomic level of genus, 383 genera were annotated, including Pantoea, Lelliottia, Lactococcus, Spiroplasma, Pseudomonas, Bifidobacterium, Enterobacter, and Enterococcus. Eight were from XJ and one was from HL among the nine samples. The dominant bacteria at the genus level were compared between XJ and HL. Pseudomonas was the unique dominant microorganism in HL. Four microorganisms (Lelliottia, Enterococcus, Enterobacter, and Lactococcus) were common within the two regions. At the family level, Enterobacteriaceae was dominant in all samples, and in many of the eight samples, the dominant species were the same with different relative abundance.
Verification of tSNE Method’s Ability to Distinguish Geographical Source
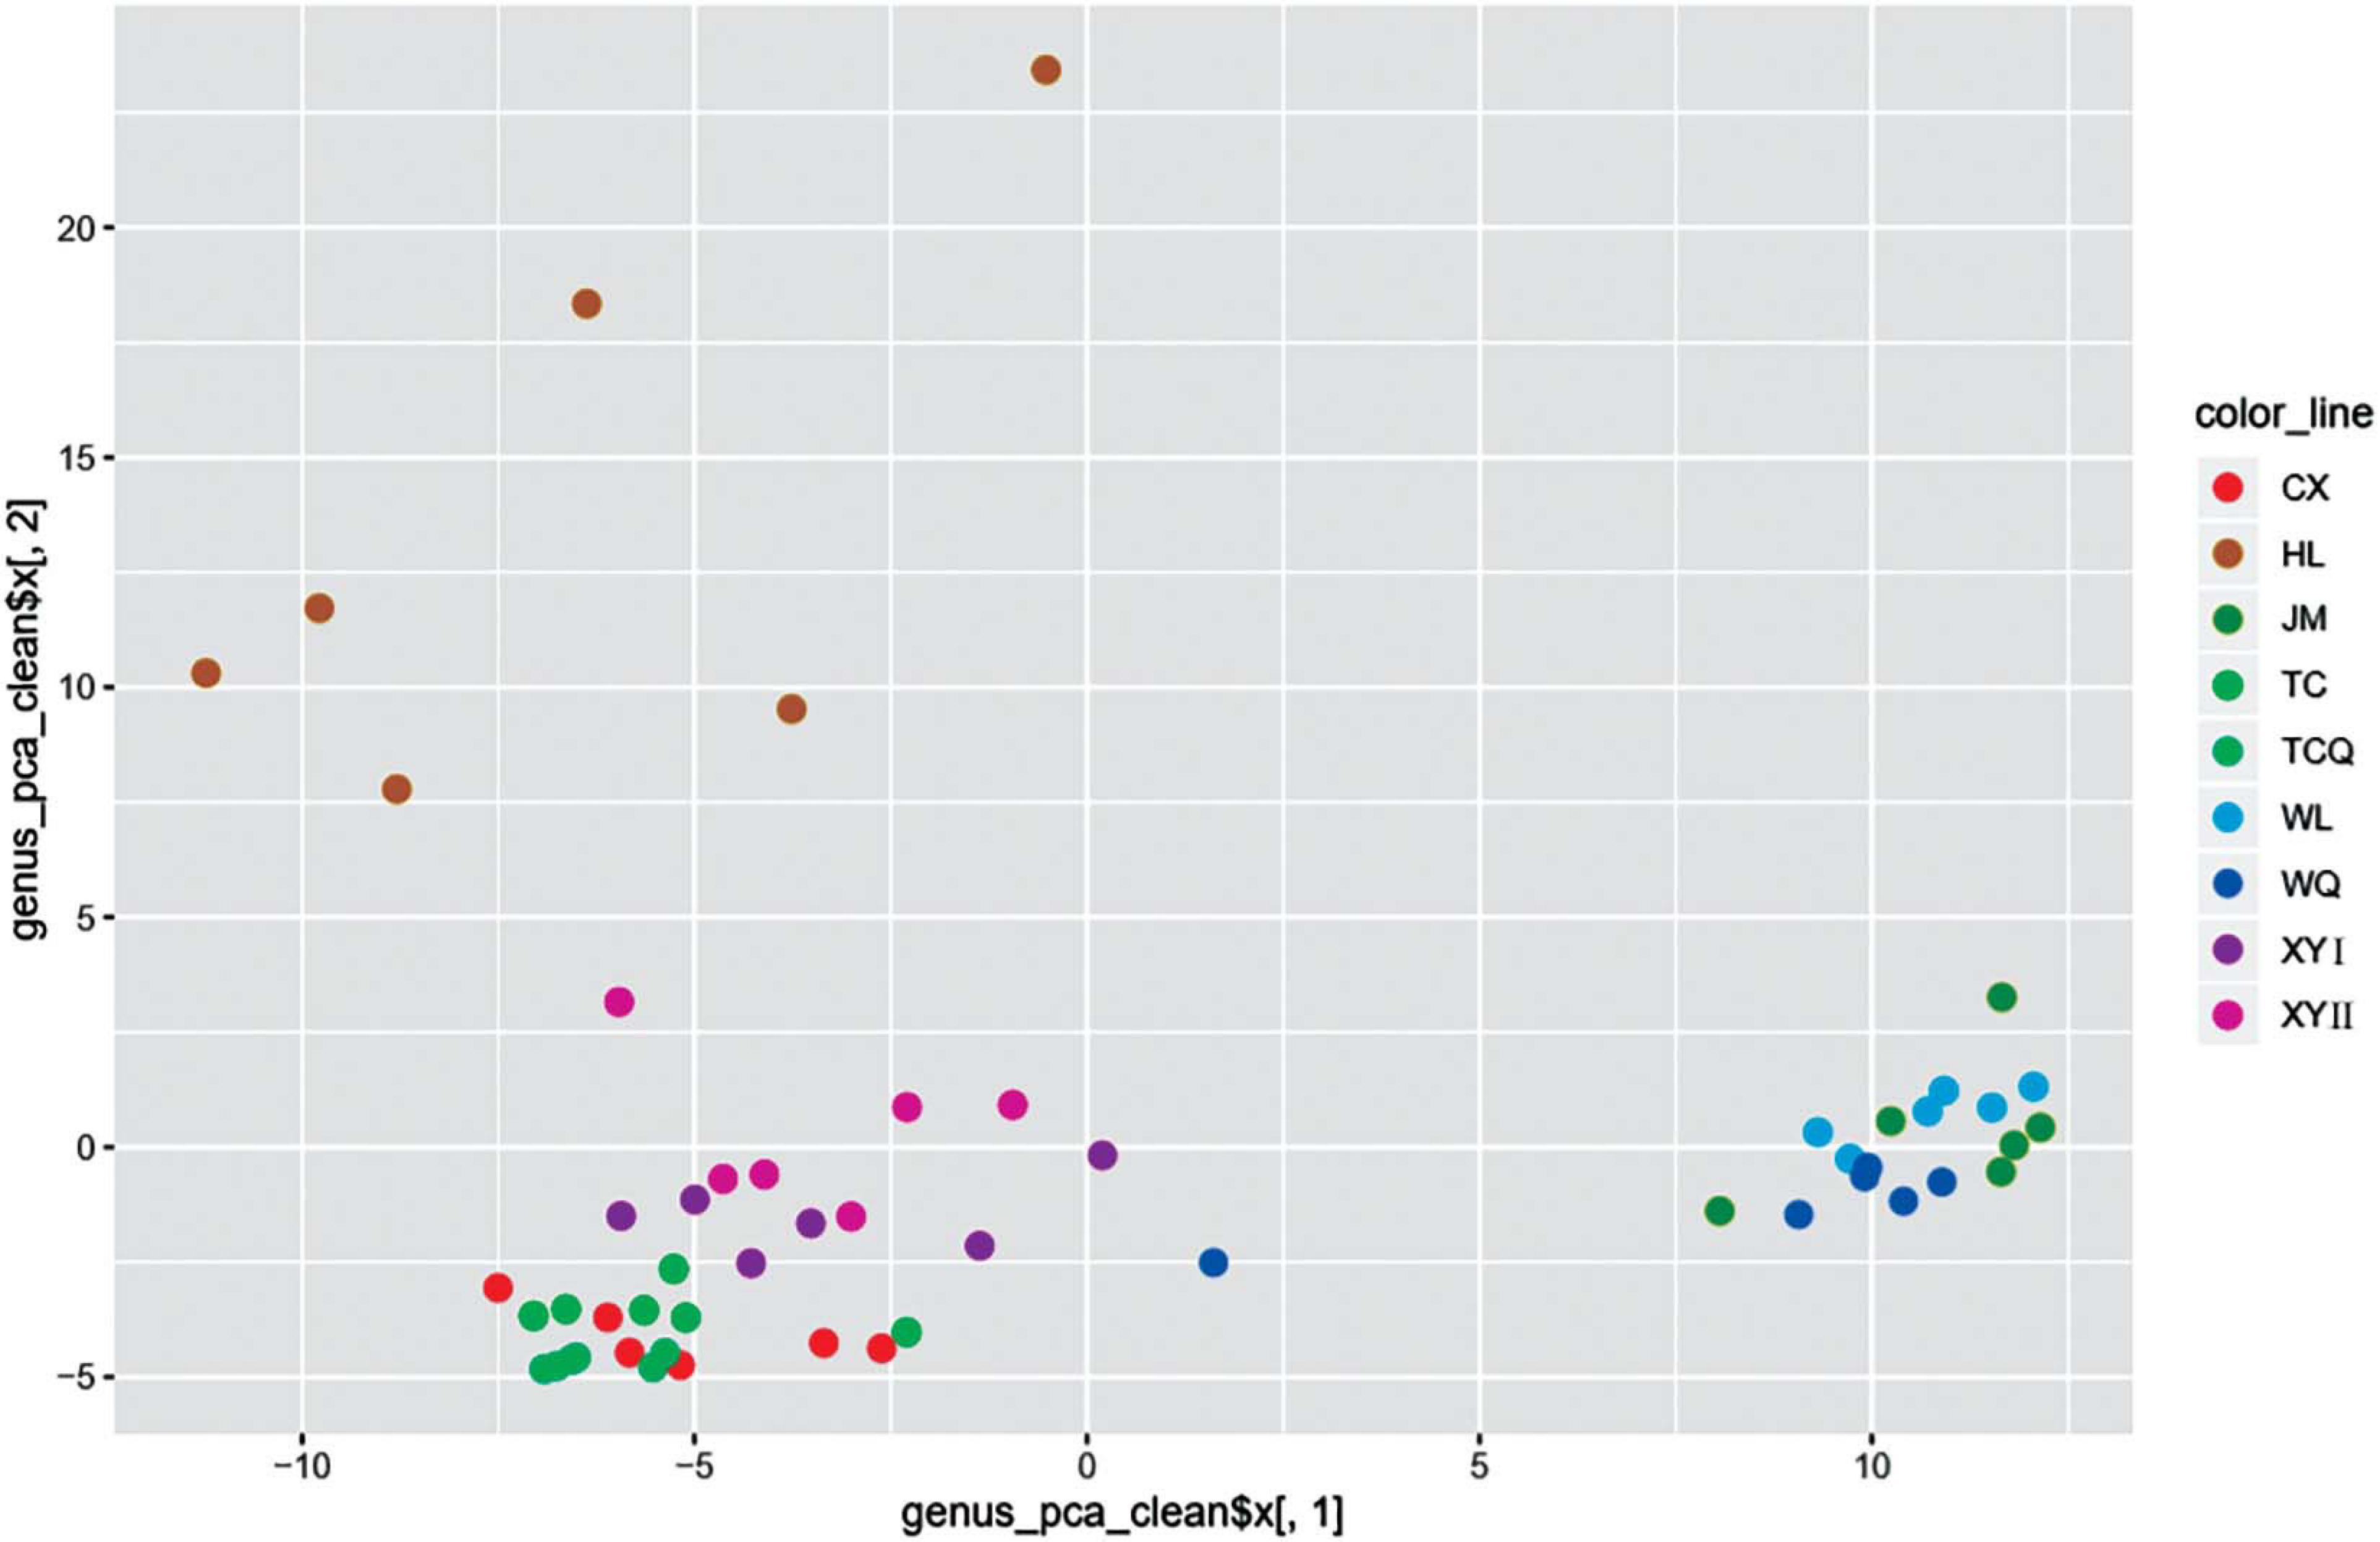
To study the relationship between microbial diversity and geographic source, we analyzed microbiota data using Principal Component Analysis (PCA). The dots that represent CPB from the nine areas did not adequately distinguish geographical source (Figure 5). Thus, we used a non-linear algorithm tSNE. This algorithm is based on a probability distribution of random walks on the neighborhood graph to find structures within a dataset. We performed tSNE at three taxonomic levels. CPB from the same geographical area grouped together at the class and genus levels (Figure 6). This result suggested that tSNE is better than PCA in extracting geographic factors affecting insect microbiota. The microbiota of CPB in WL, JM, and WQ were similar and clustered together with a high abundance of bacteria. The other samples had a low abundance of bacteria. Order and genus appeared to be appropriate proper taxonomic levels to distinguish geographical clusters of CPB.
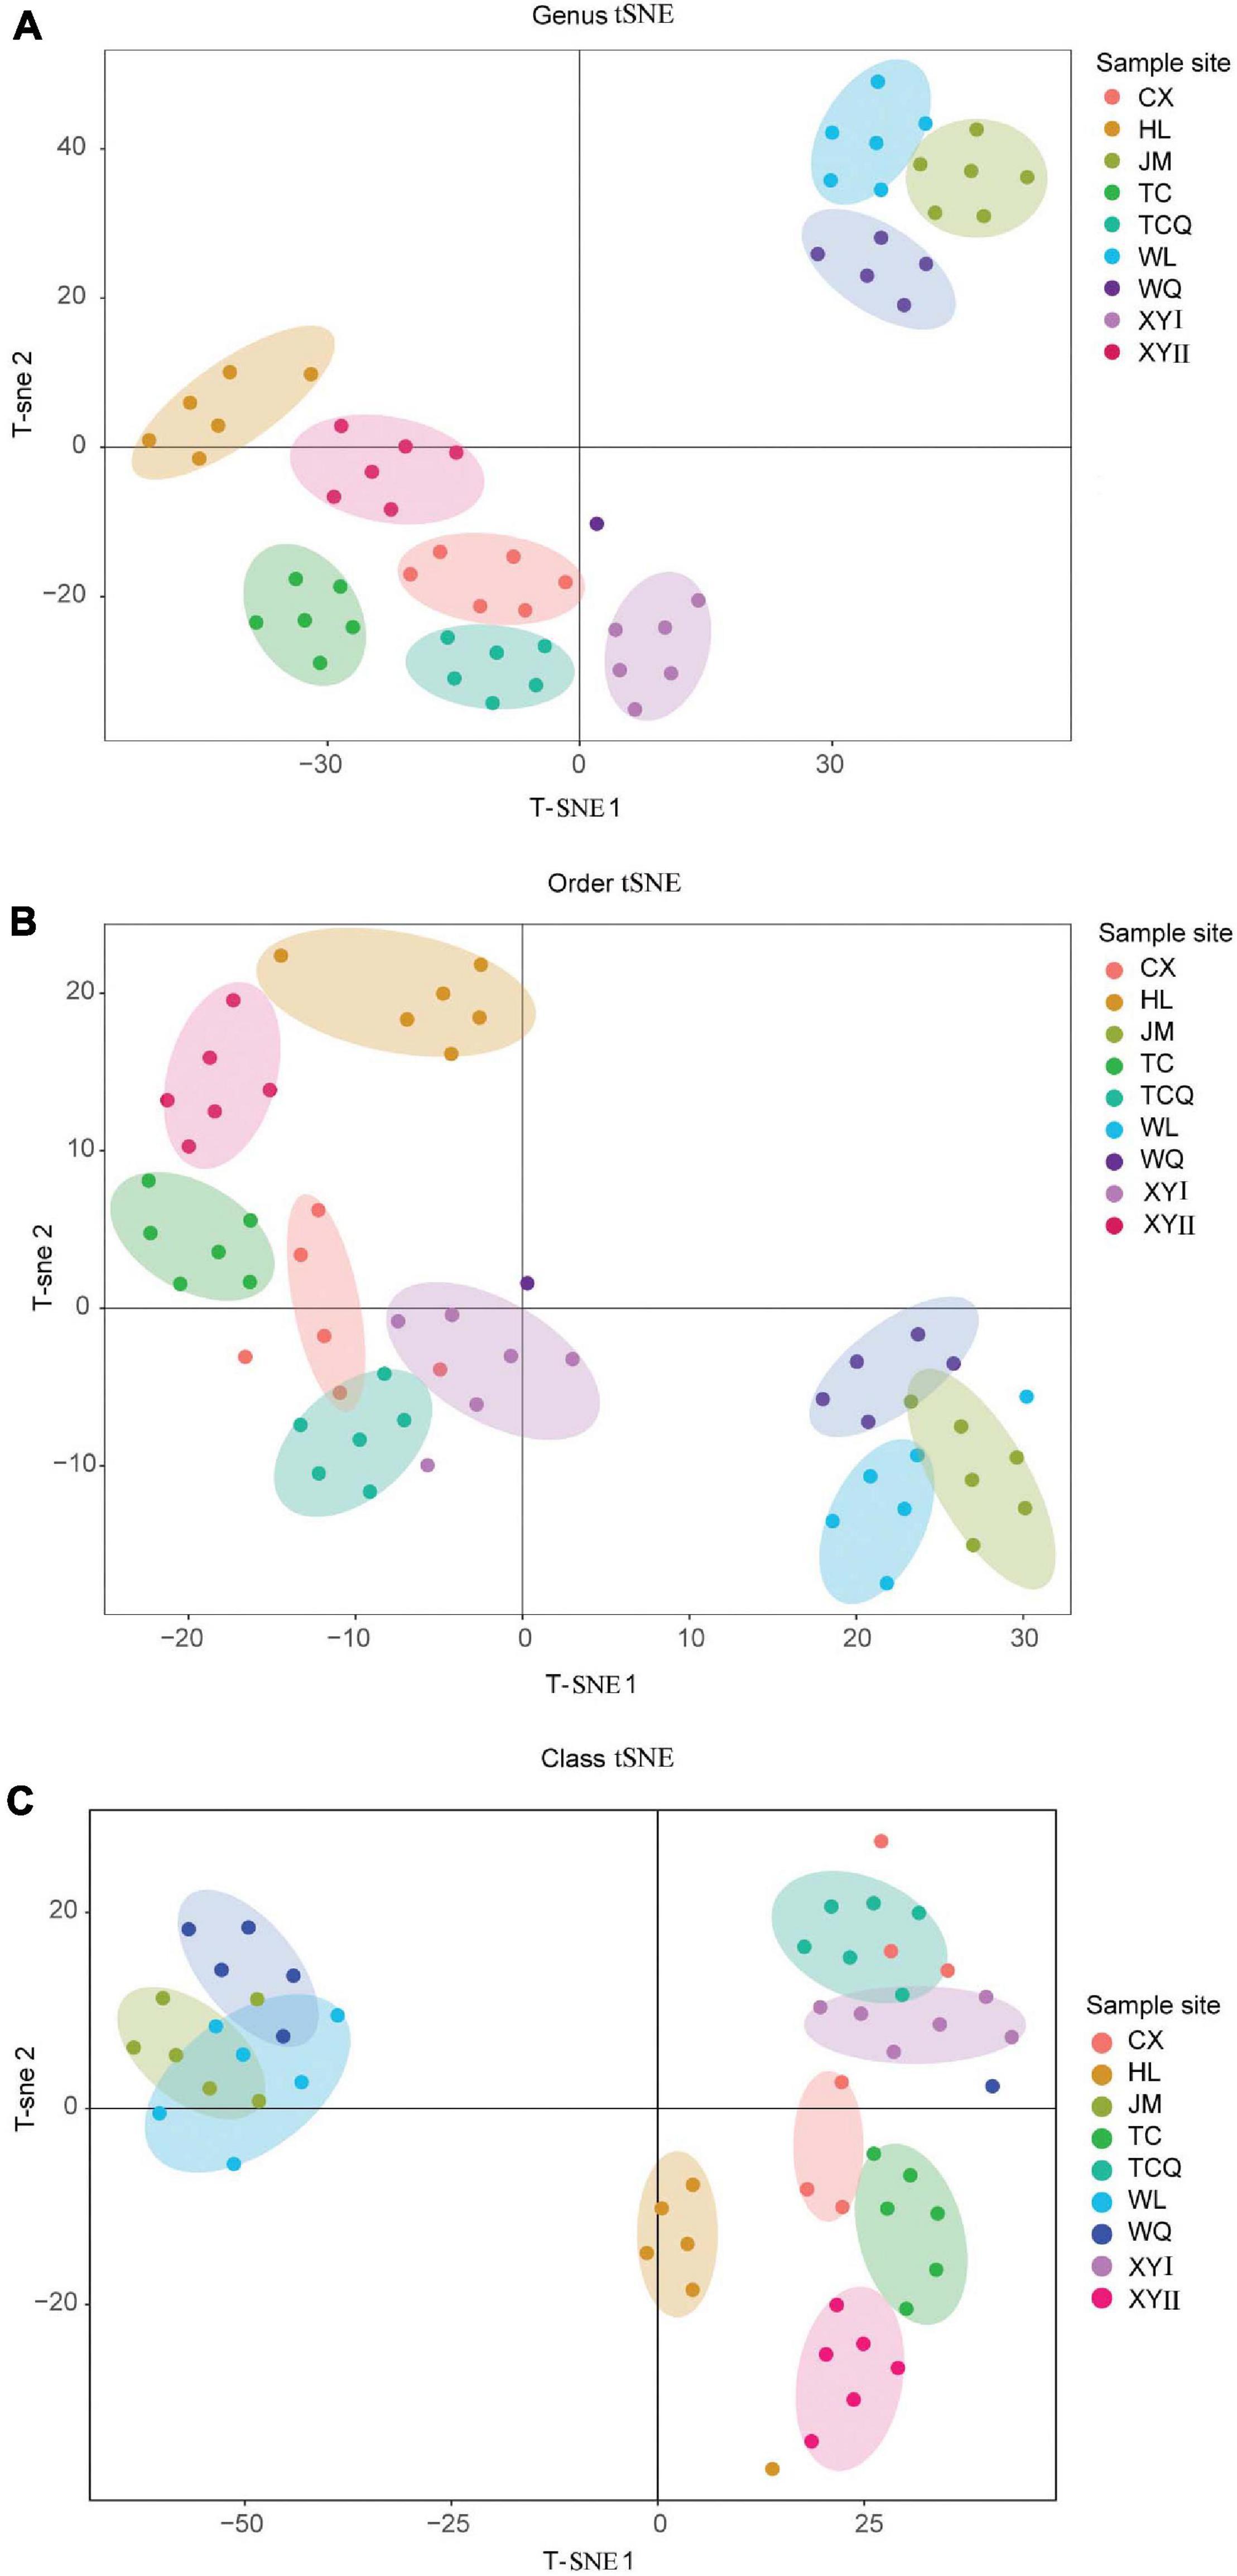
Figure 6. TSNE analysis of CPB collected from different areas. Each point represents a sample, and each color represents a sample site. (A) TSNE analysis at the genus level. (B) TSNE analysis at the order level. (C) TSNE analysis at the class level.
Since the tSNE had a better clustering effect at the order and genus levels, we performed a heat map analysis of these two levels (Figure 7). The heat map showed that the composition of the microbes of CPB in JM, WL, and WQ was similar, at the two levels. At the order level, Clostridiales, Bacteroidales, and Streptophyta, and at the genus level, Paludibacter, Prevotella, and Oscillospira in the three regions were similar. These data distinguished JM, WL, and WQ from the other six regions, and the results are similar to those of tSNE.
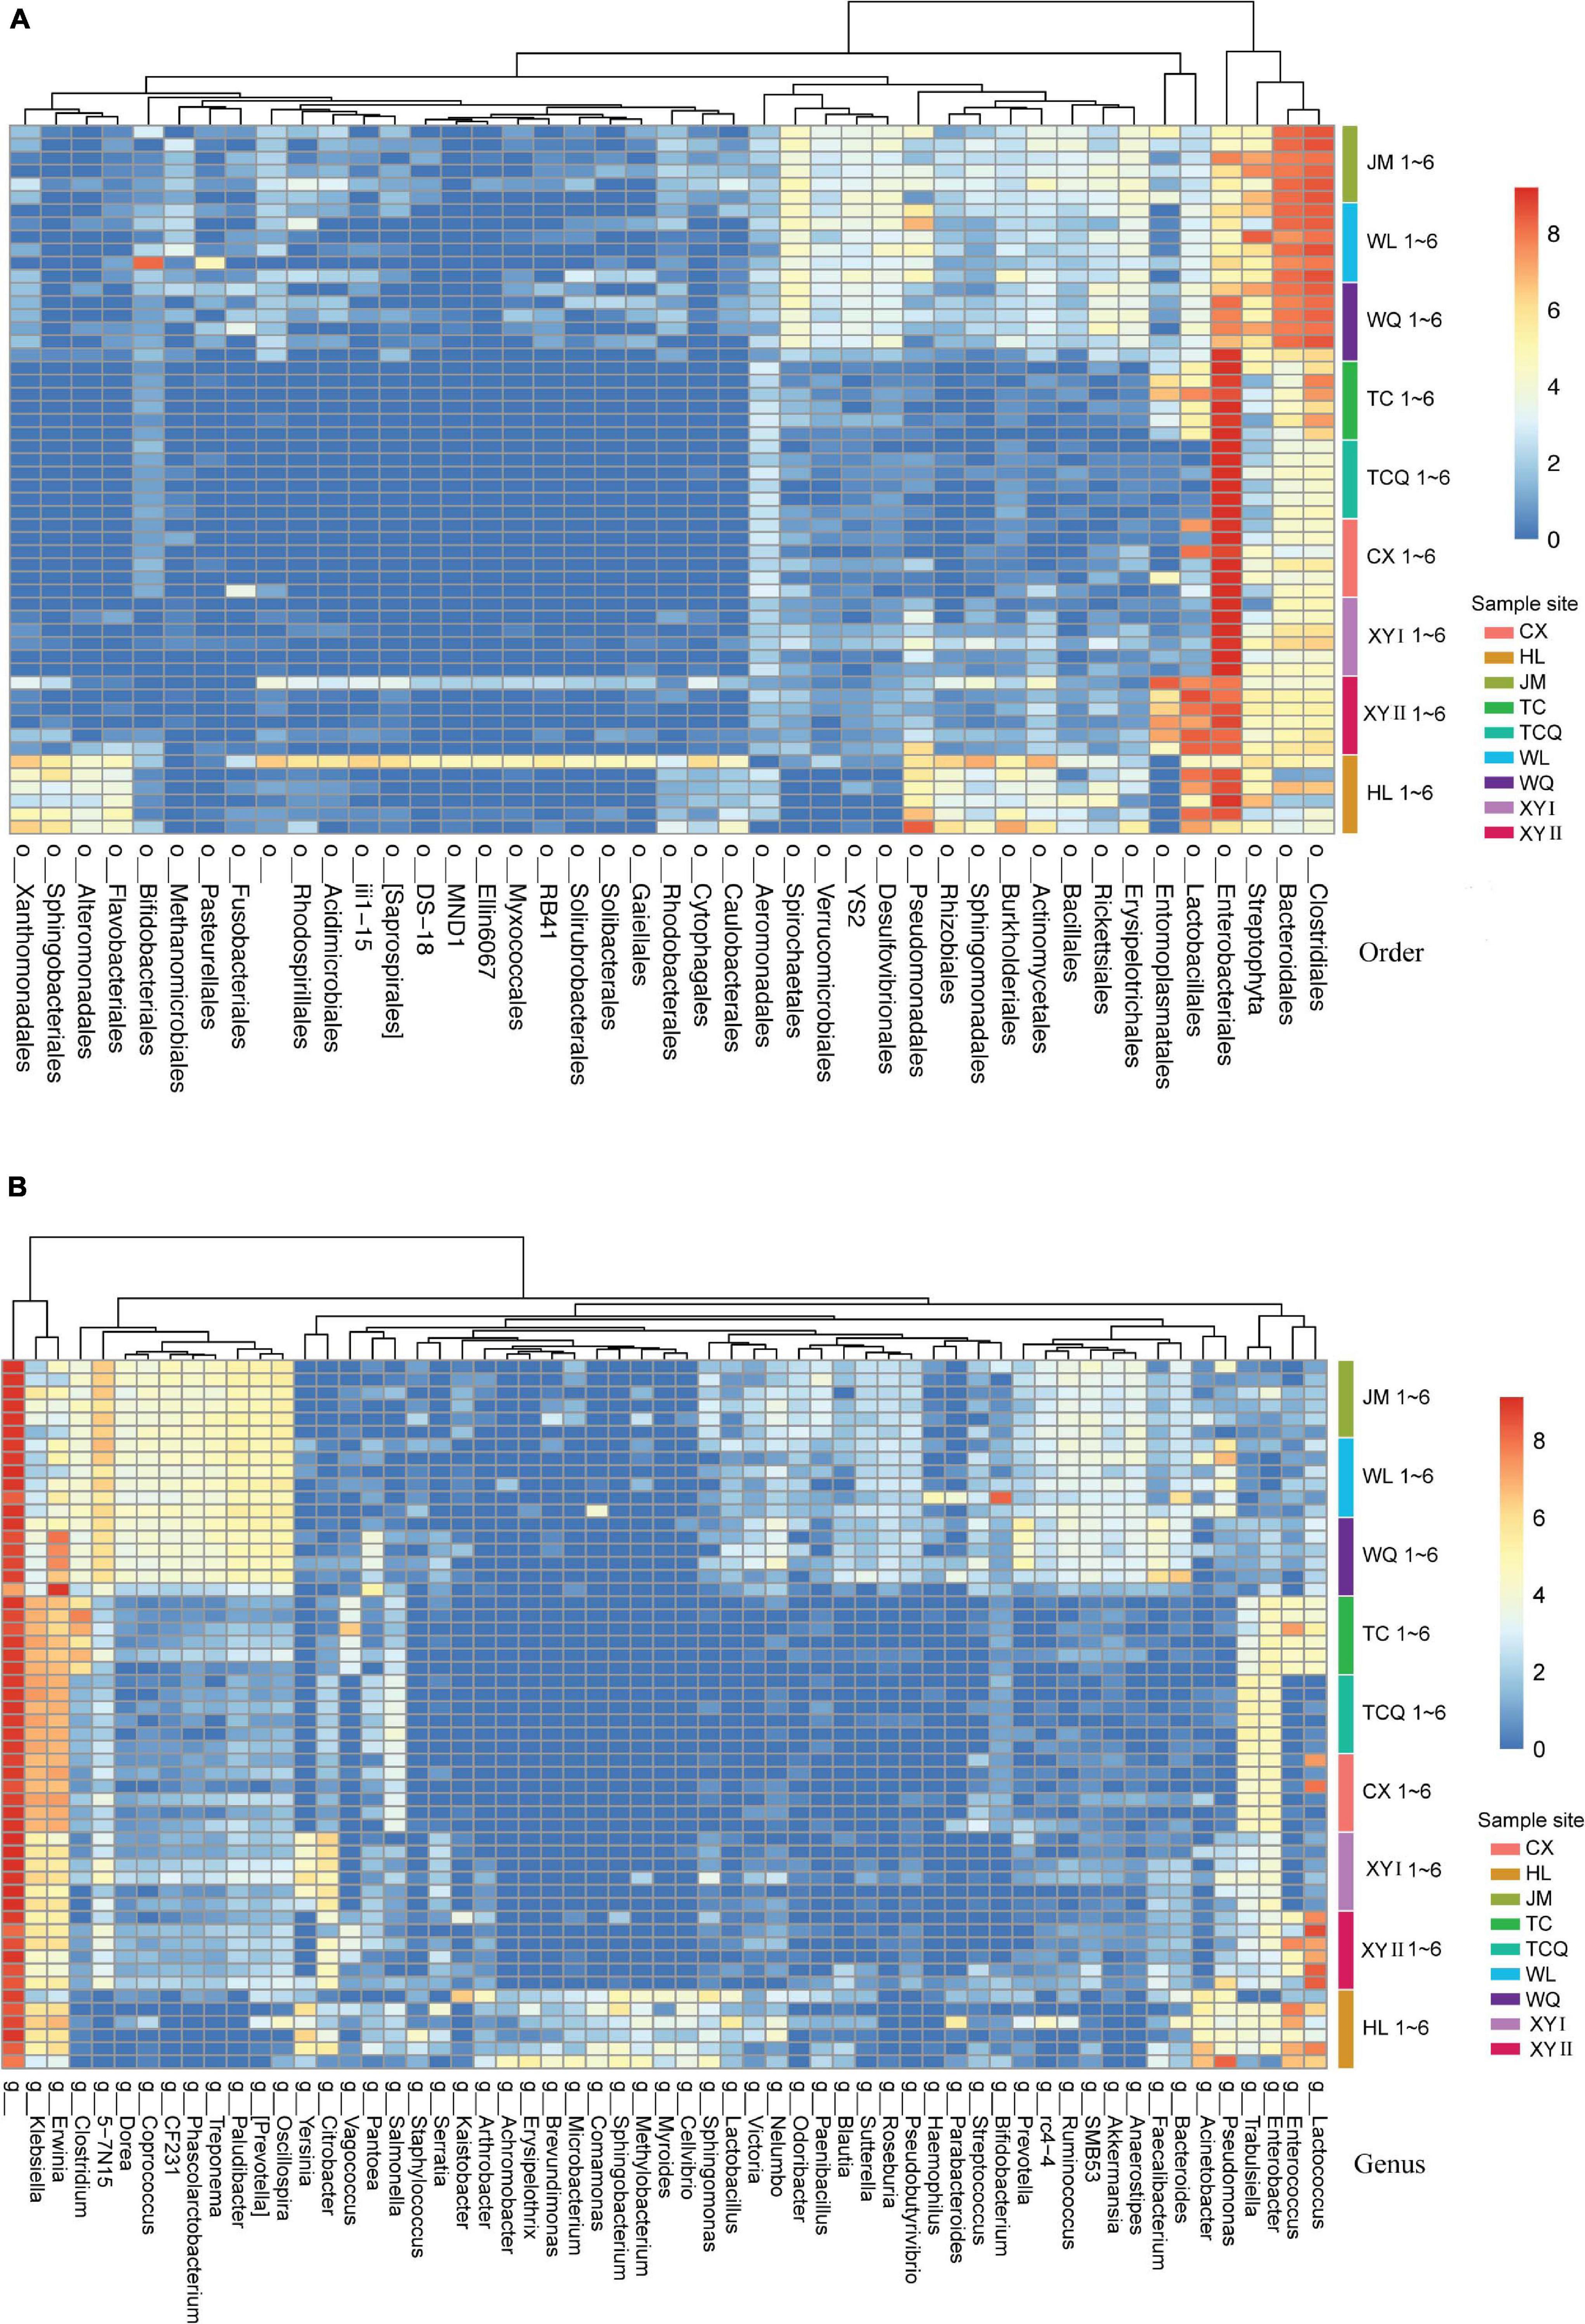
Figure 7. Differences in microbes at the order/genus level for CPB from different geographical sources. Low relative abundance (<0.01) and unidentified order/genus microbes were grouped into o__/g__. (A) Heatmap of bacterial communities of CPB from different sites (order level). (B) Heatmap of bacterial communities of CPB from different sites (genus level).
The tSNE method can be useful for extracting the geographical information affecting the microbiota of CPB. In tSNE cluster analysis, microbes in WL, JM, and WQ were similar and clustered together and were named group A. The remaining six sources were named group B. We compared groups A and B by Linear discriminant analysis Effect Size (LEfSe) and found significant differences in OTU richness between the groups (Supplementary Figure 1). At the order level, the abundance of Enterobacteriales, Lactobacillales, Aeromonadales, and Clostridiales in group B was significantly higher than that in group A. The abundance of Rickettsiales, Verrucomicrobiales, Desulfovibrionales, Erysipelotrichales, YS2, and Spirochaetales in group A was significantly higher than that in group B. These significant differences in microbial populations can be used as biomarkers that can divide the geographical sources of the CPB.
Samples from TC were divided into CPB feeding on potatoes and CPB feeding on eggplants. We compared the species differences between these two groups by LEfSe (Supplementary Figure 2). At the genus level, the abundances of microbial populations in TCQ and TC were significantly different; the differential microorganisms in TCQ were Citrobacter and Salmonella, and in TC these were Dorea, Lactococcus, CF231, Vagococcus, Enterococcus, and Clostridium. These microorganisms may be regarded as biomarkers to distinguish one species from different host plants within the same source. However, two samples from two plots in Xinyuan County were compared for their microbial species composition by LEfSe analysis (Supplementary Figure 3). At the genus level, the abundance of Cronobacter and Yersiniavan in XYI was significantly higher than that in XYII, and that of Vagococcus and Enterococcus in XYII was significantly higher than that in XYI. The microorganisms appear to be related to the microenvironment, like host plant, soil, temperature, humidity, and other conditions.
Discussion
The bacterial communities of CPB from different sources in China were compared with 16S high throughput sequencing. Abundant and diverse bacteria were found in CPB. At the phylum level, Bacteroides, Firmicutes, and Proteobacteria were the most important groups. This is consistent with studies on other coleopteran endomicrobiomes (Durand et al., 2015). At the genus level, there were large differences in the bacterial communities, especially among different plots within the same area. Some bacteria were the same as the reported enteric bacteria (Michael et al., 2008; Muratoglu et al., 2011; Krawczyk et al., 2015), including Lactococcus and Enterobacter, and some were different, e.g., Dorea, Vagococcus, and Clostridium, suggesting that these bacteria may be secondary bacteria related to the environment. The nine samples have similar microorganisms with different relative abundance, but regional specificity was also found. For example, Pseudomonas was specific to HL. At higher taxonomic levels there were fewer differences. The number of five taxonomic levels and the microbial diversity also showed the differences of microbial diversity among samples from different sources (Tables 2, 3). Differences in host plant also led to differences in the microbial diversity, such as in TC and TCQ (Supplementary Figure 2). The microbial diversity showed that the gut microbes are closely related to several factors: one is the different location, the second is the different potato varieties, the third is the different temperature, humidity and other weather conditions in the field, the fourth is that the invasion source may be different, CPB of XJ may come from the northwest neighboring countries, CPB of HL may come from Russia. All of these differences may lead to differences in microorganisms.
A diversity of bacterial communities in different sources of CPB is reported here for the first time. Proteobacteria are dominant in all of the populations. Proteobacteria play an important role in digestion and nutrition in some insects. For example, γ-proteobacteria in bees can encode pectin-degrading enzymes and participate in the lysis of pollen walls (Engel et al., 2012). Firmicutes bacteria were also common in the gut tract, including Enterococcus, Streptococcus, Staphylococcus, and Lactobacillus. Firmicutes bacteria are important in mammalian material and energy metabolism (Ley et al., 2008). Clostridium bacteria can effectively degrade cellulose and hemicellulose to produce amino acids. Enterococcus in the gut of gypsy moths can help resist pathogen invasion (Chen et al., 2016).
The diversity of CPB microorganisms from different sources further illustrates the role of microorganisms in invasion and adaptation to local conditions, and it is possible to use 16S sequencing technology combined with the tSNE method to distinguish geographical populations. This is the first example of comparing CPB population sources using the bacterial community, although many factors, such as different developmental status and sex can affect the microbial composition (Guo et al., 2015; Kuan et al., 2015). We have provided a potential method for establishing the geographical source of an organism based on bacterial community factors rather than common genetic methods (Abdel-Aziem et al., 2005; Virgilio et al., 2012; Jung et al., 2016; Kang et al., 2019). The applicability of the bacterial method needs verification in other insects and the sequencing, data analysis and related methods need to be improved.
Data Availability Statement
The datasets presented in this study can be found in online repositories. The names of the repository/repositories and accession number(s) can be found below: https://www.ncbi.nlm.nih.gov/, PRJNA683770.
Author Contributions
YY and YW designed and conceived the study. XY assisted in the collection of CPB sources. HL assisted in the analyses of sequencing data. YY, WS, and JZ developed the project and revised the manuscript. All authors contributed to scientific discussions and manuscript preparation.
Funding
This work was supported by the National Key Research and Development Program of China (2018YFC0809101).
Conflict of Interest
YW was employed by company Biowavelet Ltd.
The remaining authors declare that the research was conducted in the absence of any commercial or financial relationships that could be construed as a potential conflict of interest.
Acknowledgments
We are grateful to Dr. Yawei Li for help with sample collection. We thank LetPub (www.letpub.com) for linguistic assistance during manuscript preparation.
Supplementary Material
The Supplementary Material for this article can be found online at: https://www.frontiersin.org/articles/10.3389/fmicb.2021.639913/full#supplementary-material
Supplementary Figure 1 | LEfse analysis showing biomarkers for Cluster A and Cluster B. The bar plot shows the relative abundance difference of these biomarkers between the two clusters. (Cluster A contains JM, WL, and WQ. Cluster B contains TC, TCQ, CX, XYI, XYII, and HL.) (A−J) Relative abundance of each biomarker in Cluster A and Cluster B.
Supplementary Figure 2 | LEfse analysis showing the biomarkers between TC and TCQ. The bar plot shows the relative abundance difference for each biomarker between TC and TCQ. (A–H) Relative abundance of each biomarker in TC and TCQ.
Supplementary Figure 3 | LEfse analysis for XYI and XYII. The bar plot shows the difference in relative abundance for each biomarker identified by Lefse between XYI and XYII. (A–D) Relative abundance of each biomarker in XYI and XYII.
References
Abdel-Aziem, S. H., Abdel-Kader, H. A. M., Alam, S. S., and Othman, O. E. (2005). Detection of MspI polymorphism and the single nucleotide polymorphism (SNP) of GH gene in camel breeds reared in Egypt. Afr. J. Biotechnol. 14, 752–757. doi: 10.5897/AJB2014.14374
Alyokhin, A. (2009). Colorado potato beetle management on potatoes: current challenges and future prospects. Vegetable and Cereal Sci Biotechnol. 1, 10–19.
Alyokhin, A., Baker, M., Mota-Sanchez, D., Dively, G., and Grafius, E. (2008). Colorado potato beetle resistance to insecticides. Am. J. Potato Res. 85, 395–413. doi: 10.1007/s12230-008-9052-0
Berasategui, A., Axelsson, K., Nordlander, G., Schmidt, A., Borg-Karlson, A.-K., Gershenzon, J., et al. (2016). The gut microbiota of the pine weevil is similar across Europe and resembles that of other conifer-feeding beetles. Mol. Ecol. 25, 4014–4031. doi: 10.1111/mec.13702
Chen, B., Teh, B. S., Sun, C., Hu, S., Lu, X., Boland, W., et al. (2016). Biodiversity and activity of the gut microbiota across the life history of the insect herbivore Spodoptera littoralis. Sci. Rep. 6:29505. doi: 10.1038/srep29505
Chung, S. H., Scully, E. D., Peiffer, M., Geib, S. M., Rosa, C., Hoover, K., et al. (2017). Host plant species determines symbiotic bacterial community mediating suppression of plant defenses. Sci. Rep. 7, 1–13. doi: 10.1038/srep39690
Crotti, E., Balloi, A., Hamdi, C., Sansonno, L., Marzorati, M., Gonella, E., et al. (2012). Microbial symbionts: a resource for the management of insect-related problems. Microb. Biotechnol. 5, 307–317. doi: 10.1111/j.1751-7915.2011.00312.x
Dolezal, P., Habustová, O., and Sehnal, F. (2007). Effects of photoperiod and temperature on the rate of larval development, food conversion efficiency, and imaginal diapause in Leptinotarsa decemlineata. J. Insect. Physiol. 53, 849–857. doi: 10.1016/j.jinsphys.2007.04.009
Durand, A. A., Bergeron, A., Constant, P., Buffet, J. P., Dézuel, E., and Guertin, C. (2015). Surveying the endomicrobiome and ectomicrobiome of bark beetles: The case of Dendroctonus simplex. Sci. Rep. 5:17190. doi: 10.1038/srep17190
Edgar, R. C., Haas, B. J., Clemente, J. C., Quince, C., and Knight, R. (2011). UCHIME improves sensitivity and speed of chimera detection. Bioinformatics 27, 2194–2200. doi: 10.1093/bioinformatics/btr381
Engel, P., Martinson, V. G., and Moran, N. A. (2012). Functional diversity within the simple gut microbiota of the honey bee. P. Natl. Acad. Sci. U.S.A. 109, 11002–11007. doi: 10.1073/pnas.1202970109
Guo, J., Wu, J., Liu, S., and Li, J. L. (2015). Regulation function of honeybee gut microbiota and its influence factors. J. Agr. Sci. Tech. 17, 58–63.
Guo, W. C., Tu, E. X., Cheng, D. F., Tan, W. Z., Zhang, Z. K., Li, G. Q., et al. (2014). Advances in research on main biological and ecological techniques of potato beetles in China and monitoring and prevention strategies. Plant Protection Protect. Sci. 40, 1–11. doi: 10.1016/s0065-2504(08)60107-5
Guo, W., Li, C., Ahemaiti, T., Jiang, W., Li, G., Wu, J., et al. (2017). Colorado potato beetle Leptinotarsa decemlineata (Say). Biol. Invasions Manage. China 2017, 195–217. doi: 10.1007/978-94-024-0948-2_10
Haas, B. J., Gevers, D., Earl, A. M., Feldgarden, M., Ward, D. V., Giannoukos, G., et al. (2011). Chimeric 16S rRNA sequence formation and detection in Sanger and 454-pyrosequenced PCR amplicons. Genome Res. 21, 494–504. doi: 10.1101/gr.112730.110
Hare, J. D. (1990). Ecology and management of the Colorado potato beetle. Annu. Rev. Entomol. 35, 81–100. http://dx.doi.org/10.1146/annurev.en.35.010190.000501, doi: 10.1146/annurev.en.35.010190.000501
Huang, S. W., Zhang, H. Y., and Neufeld, J. (2012). The impact of environmental heterogeneity on the gut microbiota of Holotrichia parallela larvae (Coleoptera: Scarabaeidae). PLoS One 8, 396–396. doi: 10.1371/journal.pone.0057169
Wang, Z. T., Xiong, M. H., Lu, W. P., Liu, P., Guo, W. C., et al. (2010). Insecticide resistance status of Colorado potato beetle (Coleoptera: Chrysomelidae) adults in Northern Xinjiang Uygur Autonomous Region. J. Econ. Entomol. 103, 1365–1371. doi: 10.1603/EC10031
Jones, J. C., Fruciano, C., Hildebrand, F., Toufalilia, H. A., Balfour, N. J., Bork, P., et al. (2018). Gut microbiota composition is associated with environmental landscape in honey bees. Ecol. Evol. 8, 441–451. doi: 10.1002/ece3.3597
Jung, S. W., Min, H. K., Kim, Y. H., Choi, H. A., Lee, S. Y., Bae, Y. J., et al. (2016). A DNA barcode library of the beetle reference collection (Insecta: Coleoptera) in the National Science Museum, Korea. J. Asia-Pac Biodivers 9, 234–244. doi: 10.1016/j.japb.2016.03.005
Kang, T. H., Kim, S., Hong, K. J., and Lee, H. S. (2019). DNA barcoding in quarantine inspection: a case study on quarantine insect monitoring for Lepidoptera obtained through quarantine inspection on foreign vessels. Mitochondrial DNA B 4, 43–48. doi: 10.1080/23802359.2018.1536447
Krawczyk, K., Szymańczyk, M., and Obrępalska-Stęplowska, A. (2015). Prevanlence of endosymbionts in Polish populations of Leptinotarsa decemlineata (Coleoptera:Chrysomelidae). J. Insect Sci. 15, 1–6. doi: 10.1093/jisesa/iev085
Kress, W. J., Garcia-Robledo, C., Uriarte, M., and Erickson, D. L. (2015). DNA barcodes for ecology, evolution, and conservation. Trends Ecol. Evol. 30, 25–35. doi: 10.1016/j.tree.2014.10.008
Kuan, X. J., Ge, Feng, and Xue, F. S. (2015). Geographical variation of insect body type and sexual type dimorphism. Acta Entomologica Sinica 58, 351–360.
Ley, R. E., Hamady, M., Lozupone, C., Turnbaugh, P. J., Ramey, R. R., Bircher, J. S., et al. (2008). Evolution of mammals and their gut microbes. Science 320, 1647–1651. doi: 10.1126/science.1155725
Lü, Z. C., Sun, H. B., Wan, F. H., Guo, J. Y., and Zhang, G. F. (2013). High variation in single nucleotide polymorphism (SNPs) and insertions/deletions (Indels) in the highly invasive Bemisia tabaci (Gennadius)(Hemiptera: Aleyrodidae) middle east-asia minor 1(MEAM1). Neotrop. Entomol. 42, 521–526. doi: 10.1007/s13744-013-0152-2
Martin, M. (2011). Cutadapt removes adapter sequences from high-throughput sequencing reads. Embnet. J. 17, 10–12. doi: 10.14806/ej.17.1.200
Michael, B. B., Dawn, E. G., Donald, C. W., Phyllis, A. W. M., and Robert, R. F. (2008). Enteric bacteria of field-collected Colorado potato beetle larvae inhibit growth of the entomopathogens Photorhabdus temperate and Beauveria bassiana. Biol. Control 46, 0–441.
Muratoglu, H., Demirbag, Z., and Sezen, K. (2011). The first investigation of the diversity of bacteria associated with Leptinotarsa decemlineata (Coleoptera: Chrysomelidae). Biologia 66, 288–293. doi: 10.2478/s11756-011-0021-6
Quast, C., Pruesse, E., Yilmaz, P., Gerken, J., Schweer, T., Yarza, P., et al. (2013). The SILVA ribosomal RNA gene database project: improved data processing and web-based tools. Nucleic Acids Res. 41, D590–D596. doi: 10.1093/nar/gks1219
Smith, M. A., Rodriguez, J. J., Whitfield, J. B., Deans, A. R., Janzen, D. H., Hallwachs, W., et al. (2008). Extreme diversity of tropical parasitoid wasps exposed by iterative integration of natural history, DNA barcoding, morphology, and collections. P. Natl. Acad. Sci. U.S.A 105, 12359–12364. doi: 10.1073/pnas.0805319105
Tan, Y. D., Wan, C., Zhu, Y., Lu, C., Xiang, Z., and Deng, H. W. (2001). An amplified fragment length polymorphism map of the silkworm. Genetics 157, 1277–1284.
Tu, X. Y., Xia, Q. W., Chen, C., He, H. M., and Xue, F. S. (2015). Geographic variation in developmental duration of the Asian corn borer, Ostrinia furnacalis (Guenée) (Lepidoptera: Crambidae) in China. Acta Ecologica Sinica 35, 324–332. doi: 10.5846/stxb201303260512
Virgilio, M., Jordaens, K., Breman, F. C., Backeljau, T., and Meyer, M. D. (2012). Identifying insects with incomplete DNA barcode libraries, African fruit flies (Diptera: Tephritidae) as a test case. PLoS One 7:e31581. doi: 10.1371/journal.pone.0031581
Xia, X. F., Sun, B. T., Gurr, G. M., Vasseur, L., Xue, M. Q., and You, M. S. (2018). Gut microbiota mediate insecticide resistance in the diamondback moth, Plutella xylostella (L.). Front. Microbiol. 9:25. doi: 10.3389/fmicb.2018.00025
Yang, X. W., and Zhang, X. X. (1997). Study on reproductive characteristics of haze population in different areas of China. Acta Ecologica Sinica 20, 139–144.
Keywords: Colorado potato beetle (Leptinotarsa decemlineata), geographical sources, 16S rDNA, gut microbiota, biological invasion
Citation: Yu Y, Wang Y, Li H, Yu X, Shi W and Zhai J (2021) Comparison of Microbial Communities in Colorado Potato Beetles (Leptinotarsa decemlineata Say) Collected From Different Sources in China. Front. Microbiol. 12:639913. doi: 10.3389/fmicb.2021.639913
Received: 10 December 2020; Accepted: 22 February 2021;
Published: 19 March 2021.
Edited by:
Baolei Jia, Chung-Ang University, South KoreaReviewed by:
Fangqing Zhao, Beijing Institutes of Life Science (CAS), ChinaDi Liu, Chinese Academy of Sciences, China
Andrei Alyokhin, University of Maine, United States
Copyright © 2021 Yu, Wang, Li, Yu, Shi and Zhai. This is an open-access article distributed under the terms of the Creative Commons Attribution License (CC BY). The use, distribution or reproduction in other forums is permitted, provided the original author(s) and the copyright owner(s) are credited and that the original publication in this journal is cited, in accordance with accepted academic practice. No use, distribution or reproduction is permitted which does not comply with these terms.
*Correspondence: Junfeng Zhai, emhhaWpmQGNhaXEub3JnLmNu
 Yanxue Yu
 Yuhan Wang2
 Hongwei Li
 Wangpeng Shi