 Melinda Choua1
 Michael R. Heath
 Juan A. Bonachela
95% of researchers rate our articles as excellent or good
Learn more about the work of our research integrity team to safeguard the quality of each article we publish.
Find out more
ORIGINAL RESEARCH article
Front. Microbiol. , 20 May 2021
Sec. Virology
Volume 12 - 2021 | https://doi.org/10.3389/fmicb.2021.637490
This article is part of the Research Topic Phage Biology and Phage Therapy View all 13 articles
Hosts influence and are influenced by viral replication. Cell size, for example, is a fundamental trait for microbial hosts that can not only alter the probability of viral adsorption, but also constrain the host physiological processes that the virus relies on to replicate. This intrinsic connection can affect the fitness of both host and virus, and therefore their mutual evolution. Here, we study the coevolution of bacterial hosts and their viruses by considering the dependence of viral performance on the host physiological state (viral plasticity). To this end, we modified a standard host-lytic phage model to include viral plasticity, and compared the coevolutionary strategies emerging under different scenarios, including cases in which only the virus or the host evolve. For all cases, we also obtained the evolutionary prediction of the traditional version of the model, which assumes a non-plastic virus. Our results reveal that the presence of the virus leads to an increase in host size and growth rate in the long term, which benefits both interacting populations. Our results also show that viral plasticity and evolution influence the classic host quality-quantity trade-off. Poor nutrient environments lead to abundant low-quality hosts, which tends to increase viral infection time. Conversely, richer nutrient environments lead to fewer but high-quality hosts, which decrease viral infection time. Our results can contribute to advancing our understanding of the microbial response to changing environments. For instance, both cell size and viral-induced mortality are essential factors that determine the structure and dynamics of the marine microbial community, and therefore our study can improve predictions of how marine ecosystems respond to environmental change. Our study can also help devise more reliable strategies to use phage to, for example, fight bacterial infections.
Cell size is a key trait for microbial systems. Replication rates and physiological traits are generally correlated with cell size, both within and across species (Litchman et al., 2007). For virus-bacteria interactions, the size of the host is particularly important. In this paper, we focus on viral infections as an evolutionary selective pressure for host body size.
The adsorption of viruses to host cells depends on a combination of multiple factors. Host size influences the probability of host-virus encounter (Delbrück, 1940; Rabinovitch et al., 2002), and the density of host receptors to which the virus attaches (Schwartz, 1976; Berg and Purcell, 1977). In addition, the size of the host influences the surface-to-volume ratio, which triggers additional consequences e.g., increasing cell size decreases the diffusion flux per unit cell volume of external nutrient into the cell, but increases internal diffusion rates (Gallet et al., 2017). Both external and internal diffusion rates affect the mobility of intracellular resources used by the host. The latter, among other factors influenced by cell size such as resource uptake, affects the host physiological state. Here, we use growth rate as a proxy for host physiological state because it captures a diversity of intracellular indicators (Bremer and Dennis, 2008). In turn, the host physiological state influences the performance of the viral infection (Calendar and Abedon, 2005) and thus the dynamics of both viral and bacterial populations (Choua and Bonachela, 2019).
Viral infection starts when the virus encounters a host and becomes irreversibly attached onto a specific receptor at the host surface, with the frequency of successful encounters defining the adsorption rate (Calendar and Abedon, 2005). Once adsorbed, the virus perforates the cell’s membrane and inserts its genome into the host cytoplasm, which triggers the biosynthesis of viral genome and proteins by the host machinery. The host machinery (ribosomes, ATP, etc.) is therefore monopolized by the virus to transcribe proteins that will constitute the viral offspring. The time between attachment and the assembly of the first virion defines the eclipse period, and the number of virions assembled per unit time is the maturation rate, both depending mainly on the host physiological state. The lytic cycle ends with the lysis of the host and the consequent release of virions into the environment (Abedon et al., 2003). The time between adsorption and host lysis, and number of virions released to the environment per infection, define the latent period and burst size, respectively. For a given host growth rate, longer latent periods typically lead to larger burst sizes (Abedon, 1989; Gnezda-Meijer et al., 2006; Wang, 2006).
Experimental work has shown that these key viral traits are not fixed, but change with the host physiological state (Rabinovitch et al., 2002; You et al., 2002; Birch et al., 2012; Golec et al., 2014): eclipse and latent periods decrease, and maturation rate and burst size increase, with host growth rate. Thus, intracellular changes in the host (effectively the phage’s environment) lead to either active or passive responses by the virus, which are typically referred to as viral phenotypic plasticity (Abedon et al., 2001; Choua and Bonachela, 2019).
Viral plasticity has been shown to have important ecological and evolutionary implications for host-phage systems (Thyrhaug et al., 2003; Weitz and Dushoff, 2008; Wang and Goldenfeld, 2010; Edwards and Steward, 2018; Choua and Bonachela, 2019; Choua et al., 2020). It is yet to be determined, however, how viral plasticity affects the evolution of the host and, more specifically, the evolution of a trait so important for bacteria-virus interactions as host body size. Larger bacterial cell sizes lead to higher maximal growth rates (Gallet et al., 2017), but typically decrease uptake affinity (Wirtz, 2002) and render the host more susceptible to viral adsorption (Delbrück, 1940). Accounting for viral plasticity, a host with a higher growth rate will not only replicate faster but will also facilitate viral replication (i.e., the virus will release more virions in a shorter time) (Choua and Bonachela, 2019). This change, in turn, may alter the selection pressure on e.g., the viral latent period, as an increase in infection time enables the release of more virions but decreases the opportunities of subsequent infections by the new offspring (Choua and Bonachela, 2019). Here, we aim to understand from an evolutionary viewpoint how host and virus affect each other in different environments, with emphasis on how viral plasticity might affect their coevolution.
Bacteria-phage coevolution has previously been studied in the context of an “arms race” (Morgan and Koskella, 2011), e.g., using theoretical systems where the host evolves resistance by changing the receptors used by the virus for attachment at a fitness cost, and the phage responds to this resistance by adapting its tail fiber to overcome the receptor changes (Weitz et al., 2005; Menge and Weitz, 2009). These studies showed that, for example, coevolution maintains phenotypic and genetic diversity within microbial communities (Koskella and Brockhurst, 2014). However, none of these studies have considered how the presence of an inherently plastic virus affects this coevolution.
To fill this knowledge gap, here we use a standard host-lytic phage model that we modified to include viral plasticity. To implement coevolution, we used a numerical ecoevolutionary framework that focuses on host size and viral latent period as representative evolving traits. With this framework, we compare the traits that emerge under coevolution to those emerging when host evolves without virus, and to those obtained in previous work when host does not evolve but virus does (Choua and Bonachela, 2019). Theoretical studies like ours can help understand and predict the coevolutionary dynamics of host and phage, and therefore contribute to a wide variety of fields, from increasing the effectiveness and safety of phage therapy to improving the reliability of biogeochemical models, since bacterioplankton cell size plays a central role in the prediction of the response of marine ecosystems to climate change (Finkel et al., 2009).
To represent the ecological dynamics of the host- phage system, we used a well-known model that considers explicitly the delay between infection and lysis (Levin et al., 1977). This model has been ecologically validated by experiments, and proven to provide evolutionarily meaningful outcomes (Bonachela and Levin, 2014). The model keeps track of the dynamics of a generic nutrient (N), uninfected hosts cells (C), infected hosts (I) and extracellular viruses (V). The environmental conditions are set up to those of a chemostat, i.e., a well-stirred controlled environment in which the host and phage encounter each other randomly. Because we assume that, once a host is infected, its machinery is devoted to viral production, infected hosts do not replicate and therefore the host’s generation time does not constrain the viral latent period. We further consider that bacteria grow in the limited volume of the chemostat, and thus system-size effects can trigger competition for space, light, or other resources not explicitly modeled here that can limit/hinder population growth. This crowding effect can be implemented through a density-dependent term, in our case a quadratic loss term that only affects free hosts as uptake and growth stop at infection.
Thus, assuming that a host phenotype i is characterized solely by its size (i.e., all host types are phenotypically identical except for their size and consequently any trait related to it), and a viral phenoptype j is characterized by its latent period, the equations for the dynamics of the different phenotype populations and the nutrient are given by:
(see definitions of symbols and units in Table 1). The first equation represents the dynamics of the concentration of the most limiting nutrient within the chemostat, with an inflow and outflow of nutrient (first term) and the nutrient uptake by all possible host phenotypes present in the chemostat at time t (second term). For the sake of concreteness, we assume that carbon is the most limiting nutrient. Note that we assume the yield factor Y (i.e., how much the host population can grow per unit of resource) to be the same for all host phenotypes. Equation (2) describes the growth of each host phenotype population, Ci, as a result of reproduction (first term), infection by the different viral phenotypes present in the chemostat at time t (second term), bacterial loss due to dilution (third term), and population growth slowdown due to crowding (fourth term). Equation (3) keeps track of the cells infected by viral phenotype j (equally, the number of intracellular viruses, as we consider that a host can be infected by only a single viral individual, i.e., there is no superinfection). The first term represents the new infected individuals resulting from the adsorption of that specific j viral phenotype. Infected cells disappear during dilution (last term) or due to the lysis of the cells that became infected exactly one latent period (L_j) in the past (second term, where e−wLj is the probability for infected cells to survive dilution during the latent period). The lysis of these infected cells releases new free phage for viral phenotype j (first term in Eq. (4), with B representing the burst size, see below). This pool of free phage then decreases due to phage adsorption (second term), and natural mortality and dilution (last term).
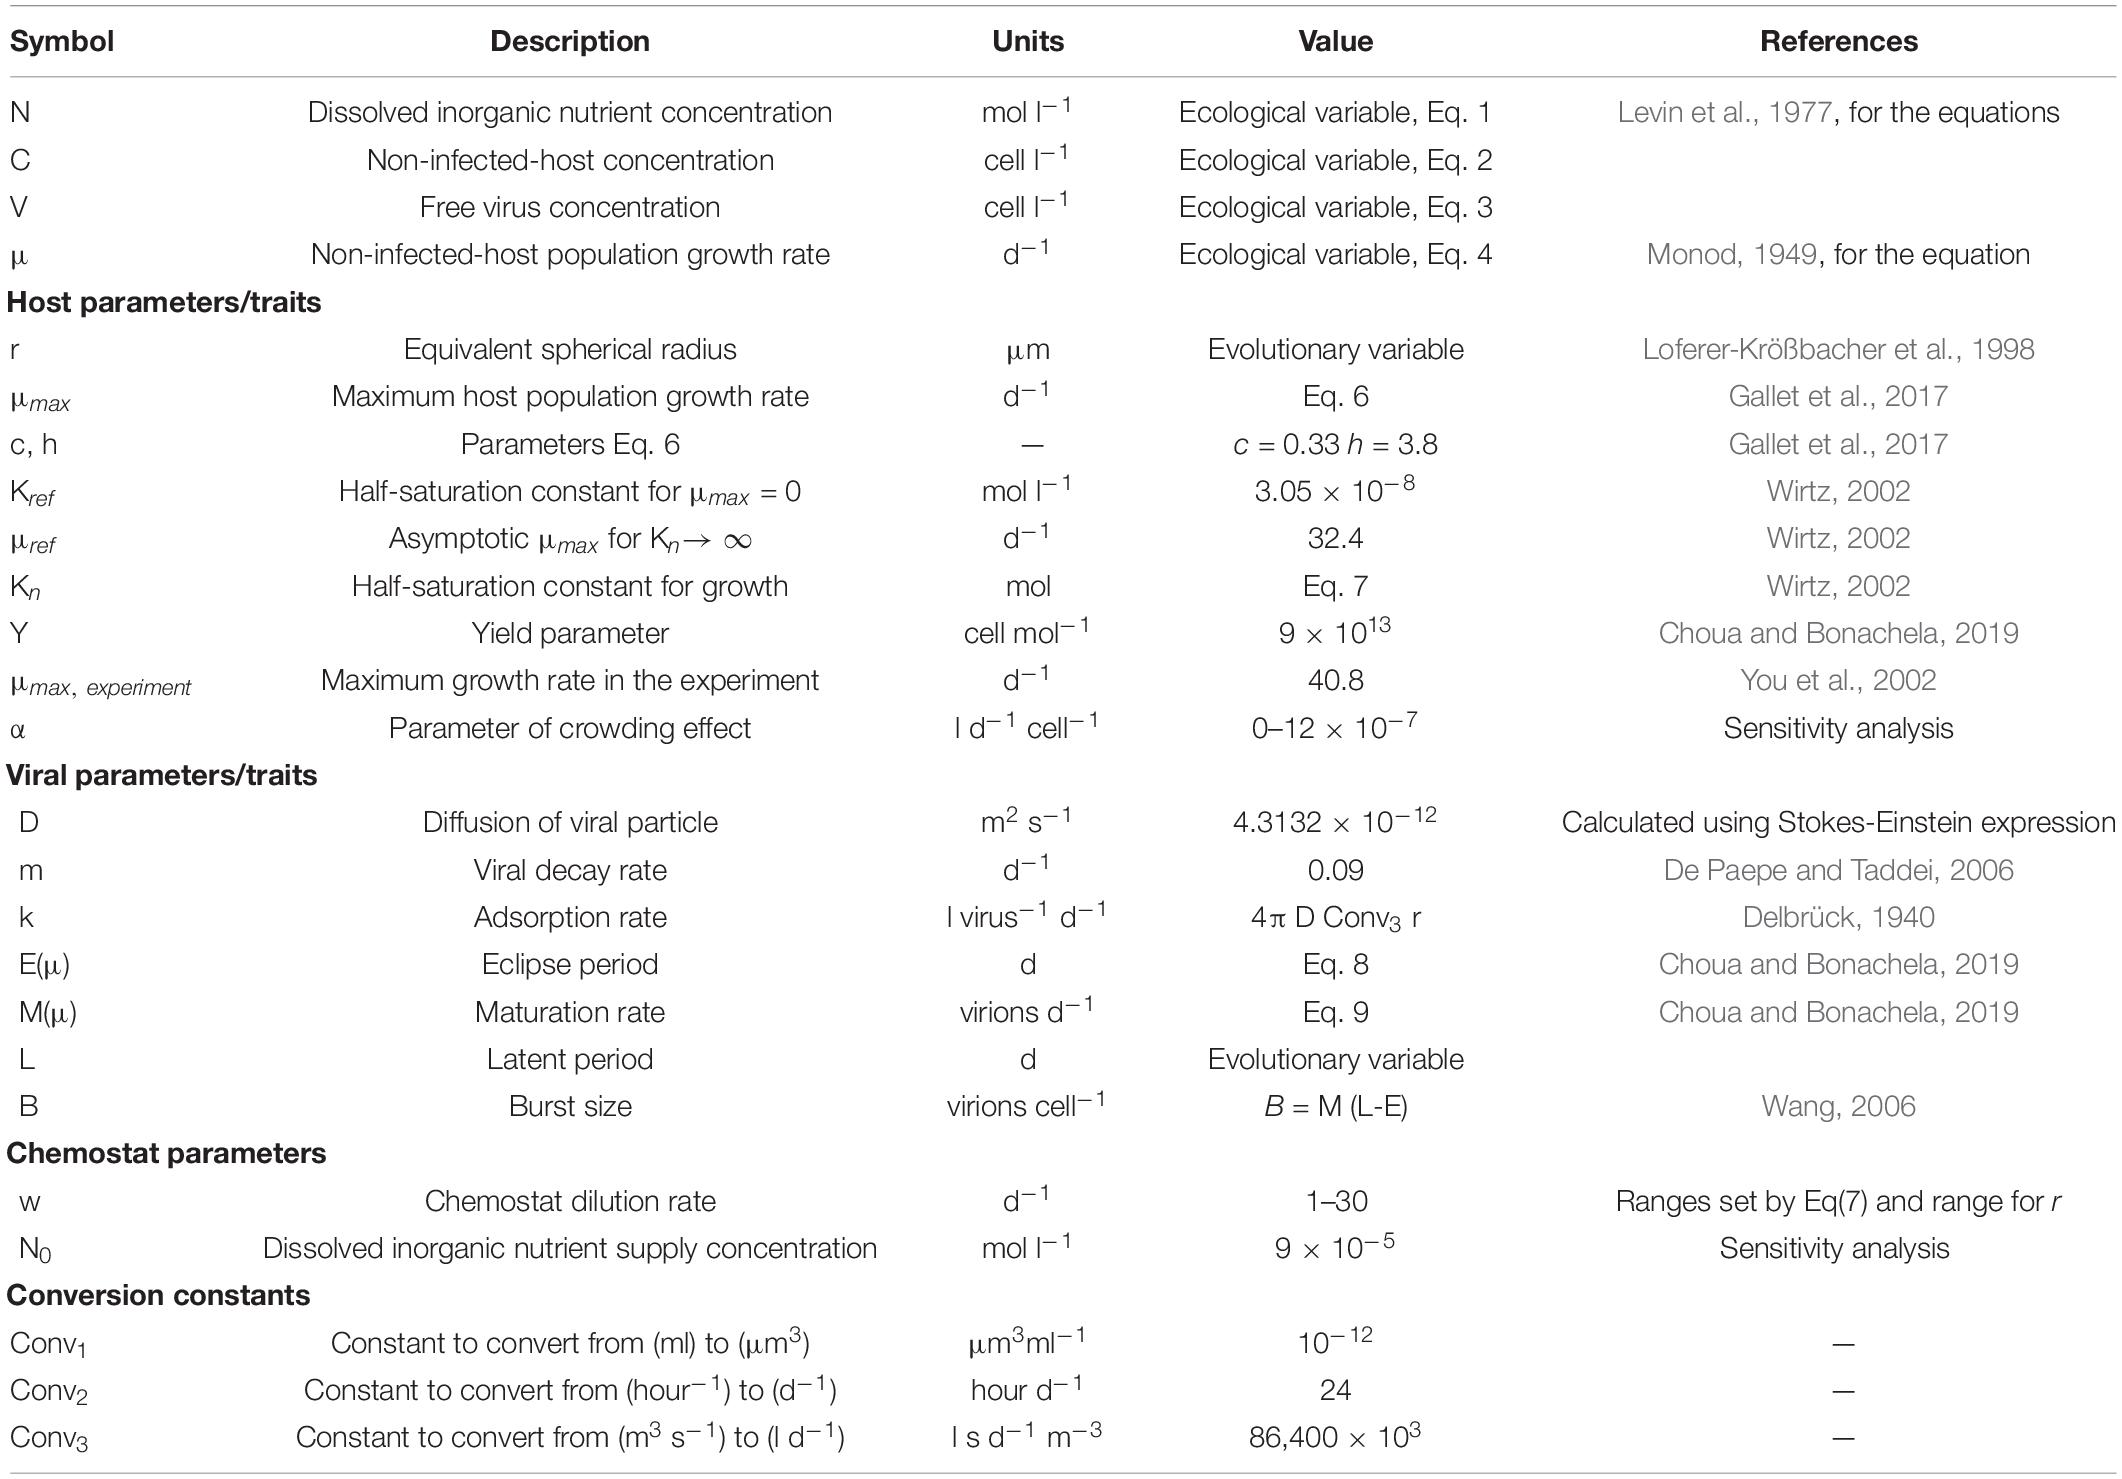
Table 1. Symbols for variables and parameters used 1in the model.
We assume that free hosts grow according to the classic Monod equation (Monod, 1949):
where μmax(ri) is the maximum growth rate, and Kn(μmax) (half saturation constant for growth) is inversely correlated with the affinity of the uptake/growth machinery for this nutrient. As explained below, both traits depend on the host’s cell size, ri (Chien et al., 2012).
We use this model to represent host and phage coevolution by letting the host size and viral latent period evolve. We implement evolution using a genetic algorithm in which the phenotype with the highest probability to be selected for mutation (i.e., the one with the highest relative abundance in the system) generates a new mutant phenotype. A new host phenotype is identical to the parental cell except for its radius, chosen randomly from a normal distribution centered on the parental value and with a standard deviation of 0.1 microns. Similarly, a new viral phenotype is identical to the parent except for the value of the latent period, chosen randomly within a normal distribution centered on the parental value with a standard deviation of 10−3 days (narrowed to 10−4 days for the last 5,000 days of the simulation, when the algorithm is expected to have reached the vicinity of the evolutionary steady state). This leads to the addition of a new population every time a host mutant and/or a virus mutant join the system (Menge and Weitz, 2009; Choua and Bonachela, 2019). Note that, here, any viral phenotypes can infect any of the host phenotypes (i.e., generalist virus). Although phage are relatively specific (i.e., virus adsorbs to only a limited subset of the total bacteria), they have been shown to become generalist when coevolving with their host (Hall et al., 2011).
For most microorganisms, size is a master trait because it affects most aspects of their life cycle (Litchman et al., 2007). Although the metabolic theory of ecology states that the growth rate of microbes decreases with increasing body size (Brown et al., 2004), recent experimental data showed that maximal growth rates tend to increase with body size for organisms smaller than six microns (Gallet et al., 2017; Ward et al., 2017). These data revealed a key trade-off between rates of resource acquisition and the rate of internal metabolism (i.e., μmax), which suggests different limiting factors for small and large organisms. For small cells such as bacteria, molecular transit time inside the cell can be the limiting factor whereas uptake rate limits larger cells (Gallet et al., 2017); also, the rate at which internal quotas are replenished by nutrient uptake limits smaller cells but nutrient conversion into biomass limits larger cells (Ward et al., 2017).
Here, we choose size as single trait characterizing the host, and use allometries to calculate the rest of trait values that are relevant for host dynamics. We specifically focus on Escherichia coli as host, but our approach can be generalized to any bacterium. Existing experimental work provides an allometric expression linking the radius, r, of the bacterium (assumed spherical) and its maximum potential for growth, μmax (Gallet et al., 2017; Shestopaloff, 2016):
(see Table 1 for symbols and units) where the c and h parameters determine how steeply the maximum growth rate increases with ri. In turn, the two Monod parameters are positively correlated with each other, which determines a relationship that can be mathematically expressed through the following function (Wirtz, 2002):
where μref represents the asymptotic maximal growth rate for an infinitely high K_n and Kref represents half-saturation constant at μmax=0. Other forms for this relationship have previously been shown not to affect qualitatively the ecological predictions of this model (Choua et al., 2020). Note that Eq.(7) together with Eq.(6) entail that nutrient affinity declines as cell size increases.
We focus here on the T-phage subfamily, which infects E. coli through receptors that occupy up to 75% of the cell surface (Nikaido and Vaara, 1985). The latter allows us to approximate, for simplicity, that all collisions lead effectively to adsorption (Delbrück, 1940; Schwartz, 1976; Berg and Purcell, 1977). Importantly, the size of the host affects the viral adsorption rate, which has been represented in the past using the linear function ki=4riπD (Delbrück, 1940), where D is the diffusion coefficient of the phage.
Although the exact factors that determine the latent period, Lj, are unknown, evidence points to the so-called holin gene as the responsible of the timing of lysis (Young and Bläsi, 1995; Wang et al., 2000; Ramanculov and Young, 2001; White et al., 2011). This link between Lj and the holin gene justifies the characterization of phenotypes using the latent period as an evolving trait. Because this timing is typically smaller than the time needed to deplete the host resources involved in virion production (Rabinovitch et al., 1999; Wang, 2006), we assume that the burst size is only limited by the number of phage that has been assembled between the end of the eclipse period and lysis. This assumption is usually represented by the linear function B=M(L−E) (Wang, 2006). We consider here that E and M, respectively, the eclipse period and maturation rate, depend on the physiological state of the host (represented by the host growth rate, μi) through the following data-informed expressions (Choua and Bonachela, 2019):
In short, E decreases and M increases with the host growth rate. Both functional forms show a plateau at high growth rates, which reflects the physiological limits of the host machinery to synthesizing proteins (Choua and Bonachela, 2019). E∞ and E_0 determine E for very low growth rates, αE determines the slope of the (decreasing) function, and μmax, experiment is the maximal growth rate that the host reached in the experimental data used to deduce Eqs. (8)–(9); M∞ represents the upper plateau of the increasing sigmoid, αM how steeply M reaches it, and M_0 the midpoint of the function. Finally, Eq. (8) shows a finite value for μ→0, which represents the possibility of viral reproduction at very low host growth rates, observed experimentally (Golec et al., 2014). Alternatively, for such extreme conditions the virus may switch from lytic to temperate mode (e.g., lysogeny). Although such change in viral strategy can certainly influence the coevolution of the system, here we focused on obligate-lytic viruses since the main plastic traits above are linked to cell lysis. All together leads to the following plastic representation of the burst size for viral phenotype j infecting host i:
For each host phenotype i, the viral traits [i.e., , , and thus B_j] are adjusted at each integration step to follow updates in the host growth rate. In contrast, models that neglect viral plasticity use fixed values for E and M, obtained from experiments that standardly set optimal conditions for the host (Abedon et al., 2001). In consequence, the associated E=Enon and M=Mnon reflect the performance of the host machinery at the maximum growth rate expected for the particular phenotype, i.e., at μi=μmax(ri). These values are thus host-specific: because different host phenotypes/strains show different sizes and therefore different μmax, Enon and Mnon must follow accordingly. As we could not find values for E and M for all the different host sizes used in our simulations, we estimated those values as Enon(ri)=E[μmax(ri)] and Mnon(ri)=M[μmax(ri)]. In consequence, the burst size for the non-plastic virus follows here the expression:
We use Matlab® to integrate numerically these equations under different environmental conditions (i.e., different values of w and N0) and, due to the limited amount of information available about the (broadly defined) crowding strength, we also vary the parameter α in a range commensurate with the rest of terms in Eq.(2). Specifically, we try α = 0 (i.e., no crowding), α=10−6lcell−1d−1, and 10−7cell−1d−1.
Thus, during 104 simulated days (enough for the system to reach stationarity), multiple hosts compete for the common nutrient (bottom-up regulation) while experiencing the mortality exerted by the viral populations (top-down pressure), which in turn compete for the available hosts. In our system, host size can evolve between 0.3 to 1.1 μm, range that provides trait values usually observed for E. coli (i.e., host volume, μmax, and K_n are compatible with experimental observations) (Schulze and Lipe, 1964; Loferer-Krößbacher et al., 1998; Füchslin et al., 2012). On the other hand, the viral latent period can evolve between a realistic maximal value for T-phage of 2 days and a certain minimal value. This minimal value is calculated based on the host phenotype that shows the highest growth rate (i.e., the smallest E) among all the host mutants, which ensures a minimal latent period bigger than any eclipse period in the system. The latter is necessary because we assume that any viral phenotype can infect any available host. We also consider that both host and virus mutate at similar times. Increasing the viral mutation rate to up to 5 times that of the host did not change the probability of coexistence nor the number of functional combination (results not shown), and therefore we set the less-computationally-expensive limit of equal timing for both host and viral mutations.
With this model and constraints, and starting from a pair of host-virus phenotypes with (L,r) randomly chosen within the ranges above, mutation and selection enable the stochastic exploration of the phenotypic space until, eventually, a combination of phenotype maximizing fitness for the host and virus emerges: the Evolutionary Stable Strategy (ESS) (LESS,rESS). Due to the stochastic character of the simulation, we run up to 500 replicates for each combination of w,N0, and α, in order to find the ESS as the average of the trait values emerging over replicates. We further compare the emergent ESS for both plastic and non-plastic viruses, running for the latter the non-plastic version of the model (Eq. 11).
Out of the many replicates, we select the cases that show coexistence between host and virus at the end of the simulation, and reject those that lead to host and/or viral extinction. Moreover, in order to focus on the evolutionarily stable values of the evolving traits, we retain only the replicates for which a true dominant phenotype can be discerned. Specifically, we label as dominant the phenotype such that its abundance represents more than 75% of the total mutant community (i.e., both and above 0.75, where the subscript “st” refers to the stationary state obtained by averaging the 20 last days of the simulation).
We then analyze how these (LESS,rESS) combinations vary as w, N0, and α change. For each case, we compare the (LESS,rESS) for the plastic case to those obtained for the non-plastic description of the system. Finally, we compare (i) the LESS emerging from coevolution to the analytical expression provided by Choua and Bonachela (2019) for a system where only the virus evolves; and (ii) the rESS emerging from coevolution to the ESS obtained in a system where bacteria evolve in the absence of viruses.
Note that extreme conditions deterministically result in a number of useable combinations (LESS,rESS) that is lower than our original number of replicates. For example, at low dilution rates, virus and host cannot coexist as the associated low growth rate eventually leads to the extinction of the host (followed by the extinction of virus); at high dilution rates, viral mortality is very high and the viral population goes to extinction, which allows the host to thrive alone.
In a simple system where the virus and crowding effect are neglected (i.e., V=α=0), both the ecological and evolutionary dynamics of the host can be assessed analytically (see Supplementary Appendix A). The analytical results show that the ESS for the host presents a size that minimizes nutrient consumption, in agreement with classic competition theory (Tilman, 1982). On the other hand, in cases where the virus is absent but the crowding effect is considered (i.e., V=0,α≠0), the evolutionary stationary state of the host can be calculated numerically using the genetic algorithm described above. As the dilution rate increases, the emerging host size increases with the dilution rate and eventually saturates (see Figure 1). Because the dilution rate is positively correlated with nutrient concentration (see Figure 2), increasing w leads to bigger hosts in richer environments and, eventually, an emerging size is reached that maximizes host growth (see Supplementary Appendix C). As a consequence, for w values beyond a specific threshold, the host does not survive because growth (limited by its maximum value and nutrient availability) cannot overcome the increasing mortality due to dilution. Increasing crowding strength increases the emerging host size, which still ultimately saturates at the same value (see Supplementary Appendix B).
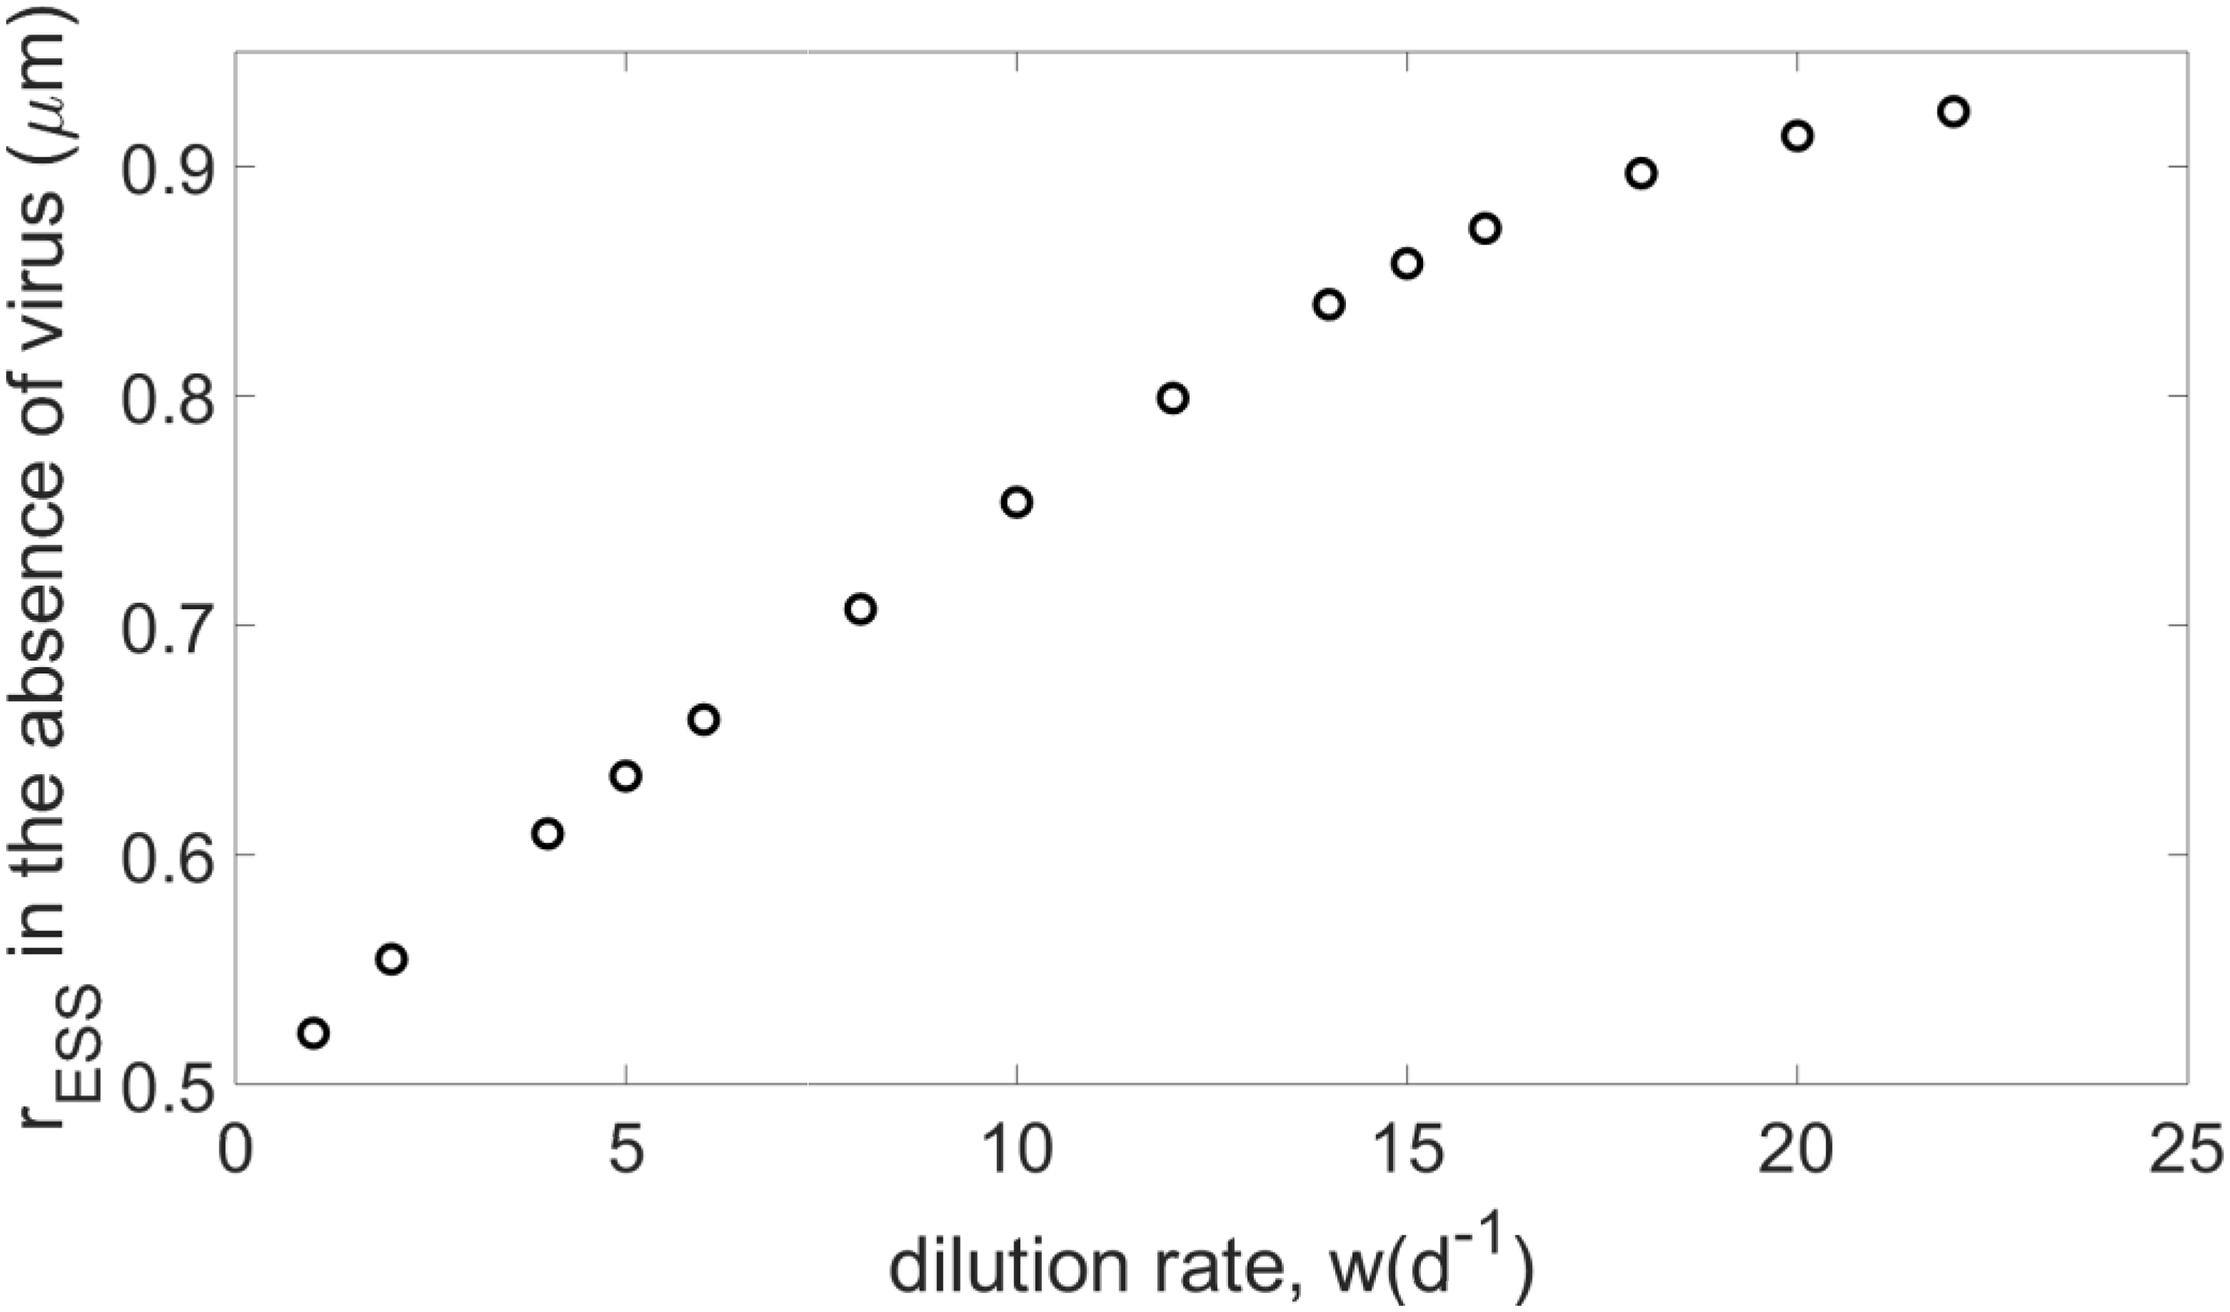
Figure 1. Evolutionary stable strategies (ESS) when the host evolves in the absence of the virus, for N0=10−5moll−l and α=10−8lcell−1d−1, and different dilution rates.
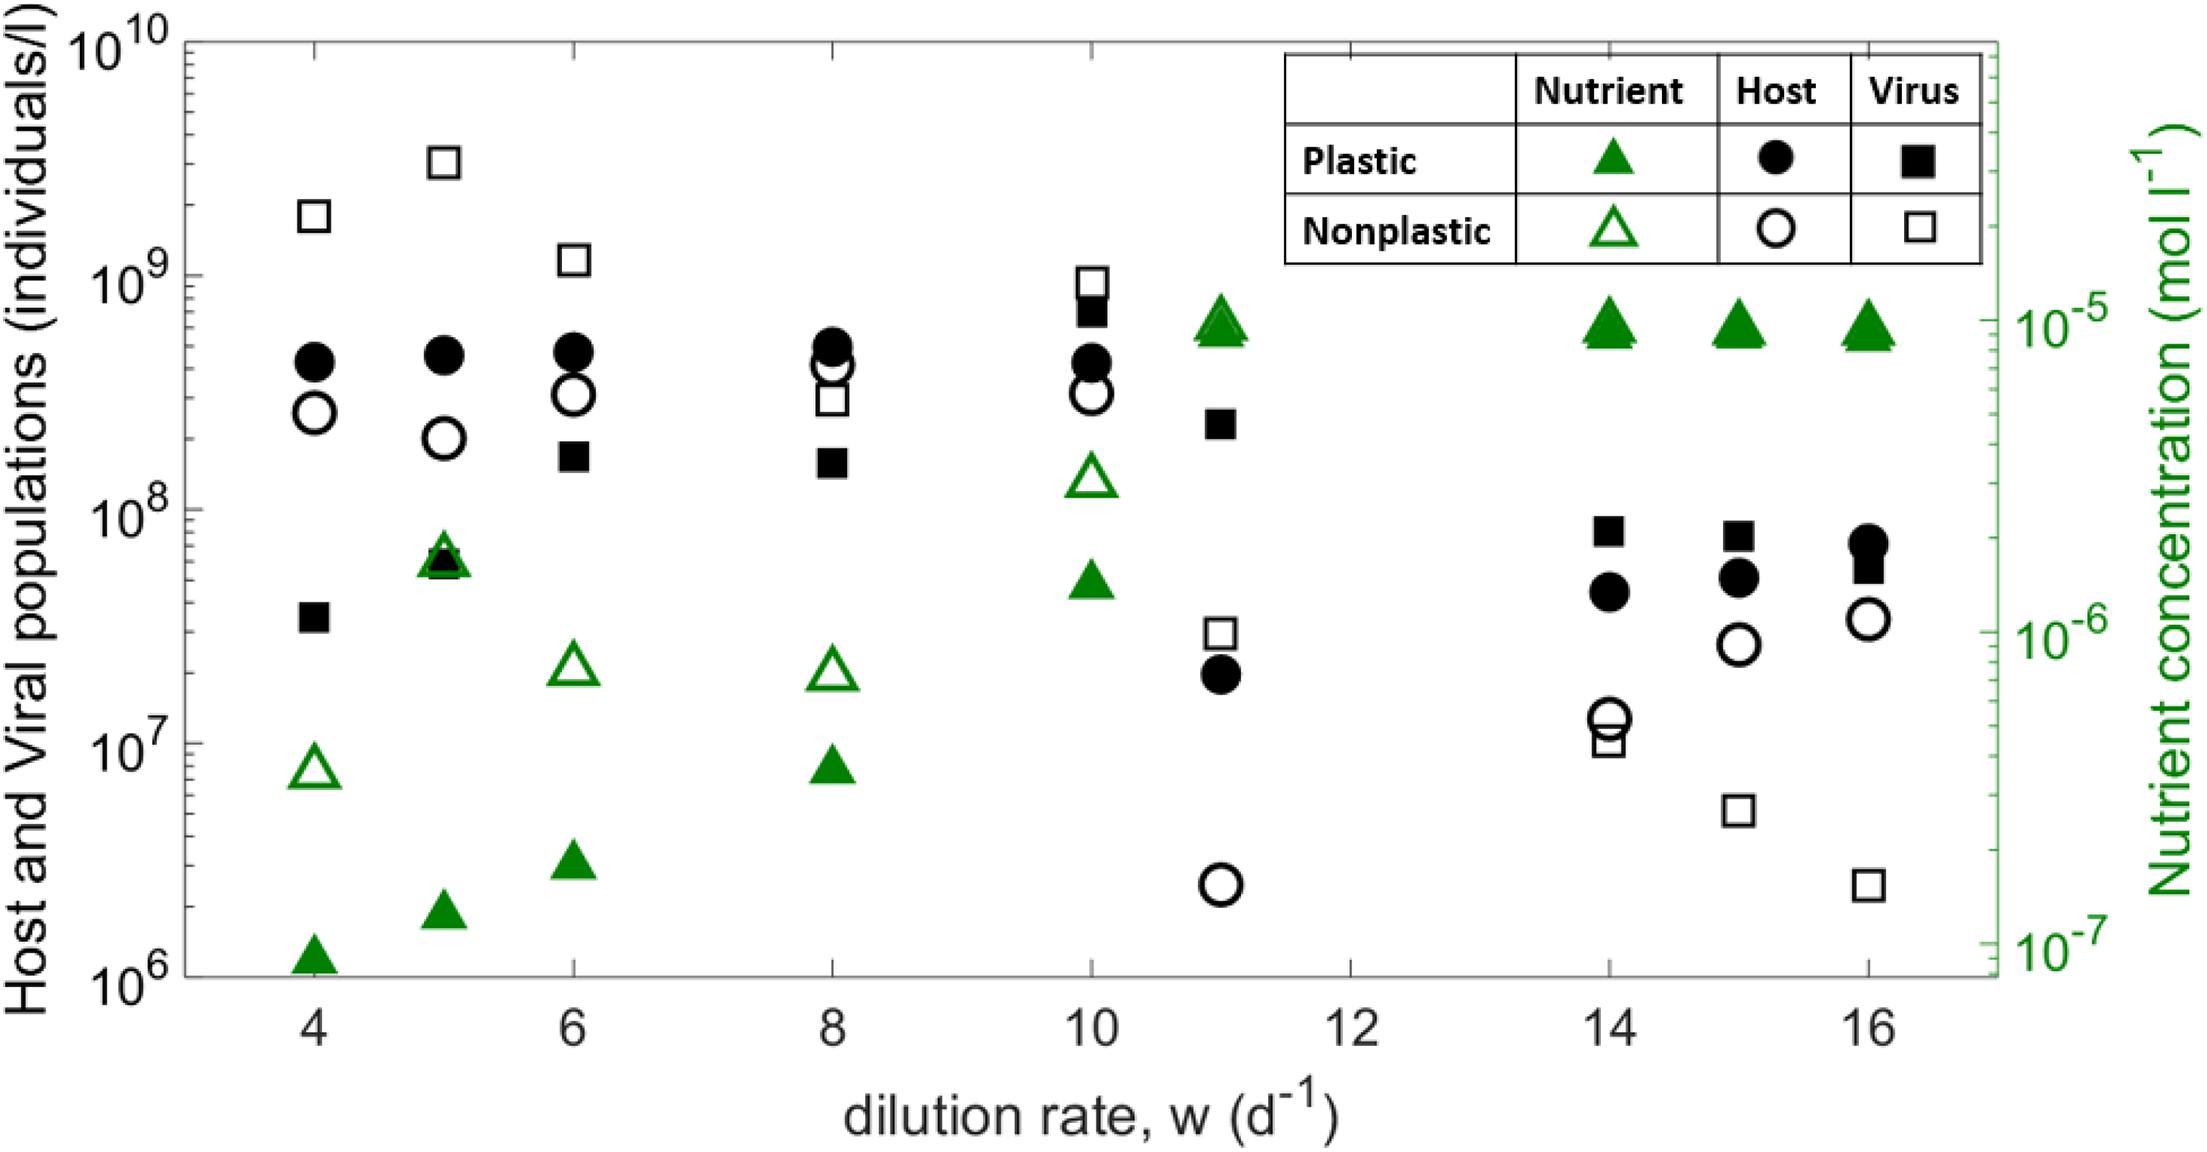
Figure 2. Median across replicates for the host, viral and nutrient concentrations averaged over the last 20 days of each replicate, as a function of the dilution rate. Note that small dilution rate led to wide oscillations [e.g., for w = 4 d−1 in the plastic case N varies between10−8 and 10−5moll−1].
The coevolution of host and virus allows for wide regions of coexistence. Both plastic and non-plastic versions of the model predict similar qualitative behavior for nutrient and host density as a function of the dilution rate (Figure 2). As the dilution rate increases, both cases show an increasing nutrient availability and a slightly negative correlation with host availability. Viral density, however, shows a negative trend in the non-plastic case, whereas it remains approximately constant for the plastic model. From a quantitative point of view, host availability is larger for the plastic version of the model. For low to mid dilution rates, hosts in the plastic model show a much lower growth than the non-plastic case, which results in a lower viral burst size (Supplementary Figure 1). The consequent decrease in viral density decreases top-down pressure on the host, which ultimately reaches densities higher than those of the non-plastic model. Thus, viral density is lower for the plastic case for mid-to-low dilution rates, but vice versa for high dilution. For the latter regime, the non-plastic case shows higher nutrient densities, but for both cases the nutrient concentration saturates to N_0 for high dilutions, which ultimately leads to similar growth rates and burst sizes but larger latent periods for the plastic case (Supplementary Figure 1). The emerging eclipse period is also longer for the latter case, whereas the maturation rate is smaller (Supplementary Figure 2).
As (Supplementary Figure 3) shows, the combinations (LESS,rESS) emerging from different replicates for a given dilution rate are clustered around a clear mean value, indicating that only one true combination of host size and latent period results from each environment. For a better visualization, we show in Figure 3 only the means for the evolving traits. The emergent host size and viral latent period show a negative correlation. For mid-to-low dilution rates, the same parametrization typically produces a smaller rESS for the plastic case than the non-plastic case, while LESS is smaller at lower dilution rates but becomes larger at higher dilution rates. At w=10d−1, rESS saturates to the host size that provides the highest growth for the fixed N_0 (see Supplementary Appendix C), showing that the system is limited by external factors (i.e., nutrient input). Increasing N0 increases both LESS and rESS, as well as the saturation threshold (see Supplementary Appendix C). Note that coexistence is not reached for w < 4d−1or w > 16d−1. In addition, the strength of the crowding effect tends to increase the emerging host size rESS, but barely affects the emerging latent period LESS (see Supplementary Appendix B).
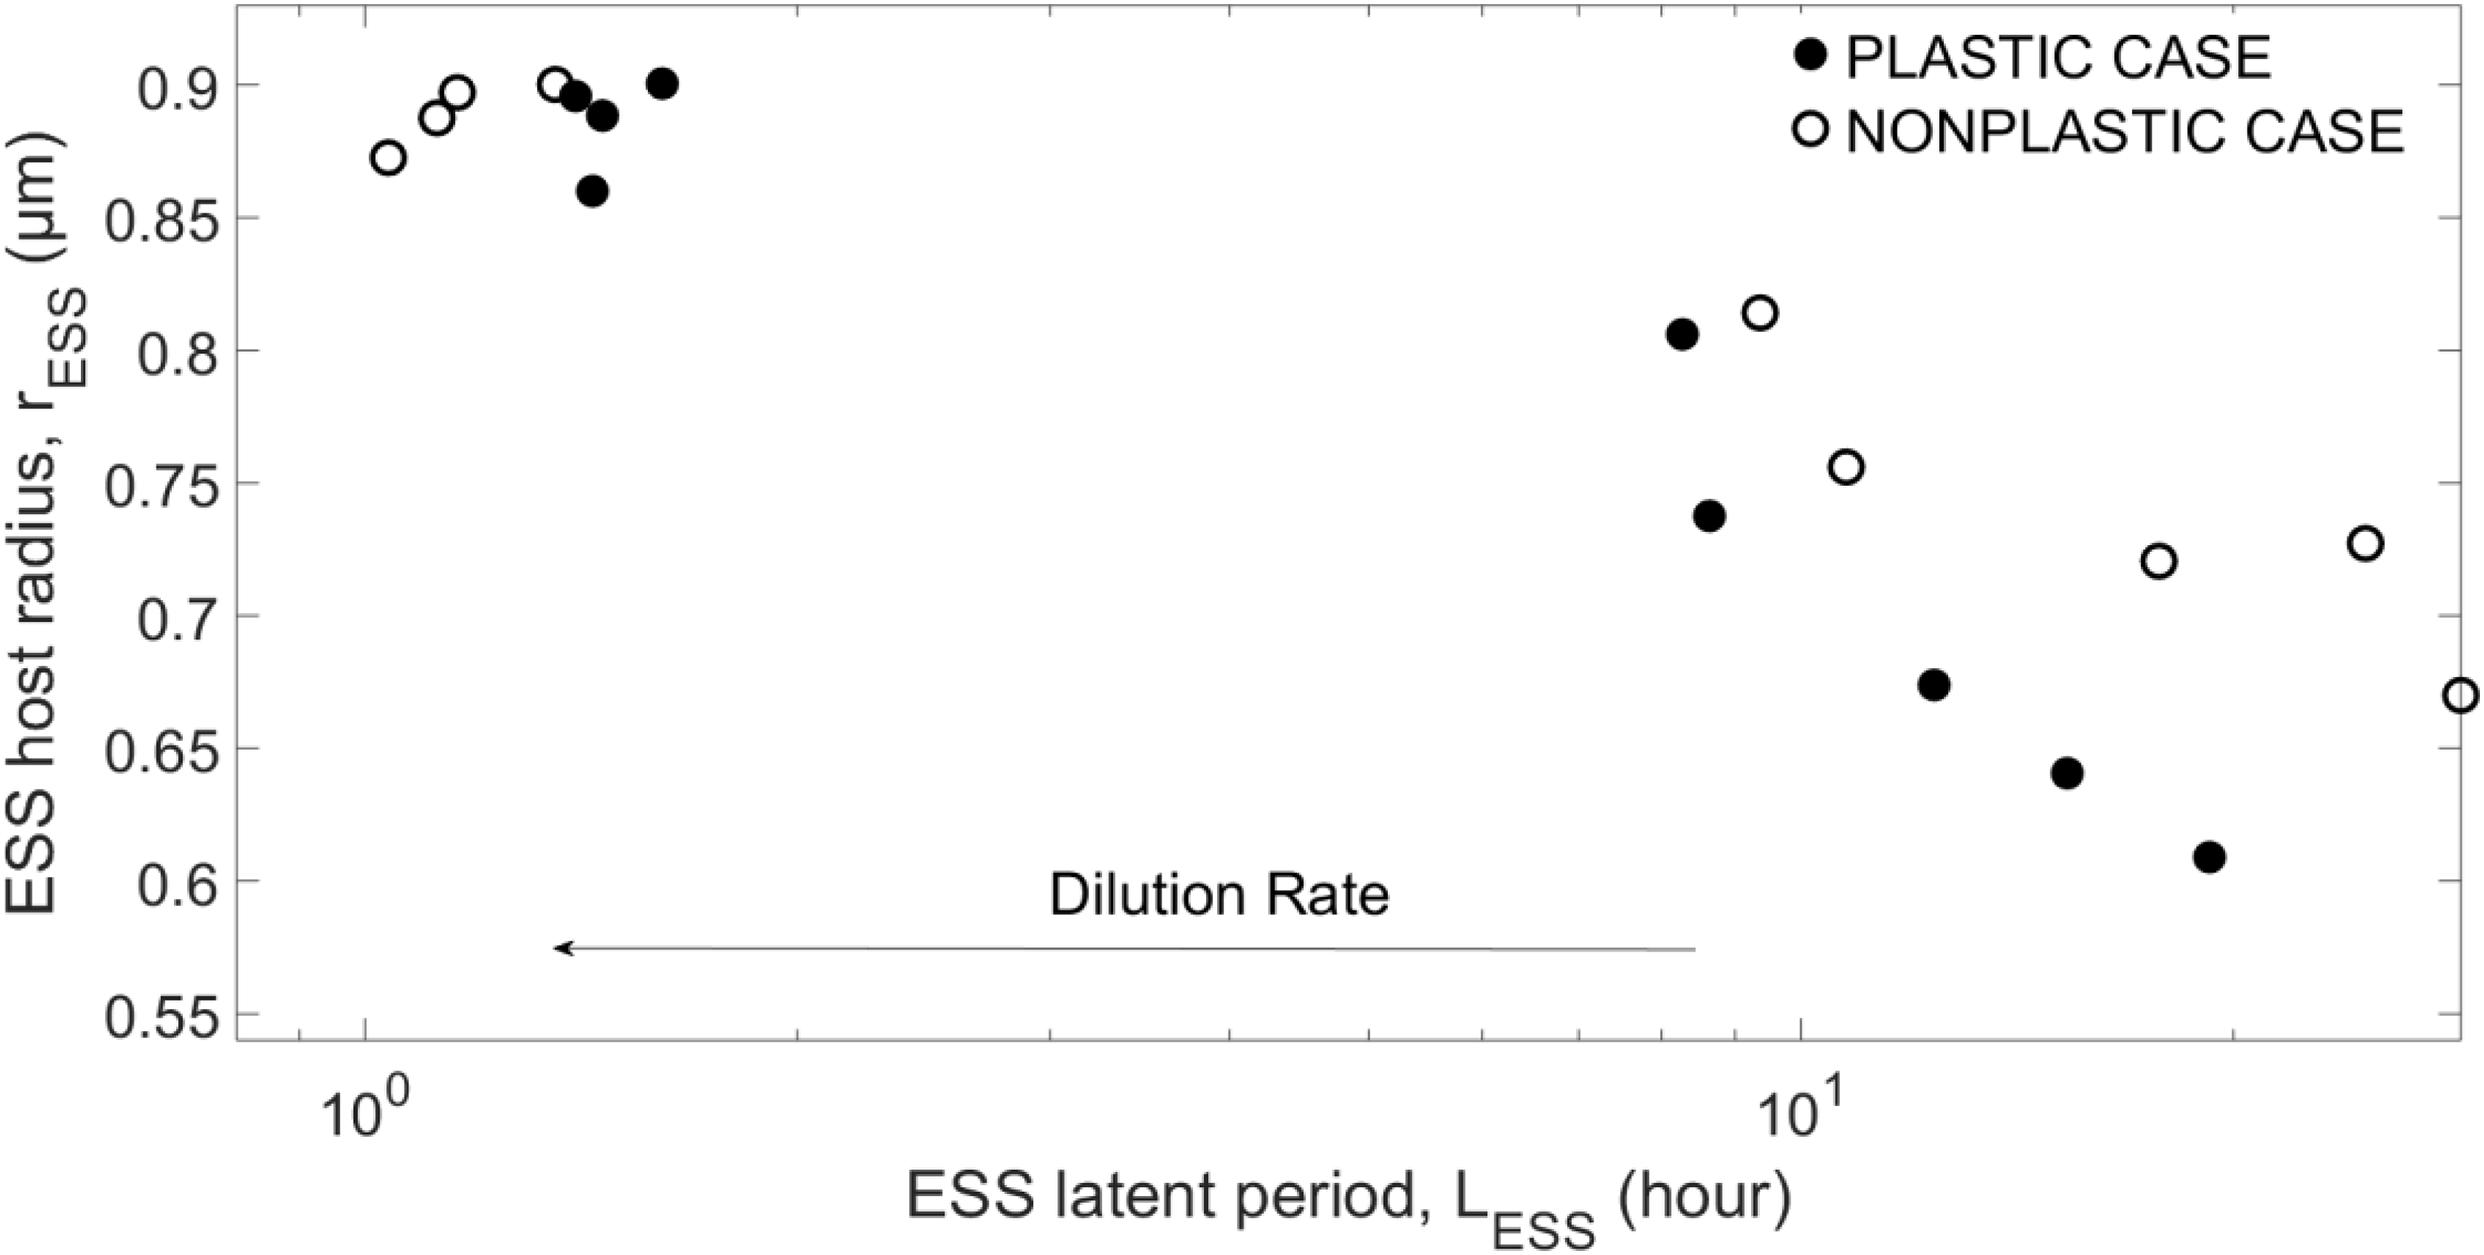
Figure 3. Evolutionary stable strategies (ESS) for the host and virus obtained for N0=10−5moll−1 and α=10x10−9lcell−1d−1, and different dilution rates.
Host size plays two distinct roles in our model: it affects (i) host quality by influencing μmax [Eq.(6)], and (ii) the number of infections by influencing the adsorption rate. In order to separate the influence of those effects on the emerging traits, we also check the emerging ESSs when the adsorption rate is fixed (i.e., k=3⋅10−9lvirus−1d−1). Our results do not change qualitatively when using a fixed adsorption rate (not shown).
In order to understand the role of coevolution in the selection of the evolving traits (host size and viral latent period), we compare, respectively, the rESS and LESS emerging from coevolution with the emerging (i) rESS obtained when the host evolves alone and (ii) LESS obtained when the virus evolves with only one single host phenotype. For the latter, we use the expression , calculated analytically in Choua and Bonachela (2019).
Figure 4 shows that, as the dilution rates increases, the rESS resulting from the plastic case departs from the virus-free case, resulting in a larger host. The rESS in the non-plastic case shows larger host sizes than the plastic cases for all dilution rates, although both plastic and non-plastic cases converge to a similar value at high dilution rates. For low dilution rates, the emergent host size in the case of the plastic virus is similar to that without the virus. Supplementary Figure 4 shows that the resulting host growth rate follows a pattern similar to that described for host size. Host availability for the plastic case remains similar to the case without virus for most dilution rates, whereas the non-plastic virus keeps the host concentration lower than in the absence of the virus (Supplementary Figure 5).
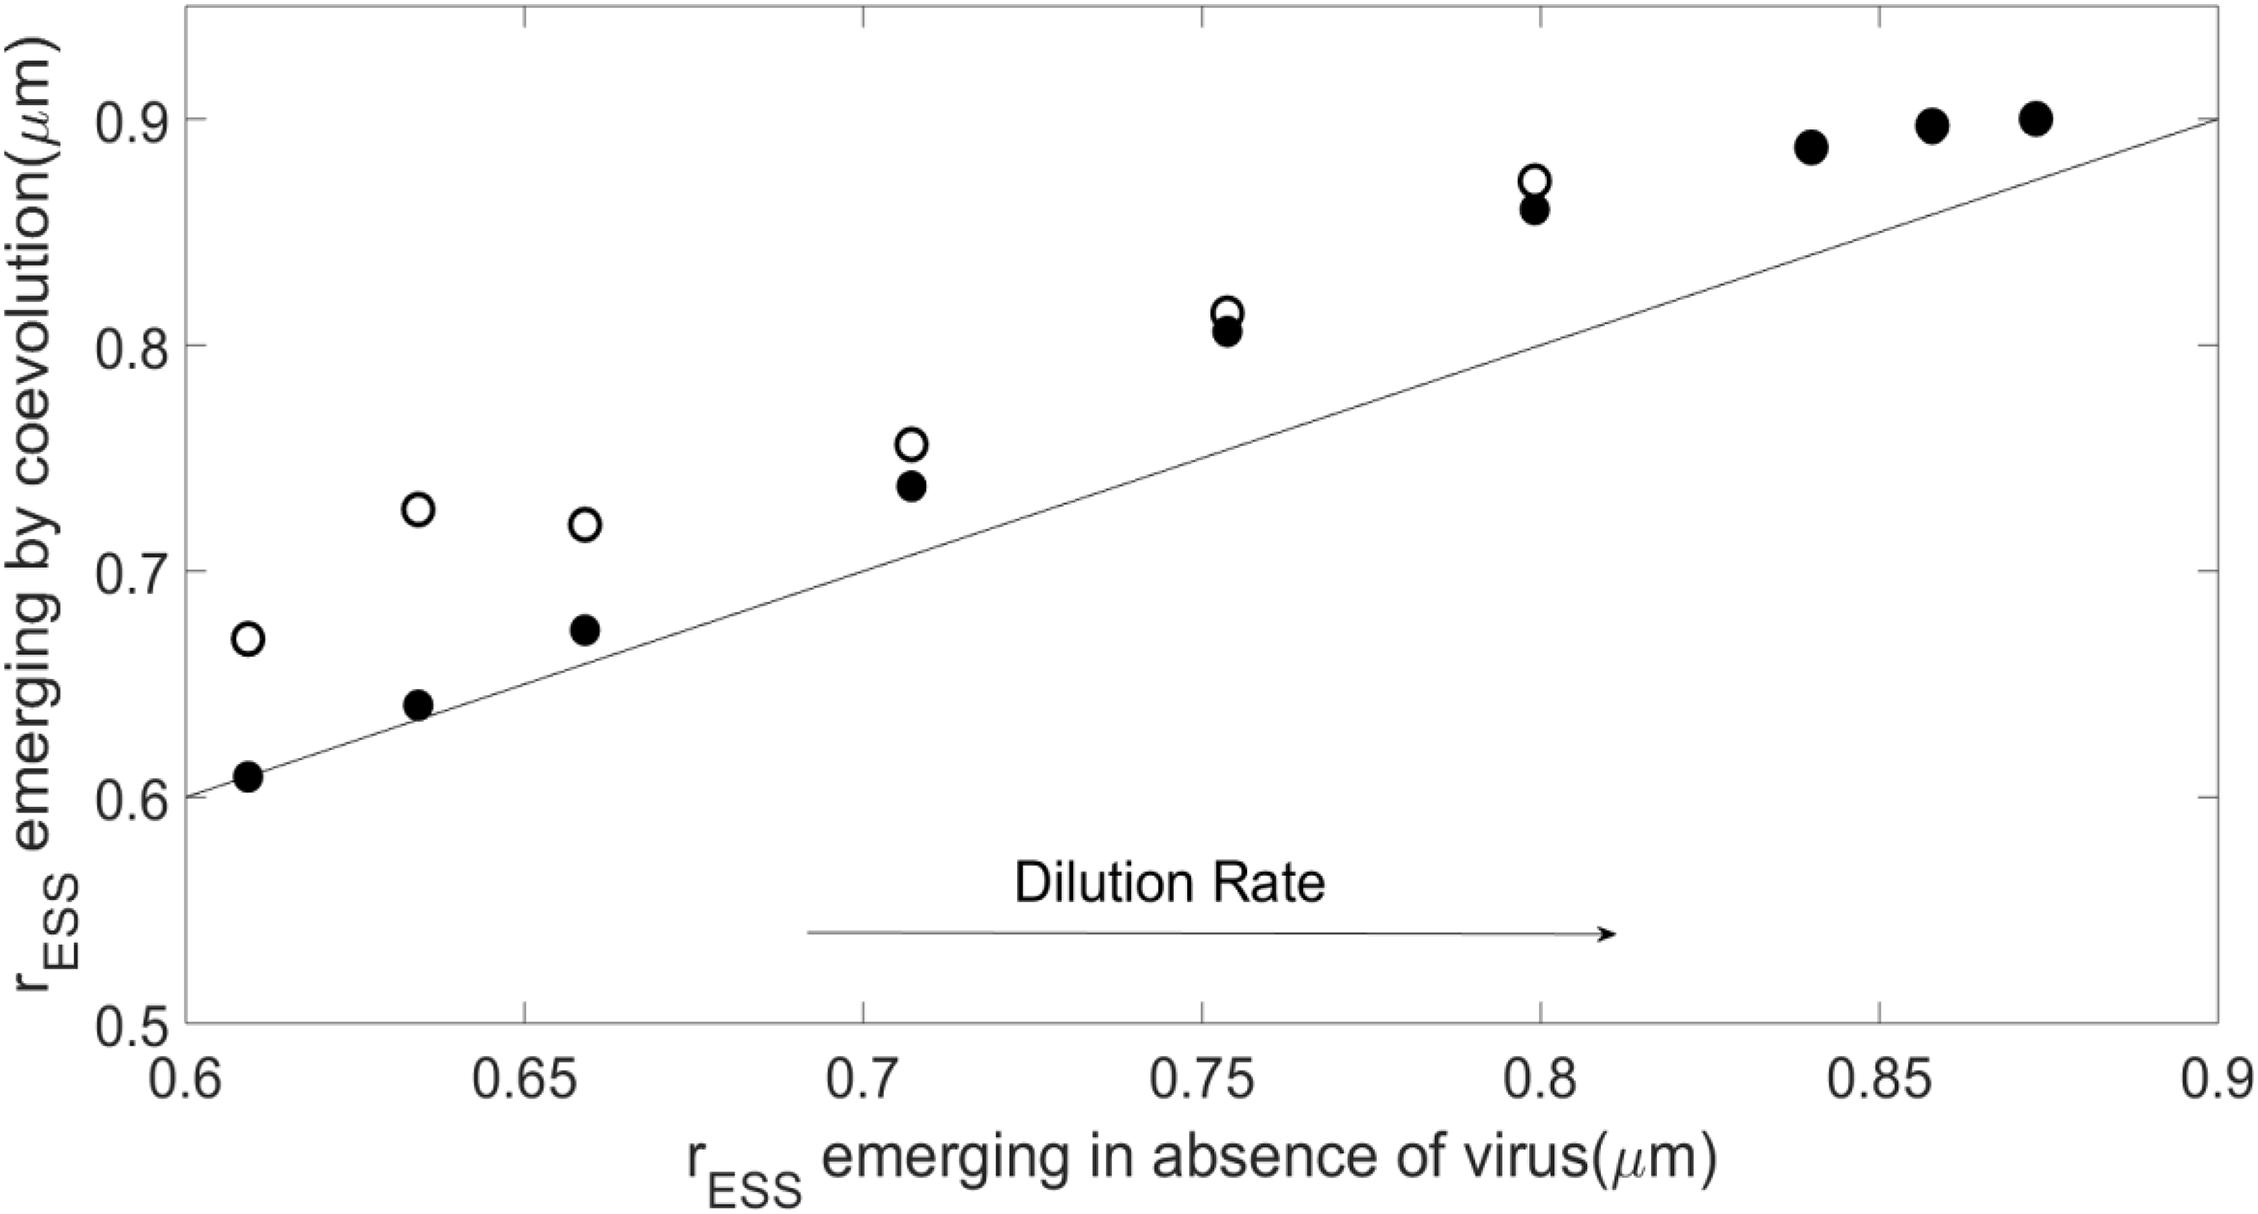
Figure 4. Evolutionary stable strategies (ESS) for the host obtained when it coevolves with the virus as compared with the host ESS in the absence of the virus for N0=10−5moll−1 and α=10−8lcell−1d−1, and different dilution rates. As in Figure 3, solid points represent the plastic case whereas empty points represent the non-plastic case, all above or on the 1:1 line.
As Figure 5 shows, coevolution leads to larger LESS than in the case of viral evolution with a fixed (i.e., non-evolving) host phenotype. This difference is more noticeable for the non-plastic case. Increasing the dilution rate (or strength of the crowding effect, see Supplementary Appendix B) reduces the difference between the with- and without-coevolution LESS for both plastic and non-plastic cases. In this regime the pattern actually inverts, the emergent latent period with coevolution becomes smaller than that with a non-evolving host, and the plastic case shows a LESS that is slightly larger than that of the non-plastic case.
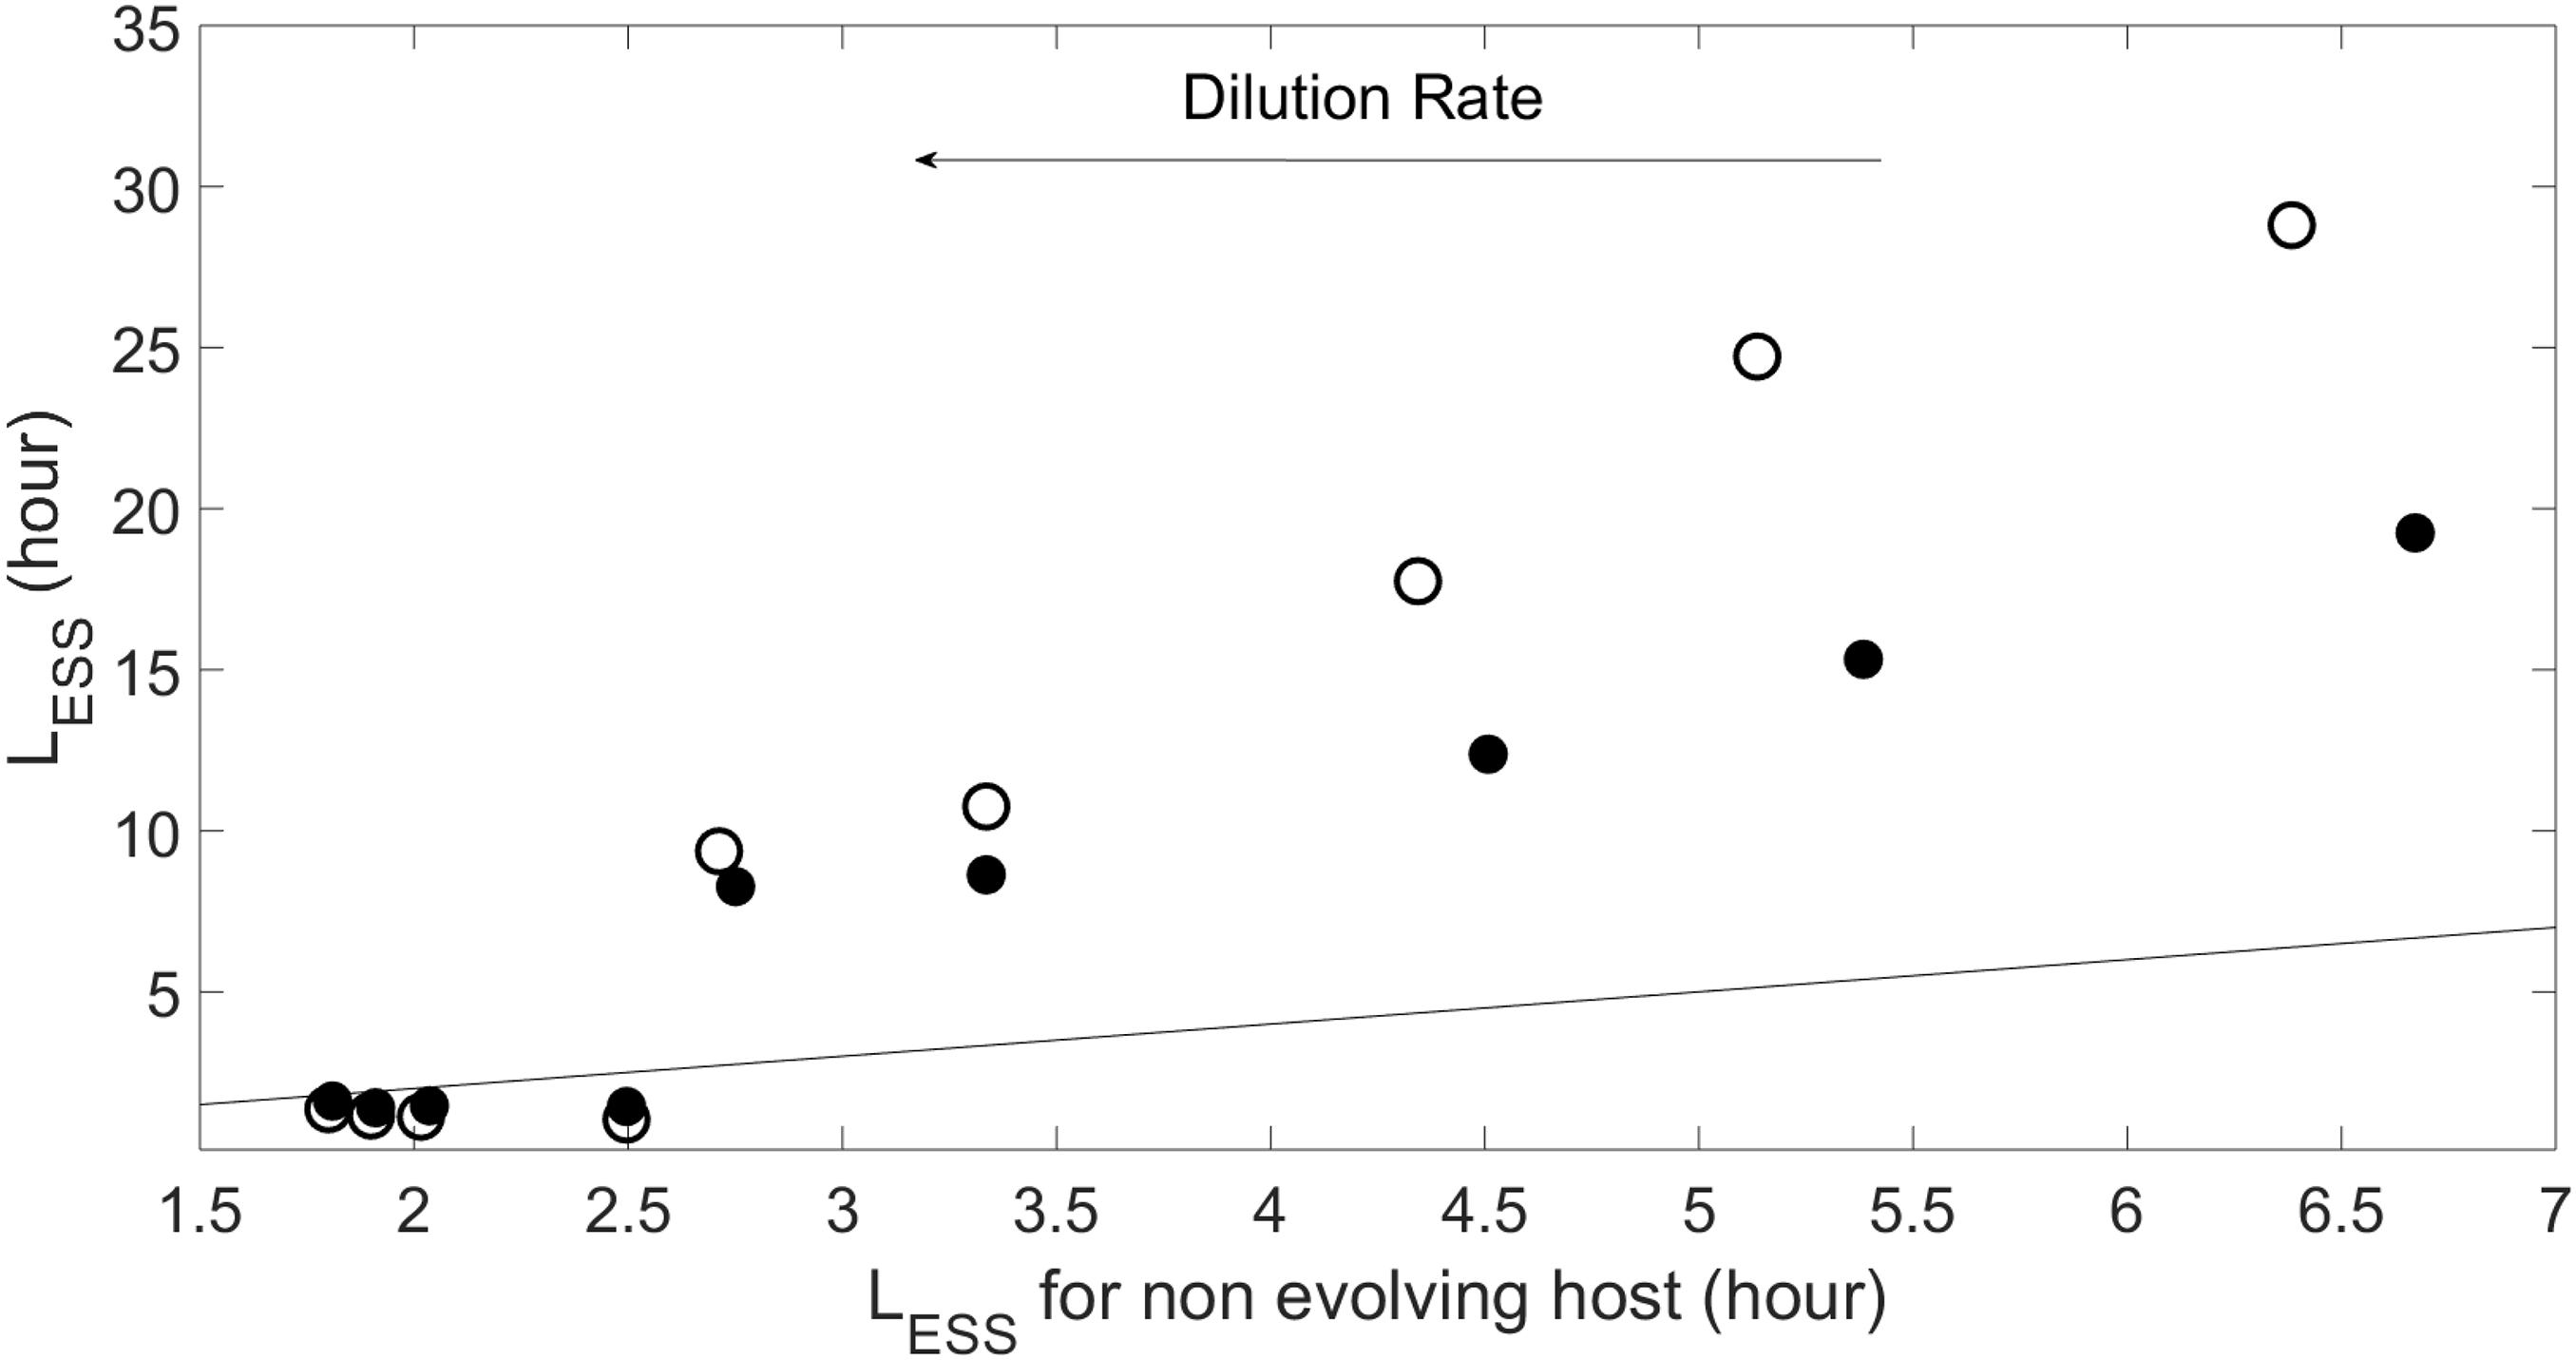
Figure 5. Evolutionary stable strategy (ESS) for the virus obtained when host evolves at N0=10−5moll−1 and α=10−8lcell−1d−1, and different dilution rates as compared to the viral ESS when the host does not evolve (i.e., L = 1/w + E). Symbols and line as in Figure 4.
Understanding the strategies that organisms use to survive under different ecological scenarios is key to understanding their role within their changeable ecosystem. Here, we studied the coevolution of a bacterial host and a phage. Viruses can impose a significant top-down pressure on their hosts, which may trigger different evolutionary responses in the latter. Our study can help understand which strategies are dominant for bacteria and viruses when coevolving under different scenarios, and the effect that viral plasticity (i.e., viral dependence on its host) has on these strategies. Typically, the virus drives the host to evolving defense mechanisms against phage infection, as repeatedly reported in the literature (Morgan and Koskella, 2011). In our case, the host evolves by changing its size, which has clear ecological implications: smaller hosts show a decreased rate of infection, but also a reduced maximal growth. The virus in turn can respond by adapting its infection time (i.e., latent period), which comes with the trade-off of either releasing fewer virions (shorter time) or losing opportunities of infection for its offspring (longer time).
In the absence of the virus, the emerging host strategy (rESS) shows smaller sizes in environments with lower nutrient concentration, which result from lower dilution rates. This evolutionary strategy resonates with the fact that smaller microbes are better competitors when nutrient is scarce, like is the case for smaller phytoplankton (e.g., cyanobacteria) in oligotrophic waters (Mena et al., 2019).
For a same environment (i.e., for a fixed w), the phage pressure maintains the bacterial population to a lower level than in the absence of virus. Consequently, fewer bacteria compete for the nutrient and thus the host population grows faster, which ultimately results in larger emergent sizes. A logical expectation would be for the host to show, in the presence of the virus, a smaller size than in its absence, to avoid viral infection. Instead, the observed increase in host size indicates that the increase in metabolic rate associated to the larger size compensates for being a larger target for viral adsorption. This strategy also benefits the virus as it increases adsorption, and the improved host physiological state reduces latent period and increases burst size. Because a fixed adsorption rate did not alter our results, we conclude that the evolution of host size influences viral evolution mostly by altering host quality and, indirectly, host availability.
Increasing the dilution rate leads to larger host sizes (and therefore higher host quality) but lower host densities (i.e., lower host availability), which reveals a host quality-quantity trade-off. In nutrient-poor environments, the associated increased availability of the host with small size, which leads to small growth rates, i.e., low quality, tends to increase the latent period; this contrasts with past theory predicting that high host cell density favors phage with short latent period (Abedon, 1989). Thus, as we observe a decrease in the latent period even when the host availability decreases, we hypothesize that the lower host availability is compensated by the higher host quality, which appears to be the dominant factor in the selection of the latent period. This resonates with claims about the importance of host quality in determining the length of latent period when host density is high (Wang et al., 1996). Surprisingly, this quality-driven phenomenology is also shown by the non-plastic case. The reason is that, in spite of the viral traits being independent of the host growth rate in this case, evolutionary changes in host size determine viral trait values through their dependence on the maximum growth rate (e.g., Eq. 11), i.e., the non-plastic virus can produce more virions in a shorter time when host size increases. An important difference, thus, is that the latter occurs as a result of evolution, whereas viral plasticity is an ecological process.
Unexpectedly, the emerging latent period in the plastic case is shorter than in the non-plastic case for most dilution rates, and longer only for very high values of w. This result is in contrast with the definition of non-plastic virus we used here, as the latter shows the latent period expected at maximum growth rate (by definition the smaller possible value for L). Supplementary Figure 1 also shows that the growth rates reached by the host with the non-plastic virus are larger than those reached in the presence of the plastic virus, which should lead to a shorter latent period. The fact that the eclipse period is, as expected attending to host growth rate, longer in the plastic case and the maturation rate smaller (Supplementary Figure 2) means that the plastic virus spends less time to assembling virions, and does so at a slower rate. We hypothesize that, because here the non-plastic virus shows fewer hosts but of higher quality than the plastic virus, the lower L value for the latter might result from the effect of host availability on the emerging latent period, compensating the effect of the smaller host growth rate. With an abundant host, the strategy of the plastic virus is to lyse hosts earlier even if the resulting burst size is smaller. On the other hand, the lower amount of available hosts and the roughly one-order-of-magnitude difference in burst size requires from the non-plastic virus a longer latent period, to avoid host “overexploitation” (i.e., a Tragedy of the Commons scenario in which the virus kills the host and hence itself).
When the dilution rate is high, the burst size and host availability for both cases equalize, the only determining factor is the difference between host maximum growth rate (for the non-plastic virus traits) and realized growth rate (for the plastic virus traits) and, as a consequence, the non-plastic virus shows a shorter latent period than the plastic one. The differences in L and B between plastic and non-plastic virus are, however, small because the host growth rate for the former is close to its maximum. The crowding effect is an additional factor that regulates the bacterial population. The decrease in population resulting from crowding actually allows the host to reach the highest size that maximizes its growth rate for lower dilution rates, which can again be due to the lower competition for nutrient (see above). For sufficiently high α, the bacterial population is entirely regulated by the crowding effect, which explains the similar emergent size in the presence or absence of the virus.
Finally, the virus adapts to the evolutionary response of the host showing a LESS larger than that obtained when the host does not evolve, for both plastic and non-plastic viruses. Therefore, we conclude that coevolution slows down viral infection, the more so for a non-plastic virus. This delay and differences between plastic and non-plastic cases are amplified in nutrient-poor environments (i.e., for small dilution rates), where the host grows far from its maximal rate and the importance of plasticity is more observable. Without further empirical information, however, we cannot hypothesize the mechanisms underlying these strategies.
Our framework has a few important limitations. Although coevolutionary branching is a possibility that has been observed in laboratory and natural populations (Koskella and Brockhurst, 2014), we focused here on situations in which a single, well-defined ESS emerging for each simulated environment (evidenced by the clustered points obtained from the different replicates, i.e., each cluster can be represented by a single, well-defined mean value). Diversification can occur, for example, when a mutant virus adsorbs to only a limited subset of the total bacteria, i.e., it is a specialist (Weitz et al., 2005). In our case, however, viral phenotypes are all generalists [i.e., any viral mutant can infect any of the host phenotypes, shown to happen during coevolution (Hall et al., 2011)]. Although this “global” competition for hosts prevents a complete niche separation among viruses, we cannot exclude the possibility of evolutionary branching occurring in some of the discarded (surviving) replicates. Further, we discarded simulations in which either host or virus populations collapsed. The reason is that those simulations did not represent examples of “evolutionary suicide” but rather resulted from initial conditions for the traits that were outside the expected coexistence region of the parameter space [see (Choua et al., 2020)], and where evolution and/or plasticity did not reach the coexistence region before extinction. As a final remark, note that we have explored the role of one single environmental factor at a time: dilution rate, and nutrient input concentration (see Supplementary Appendix). Realistic conditions susceptible to be studied with our framework, from gut microbiome to phytoplankton populations, will necessitate of the inclusion of several abiotic (e.g., different nutrients) and biotic factors (e.g., grazers) varying simultaneously (Weitz et al., 2015; Pourtois et al., 2020).
Although pathogens typically have detrimental effects on their hosts, in some cases the evolution of parasitic organisms may benefit the host by increasing host fitness (Morgan and Koskella, 2011). In our system, coevolution translates into the presence of virus fostering the emergence of larger host sizes that show larger growth potential, which is also beneficial for the virus as larger host growth rates improve also viral replication. We observe as a result an increased coexistence between host and phage. Our results, therefore, reveal an important aspect of the interaction between host and phage that should be considered when devising treatments to use phage against bacterial infections in either medical or environmental management contexts. This is especially relevant given the variability in host growth rate and sizes that is expected from bacterial infections, as well as the rapid evolutionary response that both bacteria and virus can show. Further, the predicted shift in host size due to the presence of the virus can have a cascading effect at larger scale in e.g., marine food webs. Cell size is a key trait for phytoplankton that influences the response of the lower trophic levels of the marine food web to climate change and carbon export to the deep ocean, among others (Finkel et al., 2009). Phytoplankton size, for example, influences mortality due to grazing, and therefore energy export to higher trophic levels. However, the dependence of phytoplankton maximum growth rate on cell size is non-monotonic, with smaller species following an increasing trend (qualitatively similar to that used here for E. coli) but larger species showing a negative correlation with cell size (Marañón et al., 2013). Our conclusions could therefore apply to species such as cyanobacteria and chlorophytes. Importantly, our theoretical framework is still applicable since the expectation is that similar dependence of viral performance on host physiology occur generically. Thus, our model could be easily modified to adapt it to other species and, ultimately, help to understand the processes involved in and determining the phytoplankton community structure, which in turn influences key biogeochemical cycles such as that of carbon, nitrogen, and phosphorus.
The code used to obtain the data supporting the conclusions of this article will be made available by the authors under request.
JAB and MH designed the research. MC conducted the research. MC and JAB wrote the manuscript with input from MH. All authors contributed to the article and approved the submitted version.
The authors declare that the research was conducted in the absence of any commercial or financial relationships that could be construed as a potential conflict of interest.
The authors would like to thank Douglas Speirs for helpful discussions in early stages of this project.
The Supplementary Material for this article can be found online at: https://www.frontiersin.org/articles/10.3389/fmicb.2021.637490/full#supplementary-material
Abedon, S. T. (1989). Selection for bacteriophage latent period length by bacterial density: a theoretical examination. Microb. Ecol. 18, 79–88. doi: 10.1007/bf02030117
Abedon, S. T., Herschler, T. D., and Stopar, D. (2001). Bacteriophage latent-period evolution as a response to resource availability. Appl. Environ. Microbiol. 67, 4233–4241. doi: 10.1128/AEM.67.9.4233-4241.2001
Abedon, S. T., Hyman, P., and Thomas, C. (2003). Experimental examination of bacteriophage latent-period evolution as a response to bacterial availability. Appl. Environ. Microbiol. 69, 7499–7506. doi: 10.1128/aem.69.12.7499-7506.2003
Berg, H. C., and Purcell, E. M. (1977). Physics of chemoreception. Biophys. J. 20, 193–219. doi: 10.1016/S0006-3495(77)85544-6
Birch, E. W., Ruggero, N. A., and Covert, M. W. (2012). Determining host metabolic limitations on viral replication via integrated modeling and experimental perturbation. PLoS Comput. Biol. 8:e1002746. doi: 10.1371/journal.pcbi.1002746
Bonachela, J. A., and Levin, S. A. (2014). Evolutionary comparison between viral lysis rate and latent period. J. Theor. Biol. 345, 32–42. doi: 10.1016/j.jtbi.2013.12.006
Bremer, H., and Dennis, P. P. (2008). Modulation of chemical composition and other parameters of the cell at different exponential growth rates. EcoSal Plus 2008:1128. doi: 10.1128/Ecosal.5.2.3
Brown, J. H., Gillooly, J. F., Allen, A. P., Savage, V. M., and West, G. B. (2004). Toward a metabolic theory of ecology. Ecology 85, 1771–1789. doi: 10.1890/03-9000
Chien, A.-C., Hill, N. S., and Levin, P. A. (2012). Cell size control in bacteria. Curr. Biol. 22, R340–R349. doi: 10.1016/j.cub.2012.02.032
Choua, M., and Bonachela, J. A. (2019). Ecological and evolutionary consequences of viral plasticity. Am. Natural. 193, 346–358. doi: 10.1086/701668
Choua, M., Heath, M. R., Speirs, D. C., and Bonachela, J. A. (2020). The effect of viral plasticity on the persistence of host-virus systems. J. Theoret. Biol. 498:110263. doi: 10.1016/j.jtbi.2020.110263
De Paepe, M., and Taddei, F. (2006). Viruses’ life history: towards a mechanistic basis of a trade-off between survival and reproduction among phages. PLoS Biol. 4:e193. doi: 10.1371/journal.pbio.0040193
Delbrück, M. (1940). Adsoprtion of bacteriophage under various physiological conditions of the host. J. Gen. Physiol. 23, 631–642. doi: 10.1085/jgp.23.5.631
Edwards, K. F., and Steward, G. F. (2018). Host traits drive viral life histories across phytoplankton viruses. Am. Natural. 191, 566–581. doi: 10.1086/696849
Finkel, Z. V., Beardall, J., Flynn, K. J., Antonietta, Q. T., Rees, A. V., and Raven, J. A. (2009). Phytoplankton in a changing world: cell size and elemental stoichiometry. J. Plank. Res. 32, 119–137. doi: 10.1093/plankt/fbp098
Füchslin, H. P., Schneider, C., and Egli, T. (2012). In glucose-limited continuous culture the minimum substrate concentration for growth, s(min), is crucial in the competition between the enterobacterium Escherichia coli and Chelatobacter heintzii, an environmentally abundant bacterium. ISME J. 6, 777–789. doi: 10.1038/ismej.2011.143
Gallet, R., Violle, C., Fromin, N., Jabbour-Zahab, R., Enquist, B. J., and Lenormand, T. (2017). The evolution of bacterial cell size: the internal diffusion-constraint hypothesis. ISME J. 11, 1559–1568. doi: 10.1038/ismej.2017.35
Gnezda-Meijer, K., Mahne, I., Poljsak-Prijatelj, M., and Stopar, D. (2006). Host physiological status determines phage-like particle distribution in the lysate. FEMS Microb. Ecol. 55, 136–145. doi: 10.1111/j.1574-6941.2005.00008.x
Golec, P., Karczewska-Golec, J., Łoś, M., and Wȩgrzyn, G. (2014). Bacteriophage T4 can produce progeny virions in extremely slowly growing Escherichia coli host: comparison of a mathematical model with the experimental data. FEMS Microbiol. Lett. 351, 156–161. doi: 10.1111/1574-6968.12372
Hall, A. R., Scanlan, P. D., and Buckling, A. (2011). Bacteria-phage coevolution and the emergence of generalist pathogens. Am. Natural. 177, 44–53. doi: 10.1086/657441
Koskella, B., and Brockhurst, M. A. (2014). Bacteria-phage coevolution as a driver of ecological and evolutionary processes in microbial communities. FEMS Microbiol. Rev. 38, 916–931. doi: 10.1111/1574-6976.12072
Levin, B. R., Stewart, F. M., and Chao, L. (1977). Resource-limited growth, competition, and predation: a model and experimental studies with bacteria and bacteriophage. Am. Natural. 111, 3–24. doi: 10.1086/283134
Litchman, E., Klausmeier, C. A., Schofield, O. M., and Falkowski, P. G. (2007). The role of functional traits and trade-offs in structuring phytoplankton communities: scaling from cellular to ecosystem level. Ecol. Lett. 10, 1170–1181. doi: 10.1111/j.1461-0248.2007.01117.x
Loferer-Krößbacher, M., Klima, J., and Psenner, R. (1998). Determination of bacterial cell dry mass by transmission electron microscopy and densitometric image analysis. Appl. Environ. Microbiol. 64, 688–694. doi: 10.1128/aem.64.2.688-694.1998
Marañón, E., Cermeño, P., López-Sandoval, D. C., Rodríguez-Ramos, T., Sobrino, C., Huete-Ortega, M., et al. (2013). Unimodal size scaling of phytoplankton growth and the size dependence of nutrient uptake and use. Ecol. Lett. 16, 371–379. doi: 10.1111/ele.12052
Mena, C., Reglero, P., Hidalgo, M., Sintes, E., Santiago, R., Martín, M., et al. (2019). Phytoplankton community structure is driven by stratification in the oligotrophic Mediterranean Sea. Front. Microbiol. 10:1698. doi: 10.3389/fmicb.2019.01698
Menge, D. N., and Weitz, J. S. (2009). Dangerous nutrients: evolution of phytoplankton resource uptake subject to virus attack. J. Theor. Biol. 257, 104–115. doi: 10.1016/j.jtbi.2008.10.032
Monod, J. (1949). The growth of bacterial cultures. Annu. Rev. Microbiol. 3, 371–394. doi: 10.1146/annurev.mi.03.100149.002103
Morgan, A. D., and Koskella, B. (2011). “6 – Coevolution of host and pathogen,” in Genetics and Evolution of Infectious Disease, ed. M. Tibayrenc (London: Elsevier), 147–171.
Nikaido, H., and Vaara, M. (1985). Molecular basis of bacterial outer membrane permeability. Microbiol. Rev. 49, 1–32. doi: 10.1128/mmbr.49.1.1-32.1985
Pourtois, J., Tarnita, C., and Bonachela, J. A. (2020). Impact of lytic phages on phosphorus- versus nitrogen-limited marine microbes. Front. Microbiol. 11:221.
Rabinovitch, A., Fishov, I., Hadas, H., Einav, M., and Zaritsky, A. (2002). Bacteriophage T4 development in Escherichia coli is growth rate dependent. J. Theor. Biol. 216, 1–4. doi: 10.1006/jtbi.2002.2543
Rabinovitch, A., Hadas, H., Einav, M., Melamed, Z., and Zaritsky, A. (1999). Model for bacteriophage T4 development in Escherichia coli. J. Bacteriol. 181, 1677–1683.
Ramanculov, E., and Young, R. (2001). Genetic analysis of the T4 holin: timing and topology. Gene 265, 25–36. doi: 10.1016/s0378-1119(01)00365-1
Schulze, K. L., and Lipe, R. S. (1964). Relationship between substrate concentration, growth rate, and respiration rate of Escherichia coli in continuous culture. Archiv. Mikrobiol. 48, 1–20. doi: 10.1007/bf00406595
Schwartz, M. (1976). The adsorption of coliphage lambda to its host: effect of variations in the surface density of receptor and in phage-receptor affinity. J. Mol. Biol. 103, 521–536. doi: 10.1016/0022-2836(76)90215-1
Shestopaloff, Y. K. (2016). Interspecific allometric scaling of unicellular organisms as an evolutionary process of food chain creation. arXiv [Preprint]. arXiv:1611.09824.
Thyrhaug, R., Larsen, A., Thingstad, T. F., and Bratbak, G. (2003). Stable coexistence in marine algal host-virus systems. Mar. Ecol. Progr. Ser. 254:25451.
Wang, I.-N. (2006). Lysis timing and bacteriophage fitness. Genetics 172, 17–26. doi: 10.1534/genetics.105.045922
Wang, I.-N., Dykhuizen, D., and Slobodkin, L. (1996). The evolution of phage lysis timing. Evolut. Ecol. 10, 545–558. doi: 10.1007/BF01237884
Wang, I.-N., Smith, D. L., and Young, R. (2000). Holins: the protein clocks of bacteriophage infections. Annu. Rev. Microbiol. 54, 799–825. doi: 10.1146/annurev.micro.54.1.799
Wang, Z., and Goldenfeld, N. (2010). Fixed points and limit cycles in the population dynamics of lysogenic viruses and their hosts. Phys. Rev. E Statist. Nonlin. Soft Matter Phys. 82(1 Pt 1):011918. doi: 10.1103/physreve.82.011918
Ward, B. A., Marañón, E., Sauterey, B., Rault, J., and Claessen, D. (2017). The size dependence of phytoplankton growth rates: a trade-off between nutrient uptake and metabolism. Am. Natural. 189, 170–177. doi: 10.1086/689992
Weitz, J. S., and Dushoff, J. (2008). Alternative stable states in host–phage dynamics. Theoret. Ecol. 1, 13–19. doi: 10.1007/s12080-007-0001-1
Weitz, J. S., Hartman, H., and Levin, S. A. (2005). Coevolutionary arms races between bacteria and bacteriophage. Proc. Natl. Acad. Sci. U.S.A. 102, 9535–9540. doi: 10.1073/pnas.0504062102
Weitz, J. S., Stock, C. A., Wilhelm, S. W., Bourouiba, L., Coleman, M. L., Buchan, A., et al. (2015). A multitrophic model to quantify the effects of marine viruses on microbial food webs and ecosystem processes. ISME J. 9, 1352–1364. doi: 10.1038/ismej.2014.220
White, R., Chiba, S., Pang, T., Dewey, J. S., Savva, C. G., Holzenburg, A., et al. (2011). Holin triggering in real time. Proc. Natl. Acad. Sci. U.S.A. 108:798. doi: 10.1073/pnas.1011921108
Wirtz, K. W. (2002). A generic model for changes in microbial kinetic coefficients. J. Biotechnol. 97, 147–162. doi: 10.1016/s0168-1656(02)00064-0
You, L., Suthers, P., and Yin, J. (2002). Effects of Escherichia coli physiology on growth of phage T7 in vivo and in silico. J. Bacteriol. 184, 1888–1894. doi: 10.1128/jb.184.7.1888-1894.2002
Keywords: phage (bacteriophage), virus modeling, lysis, viral latency, E. coli, T phage, host-virus interactions
Citation: Choua M, Heath MR and Bonachela JA (2021) Evolutionarily Stable Coevolution Between a Plastic Lytic Virus and Its Microbial Host. Front. Microbiol. 12:637490. doi: 10.3389/fmicb.2021.637490
Received: 03 December 2020; Accepted: 09 April 2021;
Published: 20 May 2021.
Edited by:
Xuesong He, The Forsyth Institute, United StatesReviewed by:
Pradeep Ram Angia Sriram, UMR 6023 Laboratoire Microorganismes Génome Et Environnement (LMGE), FranceCopyright © 2021 Choua, Heath and Bonachela. This is an open-access article distributed under the terms of the Creative Commons Attribution License (CC BY). The use, distribution or reproduction in other forums is permitted, provided the original author(s) and the copyright owner(s) are credited and that the original publication in this journal is cited, in accordance with accepted academic practice. No use, distribution or reproduction is permitted which does not comply with these terms.
*Correspondence: Juan A. Bonachela, anVhbi5ib25hY2hlbGFAcnV0Z2Vycy5lZHU=
Disclaimer: All claims expressed in this article are solely those of the authors and do not necessarily represent those of their affiliated organizations, or those of the publisher, the editors and the reviewers. Any product that may be evaluated in this article or claim that may be made by its manufacturer is not guaranteed or endorsed by the publisher.
Research integrity at Frontiers
Learn more about the work of our research integrity team to safeguard the quality of each article we publish.